Release – Euroseas Ltd. Announces Agreement to Acquire a 6350 teu Container Vessel


Euroseas Ltd. Announces Agreement to Acquire a 6,350 teu Container Vessel, built in 2005 and Agreement to Enter into a Three-year Charter for the Vessel


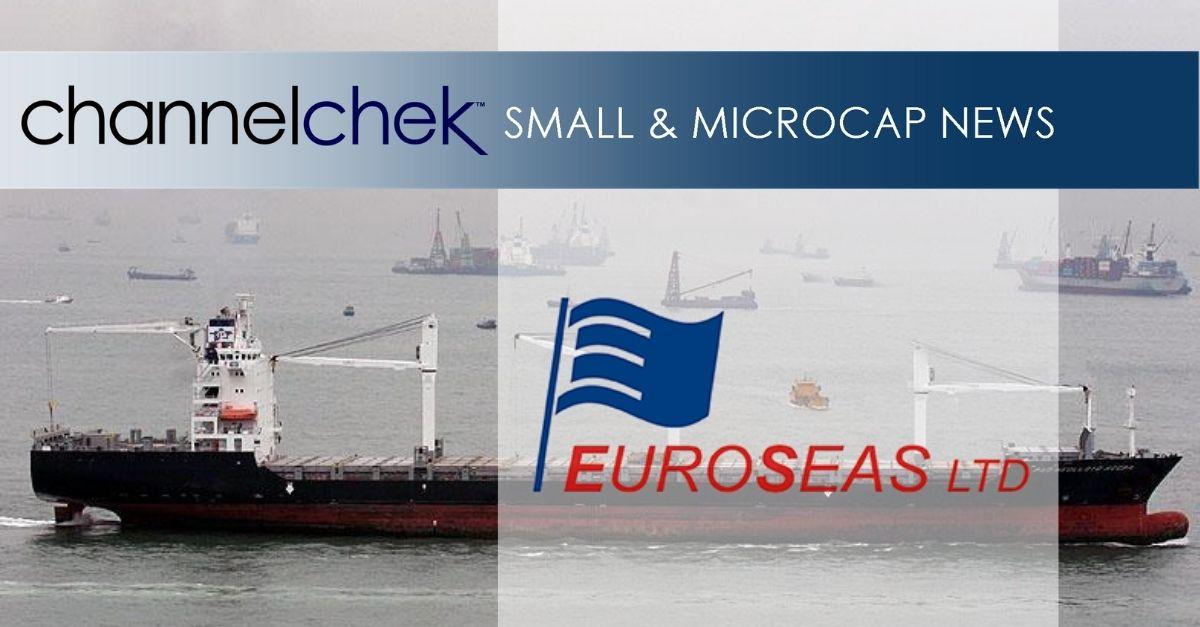
ATHENS, Greece, Nov. 11, 2021 (GLOBE NEWSWIRE) — Euroseas Ltd. (NASDAQ: ESEA, the “Company” or “Euroseas”), an owner and operator of container carrier vessels and provider of seaborne transportation for containerized cargoes, announced today that it has agreed to acquire M/V Leo Paramount, a 6,350 teu container vessel built in 2005, for $40 million. The vessel, which is expected to be delivered to the Company within 2021 and be renamed M/V Marcos V, will be financed by own funds and a bank loan. Contemporaneously with the acquisition, the vessel will enter into a three-year time charter contract at a daily rate of $42,200 with a possible extension for an additional (fourth) year at the option of the charterer at $15,000 per day.

Aristides Pittas, Chairman and CEO of Euroseas commented:
“We are pleased to announce the acquisition of M/V Leo Paramount, an intermediate containership, built in 2005. This acquisition continues our strategy of carefully constructed transactions minimizing the market risk by reducing, by the end of the charter, the cost basis to around its scrap value. The charter contract we have entered into with a first class charterer is expected to contribute about $35 million of EBITDA during the first three years of the contract providing us with a significant return on our investment. Furthermore, depending on the market after the end of the charter in three or four years we may have significant additional upside.

“With a fleet of sixteen feeder and intermediate containerships on the water, after the delivery of the above vessel, and two modern feeder newbuildings expected to be delivered in the first half of 2023, Euroseas reinforces its position as the main US publicly listed company focusing on feeder and intermediate container vessels. We believe, our growing presence in the sector and the public markets provides with a solid platform to consolidate in it other vessels or fleets.”

Fleet Profile:

After the delivery of M/V Piraeus Trader to its fleet, the Euroseas Ltd. fleet profile will be as follows:

Name Type Dwt TEU Year
Built
Employment(*)

TCE Rate ($/day)
Container Carriers            
LEO PARAMOUNT (to be renamed MARCOS V) Intermediate 72,968 6,350 2005 TC until Dec-24
plus 12 months option
$42,200
option $15,000
AKINADA BRIDGE(*) Intermediate 71,366 5,610 2001 TC until Oct-22 $20,000
SYNERGY BUSAN(*) Intermediate 50,726 4,253 2009 TC until Aug-24 $25,000
SYNERGY ANTWERP(*) Intermediate 50,726 4,253 2008 TC until Sep-23 $18,000
SYNERGY OAKLAND(+) Intermediate 50,787 4,253 2009 TC until Jan-22 $202,000
SYNERGY KEELUNG(+) Intermediate 50,969 4,253 2009 TC until Jun-22 plus 8- 12 months option $11,750
option $14,500
EM KEA(*) Feeder 42,165 3,100 2007 TC until May-23 $22,000
EM ASTORIA(+) Feeder 35,600 2,788 2004 TC until Feb-22 $18,650
EVRIDIKI G(+) Feeder 34,677 2,556 2001 TC until Jan-22 $15,500
EM CORFU(+) Feeder 34,654 2,556 2001 TC until Nov-21
Then repositioning trip to drydock
$10,200
$5,125 for up to 37 days ($35,000 if more than 37 days)
DIAMANTIS P(*) Feeder 30,360 2,008 1998 TC until Oct-24 $27,000
EM SPETSES(*) Feeder 23,224 1,740 2007 TC until Aug-24 $29,500
JONATHAN P(*) Feeder 23,357 1,740 2006 TC until Oct-24 $26,662(***)
EM HYDRA(*) Feeder 23,351 1,740 2005 TC until Apr-23 $20,000
JOANNA(*) Feeder 22,301 1,732 1999 TC until Oct-22 $16,800
AEGEAN EXPRESS(*) Feeder 18,581 1,439 1997 TC until Mar-22 $11,500


Total Container Carriers on the Water
16 635,812 50,371      
         
Vessels under construction Type Dwt TEU To be delivered
H4201 Feeder 37,237 2,800 Q1 2023
H4202 Feeder 37,237 2,800 Q2 2023

Note:  
(*)  TC denotes time charter. Charter duration indicates the earliest redelivery date; All dates listed are the earliest redelivery dates under each TC unless the contract rate is lower than the current market rate in which cases the latest redelivery date is assumed; vessels with the latest redelivery date shown are marked by (+).
(**)  The CONTEX (Container Ship Time Charter Assessment Index) has been published by the Hamburg and Bremen Shipbrokers’ Association (VHBS) since October 2007. The CONTEX is a company-independent index of time charter rates for container ships. It is based on assessments of the current day charter rates of six selected container ship types, which are representative of their size categories: Type 1,100 TEU and Type 1,700 TEU with a charter period of one year, and the Types 2,500, 2,700, 3,500 and 4,250 TEU all with a charter period of two years.
(***)   Rate is net of commissions (which are typically 5-6.25%)

About Euroseas Ltd.
Euroseas Ltd. was formed on May 5, 2005 under the laws of the Republic of the Marshall Islands to consolidate the ship owning interests of the Pittas family of Athens, Greece, which has been in the shipping business over the past 140 years. Euroseas trades on the NASDAQ Capital Market under the ticker ESEA. 

Euroseas operates in the container shipping market. Euroseas’ operations are managed by Eurobulk Ltd., an ISO 9001:2008 and ISO 14001:2004 certified affiliated ship management company, which is responsible for the day-to-day commercial and technical management and operations of the vessels. Euroseas employs its vessels on spot and period charters and through pool arrangements. 

After the delivery of M/V Leo Paramount, the Company will have a fleet of 16 vessels comprising of 10 Feeder and 6 Intermediate containerships. Euroseas 16 containerships have a cargo capacity of 50,371 teu. Furthermore, after the delivery of two feeder containership newbuildings in the first half of 2023, Euroseas’ fleet will consist of 18 vessels with a total carrying capacity of 55,971 teu.

Forward Looking Statement
This press release contains forward-looking statements (as defined in Section 27A of the Securities Act of 1933, as amended, and Section 21E of the Securities Exchange Act of 1934, as amended) concerning future events and the Company’s growth strategy and measures to implement such strategy; including expected vessel acquisitions and entering into further time charters. Words such as “expects,” “intends,” “plans,” “believes,” “anticipates,” “hopes,” “estimates,” and variations of such words and similar expressions are intended to identify forward-looking statements. Although the Company believes that the expectations reflected in such forward-looking statements are reasonable, no assurance can be given that such expectations will prove to have been correct. These statements involve known and unknown risks and are based upon a number of assumptions and estimates that are inherently subject to significant uncertainties and contingencies, many of which are beyond the control of the Company. Actual results may differ materially from those expressed or implied by such forward-looking statements. Factors that could cause actual results to differ materially include, but are not limited to changes in the demand for containerships, competitive factors in the market in which the Company operates; risks associated with operations outside the United States; and other factors listed from time to time in the Company’s filings with the Securities and Exchange Commission. The Company expressly disclaims any obligations or undertaking to release publicly any updates or revisions to any forward-looking statements contained herein to reflect any change in the Company’s expectations with respect thereto or any change in events, conditions or circumstances on which any statement is based. 

Visit our website www.euroseas.gr

Company Contact Investor Relations / Financial Media
Tasos Aslidis
Chief Financial Officer
Euroseas Ltd.
11 Canterbury Lane,
Watchung, NJ 07069
Tel. (908) 301-9091
E-mail: aha@euroseas.gr
Nicolas Bornozis
President
Capital Link, Inc.
230 Park Avenue, Suite 1536
New York, NY 10169
Tel. (212) 661-7566
E-mail: nbornozis@capitallink.com

Release – Ceapro Inc. Provides Update on Development of an Inhalable Therapeutic Using Yeast Beta Glucan


Ceapro Inc. Provides Update on Development of an Inhalable Therapeutic Using Yeast Beta Glucan Processed with Pressurized Gas eXpanded Technology (PGX-YBG)


McMaster’s research team discovers new mechanism of action for PGX-YBG

PGX-YBG demonstrates ability to reprogram macrophages on its own

PGX-YBG may be a suitable therapeutic solution for patients with fibrotic lung disease and late stage COVID-19 patients

EDMONTON, Alberta, Nov. 11, 2021 (GLOBE NEWSWIRE) — Ceapro Inc. (TSX-V: CZO; OTCQX: CRPOF) (“Ceapro” or the “Company”), a growth-stage biotechnology company focused on the development and commercialization of active ingredients for healthcare and cosmetic industries, today provided an update on its ongoing collaboration with McMaster University to develop an inhalable therapeutic for COVID-19 which could also be used to treat post-COVID-19 conditions.

The project, entitled “PGX-processed yeast beta-glucans as an inhalable immunomodulating therapeutic for COVID-19 patients,” jointly funded by Mitacs and Ceapro, is being conducted under the leadership of Dr. Kjetil Ask, a pulmonary fibrosis expert, and Dr. Todd Hoare from departments of Medicine and Chemical Engineering, respectively, at McMaster University.

This project was initiated in August 2019 when McMaster University and Ceapro researchers were reviewing preliminary data collected as part of a collaborative research program where one of the goals was to develop delivery systems to optimize drug formulations used for chronic diseases such as Idiopathic Pulmonary Fibrosis (IPF). While yeast beta glucan appeared to be a promising compound, researchers thought that the ideal formulation to treat fibrotic lung disorders would be to develop an inhalable complex produced by loading a drug onto PGX-processed yeast beta glucan (PGX-YBG). Following preliminary experiments with PGX-YBG alone and/or combined with a drug they realized that PGX-YBG could be much more than a carrier and that it could be used as the active component in a new antifibrotic treatment for the most severe lung diseases including COVID-19 patients.

“We have shown that the PGX technology can convert materials that can’t easily be inhaled, in particular, a YBG-based particle that has inherent immunomodulatory properties, into materials that can readily access the lung,” commented Dr. Hoare. “Combining this property with the very high internal surface area of the PGX-processed microparticles that enables high-concentration drug loading using Ceapro’s supercritical drug impregnation process, we are very excited about the potential of this technology for treating diseases of the lung, including potentially late-stage COVID-19.”

The team has successfully demonstrated that Ceapro’s PGX technology can produce low density, highly porous, and purified YBG microparticles with a small and uniform size distribution. These unique particles were found to possess improved aerodynamic properties, allowing them to be inhaled and deposited in the deep lung where fibrotic development occurs.

At the heart of this project is fibrosis: the unregulated and excessive production of scar tissue in organs. Key immune cells called macrophages apparently play a crucial role in maintaining and progressing the fibrotic state. “M1” macrophages express pro-inflammatory properties and “M2” macrophages express the complete opposite anti-inflammatory properties. During fibrosis, M2-like macrophages persist in the fibrotic lung and secrete cytokines (cell signaling molecules) that stimulate the cells around them to constantly produce and deposit scar tissue in the deep lung. These recent findings indicate that PGX-YBG, which binds specifically to Dectin-1 receptors at the surface of macrophages, can repolarize or “reprogram” M2-like macrophages into M1-like macrophages thereby putting an end to tissue deposition (fibrosis) and initiating the much-needed removal of excess tissues.

“We have shown, in vitro, that PGX-YBG have the ability to prevent the activation of macrophages toward a pro-fibrotic phenotype. In addition, PGX-YBG treatment to macrophages that have already acquired a pro-fibrotic phenotype result in the reprogramming of the macrophages toward a classical phenotype not known to be pro-fibrotic. Using cells from animals lacking the beta-glucan receptor Dectin-1, we showed that this was dependent on the presence of the Dectin-1 receptor. These findings are very exciting as macrophage reprogramming is seen as a viable therapeutic strategy toward fibrotic disease and PGX-YBG seem to have this ability. In vivo, we have shown that PGX-YBG can be safely administered to mice, and preliminary data shows an ability to prevent fibrogenesis in an experimental model of lung fibrosis. We are looking forward to validating these in vivo findings over the next few months,” reported Dr. Ask.

To advance this promising technology to human clinical trials, the Company is working to ensure that the delivery of PGX-YBG to the lung is optimized. It will also be important to further validate PGX-YBG’s performance for reducing lung fibrosis, both alone and loaded with an anti-inflammatory drug currently used for lung fibrosis and COVID-19 therapy. The potential impact of this project is considerable since, one of the most common and deadly fibrotic diseases is IPF for which there are no cure and a short (3-5 year) survival rate. It was recently also shown that lung fibrosis can occur and persists for months in some COVID-19 patients thereby suggesting that COVID-19 survivors may suffer from post-infection pulmonary fibrosis complications.

“We are very pleased with the progress made in this research project. Considering these recent, exciting findings, we believe it certainly becomes necessary to conduct additional animal studies before initiating human trials to develop the best possible tool in the fight against lung fibrotic diseases including COVID-19 and post COVID-19 complications,” commented Gilles Gagnon, M.Sc., MBA, President and CEO of Ceapro. “We are thankful for the collaborative work with the team at McMaster University and look forward to further development.”

About Ceapro Inc.

Ceapro Inc. is a Canadian biotechnology company involved in the development of proprietary extraction technology and the application of this technology to the production of extracts and “active ingredients” from oats and other renewable plant resources. Ceapro adds further value to its extracts by supporting their use in cosmeceutical, nutraceutical, and therapeutics products for humans and animals. The Company has a broad range of expertise in natural product chemistry, microbiology, biochemistry, immunology and process engineering. These skills merge in the fields of active ingredients, biopharmaceuticals and drug-delivery solutions. For more information on Ceapro, please visit the Company’s website at www.ceapro.com.

For more information contact:

Jenene Thomas
JTC Team, LLC
Investor Relations and Corporate Communications Advisor
T (US): +1 (833) 475-8247
E: czo@jtcir.com

Source: Ceapro Inc.

Release – TherapeuticsMD Announces Third Quarter 2021 Financial Results


TherapeuticsMD Announces Third Quarter 2021 Financial Results


– Quarterly total net product revenue of 
$24.5 million, an increase of 41.1% over Q3 2020 –

– ANNOVERA® TRx of 8,351, an increase of 62.7% over Q3 2020 –

– Cost savings initiative to reduce SG&A by 
$40 million in 2022; anticipated additional savings of approximately 
$20 million annualized tied to the divestiture of vitaCare –

– Hugh O’Dowd, President, to become Chief Executive Officer;  Robert Finizio appointed Vice Chair of the Board –

– Conference call scheduled for 
8:30 a.m. ET today –

BOCA RATON, Fla.–(BUSINESS WIRE)–Nov. 11, 2021– 
TherapeuticsMD, Inc. (“TXMD” or the “Company”) (NASDAQ: TXMD), an innovative, leading women’s healthcare company, today reported financial results for the third quarter ended 
September 30, 2021. In addition, today the Company announced a significant cost savings initiative designed to reduce its annual costs in 2022 by at least 
$40 million. This figure does not include savings from, or the costs associated with, the divestiture of vitaCare, which are estimated at approximately 
$20 million annually.

“We have made significant changes to our business strategy, which we believe will help us achieve our goal of EBITDA breakeven in the second half of 2022. Specifically, we put a cost savings plan in place and we have implemented a more concerted focus on healthcare professionals. These refinements are already yielding results, as evidenced by the steady progress made during the third quarter, notably the strong year-over-year growth in ANNOVERA prescriptions,” said Hugh O’Dowd, President of 
TherapeuticsMD.

“I would like to thank Rob for his leadership and vision in creating an innovative healthcare company with products that benefit women across their lifecycles. I would also like to formally welcome  Mark Glickman as our Chief Commercial Officer. His commercial acumen is already having a positive impact on our day-to-day operations. Looking ahead, I am confident that we can reduce our annual expenses significantly, deliver value to shareholders, and most importantly, bring our high-quality products to the women who need them,” concluded O’Dowd.

Third Quarter 2021 Financial Results and Business Highlights

Net Product Revenue (in thousands)


Three Months Ended


September 30,


2021


2020


Product revenue:


ANNOVERA


$

11,807


$

6,419


IMVEXXY


8,016


6,841


BIJUVA


3,298


1,646


Prescription vitamin


1,348


2,436


Product revenue, net


24,469


17,342


License revenue


937


2,000


Total revenue, net


$

25,406


$

19,342


ANNOVERA (segesterone acetate and ethinyl estradiol vaginal system)

  • ANNOVERA net product revenue of 
    $11.8 million for the third quarter of 2021 increased by 
    $5.4 million compared to 
    $6.4 million for the third quarter of 2020.
  • Approximately 8,350 ANNOVERA prescriptions were dispensed to patients during the third quarter of 2021. Prescriptions increased 62.7% compared to the third quarter of 2020.
  • Over 4,500 health care providers (HCPs) prescribed ANNOVERA during the third quarter, of which nearly 29% were new writers.
    • Growth in prescribers of approximately 1,600 over third quarter of 2020.
    • Cumulatively over 9,450 HCPs have prescribed ANNOVERA.

IMVEXXY® (estradiol vaginal inserts)

  • IMVEXXY net product revenue of 
    $8.0 million for the third quarter of 2021 increased by 
    $1.2 million compared to 
    $6.8 million for the third quarter of 2020.
  • Approximately 113,000 IMVEXXY prescriptions were dispensed to patients during the third quarter of 2021.
  • Full re-targeting initiative taking place in the fourth quarter of 2021, with implementation in the first quarter of 2022.
    • Plan to rejuvenate growth and optimize HCP focus.

BIJUVA® (estradiol and progesterone)

  • BIJUVA net product revenue of 
    $3.3 million for the third quarter of 2021 increased by 
    $1.7 million compared to 
    $1.6 million for the third quarter of 2020.
  • BIJUVA net product revenue for the third quarter of 2021 includes 
    $0.7 million of export sales through our international licensing and supply agreement with 
    Theramex HQ UK Limited.
  • Re-targeting initiative taking place, similar to the process with IMVEXXY.

Cost of Goods Sold and Gross Margin

  • Cost of goods was 
    $5.3 million with product gross margin of 78% for the third quarter of 2021 compared to 
    $3.3 million with product gross margin of 81% for the third quarter of 2020. The lower product gross margin for the third quarter of 2021 reflects the impact of 
    $0.7 million of BIJUVA export sales, which were sold at cost.

Operating Expense, Net Loss and Related Information

  • Total operating expense of 
    $60.0 million for the third quarter of 2021 increased by 
    $19.0 million compared to 
    $41.0 million for the third quarter of 2020. Included in total operating expense for the third quarter of 2021 was 
    $7.3 million of severance related expenses recorded for certain former senior executives.
  • Net loss for the third quarter of 2021 was 
    $47.4 million, or 
    $0.11 per basic and diluted share, compared to net loss for the third quarter of 2020 of 
    $32.6 million, or 
    $0.12 per basic and diluted share.

Balance Sheet

  • As of 
    September 30, 2021, the Company’s cash on hand totaled 
    $104.8 million, compared with 
    $80.5 million as of 
    December 31, 2020.
  • For the first nine months of 2021, the Company received 
    $182.9 million in net proceeds from its at-the-market and underwritten equity offerings.
  • As of 
    September 30, 2021, the remaining outstanding principal amount under the Company’s Financing Agreement was 
    $200.0 million, which reflects a repayment of 
    $50.0 million of principal during the first nine months of 2021.

The contract manufacturing organization that manufactures ANNOVERA has recently experienced an increase in difficulties with the manufacturing process for ANNOVERA resulting in batch failures. The Company filed a supplemental NDA with the FDA to modify the manufacturing (testing) specification for ANNOVERA to allow for normal manufacturing variation that would increase the consistency of manufacturing and supply of ANNOVERA. The Company expects that the FDA will act on the supplemental NDA by the Prescription Drug User Fee Act (“PDUFA”) date of 
December 12, 2021. If the FDA does not approve the supplemental NDA by the PDUFA date, the Company may not be able to meet the revenue covenants under its Financing Agreement in the near term. The manufacturing difficulties relate only to our ability to meet the release specification, and any ANNOVERA rings currently being sold meet the exacting quality specifications. For more information regarding the covenants under the Financing Agreement, please see the Company’s filings with the 
SEC.

Conference Call and Webcast Details

TherapeuticsMD will host a conference call and live audio webcast today at 
8:30 a.m. ET to discuss these financial results and provide a business update.

Date:

Thursday, November 11, 2021

Time:

8:30 a.m. ET

Telephone Access (US):

866-665-9531

Telephone Access (International):

724-987-6977

Access Code for All Callers:

6341637 

A live webcast and audio archive for the event may be accessed on the home page or from the “Investors & Media” section of the 
TherapeuticsMD website at www.therapeuticsmd.com. Please connect to the website prior to the start of the presentation to ensure adequate time for any software downloads that may be necessary to listen to the webcast. A replay of the webcast will be archived on the website for at least 30 days. In addition, a digital recording of the conference call will be available for replay beginning two hours after the call’s completion and for at least 30 days with the dial-in 855-859-2056 or international 404-537-3406 and Conference ID: 6341637.

Please see the Full Prescribing Information, including indication and Boxed WARNING, for each 
TherapeuticsMD product as follows:

Forward-Looking Statements

This press release by 
TherapeuticsMD, Inc. may contain forward-looking statements. Forward-looking statements may include, but are not limited to, statements relating to TherapeuticsMD’s objectives, plans and strategies as well as statements, other than historical facts, that address activities, events or developments that the company intends, expects, projects, believes or anticipates will or may occur in the future. These statements are often characterized by terminology such as “believes,” “hopes,” “may,” “anticipates,” “should,” “intends,” “plans,” “will,” “expects,” “estimates,” “projects,” “positioned,” “strategy” and similar expressions and are based on assumptions and assessments made in light of management’s experience and perception of historical trends, current conditions, expected future developments and other factors believed to be appropriate. Forward-looking statements in this press release are made as of the date of this press release, and the company undertakes no duty to update or revise any such statements, whether as a result of new information, future events or otherwise. Forward-looking statements are not guarantees of future performance and are subject to risks and uncertainties, many of which are outside of the company’s control. Important factors that could cause actual results, developments and business decisions to differ materially from forward-looking statements are described in the sections titled “Risk Factors” in the company’s filings with the 
Securities and Exchange Commission, including its most recent Annual Report on Form 10-K and Quarterly Reports on Form 10-Q, as well as reports on Form 8-K, and include the following: the effects of the COVID-19 pandemic; the company’s ability to maintain or increase sales of its products; the company’s ability to develop and commercialize IMVEXXY®, ANNOVERA®, and BIJUVA® and obtain additional financing necessary therefor; whether the company will be able to comply with the covenants and conditions under its term loan facility; whether the company will be able to successfully divest, or obtain an investment in, its vitaCare business and how the proceeds that may be generated by any such divestiture or investment will be utilized; the effects of supply chain issues on the supply of the company’s products; the potential of adverse side effects or other safety risks that could adversely affect the commercialization of the company’s current or future approved products or preclude the approval of the company’s future drug candidates; whether the FDA will approve the lower dose of BIJUVA and the manufacturing supplement for ANNOVERA; the company’s ability to protect its intellectual property, including with respect to the Paragraph IV notice letters the company received regarding IMVEXXY and BIJUVA; the length, cost and uncertain results of future clinical trials; the company’s reliance on third parties to conduct its manufacturing, research and development and clinical trials; the ability of the company’s licensees to commercialize and distribute the company’s products; the ability of the company’s marketing contractors to market ANNOVERA; the availability of reimbursement from government authorities and health insurance companies for the company’s products; the impact of product liability lawsuits; the influence of extensive and costly government regulation; the impact of leadership transitions; the volatility of the trading price of the company’s common stock and the concentration of power in its stock ownership.

– Financial Statements to Follow –

TherapeuticsMD, Inc. and Subsidiaries
Consolidated Balance Sheets
(In thousands, except per share data)
 
September 30, 2021 December 31, 2020
(Unaudited)
Assets:
Current assets:
Cash

$

104,841


$

80,486


Accounts receivable, net of allowance for credit losses of 
$1,351 and 
$1,118
as of 
September 30, 2021 and 
December 31, 2020, respectively


37,402


32,382


Inventory


7,362


7,993


Prepaid and other current assets


10,374


7,543


Total current assets


159,979


128,404


Fixed assets, net


1,388


1,942


License rights and other intangible assets, net


39,617


41,445


Right of use assets


8,391


9,566


Other non-current assets


253


253


Total assets

$

209,628


$

181,610


Liabilities and stockholders’ equity (deficit):
Current liabilities:
Current maturities of long-term debt

$

15,000


$


Accounts payable


19,592


21,068


Accrued expenses and other current liabilities


51,674


38,170


Total current liabilities


86,266


59,238


Long-term debt, net


171,738


237,698


Operating lease liabilities


8,226


8,675


Other non-current liabilities


758


Total liabilities


266,988


305,611


Commitments and contingencies
Stockholders’ equity (deficit):
Preferred stock, par value 
$0.001; 10,000 shares authorized, none issued


Common stock, par value 
$0.001; 600,000 shares authorized, 424,879 and 299,765
issued and outstanding as of 
September 30, 2021 and 
December 31, 2020, respectively


425


300


Additional paid-in capital


950,615


754,644


Accumulated deficit


(1,008,400

)


(878,945

)

Total stockholders’ deficit


(57,360

)


(124,001

)

Total liabilities and stockholders’ equity (deficit)

$

209,628


$

181,610


TherapeuticsMD, Inc. and Subsidiaries
Consolidated Statements of Operations
(Unaudited – in thousands, except per share data)
 
Three Months Ended Nine Months Ended
September 30, September 30,

2021

2020

2021

2020

Product revenue, net

$

24,469


$

17,342


$

67,102


$

40,294


License revenue


937


2,000


1,171


2,000


Total revenue, net


25,406


19,342


68,273


42,294


Cost of goods sold


5,282


3,279


14,101


10,394


Gross profit


20,124


16,063


54,172


31,900


Operating expenses:


Selling and marketing


30,005


22,373


86,193


91,056


General and administrative


28,435


16,637


66,691


53,740


Research and development


1,605


2,027


5,666


8,038


Total operating expenses


60,045


41,037


158,550


152,834


Loss from operations


(39,921

)


(24,974

)


(104,378

)


(120,934

)

Other (expense) income:
Interest expense and other financing costs


(7,518

)


(7,680

)


(25,341

)


(20,969

)

Other income, net


19


42


264


466


Total other (expense), net


(7,499

)


(7,638

)


(25,077

)


(20,503

)

Loss before income taxes


(47,420

)


(32,612

)


(129,455

)


(141,437

)

Provision for income taxes


Net loss

$

(47,420

)

$

(32,612

)

$

(129,455

)

$

(141,437

)

Loss per common share, basic and diluted

$

(0.11

)

$

(0.12

)

$

(0.33

)

$

(0.52

)

Weighted average common shares, basic and diluted


422,216


272,565


388,111


271,969


TherapeuticsMD, Inc. and Subsidiaries
Consolidated Statements of Cash Flows
(Unaudited – in thousands)
 
 
Nine Months Ended 
September 30,

2021

2020

Cash flows from operating activities:
Net loss

$

(129,455

)

$

(141,437

)

Adjustments to reconcile net loss to net cash used in operating activities:
Depreciation and amortization


3,091


3,039


Charges (credits) to provision for doubtful accounts


540


(47

)

Inventory charge


1,082


5,744


Debt financing fees


4,158


1,645


Share-based compensation


12,779


8,502


Other


726


1,719


Changes in operating assets and liabilities:
Accounts receivable


(5,560

)


384


Inventory


(451

)


(3,816

)

Prepaid and other current assets


(2,831

)


2,038


Accounts payable


(1,476

)


(3,072

)

Accrued expenses and other current liabilities


13,504


(3,813

)

Other non-current liabilities


758


Total adjustments


26,320


12,323


Net cash used in operating activities


(103,135

)


(129,114

)

Cash flows from investing activities:
Payment of patent related costs


(675

)


(1,065

)

Purchase of fixed assets


(34

)


(39

)

Net cash used in investing activities


(709

)


(1,104

)

Cash flows from financing activities:
Proceeds from sale of common stock, net of costs


182,881


Proceeds from exercise of options and warrants


302


272


Proceeds from sale of common stock related to employee stock purchase plan


134


Repayments of debt


(50,000

)


Borrowings of debt


50,000


Payment of debt financing fees


(5,118

)


(1,250

)

Net cash provided by financing activities


128,199


49,022


Net increase in cash


24,355


(81,196

)

Cash, beginning of period


80,486


160,830


Cash, end of period

$

104,841


$

79,634


Supplemental disclosure of noncash financing activities:
Warrants issued in relation to debt financing agreement


7,428


Supplemental disclosure of cash flow information:
Interest paid

$

19,675


$

12,032


James D’Arecca
Chief Financial Officer
561-961-1900

Lisa M. Wilson

In-Site Communications, Inc.
212-452-2793
lwilson@insitecony.com

Source: 
TherapeuticsMD, Inc.

Release – TherapeuticsMD Announces Leadership Changes Appointment of Industry Veteran Hugh O Dowd as Chief Executive Officer


TherapeuticsMD Announces Leadership Changes; Appointment of Industry Veteran, Hugh O’Dowd, as Chief Executive Officer


– Mr. O’Dowd to succeed  Robert G. Finizio, effective on or before 
December 31, 2021 –

–  Mr. Finizio appointed Vice Chair of the Board –

BOCA RATON, Fla.–(BUSINESS WIRE)–Nov. 11, 2021– 
TherapeuticsMD, Inc. (NASDAQ: TXMD) (TXMD or the Company), an innovative, leading women’s healthcare company, today announced key leadership changes, including the appointment of Hugh O’Dowd, the Company’s current President, as the Company’s Chief Executive Officer and member of the board of directors. Mr. O’Dowd will succeed  Robert G. Finizio, the Company’s Co-founder and current Chief Executive Officer, effective on or before 
December 31, 2021Mr. Finizio will continue with the Company and has been appointed Vice Chair of the Board of Directors.

“I want to thank Rob for his strong leadership and vision over the past 13 years,” said Honorable  Tommy Thompson, Chairman of the Board of 
TherapeuticsMD. “Rob is an innovator who has made an indelible mark not only on this company, but on the women’s healthcare industry as a whole.”

“Founding TherapeuticsMD has been one of the highlights of my career. Hugh is an experienced leader with a strong track record of delivering results, and in the few short months since joining the company, he has already made invaluable contributions. I am confident that he is the right person to bring 
TherapeuticsMD to the next level of growth,” said  Mr. Finizio.

“TherapeuticsMD is an innovator in women’s healthcare, and I welcome the opportunity to drive operating performance and craft our long-term strategy,” stated Mr. O’Dowd. “Rob has created a dynamic company and established TXMD’s foundation for growth and I will build upon our mission of empowering women of all ages through better healthcare.”

Mr. O’Dowd previously served as President, Chief Executive Officer, and member of the Board of Directors of 
Neon Therapeutics, Inc., a clinical-state immuno-oncology company until its acquisition by BioNTech SE in 
May 2020. Prior to Neon Therapeutics, Mr. O’Dowd spent more than 20 years in a variety of senior leadership roles at 
Novartis Pharmaceuticals Corporation, where he served as Country President and General Manager of the 
United Kingdom and 
Ireland, Senior Vice President and Chief Commercial Officer of Novartis Oncology, and Vice President, Latin America Region Head for the Oncology business unit. During his time as Chief Commercial Officer Oncology, Mr. O’Dowd was responsible for the oncology portfolio strategy for the world’s then second-largest oncology/hematology organization, including global brand leadership, business development/licensing, and commercialization. Mr. O’Dowd currently serves as Director and Non-executive Chairman of 
ONK Therapeutics Ltd, an innovative natural killer cell therapy company, and as a Director of Polyphor AG, a clinical-stage biopharmaceutical company focused on the discovery and development of antibiotics and immuno-oncology compounds. Mr. O’Dowd received an MBA from the 
Kellstadt Graduate School of Business at 
DePaul University in 
Chicago and a B.A. from 
Loyola University Chicago.

About TherapeuticsMD, Inc.

TherapeuticsMD, Inc. is an innovative, leading healthcare company, focused on developing and commercializing novel products exclusively for women. Our products are designed to address the unique changes and challenges women experience through the various stages of their lives with a therapeutic focus in family planning, reproductive health, and menopause management. The company is committed to advancing the health of women and championing awareness of their healthcare issues. To learn more about 
TherapeuticsMD, please visit therapeuticsmd.com or follow us on Twitter: @TherapeuticsMD and on Facebook: 
TherapeuticsMD.

Forward-Looking Statements

This press release by 
TherapeuticsMD, Inc. may contain forward-looking statements. Forward-looking statements may include, but are not limited to, statements relating to TherapeuticsMD’s objectives, plans and strategies as well as statements, other than historical facts, that address activities, events or developments that the company intends, expects, projects, believes or anticipates will or may occur in the future. These statements are often characterized by terminology such as “believes,” “hopes,” “may,” “anticipates,” “should,” “intends,” “plans,” “will,” “expects,” “estimates,” “projects,” “positioned,” “strategy” and similar expressions and are based on assumptions and assessments made in light of management’s experience and perception of historical trends, current conditions, expected future developments and other factors believed to be appropriate. Forward-looking statements in this press release are made as of the date of this press release, and the company undertakes no duty to update or revise any such statements, whether as a result of new information, future events or otherwise. Forward-looking statements are not guarantees of future performance and are subject to risks and uncertainties, many of which are outside of the company’s control. Important factors that could cause actual results, developments and business decisions to differ materially from forward-looking statements are described in the sections titled “Risk Factors” in the company’s filings with the 
Securities and Exchange Commission, including its most recent Annual Report on Form 10-K and Quarterly Reports on Form 10-Q, as well as reports on Form 8-K, and include the following: the effects of the COVID-19 pandemic; the company’s ability to maintain or increase sales of its products; the company’s ability to develop and commercialize IMVEXXY®, ANNOVERA®, and BIJUVA® and obtain additional financing necessary therefor; whether the company will be able to comply with the covenants and conditions under its term loan facility; whether the company will be able to successfully divest, or obtain an investment in, its vitaCare business and how the proceeds that may be generated by any such divestiture or investment will be utilized; the effects of supply chain issues on the supply of the company’s products; the potential of adverse side effects or other safety risks that could adversely affect the commercialization of the company’s current or future approved products or preclude the approval of the company’s future drug candidates; whether the FDA will approve the lower dose of BIJUVA and the manufacturing supplement for ANNOVERA; the company’s ability to protect its intellectual property, including with respect to the Paragraph IV notice letters the company received regarding IMVEXXY and BIJUVA; the length, cost and uncertain results of future clinical trials; the company’s reliance on third parties to conduct its manufacturing, research and development and clinical trials; the ability of the company’s licensees to commercialize and distribute the company’s products; the ability of the company’s marketing contractors to market ANNOVERA; the availability of reimbursement from government authorities and health insurance companies for the company’s products; the impact of product liability lawsuits; the influence of extensive and costly government regulation; the impact of leadership transitions; the volatility of the trading price of the company’s common stock and the concentration of power in its stock ownership.

Lisa M. Wilson

In-Site Communications, Inc.
212-452-2793
lwilson@insitecony.com

Source: 
TherapeuticsMD, Inc.

Release – EuroDry Ltd. Reports Results for the Nine-Month Period and Quarter Ended September 30 2021


EuroDry Ltd. Reports Results for the Nine-Month Period and Quarter Ended September 30, 2021


ATHENS, Greece, Nov. 10, 2021 (GLOBE NEWSWIRE) — EuroDry Ltd. (NASDAQ: EDRY, the “Company” or “EuroDry”), an owner and operator of drybulk vessels and provider of seaborne transportation for drybulk cargoes, announced today its results for the three and nine-month periods ended September 30, 2021.

Third Quarter 2021 Highlights:

  • Total net revenues for the quarter of $19.5 million.

  • Net income attributable to common shareholders of $11.8 million or $4.47 and $4.41 earnings per share basic and diluted, respectively, inclusive of unrealized gain on derivatives.

  • Adjusted net income attributable to common shareholders1 for the quarter of $10.1 million, or, $3.84 and $3.79 per share basic and diluted, respectively.

  • Adjusted EBITDA1 was $13.0 million.

  • An average of 8.1 vessels were owned and operated during the third quarter of 2021 earning an average time charter equivalent rate of $28,103 per day.

  • The Company declared a dividend of $0.3 million on its Series B Preferred Shares. The dividend will be paid in cash.

______________
1Adjusted EBITDA, Adjusted net income/(loss) and Adjusted earnings/(loss) per share are not recognized measurements under US GAAP (GAAP) and should not be used in isolation or as a substitute for EuroDry’s financial results presented in accordance with GAAP. Refer to a subsequent section of the Press Release for the definitions and reconciliation of these measurements to the most directly comparable financial measures calculated and presented in accordance with GAAP.

Nine Months 2021 Highlights:

  • Total net revenues of $42.1 million.

  • Net income attributable to common shareholders was $14.2 million, or$5.84 and $5.74 earnings per share basic and diluted, respectively, inclusive of unrealized loss on derivatives and a loss on debt extinguishment.

  • Adjusted net income attributable to common shareholders1 for the period was $18.0 million or $7.42 and $7.29 adjusted earnings per share basic and diluted, respectively.

  • Adjusted EBITDA1 was $26.3 million.

  • An average of 7.5 vessels were owned and operated during the first nine months of 2021 earning an average time charter equivalent rate of $22,232 per day.

Recent developments

In October 2021, we drew a loan of $9 million with our vessels, M/V Pantelis and M/V Tasos, used as collateral, which will be repaid in eighteen monthly installments of $0.3 million each followed by another eighteen monthly installments of $0.2 million each.

In November 2021, we decided to redeem our outstanding Series B Preferred Shares at par using approximately $13.6 million from the funds we generated. The Series B Preferred Shares carried a dividend of 8% per annum until January 2023 increasing to 14% per annum thereafter. The redemption is expected to take place within 2021.

Aristides Pittas, Chairman and CEO of EuroDry commented“During the third quarter of 2021, charter rates for the sizes of vessels we operate averaged 30-40% higher compared to their levels in the second quarter of 2021 reaching levels last seen in 2010. Rates continued to rise and peaked in mid-October but have since given away a bit mainly due to the slowdown of growth and, especially, of steel demand in China. They, nevertheless, remain at very profitable levels. In the near term, the re-opening and rebounding of economies around the world is threatened by the fast spread of the “D” variant of COVID-19, increasing commodity and energy prices and causing restraints in the supply chain of various materials and products; in the medium term, we expect that the low orderbook of the drybulk fleet, which remains near historical lows if expressed as a ratio to the existing fleet, will result in very modest fleet growth over the next one to two years, thus, maintaining tight supply conditions and providing support to the charter rate levels.

In the above environment, as previously announced, we expanded our exposure to the market by acquiring in September 2021 M/V Good Heart, a modern ultramax vessel, demonstrating our belief in the strong market fundamentals. Given the recent contributions from our vessels, our Board decided to use some of the earnings we accrued to redeem our outstanding Series B Preferred Shares at par and reduce our funding costs; this redemption will increase the earnings per share of our common shareholders by about $0.38 in 2022 and by about $0.67 every year from then on.

Overall, we remain positive about the prospects of the market and continue to evaluate opportunities for investment or any other form of cooperation exploiting our public listing and operating platform.”

Tasos Aslidis, Chief Financial Officer of EuroDry commented: “Comparing our results for the third quarter of 2021 with the same period of 2020, our net revenues increased by about $12.7 million, due to the significantly higher time charter equivalent rates our vessels earned as compared to the third quarter of 2020. Operating expenses, including management fees and general and administrative expenses increased from $6,397 per vessel per day in the third quarter of 2020 to $6,495 in the third quarter of 2021. This increase is mainly due to the increased crewing costs for our vessels compared to the same period of 2020, resulting from difficulties in crew rotation due to COVID-19 related restrictions.

Adjusted EBITDA during the third quarter of 2021 was $13.0 million compared to $2.8 million achieved for the third quarter of last year. As of September 30, 2021, our outstanding debt (excluding the unamortized loan fees) was $73.9 million while unrestricted and restricted cash was $22.6 million. As of the same date, our scheduled debt repayments including balloon payments over the next 12 months amounted to about $11.5 million (excluding the unamortized loan fees) and all our loan covenants are satisfied.”

Third Quarter 2021 Results:
For the third quarter of 2021, the Company reported total net revenues of $19.5 million representing a 186.4% increase over total net revenues of $6.8 million during the third quarter of 2020 which was primarily the result of the higher time charter rates our vessels earned in the third quarter of 2021 compared to the corresponding period of 2020. The Company reported a net income for the period of $12.1 million and a net income attributable to common shareholders of $11.8 million, as compared to a net income of $0.5 million and a net income attributable to common shareholders of $0.1 million for the same period of 2020. For the third quarter of both 2021 and 2020, a gain on bunkers resulted in voyage expenses, net amounting to income of $0.1 million and $0.4 million, respectively.

Vessel operating expenses were $3.7 million for the third quarter of 2021 as compared to $3.1 million for the same period of 2020. The increase is attributable to the increased number of vessels operating in the third quarter of 2021 compared to the corresponding period in 2020, as well as to the increased crewing costs for our vessels compared to the same period of 2020, resulting from difficulties in crew rotation due to COVID-19 related restrictions, and the increase in hull and machinery insurance premiums. Depreciation expenses for the third quarter of 2021 amounted to $2.0 million, as compared to $1.7 million for the same period of 2020. This increase is due to the higher number of vessels operating in the third quarter of 2021 as compared to the same period of 2020. General and administrative expenses increased to $0.6 million in the third quarter of 2021, as compared to $0.5 million in the third quarter of 2020 due to higher legal and insurance expenses.

Interest and other financing costs for the third quarter of 2021 remained unchanged at $0.6 million as compared to the same period of 2020, since the increase in the average outstanding debt during the period was offset by the decreased Libor rates of our loans in the current period compared to the same period of 2020. For the three months ended September 30, 2021, the Company recognized a marginal loss on three interest rate swaps and a $0.1 million loss on FFA contracts, comprising a $1.6 million unrealized gain and a $1.7 million realized loss, as compared to a marginal loss on three interest rate swaps and a $0.2 million realized loss on FFA contracts.

On average, 8.1 vessels were owned and operated during the third quarter of 2021 earning an average time charter equivalent rate of $28,103 per day compared to 7.0 vessels in the same period of 2020 earning on average $11,873 per day.

Adjusted EBITDA for the third quarter of 2021 was $13.0 million compared to $2.8 million achieved during the third quarter of 2020.

Basic and diluted earnings per share attributable to common shareholders for the third quarter of 2021 was $4.47 calculated on 2,634,822 basic and $4.41 calculated on 2,675,224 diluted weighted average number of shares outstanding, compared to basic and diluted earnings per share of $0.06 for the third quarter of 2020, calculated on 2,279,730 basic and diluted weighted average number of shares outstanding.

Excluding the effect on the income attributable to common shareholders for the quarter of the unrealized gain on derivatives, the adjusted earnings attributable to common shareholders for the quarter ended September 30, 2021 would have been $3.84 and $3.79 per share basic and diluted, respectively, compared to adjusted earnings of $0.05 per share basic and diluted for the quarter ended September 30, 2020. Usually, security analysts do not include the above item in their published estimates of earnings per share.

First Nine Months 2021 Results:
For the first nine months of 2021, the Company reported total net revenues of $42.1 million representing an 165.3% increase over total net revenues of $15.9 million during the first nine months of 2020, which was the result of the increased number of vessels operated and the higher average charter rates our vessels earned during the period of 2021 compared to the same period of 2020. The Company reported a net income for the period of $15.1 million and a net income attributable to common shareholders of $14.2 million, as compared to a net loss of $5.6 million and a net loss attributable to common shareholders of $6.7 million, for the nine month period of 2020. For the nine months of 2021, voyage expenses, net amounted to income of $0.5 million resulting from gain on bunkers as compared to voyage expenses of $0.2 million in the same period of 2020. Vessel operating expenses were $9.9 million for the nine months of 2021 as compared to $8.7 million for the same period of 2020. The increase is attributable to the increased number of vessels operating in the first nine months of 2021 compared to the corresponding period in 2020, as well as to the increased crewing costs for our vessels compared to the same period of 2020, resulting from difficulties in crew rotation due to COVID-19 related restrictions, and the increase in hull and machinery insurance premiums. Depreciation expenses for the first nine months of 2021 were $5.4 million compared to $4.9 million during the same period of 2020, mainly due to the increase in the cost base of certain of our vessels due to the recent installation of ballast water management systems and the higher number of vessels operating in the same period. On average, 7.5 vessels were owned and operated during the first nine months of 2021 earning an average time charter equivalent rate of $22,232 per day compared to 7.0 vessels in the same period of 2020 earning on average $8,927 per day. General and administrative expenses increased to $1.7 million during the first nine months of 2021 as compared to $1.6 million in the same period of last year due to higher legal and insurance expenses. In the first nine months of 2020, two vessels underwent special survey for a total cost of $1.8 million, while there were no vessels undergoing drydocking during the first nine months of 2021.

Interest and other financing costs for the first nine months of 2021 amounted to $1.7 million compared to $1.9 million for the same period of 2020. This decrease is mainly due to the decreased Libor rates of our loans in the current period compared to the same period of 2020. For the nine months ended September 30, 2021, the Company recognized a $0.1 million gain on three interest rate swaps and a $2.5 million unrealized loss and $3.0 million realized loss on FFA contracts as compared to a loss on derivatives of $0.8 million for the same period of 2020, comprising of a $0.3 million loss on FFA contracts and a $0.5 million loss on three interest rate swaps.

Adjusted EBITDA for the nine months of 2021 was $26.3 million compared to $1.8 million achieved during the first nine months of 2020.

Basic and diluted earnings per share attributable to common shareholders for the first nine months of 2021 was $5.84, calculated on 2,427,810 basic and $5.74, calculated on 2,470,726 diluted weighted average number of shares outstanding compared to basic and diluted loss per share of $2.97 for the first nine months of 2020, calculated on 2,271,542 basic and diluted weighted average number of shares outstanding.

Excluding the effect on the income attributable to common shareholders for the first nine months of the year of the unrealized loss on derivatives and the loss on debt extinguishment, the adjusted earnings attributable to common shareholders for the nine-month period ended September 30, 2021 would have been $7.42 and $7.29 per share basic and diluted, respectively, compared to a loss of $2.70 per share basic and diluted for the same period in 2020. As previously mentioned, usually, security analysts do not include the above items in their published estimates of earnings per share.

Fleet Profile:

The EuroDry Ltd. fleet profile is as follows:

Name

Type

Dwt

Year
Built

Employment(*)

TCE Rate ($/day)

Dry Bulk Vessels

EKATERINI

Kamsarmax

82,000

2018

TC until Mar-22

Hire 106% of the Average Baltic Kamsarmax P5TC index (**)

XENIA

Kamsarmax

82,000

2016

TC until Aug-22

Hire 105% of the Average Baltic Kamsarmax P5TC index(**)

ALEXANDROS P.

Ultramax

63,500

2017

TC until Nov-21

$31,000

GOOD HEART

Ultramax

62,996

2014

TC until Nov-21

$33,000

EIRINI P

Panamax

76,466

2004

TC until Apr-22

Hire 99%
of Average
BPI(***) 4TC

STARLIGHT

Panamax

75,845

2004

TC until Oct-22

Hire 98.5%
of Average
BPI(***) 4TC

TASOS

Panamax

75,100

2000

TC until Nov-21

$28,500

PANTELIS

Panamax

74,020

2000

TC until Feb-22

$30,250

BLESSED LUCK

Panamax

76,704

2004

TC until Apr-22

$19,500

Total Dry Bulk Vessels

9

668,631

Note:

(*)

Represents the earliest redelivery date

(**)

The average Baltic Kamsarmax P5TC Index is an index based on five Panamax time charter routes.

(***)

BPI stands for the Baltic Panamax Index; the average BPI 4TC is an index based on four time charter routes.

Summary Fleet Data:

3 months, ended
September 30, 2020

3 months, ended
September 30, 2021

9 months, ended
September 30, 2020

9 months, ended
September 30, 2021

FLEET DATA

Average number of vessels (1)

7.0

8.1

7.0

7.5

Calendar days for fleet (2)

644.0

745.0

1,918.0

2,045.9

Scheduled off-hire days incl. laid-up (3)

0.0

0.0

51.2

0.0

Available days for fleet (4) = (2) – (3)

644.0

745.0

1,866.8

2,045.9

Commercial off-hire days (5)

0.0

0.0

0.0

0.0

Operational off-hire days (6)

6.5

4.3

7.1

8.1

Voyage days for fleet (7) = (4) – (5) – (6)

637.5

740.7

1,859.7

2,037.8

Fleet utilization (8) = (7) / (4)

98.9%

99.4%

99.6%

99.6%

Fleet utilization, commercial (9) = ((4) – (5)) / (4)

100.0%

100.0%

100.0%

100.0%

Fleet utilization, operational (10) = ((4) – (6)) / (4)

98.9%

99.4%

99.6%

99.6%

AVERAGE DAILY RESULTS

Time charter equivalent rate (11)

11,873

28,103

8,927

22,232

Vessel operating expenses excl. drydocking expenses (12)

5,673

5,718

5,337

5,664

General and administrative expenses (13)

724

777

858

846

Total vessel operating expenses (14)

6,397

6,495

6,195

6,510

Drydocking expenses (15)

82

53

931

47

(1) Average number of vessels is the number of vessels that constituted the Company’s fleet for the relevant period, as measured by the sum of the number of calendar days each vessel was a part of the Company’s fleet during the period divided by the number of calendar days in that period.

(2) Calendar days. We define calendar days as the total number of days in a period during which each vessel in our fleet was in our possession including off-hire days associated with major repairs, drydockings or special or intermediate surveys or days of vessels in lay-up. Calendar days are an indicator of the size of our fleet over a period and affect both the amount of revenues and the amount of expenses that we record during that period.

(3) The scheduled off-hire days including vessels laid-up are days associated with scheduled repairs, drydockings or special or intermediate surveys or days of vessels in lay-up.

(4) Available days. We define available days as the total number of days in a period during which each vessel in our fleet was in our possession net of scheduled off-hire days incl. laid up. We use available days to measure the number of days in a period during which vessels were available to generate revenues.

(5) Commercial off-hire days. We define commercial off-hire days as days a vessel is idle without employment.

(6) Operational off-hire days. We define operational off-hire days as days associated with unscheduled repairs or other off-hire time related to the operation of the vessels.

(7) Voyage days. We define voyage days as the total number of days in a period during which each vessel in our fleet was in our possession net of commercial and operational off-hire days. We use voyage days to measure the number of days in a period during which vessels actually generate revenues or are sailing for repositioning purposes.

(8) Fleet utilization. We calculate fleet utilization by dividing the number of our voyage days during a period by the number of our available days during that period. We use fleet utilization to measure a company’s efficiency in finding suitable employment for its vessels and minimizing the amount of days that its vessels are off-hire for reasons such as unscheduled repairs or days waiting to find employment.

(9) Fleet utilization, commercial. We calculate commercial fleet utilization by dividing our available days net of commercial off-hire days during a period by our available days during that period.

(10) Fleet utilization, operational. We calculate operational fleet utilization by dividing our available days net of operational off-hire days during a period by our available days during that period.

(11) Time charter equivalent, or TCE, is a measure of the average daily net revenue performance of our vessels. Our method of calculating TCE is determined by dividing time charter revenue and voyage charter revenue net of voyage expenses by voyage days for the relevant time period. Voyage expenses primarily consist of port, canal and fuel costs that are unique to a particular voyage, which would otherwise be paid by the charterer under a time charter contract, or are related to repositioning the vessel for the next charter. TCE is a standard shipping industry performance measure used primarily to compare period-to-period changes in a shipping company’s performance despite changes in the mix of charter types (i.e., spot voyage charters, time charters, pool agreements and bareboat charters) under which the vessels may be employed between the periods. Our definition of TCE may not be comparable to that used by other companies in the shipping industry.

(12) Daily vessel operating expenses, which include crew costs, provisions, deck and engine stores, lubricating oil, insurance, maintenance and repairs and management fees are calculated by dividing vessel operating expenses by fleet calendar days for the relevant time period. Drydocking expenses are reported separately.

(13) Daily general and administrative expense is calculated by dividing general and administrative expenses by fleet calendar days for the relevant time period.

(14) Total vessel operating expenses, or TVOE, is a measure of our total expenses associated with operating our vessels. TVOE is the sum of vessel operating expenses, management fees and general and administrative expenses; drydocking expenses are not included. Daily TVOE is calculated by dividing TVOE by fleet calendar days for the relevant time period.

(15) Drydocking expenses include expenses during drydockings that would have been capitalized and amortized under the deferral method divided by the fleet calendar days for the relevant period. Drydocking expenses could vary substantially from period to period depending on how many vessels underwent drydocking during the period. The Company expenses drydocking expenses as incurred.

Conference Call and Webcast:
Tomorrow, November 11, 2021 at 10:00 a.m. Eastern Time, the Company’s management will host a conference call and webcast to discuss the results.

Conference Call details:
Participants should dial into the call 10 minutes before the scheduled time using the following numbers: 1 (877) 553-9962 (US Toll Free Dial In), 0(808) 238 – 0669 (UK Toll Free Dial In) or +44 (0) 2071 928592 (Standard International Dial In). Please quote “EuroDry” to the operator.

Audio webcast – Slides Presentation:
There will be a live and then archived webcast of the conference call and accompanying slides, available through the Company’s website. To listen to the archived audio file, visit our website http://www.eurodry.gr and click on Company Presentations under our Investor Relations page. Participants to the live webcast should register on the website approximately 10 minutes prior to the start of the webcast.

The slide presentation on the third quarter ended September 30, 2021 will also be available in PDF format 10 minutes prior to the conference call and webcast, accessible on the company’s website (www.eurodry.gr) on the webcast page. Participants to the webcast can download the PDF presentation.


EuroDry Ltd.

Unaudited Consolidated Condensed Statements of Operations
(All amounts expressed in U.S. Dollars – except number of shares)

Three Months Ended
September 30,

Three Months Ended
September 30,

Nine Months Ended
September 30,

Nine Months Ended
September 30,

2020

2021

2020

2021

(unaudited)

(unaudited)

Revenues

Time charter revenue

7,193,251

20,718,567

16,795,245

44,764,161

Commissions

(399,715

)

(1,262,785

)

(917,915

)

(2,642,473

)

Net revenues

6,793,536

19,455,782

15,877,330

42,121,688

Operating expenses

Voyage expenses, net

(375,866

)

(97,247

)

194,137

(540,322

)

Vessel operating expenses

3,135,569

3,651,301

8,744,999

9,893,244

Drydocking expenses

52,685

39,771

1,786,008

96,945

Vessel depreciation

1,651,870

1,983,108

4,904,386

5,395,583

Related party management fees

518,161

608,948

1,491,665

1,694,773

General and administrative expenses

466,381

578,784

1,646,536

1,729,935

Total Operating expenses

(5,448,800

)

(6,764,665

)

(18,767,731

)

(18,270,158

)

Operating income / (loss)

1,344,736

12,691,117

(2,890,401

)

23,851,530

Other income / (expenses)

Interest and other financing costs

(616,219

)

(555,801

)

(1,864,040

)

(1,676,973

)

Loss on debt extinguishment

(1,647,654

)

Loss on derivatives, net

(178,760

)

(75,585

)

(821,906

)

(5,389,990

)

Foreign exchange (loss) / gain

(12,336

)

4,269

(8,445

)

(643

)

Interest income

391

54

4,041

10,463

Other expenses, net

(806,924

)

(627,063

)

(2,690,350

)

(8,704,797

)

Net income / (loss)

537,812

12,064,054

(5,580,751

)

15,146,733

Dividend Series B Preferred shares

(407,665

)

(274,337

)

(1,155,677

)

(845,262

)

Preferred deemed dividend

(120,000

)

Net income / (loss) attributable to common shareholders

130,147

11,789,717

(6,736,428

)

14,181,471

Earnings / (loss) per share, basic

0.06

4.47

(2.97

)

5.84

Weighted average number of shares, basic

2,279,730

2,634,822

2,271,542

2,427,810

Earnings / (loss) per share, diluted

0.06

4.41

(2.97

)

5.74

Weighted average number of shares, diluted

2,279,730

2,675,224

2,271,542

2,470,726


EuroDry Ltd.

Unaudited Consolidated Condensed Balance Sheets
(All amounts expressed in U.S. Dollars – except number of shares)

December 31,
2020

September 30,
2021

ASSETS

(unaudited)

Current Assets:

Cash and cash equivalents

938,282

17,015,316

Trade accounts receivable, net

1,528,055

1,657,120

Other receivables

460,209

946,533

Inventories

1,385,280

784,958

Restricted cash

1,518,036

3,640,570

Prepaid expenses

226,033

107,991

Total current assets

6,055,895

24,152,488

Fixed assets:

Vessels, net

99,305,990

130,622,048

Long-term assets:

Restricted cash

2,150,000

1,950,000

Total assets

107,511,885

156,724,536

LIABILITIES, MEZZANINE EQUITY AND SHAREHOLDERS’ EQUITY

Current liabilities:

Long term bank loans, current portion

13,793,754

11,395,227

Trade accounts payable

1,074,518

999,725

Accrued expenses

704,508

981,080

Accrued preferred dividends

274,337

Derivatives

456,133

3,024,485

Deferred revenue

246,125

1,945,936

Due to related companies

2,984,759

253,221

Total current liabilities

19,259,797

18,874,011

Long-term liabilities:

Long term bank loans, net of current portion

37,318,084

61,807,377

Derivatives

393,899

14,938

Total long-term liabilities

37,711,983

61,822,315

Total liabilities

56,971,780

80,696,326

Mezzanine equity:

Series B Preferred shares (par value $0.01, 20,000,000 preferred shares authorized, 16,606 and 13,606 shares issued and outstanding, respectively)

15,940,713

13,060,713

Shareholders’ equity:

Common stock (par value $0.01, 200,000,000 shares authorized, 2,348,216 and 2,844,287 issued and outstanding, respectively)

23,482

28,442

Additional paid-in capital

53,048,060

67,229,734

Accumulated deficit

(18,472,150

)

(4,290,679

)

Total shareholders’ equity

34,599,392

62,967,497

Total liabilities, mezzanine equity and shareholders’ equity

107,511,885

156,724,536

EuroDry Ltd.
Unaudited Consolidated Condensed Statements of Cash Flows
(All amounts expressed in U.S. Dollars)

Nine Months Ended
September 30,

Nine Months Ended
September 30,

2020

2021

Cash flows from operating activities:

Net (loss) / income

(5,580,751

)

15,146,733

Adjustments to reconcile net (loss) / income to net cash provided by operating activities:

Vessel depreciation

4,904,386

5,395,583

Amortization of deferred charges

105,528

250,766

Share-based compensation

187,001

132,636

Unrealized loss on derivatives

602,361

2,189,391

Loss on debt extinguishment

1,647,654

Changes in operating assets and liabilities

370,007

(847,045

)

Net cash provided by operating activities

588,532

23,915,718

Cash flows from investing activities:

Cash paid for vessel acquisitions

(31,637,347

)

Cash paid for vessel improvements

(496,316

)

(37,891

)

Net cash used in investing activities

(496,316

)

(31,675,238

)

Cash flows from financing activities:

Redemption of Series B Preferred shares

(3,000,000

)

Proceeds from issuance of common stock, net of commissions paid

9,190,013

Preferred dividends paid

(713,553

)

(570,925

)

Loan arrangement fees paid

(648,000

)

Proceeds from related party loan

6,000,000

Proceeds from long term debt

61,700,000

Repayment of related party loan

(2,700,000

)

Repayment of long term debt

(4,764,000

)

(44,212,000

)

Net cash (used in) / provided by financing activities

(5,477,553

)

25,759,088

Net (decrease) / increase in cash, cash equivalents and restricted cash

(5,385,337

)

17,999,568

Cash, cash equivalents and restricted cash at beginning of period

9,129,442

4,606,318

Cash, cash equivalents and restricted cash at end of period

3,744,105

22,605,886

Cash breakdown

Cash and cash equivalents

249,742

17,015,316

Restricted cash, current

744,363

3,640,570

Restricted cash, long term

2,750,000

1,950,000

Total cash, cash equivalents and restricted cash shown in the statement of cash flows

3,744,105

22,605,886


EuroDry Ltd.

Reconciliation of Adjusted EBITDA to Net income / (loss)
(All amounts expressed in U.S. Dollars)

Three Months Ended
September 30, 2020

Three Months Ended
September 30, 2021

Nine Months Ended
September 30, 2020

Nine Months Ended
September 30, 2021

Net income / (loss)

537,812

12,064,054

(5,580,751

)

15,146,733

Interest and other financing costs, net (incl. interest income and loss on debt extinguishment)

615,828

555,747

1,859,999

3,314,164

Vessel depreciation

1,651,870

1,983,108

4,904,386

5,395,583

Unrealized (gain) / loss on Forward Freight Agreement derivatives

(1,590

)

(1,584,369

)

130,380

2,546,292

Loss / (gain) on interest rate swap derivatives

16,559

1,115

527,735

(133,730

)

Adjusted EBITDA

2,820,479

13,019,655

1,841,749

26,269,042

Adjusted EBITDA Reconciliation:
EuroDry Ltd. considers Adjusted EBITDA to represent net income / (loss) before interest, income taxes, depreciation, loss on debt extinguishment, unrealized (gain) / loss on Forward Freight Agreements (“FFAs”) and loss / (gain) on interest rate swap derivatives. Adjusted EBITDA does not represent and should not be considered as an alternative to net income / (loss), as determined by United States generally accepted accounting principles, or GAAP. Adjusted EBITDA is included herein because it is a basis upon which the Company assesses its financial performance because the Company believes that this non-GAAP financial measure assists our management and investors by increasing the comparability of our performance from period to period by excluding the potentially disparate effects between periods of, financial costs, loss on debt extinguishment, unrealized (gain) / loss on FFAs and loss / (gain) on interest rate swap derivatives, and depreciation. The Company’s definition of Adjusted EBITDA may not be the same as that used by other companies in the shipping or other industries.


EuroDry Ltd.

Reconciliation of Net income / (loss) to Adjusted net income / (loss)
(All amounts expressed in U.S. Dollars – except share data and number of shares)

Three Months Ended
September 30, 2020

Three Months Ended
September 30, 2021

Nine Months Ended
September 30, 2020

Nine Months Ended
September 30, 2021

Net income / (loss)

537,812

12,064,054

(5,580,751

)

15,146,733

Unrealized (gain) / loss on derivatives

(14,648

)

(1,659,261

)

602,361

2,189,391

Loss on debt extinguishment

1,647,654

Adjusted net income / (loss)

523,164

10,404,793

(4,978,390

)

18,983,778

Preferred dividends

(407,665

)

(274,337

)

(1,155,677

)

(845,262

)

Preferred deemed dividend

(120,000

)

Adjusted net income / (loss) attributable to common shareholders

115,499

10,130,456

(6,134,067

)

18,018,516

Adjusted earnings / (loss) per share, basic

0.05

3.84

(2.70

)

7.42

Weighted average number of shares, basic

2,279,730

2,634,822

2,271,542

2,427,810

Adjusted earnings / (loss) per share, diluted

0.05

3.79

(2.70

)

7.29

Weighted average number of shares, diluted

2,279,730

2,675,224

2,271,542

2,470,726

Adjusted net income / (loss) and Adjusted earnings / (loss) per share Reconciliation:

EuroDry Ltd. considers Adjusted net income / (loss) to represent net income / (loss) before unrealized (gain) / loss on derivatives, which includes FFAs and interest rate swaps, and loss on debt extinguishment. Adjusted net income / (loss) and Adjusted earnings / (loss) per share is included herein because we believe it assists our management and investors by increasing the comparability of the Company’s fundamental performance from period to period by excluding the potentially disparate effects between periods of unrealized (gain) / loss on derivatives and loss on debt extinguishment, which may significantly affect results of operations between periods. Adjusted net income / (loss) and Adjusted earnings / (loss) per share do not represent and should not be considered as an alternative to net income / (loss) or earnings / (loss) per share, as determined by GAAP. The Company’s definition of Adjusted net income / (loss) and Adjusted earnings / (loss) per share may not be the same as that used by other companies in the shipping or other industries.

About EuroDry Ltd.
EuroDry Ltd. was formed on January 8, 2018 under the laws of the Republic of the Marshall Islands to consolidate the drybulk fleet of Euroseas Ltd into a separate listed public company. EuroDry was spun-off from Euroseas Ltd on May 30, 2018; it trades on the NASDAQ Capital Market under the ticker EDRY.

EuroDry operates in the dry cargo, drybulk shipping market. EuroDry’s operations are managed by Eurobulk Ltd., an ISO 9001:2008 and ISO 14001:2004 certified affiliated ship management company and Eurobulk (Far East) Ltd. Inc., which are responsible for the day-to-day commercial and technical management and operations of the vessels. EuroDry employs its vessels on spot and period charters and under pool agreements.

The Company has a fleet of 9 vessels, including 5 Panamax drybulk carriers, 2 Ultramax drybulk carrier and 2 Kamsarmax drybulk carriers. EuroDry’s 9 drybulk carriers have a total cargo capacity of 668,631 dwt.

Forward Looking Statement
This press release contains forward-looking statements (as defined in Section 27A of the Securities Act of 1933, as amended, and Section 21E of the Securities Exchange Act of 1934, as amended) concerning future events and the Company’s growth strategy and measures to implement such strategy; including expected vessel acquisitions and entering into further time charters. Words such as “expects,” “intends,” “plans,” “believes,” “anticipates,” “hopes,” “estimates,” and variations of such words and similar expressions are intended to identify forward-looking statements. Although the Company believes that the expectations reflected in such forward-looking statements are reasonable, no assurance can be given that such expectations will prove to have been correct. These statements involve known and unknown risks and are based upon a number of assumptions and estimates that are inherently subject to significant uncertainties and contingencies, many of which are beyond the control of the Company. Actual results may differ materially from those expressed or implied by such forward-looking statements. Factors that could cause actual results to differ materially include, but are not limited to changes in the demand for dry bulk vessels, competitive factors in the market in which the Company operates; risks associated with operations outside the United States; and other factors listed from time to time in the Company’s filings with the Securities and Exchange Commission. The Company expressly disclaims any obligations or undertaking to release publicly any updates or revisions to any forward-looking statements contained herein to reflect any change in the Company’s expectations with respect thereto or any change in events, conditions or circumstances on which any statement is based.

Visit our website www.eurodry.gr

Company Contact

Investor Relations / Financial Media

Tasos Aslidis
Chief Financial Officer
EuroDry Ltd.
11 Canterbury Lane,
Watchung, NJ07069
Tel. (908) 301-9091
E-mail: aha@eurodry.gr

Nicolas Bornozis
President
Capital Link, Inc.
230 Park Avenue, Suite 1536
New York, NY10169
Tel. (212) 661-7566
E-mail: nbornozis@capitallink.com

Release – Capstone Green Energy Reports Second Quarter Fiscal 2022 Financial Results


Capstone Green Energy (Nasdaq: CGRN) Reports Second Quarter Fiscal 2022 Financial Results


Total Revenue Grew 15% Quarter-Over-Quarter, 14% Year-Over-Year, and 7% Sequentially

Book-to-Bill Ratio of 1.3:1 for the Quarter with New Gross Product Orders of $10.8M

Webcast to be Held Today, November 10, 2021 at 1:45 PM PT; 4:45 PM ET

VAN NUYS, CA / ACCESSWIRE / November 10, 2021 / Capstone Green Energy Corporation (www.CapstoneGreenEnergy.com) (NASDAQ:CGRN) (“Capstone,” the “Company,” “we” or “us”), a global leader in carbon reduction and on-site resilient green energy solutions, today announced financial results for its fiscal year 2022 second quarter ended September 30, 2021.

Financial Highlights of Fiscal Year 2022 Second Quarter:

  • Total revenue in the quarter was $17.2 million, up 15%, compared to $14.9 million in the second quarter last year and total revenue for the six months ended September 30, 2021 was $33.3 million, up 14%, compared to $29.1 million for the six months ended September 30, 2020.
  • New Gross Product orders of $10.8 million in the second quarter compared to $8.2 million in the first quarter, representing a positive Book-to-Bill Ratio of 1.3:1.
  • The long-term microturbine rental fleet increased 1.0 megawatt (MW) to 13.1 MWs from 12.1 MWs during the quarter as the Company continues to execute against its plan to increase the fleet to 21.1 MWs by March 31, 2022.
  • Total cash and cash equivalents as of September 30, 2021 were $38.3 million, a decrease of $11.2 million, compared to $49.5 million as of March 31, 2021.
  • Net loss was $6.0 million for the quarter, compared to a net loss of $4.2 million in the second quarter of fiscal 2021.
  • Adjusted EBITDA was negative $2.7 million for the quarter, compared to Adjusted EBITDA of negative $1.9 million in the second quarter of fiscal 2021.

“We remain laser-focused on revenue growth and our efforts are showing in the results, with year-over-year, quarter-over-quarter, and sequential revenue growth,” said Darren Jamison, President and Chief Executive Officer of Capstone Green Energy. “Growing our rental fleet is a pillar of our Energy as a Service and recurring revenue strategy, and we announced during the quarter that we expanded our long-term rental fleet from 12.1 MW to 13.1 MW, and in October we announced additional contracts for 3.2 MW of long-term rentals, and our goal of expanding the rental fleet to 17.1 MW by December 31, 2021. This is vital as we continue towards our objective of growing the fleet to 21.1 MW by March 31, 2022, the end of our fiscal year,” concluded Mr. Jamison.

“Our ability to continue to grow our Energy as a Service business, which includes rentals; long-term service contracts; spare parts; and the Distributor Support Subscription fee, are all key to our long-term strategy, as these recurring revenues drive higher margins and better predictability than a traditional product sale,” stated Eric Hencken, Chief Financial Officer of Capstone Green Energy.

Financial Results for Fiscal Year 2022 Second Quarter

Total revenue for the quarter was $17.2 million, an increase of $2.3 million, from $14.9 million in the second quarter of fiscal 2021. Total revenue for the six months ended September 30, 2021 was $33.3 million, an increase of $4.2 million from $29.1 million in the six months ended September 30, 2020. Both the quarter and year-over-year increases were primarily due to a higher volume of both product and parts revenue, as the prior year periods were more adversely impacted by the global COVID-19 pandemic.

Gross margin as a percentage of revenue decreased to 16% in the second quarter, compared to 17% in the same period last year, primarily due to lower overhead expenses in the prior period as a result of the Company’s COVID-19 Business Continuity Plan. This decrease was partially offset by higher revenues. Gross margin as a percentage of revenue decreased to 16% in the six months ended September 30, 2021, compared to 20% in the same period last year, primarily due to lower overhead expenses in the prior period as a result of the Company’s COVID-19 Business Continuity Plan, which consisted of pay cuts, furloughs, and other cost-cutting measures. Additionally, Factory Protection Plan margins were higher in the six months ended September 30, 2020 primarily due to site shutdowns caused by the pandemic, which delayed servicing events.

Operating expenses for the quarter were $7.4 million, an increase of $1.9 million, from $5.5 million in the same period last year. Operating expenses for the six months ended September 30, 2021 were $13.6 million, an increase of $4.2 million from $9.4 million in the same period last year. Both the quarter and year-over-year increases were primarily due to lower overhead expenses in the prior period as a result of the Company’s COVID-19 Business Continuity Plan, as well as a one-time employment related legal settlement of $0.8 million during the second quarter of fiscal 2022.

Net loss was $6.0 million for the second quarter of fiscal 2022, compared to a net loss of $4.2 million in the same period last year. Adjusted EBITDA was negative $2.7 million for the second quarter of fiscal 2022 compared to an Adjusted EBITDA of negative $1.9 million for the same period last year.

Net loss was $8.2 million for the six months ended September 30, 2021, compared to a net loss of $6.0 million in the same period last year. Adjusted EBITDA was negative $5.0 million for the six months ended September 30, 2021, compared to an Adjusted EBITDA of negative $1.8 million for the same period last year.

Cash and cash equivalents were $38.3 million as of September 30, 2021, compared to $49.5 million as of March 31, 2021.

Conference Call and Webcast

Capstone will host a live webcast on November 10, 2021, at 1:45 PM Pacific Time (4:45 PM Eastern Time) to provide the results of the fiscal year 2022 second quarter ended September 30, 2021. Capstone will discuss its financial results and will provide an update on its business activities. At the end of the conference call, Capstone will host a question-and-answer session to provide an opportunity for financial analysts to ask questions. Investors and interested individuals are invited to listen to the webcast by logging on to Capstone’s investor relation’s webpage at www.CapstoneGreenEnergy.com. A replay of the webcast will be available on the website for 30 days.

About Capstone Green Energy

Capstone Green Energy (www.CapstoneGreenEnergy.com) (NASDAQ: CGRN) is a leading provider of customized microgrid solutions and on-site energy technology systems focused on helping customers around the globe meet their environmental, energy savings, and resiliency goals. Capstone Green Energy focuses on four key business lines. Through its Energy as a Service (EaaS) business, it offers rental solutions utilizing its microturbine energy systems and battery storage systems, comprehensive Factory Protection Plan (FPP) service contracts that guarantee life-cycle costs, as well as aftermarket parts. Energy Generation Technologies (EGT) are driven by the Company’s industry-leading, highly efficient, low-emission, resilient microturbine energy systems offering scalable solutions in addition to a broad range of customer-tailored solutions, including hybrid energy systems and larger frame industrial turbines. The Energy Storage Solutions (ESS) business line designs and installs microgrid storage systems creating customized solutions using a combination of battery technologies and monitoring software. Through Hydrogen & Sustainable Products (H2S), Capstone Green Energy offers customers a variety of hydrogen products, including the Company’s microturbine energy systems.

For customers with limited capital or short-term needs, Capstone offers rental systems; for more information, contact: rentals@CGRNenergy.com. To date, Capstone has shipped over 10,000 units to 83 countries and estimates that, in FY21, it saved customers over $217 million in annual energy costs and approximately 397,000 tons of carbon. Total savings over the last three years are estimated to be approximately $698 million in energy savings and approximately 1,115,100 tons of carbon savings.

For more information about the Company, please visit TwitterLinkedInInstagramFacebook, and YouTube.

Cautionary Note Regarding Forward-Looking Statements

This release contains forward-looking statements as defined in the Private Securities Litigation Reform Act of 1995, including statements regarding expectations for green initiatives and execution on the Company’s growth strategy and other statements regarding the Company’s expectations, beliefs, plans, intentions, and strategies. The Company has tried to identify these forward-looking statements by using words such as “expect,” “anticipate,” “believe,” “could,” “should,” “estimate,” “intend,” “may,” “will,” “plan,” “goal” and similar terms and phrases, but such words, terms and phrases are not the exclusive means of identifying such statements. Actual results, performance and achievements could differ materially from those expressed in, or implied by, these forward-looking statements due to a variety of risks, uncertainties and other factors, including, but not limited to, the following: the ongoing effects of the COVID-19 pandemic; the availability of credit and compliance with the agreements governing the Company’s indebtedness; the Company’s ability to develop new products and enhance existing products; product quality issues, including the adequacy of reserves therefor and warranty cost exposure; intense competition; financial performance of the oil and natural gas industry and other general business, industry and economic conditions; the Company’s ability to adequately protect its intellectual property rights; and the impact of pending or threatened litigation. For a detailed discussion of factors that could affect the Company’s future operating results, please see the Company’s filings with the Securities and Exchange Commission, including the disclosures under “Risk Factors” in those filings. Except as expressly required by the federal securities laws, the Company undertakes no obligation to update or revise any forward-looking statements, whether as a result of new information, changed circumstances or future events, or for any other reason.

Financial Tables to Follow

CAPSTONE GREEN ENERGY CORPORATION AND SUBSIDIARIES
CONDENSED CONSOLIDATED BALANCE SHEETS
(In thousands, except share amounts)
(Unaudited)

September 30, March 31,
2021 2021
Assets
Current Assets:
Cash and cash equivalents
$ 38,267 $ 49,533
Accounts receivable, net of allowances of $348 at September 30, 2021 and $314 at March 31, 2021
25,360 20,593
Inventories, net
18,023 11,829
Prepaid expenses and other current assets
4,310 4,953
Total current assets
85,960 86,908
Property, plant, equipment and rental assets, net
11,687 9,630
Non-current portion of inventories
1,752 1,845
Other assets
8,958 7,639
Total assets
$ 108,357 $ 106,022
Liabilities and Stockholders’ Equity
Current Liabilities:
Accounts payable and accrued expenses
$ 24,754 $ 19,767
Accrued salaries and wages
1,351 1,889
Accrued warranty reserve
1,864 5,850
Deferred revenue
4,965 6,374
Current portion of notes payable and lease obligations
860 576
Total current liabilities
33,794 34,456
Deferred revenue – non-current
700 765
Term note payable, net
50,932 52,865
Long-term portion of notes payable and lease obligations
6,155 4,762
Total liabilities
91,581 92,848
Commitments and contingencies
Stockholders’ Equity:
Preferred stock, $.001 par value; 1,000,000 shares authorized; none issued
Common stock, $.001 par value; 51,500,000 shares authorized, 15,325,464 shares issued and 15,228,151 shares outstanding at September 30, 2021; 12,898,144 shares issued and 12,824,190 shares outstanding at March 31, 2021
15 13
Additional paid-in capital
946,278 934,381
Accumulated deficit
(927,447 ) (919,271 )
Treasury stock, at cost; 97,313 shares at September 30, 2021 and 73,954 shares at March 31, 2021
(2,070 ) (1,949 )
Total stockholders’ equity
16,776 13,174
Total liabilities and stockholders’ equity
$ 108,357 $ 106,022

CAPSTONE GREEN ENERGY CORPORATION AND SUBSIDIARIES
CONDENSED CONSOLIDATED STATEMENTS OF OPERATIONS
(In thousands, except per share amounts)
(Unaudited)


Three Months Ended Six Months Ended

September 30, September 30,
2021 2020 2021 2020
Revenue:
Product and accessories
$ 8,465 $ 7,206 $ 16,854 $ 13,812
Parts and service
8,731 7,700 16,424 15,287
Total revenue
17,196 14,906 33,278 29,099
Cost of goods sold:
Product and accessories
8,797 7,347 17,790 14,147
Parts and service
5,689 4,997 10,130 9,017
Total cost of goods sold
14,486 12,344 27,920 23,164
Gross margin
2,710 2,562 5,358 5,935
Operating expenses:
Research and development
987 599 1,870 969
Selling, general and administrative
6,438 4,872 11,762 8,418
Total operating expenses
7,425 5,471 13,632 9,387
Loss from operations
(4,715 ) (2,909 ) (8,274 ) (3,452 )
Other income
(5 ) 11 660 15
Interest income
6 8 11 16
Interest expense
(1,278 ) (1,313 ) (2,513 ) (2,604 )
Gain on debt extinguishment
1,950
Loss before provision for income taxes
(5,992 ) (4,203 ) (8,166 ) (6,025 )
Provision for income taxes
2 9 10 10
Net loss
(5,994 ) (4,212 ) (8,176 ) (6,035 )
Less: Deemed dividend on purchase warrant for common shares
15 15
Net loss attributable to common stockholders
$ (5,994 ) $ (4,227 ) $ (8,176 ) $ (6,050 )

Net loss per common share attributable to common stockholders-basic and diluted
$ (0.40 ) $ (0.38 ) $ (0.58 ) $ (0.56 )
Weighted average shares used to calculate basic and diluted net loss per common share attributable to common stockholders
15,167 11,040 14,202 10,862

CAPSTONE GREEN ENERGY CORPORATION AND SUBSIDIARIES
RECONCILIATION OF NON-GAAP FINANCIAL MEASURES
(In thousands)
(Unaudited)


Three months ended Six months ended
Reconciliation of Reported Net Loss to EBITDA and Adjusted EBITDA
September 30, September 30,
2021 2020 2021 2020
Net loss, as reported
$ (5,994 ) $ (4,212 ) $ (8,176 ) $ (6,035 )
Interest expense
1,278 1,313 2,513 2,604
Provision for income taxes
2 9 10 10
Depreciation and amortization
458 349 844 703
EBITDA
$ (4,256 ) $ (2,541 ) $ (4,809 ) $ (2,718 )
Gain on debt extinguishment
(1,950 )
Additional PPP Loan forgiveness
(660 )
Stock-based compensation and other expense
780 664 1,650 962
Legal settlements
750 750
Adjusted EBITDA
$ (2,726 ) $ (1,877 ) $ (5,019 ) $ (1,756 )

To supplement the company’s unaudited financial data presented on a generally accepted accounting principles (GAAP) basis, management has presented Adjusted EBITDA, a non-GAAP financial measure. This non-GAAP financial measure is among the indicators management uses as a basis for evaluating the company’s financial performance as well as for forecasting future periods. Management establishes performance targets, annual budgets and makes operating decisions based in part upon this metric. Accordingly, disclosure of this non-GAAP financial measure provides investors with the same information that management uses to understand the company’s economic performance year-over-year.

EBITDA is defined as net income before interest, provision for income taxes, and depreciation and amortization expense. Adjusted EBITDA is defined as EBITDA before gain on debt extinguishment, additional PPP loan forgiveness, stock-based compensation and other expense, and legal settlements. Gain on debt extinguishment and additional PPP loan forgiveness relates to the Paycheck Protection Program loan forgiveness. Stock-based compensation and other expense includes expense related to stock issued to employees, directors, and vendors. Legal settlements represents non-recurring legal settlements for employment matters.

Adjusted EBITDA is not a measure of the company’s liquidity or financial performance under GAAP and should not be considered as an alternative to, net income or any other performance measure derived in accordance with GAAP, or as an alternative to cash flows from operating activities as a measure of liquidity.

While management believes that the non-GAAP financial measure provides useful supplemental information to investors, there are limitations associated with the use of this measure. This measure is not prepared in accordance with GAAP and may not be directly comparable to similarly titled measures of other companies due to potential differences in the exact method of calculation. Management compensates for these limitations by relying primarily on the company’s GAAP results and by using Adjusted EBITDA only supplementally and by reviewing the reconciliation of the non-GAAP financial measure to its most comparable GAAP financial measure.

Non-GAAP financial measures are not in accordance with, or an alternative for, generally accepted accounting principles in the United States. The company’s non-GAAP financial measures are not meant to be considered in isolation or as a substitute for comparable GAAP financial measures and should be read only in conjunction with the company’s consolidated financial statements prepared in accordance with GAAP.

CONTACT:
Capstone Green Energy
Investor and investment media inquiries:
818-407-3628
ir@CGRNenergy.com

SOURCE: Capstone Green Energy Corporation

SPACtrac Report – Capstar Special Acquisition Corp: Updated Valuation Still Ready to Go

Published: Tuesday, November 11, 2021

Capstar Special Acquisition Corp: Updated Valuation Still Ready to Go

Gregory Aurand, Senior Research Analyst, Healthcare Services & Medical Devices, Noble Capital Markets, Inc.

Refer to end of report for Analyst Certification & Disclosures

Updated acquisition terms. Gelesis, Inc. will be brought public when they merge with publicly traded Capstar Special Acquisition Corp. (CPSR). The combination value was revised at the agreement of both companies. See Stock Overview and Valuation section in this report for updated details. The deal is expected to close late November or early December with an approximate $756 million enterprise value transaction.

No change in fundamentals. The revision in valuation consideration for the merged company does not change the fundamental projected outlook. Please see our initiation SPACtrac Report dated November 9, 2021.

An approved FDA product targeting a large population with global opportunities. The overweight and obese are at epidemic levels in the U.S. and are a growing crisis globally. Plenity is a novel FDA approved weight management aid that has an addressable market of 150 million in the U.S. alone. The initial focus will be the U.S. market but Plenity also has CE Mark enabling it to be marketed in Europe and other markets. In addition, the company has a strategic partnership to commercialize Plenity in China with potential milestones and royalties. Outside U.S. revenues are expected to contribute 30% of 2023 revenues.

Manufacturing coming on-line for full launch. Gelesis conducted a highly successful beta launch this past year. With lines of manufacturing coming on-line in late 2021 and 2022, the company is prepared to meet initial and future demand with scalable capacity. Given expected demand, the company looks to be EBITDA positive in 2023.

Valuation looks very attractive. At current levels, and based on the new enterprise value, shares trade about 1.7x Enterprise Value to 2023 guided Revenues, a substantial 50% discount to the Health & Wellness Consumer and DTC peers. If the shares were to trade in-line with the median of its peers, the revised target value would be $18 per share. As Gelesis is approaching the weight management market in a very different way, a case could be made for an expanded group of comparables that would suggest an even higher current valuation.

Stock Overview and Valuation

Given recent softness in the SPAC market seen by CPSR, and high redemptions in completed de-SPACs, both companies agreed to reduce the valuation and filed an amendment updating the terms.  The updated valuation reflects a lower total share count, lower enterprise value and a lower upfront percentage ownership by existing Gelesis shareholders. While upfront valuation is lower, existing Gelesis holders see an increase in earn-out shares.

As indicated in Figure #1 below, the prior pro forma valuation translated into an 8% ownership of the new company for the PIPE investors. The PIPE investors include PIMCO, Pritzker Vlock Family Office, Chinese Medical Systems and co-founder PureTech Health. The $276 million held-in-trust provided from Capstar public holders translated into a 20% ownership and Capstar Sponsors would have owned about 4% of the company.  Gelesis shareholders had about 69% of the new company with 131.8 million shares and a $964 million enterprise value valuation. 

Figure #1 Prior pro forma valuation

Source: Company reports and Noble Research estimates

Figure #2 below shows the updated pro forma ownership with an enterprise value of $756 million.  The PIPE investors will now have a slightly increased 8% stake in the new company, the Capstar public holders with $276 million held-in-trust will have a 24% ownership, and Capstar Sponsors retain a 4% ownership.  Gelesis holders, given the lower number of stock consideration shares will now have an upfront 64% stake.

Figure #2 Revised pro forma valuation


Source: Company reports and Noble Research estimates

As part of the revised transaction, and substantially offsetting the lower upfront share valuation for Gelesis holders, the earn-out shares were increased (Figure #3). Rather than the prior 15 million shares in 5 million share earn-out increments issued to existing Gelesis shareholders when the stock price reaches $12.50, $15.00, and $17.50 per share, the new earn-out shares are equal installments of 7.83 million shares at the same stock price points for a total of 23.48 million shares.

Figure #3 Increased earn-out shares


Source: Company reports and Noble Research estimates

Total share consideration for the deal was formerly 146.8 million including the 15 million earn-out shares, and is now 134.48 million shares including the 23.48 million earn-out shares.

The newly formed company, as indicated in the previous report, is expected to be listed on the NYSE and trade under the ticker “GLS”.  Based on the new valuation consideration, there will be an estimated 111 million shares outstanding following the combination with CPSR.

The following Figure #4 provides an extensive list of health and wellness peer comparables, and an expanded list incorporating disruptive healthcare and consumer subscription companies.  The valuations provided for CPSR/Gelesis are based on the guided revenues and cash provided.  At current levels, shares trade about 1.7x Enterprise Value to 2023 guided Revenues, a substantial 50% discount to the median Health & Wellness Consumer and DTC peers (excluding INMD outlier). If the shares were to trade in-line with the median of its peers, the target value would be $18.00 per share.  If shares traded at the mean of its peers, the target value would be $23.00. As Gelesis is marketing to the weight management market in a very different and disruptive approach, a case could be made for using the expanded group of Disruptive Healthcare and Consumer Subscription comparables that would suggest an even higher current valuation.

Figure #4 Valuation comparables

GENERAL DISCLAIMERS

All statements or opinions contained herein that include the words “we”, “us”, or “our” are solely the responsibility of Noble Capital Markets, Inc.(“Noble”) and do not necessarily reflect statements or opinions expressed by any person or party affiliated with the company mentioned in this report. Any opinions expressed herein are subject to change without notice. All information provided herein is based on public and non-public information believed to be accurate and reliable, but is not necessarily complete and cannot be guaranteed. No judgment is hereby expressed or should be implied as to the suitability of any security described herein for any specific investor or any specific investment portfolio. The decision to undertake any investment regarding the security mentioned herein should be made by each reader of this publication based on its own appraisal of the implications and risks of such decision.

This publication is intended for information purposes only and shall not constitute an offer to buy/sell or the solicitation of an offer to buy/sell any security mentioned in this report, nor shall there be any sale of the security herein in any state or domicile in which said offer, solicitation or sale would be unlawful prior to registration or qualification under the securities laws of any such state or domicile. This publication and all information, comments, statements or opinions contained or expressed herein are applicable only as of the date of this publication and subject to change without prior notice. Past performance is not indicative of future results.

Noble accepts no liability for loss arising from the use of the material in this report, except that this exclusion of liability does not apply to the extent that such liability arises under specific statutes or regulations applicable to Noble. This report is not to be relied upon as a substitute for the exercising of independent judgement. Noble may have published, and may in the future publish, other research reports that are inconsistent with, and reach different conclusions from, the information provided in this report. Noble is under no obligation to bring to the attention of any recipient of this report, any past or future reports. Investors should only consider this report as single factor in making an investment decision.

IMPORTANT DISCLOSURES

This publication is confidential for the information of the addressee only and may not be reproduced in whole or in part, copies circulated, or discussed to another party, without the written consent of Noble Capital Markets, Inc. (“Noble”). Noble seeks to update its research as appropriate, but may be unable to do so based upon various regulatory constraints. Research reports are not published at regular intervals; publication times and dates are based upon the analyst’s judgement. Noble professionals including traders, salespeople and investment bankers may provide written or oral market commentary, or discuss trading strategies to Noble clients and the Noble proprietary trading desk that reflect opinions that are contrary to the opinions expressed in this research report.

The majority of companies that Noble follows are emerging growth companies. Securities in these companies involve a higher degree of risk and more volatility than the securities of more established companies. The securities discussed in Noble research reports may not be suitable for some investors and as such, investors must take extra care and make their own determination of the appropriateness of an investment based upon risk tolerance, investment objectives and financial status.

Company Specific Disclosures

The following disclosures relate to relationships between Noble and the company (the “Company”) covered by the Noble Research Division and referred to in this research report.

Company Specific Disclosures

The following disclosures relate to relationships between Noble and the company (the “Company”) covered by the Noble Research Division and referred to in this research report.

The SPAC Company in this report is a participant in the Company Sponsored Research Program (CSRP); Noble receives compensation from the Company for such participation. No part of the CSRP compensation was, is, or will be directly or indirectly related to any specific recommendations or views expressed by the analyst in this research report.

Noble is not a market maker in any of the companies mentioned in this report. Noble intends to seek compensation for investment banking services and non-investment banking services (securities and non-securities related) with any or all of the companies mentioned in this report within the next 3 months

WARNING

This report is intended to provide general securities advice, and does not purport to make any recommendation that any securities transaction is appropriate for any recipient particular investment objectives, financial situation or particular needs. Prior to making any investment decision, recipients should assess, or seek advice from their advisors, on whether any relevant part of this report is appropriate to their individual circumstances. If a recipient was referred to Noble Capital Markets, Inc. by an investment advisor, that advisor may receive a benefit in respect of transactions effected on the recipients behalf, details of which will be available on request in regard to a transaction that involves a personalized securities recommendation. Additional risks associated with the security mentioned in this report that might impede achievement of the target can be found in its initial report issued by Noble Capital Markets, Inc.. This report may not be reproduced, distributed or published for any purpose unless authorized by Noble Capital Markets, Inc.

RESEARCH ANALYST CERTIFICATION

Independence Of View
All views expressed in this report accurately reflect my personal views about the subject securities or issuers.

Receipt of Compensation
No part of my compensation was, is, or will be directly or indirectly related to any specific recommendations or views expressed in the public
appearance and/or research report.

Ownership and Material Conflicts of Interest
Neither I nor anybody in my household has a financial interest in the securities of the subject company or any other company mentioned in this report.

NOBLE RATINGS DEFINITIONS % OF SECURITIES COVERED % IB CLIENTS
Outperform: potential return is >15% above the current price 95% 33%
Market Perform: potential return is -15% to 15% of the current price 5% 2%
Underperform: potential return is >15% below the current price 0% 0%

NOTE: On August 20, 2018, Noble Capital Markets, Inc. changed the terminology of its ratings (as shown above) from “Buy” to “Outperform”, from “Hold” to “Market Perform” and from “Sell” to “Underperform.” The percentage relationships, as compared to current price (definitions), have remained the same.

Additional information is available upon request. Any recipient of this report that wishes further information regarding the subject company or the disclosure information mentioned herein, should contact Noble Capital Markets, Inc. by mail or phone.

Noble Capital Markets, Inc.
150 East Palmetto Park Rd., Suite 110
Boca Raton, FL 33432
561-994-1191

Noble Capital Markets, Inc. is a FINRA (Financial Industry Regulatory Authority) registered broker/dealer.
Noble Capital Markets, Inc. is an MSRB (Municipal Securities Rulemaking Board) registered broker/dealer.
Member – SIPC (Securities Investor Protection Corporation)

Report ID: 24235

Vectrus (VEC) – Overall Strong 3Q21 Results

Thursday, November 11, 2021

Vectrus (VEC)
Overall Strong 3Q21 Results

Vectrus Inc is a U.S.-based company that provides services to the U.S. government. It operates as one segment and offer facility and logistics services and information technology and network communications services. The information technology and network communications capabilities consist of communications systems operations and maintenance, management and service support, systems installation and activation, system-of-systems engineering and software development, and mission support for the department of defense. The facility and logistics service include airfield management, ammunition management, civil engineering, communications, emergency services, life support activities, public works, security, transportation operations and others.

Joe Gomes, Senior Research Analyst, Noble Capital Markets, Inc.

Joshua Zoepfel, Research Associate, Noble Capital Markets, Inc.

Refer to the full report for the price target, fundamental analysis, and rating.

    3Q21 Results. Vectrus’ 3Q21 revenue was $459.4 million, up 30.4% y-o-y, with organic growth of 13%. Adjusted EBITDA was $20.5 million, up from $17.0 million last year. EPS was $0.87 compared to $0.88, while adjusted EPS was $1.15 in 3Q21 versus $0.89 last year. We had forecast revenue of $434 million, adjusted EBITDA of $19.1 million, and EPS of $0.79.

    INDOPACOM.  Vectrus is beginning to see the positive impact of the INDOPACOM AOR. The Company recently received an 8-year contract in the Philippines and recently completed the pre-transition site survey for the Kwajalein task order. Revenue from Asia jumped 686.3% to $21.9 million in the quarter, with INDOPACOM accounting for approximately 5% of overall revenue, up from 1% in the same period last …


This research is provided by Noble Capital Markets, Inc., a FINRA and S.E.C. registered broker-dealer (B/D).

*Analyst certification and important disclosures included in the full report. NOTE: investment decisions should not be based upon the content of this research summary.  Proper due diligence is required before making any investment decision. 

QuoteMedia Inc. (QMCI) – More Fish Appear To Be Nibbling

Thursday, November 11, 2021

QuoteMedia Inc. (QMCI)
More Fish Appear To Be Nibbling

QuoteMedia, based in Fountain Hills, Arizona, provides cloud-based financial data, market news feeds, and financial software solutions.  Its customers include financial service companies, online brokerages, clearing firms, banks, media portals, public corporations and individual investors.  The company provides a single source solution providing products such as streaming quotes, charting, historical data, technical analysis, news and research.  Information can customized and provided to multiple platforms including terminals and mobile devices.

Michael Kupinski, Director of Research, Noble Capital Markets, Inc.

Refer to the full report for the price target, fundamental analysis, and rating.

    Close enough. Total Q3 revenue increased a solid 21.6% to $3.819 million, compared with our $3.940 million estimate. Each of the company’s segments were a hair below our estimates, with its Individual Quotestream segment having the largest variance, with revenues of $0.571 million compared with our $0.625 million estimate. Adjusted EBITDA increased a strong 99% to $540,000, slightly below our estimate of $575,000.

    Gross margin expansion was deceiving.  Q3 gross margins were 46.8% compared with 45.7% in the year earlier quarter, but reflected non-recurring credits which benefited margins over 200 basis points. While gross margins should increase as revenues grow, margin expansion will be influenced by product mix. We assume base gross margins of 44% …


This Company Sponsored Research is provided by Noble Capital Markets, Inc., a FINRA and S.E.C. registered broker-dealer (B/D).

*Analyst certification and important disclosures included in the full report. NOTE: investment decisions should not be based upon the content of this research summary.  Proper due diligence is required before making any investment decision. 

PDS Biotechnology Corp (PDSB) – 3Q21 Contained Clinical Progress and New Product Licenses

Thursday, November 11, 2021

PDS Biotechnology Corp (PDSB)
3Q21 Contained Clinical Progress and New Product Licenses

PDS Biotechnology Corp operates as a clinical stage biotechnology company, principally involved in drug discovery in the United States. It is primarily engaged in the treatment of various early-stage and late-stage cancers, including head and neck cancer, prostate cancer, breast cancer, cervical cancer, anal cancer, and other cancers. Its products are based on the proprietary Versamune platform technology, which activates and directs the human immune system to unleash a powerful and targeted attack against cancer cells.

Robert LeBoyer, Senior Research Analyst, Noble Capital Markets, Inc.

Refer to the full report for the price target, fundamental analysis, and rating.

    PDS Biotechnology reported 3Q21 loss of $6.9 million or $(0.24) per share, compared with our estimated loss of $6.1 million or $(0.21) per share. The company held a conference call in which it reviewed two licensing agreements announced earlier in November 2021. These products advance the pipeline and broaden the development of products that use the Versamune technology. Cash balance at the end of the quarter was $69.7 million.

    PDS0102 Reached A Development Milestone PDS0102 has been in preclinical testing for prostate cancer, breast cancer, and acute myeloid leukemia (AML) using the TARP antigen with the Versamune platform.  Based on its strong results, PDS made a license agreement with the NCI (National Cancer Institute) that gives the company rights to NCI’s intellectual property related to the antigen. The license …


This Company Sponsored Research is provided by Noble Capital Markets, Inc., a FINRA and S.E.C. registered broker-dealer (B/D).

*Analyst certification and important disclosures included in the full report. NOTE: investment decisions should not be based upon the content of this research summary.  Proper due diligence is required before making any investment decision. 

One Stop Systems (OSS) – 3Q Results Exceed Expectations Record 3Q Revenue

Thursday, November 11, 2021

One Stop Systems (OSS)
3Q Results Exceed Expectations; Record 3Q Revenue

One Stop Systems Inc is US-based company which is principally engaged in designing, manufacturing, marketing high-end systems for high performance computing (HPC) applications. The company offers custom servers, compute accelerators, solid-state storage arrays and system expansion systems. The product line of the company includes GPU Appliances, GPU Expansion, GPUs and co-processors, Flash storage arrays, Flash storage expansion, Servers, Disk Arrays, Desktop computing appliances, accessories and parts. The company delivers high-end technology to customers through the sale of equipment and software for use on their premises or through remote cloud access to secure data centres housing technology.

Joe Gomes, Senior Research Analyst, Noble Capital Markets, Inc.

Joshua Zoepfel, Research Associate, Noble Capital Markets, Inc.

Refer to the full report for the price target, fundamental analysis, and rating.

    3Q21 Results. Record third quarter revenue of $16.0 million, up 23% y-o-y and up 7% sequentially. We had forecast $15.9 million. GAAP net income of $981,000, or $0.05 per share, versus $858,000, or $0.05 per share, last year. Adjusted net income of $1.5 million, or $0.08 per share, versus $1.2 million, or $0.07 per share in 3Q20. We had forecast $0.02 and $0.05 respectively.

    Bressner, Disguise Drive Results.  Bressner revenue rose 60% y-o-y contributing a record $6.7 million in the quarter, driven by an expanded European customer base. Disguise contributed $3.2 million to revenue in the quarter, quadrupling from a low of $800,000 in the year ago quarter. The majority of Disguise revenue was from sales of the new virtual products. The return to live events should be …


This Company Sponsored Research is provided by Noble Capital Markets, Inc., a FINRA and S.E.C. registered broker-dealer (B/D).

*Analyst certification and important disclosures included in the full report. NOTE: investment decisions should not be based upon the content of this research summary.  Proper due diligence is required before making any investment decision. 

InPlay Oil (IPOOF)(IPO:CA) – Operations Hitting On All Cylinders Price Target Raised

Thursday, November 11, 2021

InPlay Oil (IPOOF)(IPO:CA)
Operations Hitting On All Cylinders, Price Target Raised

As of April 24, 2020, Noble Capital Markets research on InPlay Oil is published under ticker symbols (IPOOF and IPO:CA). The price target is in USD and based on ticker symbol IPOOF. Research reports dated prior to April 24, 2020 may not follow these guidelines and could account for a variance in the price target. InPlay Oil is a junior oil and gas exploration and production company with operations in Alberta focused on light oil production. The company operates long-lived, low-decline properties with drilling development and enhanced oil recovery potential as well as undeveloped lands with exploration possibilities. The common shares of InPlay trade on the Toronto Stock Exchange under the symbol IPO and the OTCQZ Exchange under the symbol IPOOF.

Michael Heim, Senior Research Analyst, Noble Capital Markets, Inc.

Refer to the full report for the price target, fundamental analysis, and rating.

    InPlay reported 2021-3Q results that surpassed almost every expectation. Production volumes of 6,011 BOE/day (up 61% yoy) beat our 5,932 BOE/day estimate. Realized oil prices of C$75.82/bbl and gas prices of C$3.89/mcf topped our C$73.14/bbl and C$3.18/mcf estimates. Higher prices resulted in strong cash flow results because several lower-priced oil and gas hedges rolled off after the second quarter. Adjusted fund flow of $15.6 million (up 680%) surpassed our $13.2 million est. Adjusted free fund flow (which subtracts off capital expenditures) was $5.1 million versus $1.6 million, in line with our estimate even as the company expanded its drilling program. EPS was $0.12 versus $(0.04) ahead of our $0.09 est. due to strong operating results.

    Prairie Storm acquisition looks like a winner.  On September 28th, InPlay announced the acquisition of Prairie Storm for C$40.5 million to be paid with 8.3 million common shares and cash. The acquisition expands InPlay’s Cardium play and is immediately accretive to earnings and cash flow at current energy prices. The acquisition brings InPlay an immediate production and cash flow boost as well as a …


This Company Sponsored Research is provided by Noble Capital Markets, Inc., a FINRA and S.E.C. registered broker-dealer (B/D).

*Analyst certification and important disclosures included in the full report. NOTE: investment decisions should not be based upon the content of this research summary.  Proper due diligence is required before making any investment decision. 

Gevo (GEVO) – Quarterly Losses Mask Solid Development Plan Progress

Thursday, November 11, 2021

Gevo (GEVO)
Quarterly Losses Mask Solid Development Plan Progress

Gevo Inc is a renewable chemicals and biofuels company engaged in the development and commercialization of alternatives to petroleum-based products based on isobutanol produced from renewable feedstocks. Its operating segments are the Gevo segment and the Gevo Development/Agri-Energy segment. By its segments, it is involved in research and development activities related to the future production of isobutanol, including the development of its biocatalysts, the production and sale of biojet fuel, its Retrofit process and the next generation of chemicals and biofuels that will be based on its isobutanol technology. Gevo Development/Agri-Energy is the key revenue generating segment which involves the operation of the Luverne Facility and production of ethanol, isobutanol and related products.

Poe Fratt, Senior Research Analyst, Noble Capital Markets, Inc.

Refer to the full report for the price target, fundamental analysis, and rating.

    EBITDA losses continued in 3Q2021.  Given the early stage of development of the renewable fuels concept, it isn’t surprising that EBITDA was negative $9.3 million and EBITDA losses expected into late next year. Cash declined to $522 million from $567 million in 2Q2021 due to the quarterly cash burn, capex for longer lead time equipment and the acquisition of patents from Butamax.

    Contract portfolio unchanged, but development pipeline continues to expand and new large contracts appear on the horizon.  While the contracted portfolio remains 54 MGPY, or ~$1.6 billion, the size of the potential CVX commitment approaches 150MGPY. New contracts should fill up Net Zero Two capacity and co-locating it with Net Zero One might also leverage plant infrastructure …


This Company Sponsored Research is provided by Noble Capital Markets, Inc., a FINRA and S.E.C. registered broker-dealer (B/D).

*Analyst certification and important disclosures included in the full report. NOTE: investment decisions should not be based upon the content of this research summary.  Proper due diligence is required before making any investment decision.