Allegiant Gold (AUXXF)(AUAU:CA) – Eastsides Growing Resource Potential

Tuesday, November 16, 2021

Allegiant Gold (AUXXF)(AUAU:CA)
Eastside’s Growing Resource Potential

Allegiant Gold is a mid-stage exploration stage company with 10 highly prospective projects in the southwest United States, including 7 projects in the State of Nevada. Allegiant’s flagship project is Eastside, a district-scale project in Nevada with inferred resources of 1.4 million gold and 8.8 million silver ounces of inferred resources and significant potential to add size and scale. The company’s shares trade on the TSX Venture Exchange under the ticker symbol “AUAU” and on the OTCQX under the ticker symbol “AUXXF.”

Mark Reichman, Senior Research Analyst of Natural Resources, Noble Capital Markets, Inc.

Refer to the full report for the price target, fundamental analysis, and rating.

    Preparation for upcoming drilling. Allegiant Gold has started road construction in and around the recently discovered high-grade zone within the western edge of the original pit zone at its Eastside gold deposit near Tonopah, Nevada. Roads will also be built in and around areas to the east and west of the original pit zone to test additional targets.

    Drilling could commence as early as December.  Allegiant has already provisioned drilling contractors and equipment. Plans include drilling up to 9 diamond core holes to define the high-grade areas discovered during the most recent drill program that ended in April. Recall Holes 239, 243, 244 and 245 returned strong gold intercepts. For example, Hole 243 returned 2.55 grams of gold per tonne over …


This Company Sponsored Research is provided by Noble Capital Markets, Inc., a FINRA and S.E.C. registered broker-dealer (B/D).

*Analyst certification and important disclosures included in the full report. NOTE: investment decisions should not be based upon the content of this research summary.  Proper due diligence is required before making any investment decision. 

Release – Euroseas Ltd. Reports Results for the Nine-Month Period and Quarter Ended September 30 2021


Euroseas Ltd. Reports Results for the Nine-Month Period and Quarter Ended September 30, 2021


ATHENS, Greece, Nov. 16, 2021 (GLOBE NEWSWIRE) — Euroseas Ltd. (NASDAQ: ESEA, the “Company” or “Euroseas”), an owner and operator of container carrier vessels and provider of seaborne transportation for containerized cargoes, announced today its results for the three- and nine-month periods ended September 30, 2021.

Third Quarter 2021 Financial Highlights:

  • Total net revenues of $23.0 million. Net income and net income attributable to common shareholders of $8.5 million or $1.18 and $1.17 earnings per share basic and diluted, respectively. Adjusted net income attributable to common shareholders1 for the period was $8.4 million or $1.16 per share basic and diluted.

  • Adjusted EBITDA1 was $10.6 million.

  • An average of 14.0 vessels were owned and operated during the third quarter of 2021 earning an average time charter equivalent rate of $19,482 per day.

Nine Months 2021 Financial Highlights:

  • Total net revenues of $55.6 million. Net income of $20.2 million; net income attributable to common shareholders (after a $0.3 million dividend on Series B Preferred Shares and a $0.3 million of preferred deemed dividend arising out of the redemption of approximately $8.4 million of Series B Preferred Shares in the first half of 2021) of $19.6 million or $2.84 and $2.82 earnings per share basic and diluted, respectively. Adjusted net income attributable to common shareholders1 for the period was $19.1 million or $2.76 and $2.74 per share basic and diluted, respectively.

  • Adjusted EBITDA1 was $26.6 million.

  • An average of 14.0 vessels were owned and operated during the first nine months of 2021 earning an average time charter equivalent rate of $15,478 per day.

Recent developments

  • As previously announced, M/V Jonathan P (a 1,740 teu container feeder vessel built in 2006), was delivered to the Company in October 2021. Within the same period, the Company drew a loan of $15 million with M/V Jonathan P used as collateral. The loan will be repaid in twelve quarterly installments of $1.1 million each, followed by a balloon payment of $1.8 million. Upon delivery to the Company, the vessel commenced a three-year charter at a net rate of $26,662 per day.

  • On November 11, 2021, the Company announced the acquisition of M/V Leo Paramount (to be renamed M/V Marcos V), a 6,350 teu containership build in 2005, for $40 million. The vessel, which is expected to be delivered to the Company within 2021, will be financed by own funds and a bank loan. Contemporaneously with the acquisition, the vessel will enter into a three-year time charter contract at a daily rate of $42,200 with a possible extension for an additional (fourth) year at the option of the charterer at $15,000 per day.

  • The Company is in the final stage of documentation of a $16.5 million “top-up”/second lien loan over the loan collateralized by its four “Synergy” vessels with the same bank.

1Adjusted EBITDA, Adjusted net income and Adjusted earnings per share are not recognized measurements under U.S. GAAP (GAAP) and should not be used in isolation or as a substitute for Euroseas financial results presented in accordance with GAAP. Refer to a subsequent section of the Press Release for the definitions and reconciliation of these measurements to the most directly comparable financial measures calculated and presented in accordance with GAAP.

Aristides Pittas, Chairman and CEO of Euroseas commented:
“Containership charter rates during the third quarter reached new record highs propelled by strong demand for and limited supply of vessels coupled with increased inefficiency of the worldwide transportation system. Indeed, long lines of vessels waiting to enter are being observed outside ports the world over. In the latter part of October and early November, certain indices that track the market have retracted from their high levels but it is questionable whether this reflects easing of the tightness of the market or lack of transactions as most vessels are committed.

On the supply side, while the orderbook ranks have been filling up, the majority of the deliveries are scheduled for the second half of 2023 onwards. Thus, over the next couple of years, especially during 2022, we believe that fleet growth will remain modest and provide us with opportunities to re-charter our vessels at very attractive rate levels. In addition, incremental regulatory requirements coming in effect in 2023/2024 will further restrict the effective supply of vessels and assist in absorbing increased new deliveries. We expect our profitability to increase alongside with increased visibility of our earnings which now extends well into 2023, especially following our recent acquisition of M/V Leo Paramount, a 6,350 teu vessel, which we chartered for a minimum of three years at $42,200/day, with an optional one-year extension at $15,000/day.

This latest acquisition reaffirms our strategy to grow Euroseas to a long term participant in the feeder/intermediate containership segment, a strategy further supported by our newbuilding program with our two 2,800 teu vessels scheduled for delivery in the first half of 2023. We are committed to grow with accretive transactions that minimize market and other risks, maximize returns and generate rewards to our shareholders, especially, as our earnings accumulation rate increases during the fourth quarter of 2021 due partly to the $202,000 per day charter rate earned by one of our vessels.”

Tasos Aslidis, Chief Financial Officer of Euroseas commented:
“The results of the third quarter of 2021 reflect the significantly higher time charter rates our vessels earned in the third quarter of 2021, compared to the corresponding period of 2020 although the Company operated an average of 14.0 vessels, versus 16.52 vessels during the same period last year. Our net revenues increased to $23.0 million in the third quarter of 2021 compared to $12.3 million during the same period of last year. On a per-vessel-per-day basis, our vessels earned a 131.8% higher average charter rate in the third quarter of 2021 as compared to the same period of 2020. At the same time, total daily vessel operating expenses, including management fees, general and administrative expenses but excluding drydocking costs, during the third quarter of 2021, averaged $7,321 per vessel per day, as compared to $6,759 for the same period of last year and $7,033 per vessel per day for the first nine months of 2021 as compared to $6,234 per vessel per day for the same period of 2020. The increased operating expenses for the third quarter of 2021 are mainly attributable to the increased hull and machinery insurance premiums and the increased crewing costs for our vessels resulting from difficulties in crew rotation due to COVID-19 related restrictions.

Adjusted EBITDA during the third quarter of 2021 was $10.6 million versus $1.2 million in the third quarter of last year, and it reached $26.6 million versus $9.7 million for the respective nine-month periods of 2021 and 2020.

As of September 30, 2021, our outstanding debt (excluding the unamortized loan fees) was $59.7 million versus restricted and unrestricted cash of $10.2 million. As of the same date, our scheduled debt repayments over the next 12 months amounted to about $15.0 million (excluding the unamortized loan fees).”

Third Quarter 2021 Results:
For the third quarter of 2021, the Company reported total net revenues of $23.0 million representing a 86.9% increase over total net revenues of $12.3 million during the third quarter of 2020 which was the result of the higher average charter rates our vessels earned in the third quarter of 2021 compared to the corresponding period of 2020, partly offset by the lower average number of vessels operating in the third quarter of 2021. The Company reported net income and net income attributable to common shareholders for the period of $8.5 million, as compared to a net income of $0.2 million and a net income attributable to common shareholders of $0.03 million, respectively, for the third quarter of 2020. Related party management fees for the three months ended September 30, 2021 were $1.1 million compared to $1.4 million for the same period of 2020. The decrease is due to the lower average number of vessels operated by the Company in the third quarter of 2021 as compared to the same period of 2020. Depreciation expense remained unchanged at $1.6 million for both the third quarter of 2021 and 2020. Although the average number of vessels operating in the third quarter of 2021 decreased to 14.0 as compared to 16.52 for the same period of 2020, the new mix of vessels, taking into account the new vessels acquired at the end of 2019, has a higher average daily depreciation charge as a result of their higher initial values (acquisition price) compared to the remaining vessels.

Vessel operating expenses for the same period of 2021 amounted to $7.6 million as compared to $8.2 million for the same period of 2020. The decreased amount is mainly due to the lower number of vessels owned and operated in the three months of 2021 compared to the same period of 2020, partly offset by the increased crewing costs for our vessels compared to the same period of 2020, resulting from difficulties in crew rotation due to COVID-19 related restrictions and the increase in hull and machinery insurance premiums.

On average, 14.0 vessels were owned and operated during the third quarter of 2021 earning an average time charter equivalent rate of $19,482 per day compared to 16.52 vessels in the same period of 2020 earning on average $8,403 per day.

Interest and other financing costs for the third quarter of 2021 amounted to $0.6 million compared to $0.9 million for the same period of 2020. This decrease is due to the decreased amount of debt and decrease in the weighted average LIBOR rate in the current period compared to the same period of 2020.

Adjusted EBITDA1 for the third quarter of 2021 was $10.6 million compared to $1.2 million achieved during the third quarter of 2020.

Basic and diluted earnings per share attributable to common shareholders for the third quarter of 2021 was $1.18 and $1.17 calculated on 7,198,991 and 7,241,740 basic and diluted weighted average number of shares outstanding, respectively, compared to basic and diluted earnings per share of $0.01 for the third quarter of 2020, calculated on 5,708,610 basic and diluted weighted average number of shares outstanding.

Excluding the effect on the income attributable to common shareholders for the quarter of the unrealized gain on derivative, the adjusted earnings attributable to common shareholders for the quarter ended September 30, 2021 would have been $1.16 per share basic and diluted, respectively, compared to an adjusted loss of $0.26 per share basic and diluted for the quarter ended September 30, 2020, after excluding unrealized loss on derivative and net gain on sale of vessels. Usually, security analysts do not include the above item in their published estimates of earnings per share.

Nine Months 2021 Results:
For the first nine months of 2021, the Company reported total net revenues of $55.6 million representing a 34.8% increase over total net revenues of $41.3 million during the first nine months of 2020, as a result of the higher average charter rates our vessels earned in the first nine months of 2021 compared to the corresponding period of 2020. The Company reported a net income for the period of $20.2 million and a net income attributable to common shareholders of $19.6 million, as compared to a net income of $3.5 million and a net income attributable to common shareholders of $2.9 million for the first nine months of 2020. The results for the first nine months of 2021 include a $0.6 million unrealized gain on derivative. The results for the first nine months of 2020 include a $1.3 million net gain on sale of vessels, $1.5 million of amortization of below market time charters acquired, a $0.1 million loss on write down of vessel held for sale and a $0.6 million unrealized loss on derivative. Related party management fees for the nine months ended September 30, 2021 were $3.2 million compared to $4.0 million for the same period of 2020. Depreciation expense for the first nine months of 2021 was $4.8 million compared to $5.0 million during the same period of 2020. The decrease in related party management fees and depreciation expense is due to the lower average number of vessels operated by the Company in the first nine months of 2021 as compared to the same period of 2020.

Vessel operating expenses for the same period of 2021 amounted to $21.4 million as compared to $24.7 million for the same period of 2020. The decreased amount is mainly due to the lower number of vessels owned and operated in the nine months of 2021 compared to the same period of 2020, partly offset by the increased supply of stores, the increased crewing costs for our vessels compared to the same period of 2020, resulting from difficulties in crew rotation due to COVID-19 related restrictions and the increase in hull and machinery insurance premiums.

Drydocking expenses amounted to $2.9 million for the nine months of 2021 (two vessels passed their special survey with drydock), compared to $0.4 million for the same period of 2020 (one vessel passed its intermediate survey in-water and two vessels their special survey in-water).

On average, 14.0 vessels were owned and operated during the first nine months of 2021 earning an average time charter equivalent rate of $15,478 per day compared to 18.17 vessels in the same period of 2020 earning on average $9,171 per day.

Interest and other financing costs for the first nine months of 2021 amounted to $2.0 million compared to $3.3 million for the same period of 2020. This decrease is due to the decreased amount of debt and the decreased Libor rates of our bank loans in the current period compared to the same period of 2020.

Adjusted EBITDA1 for the first nine months of 2021 was $26.6 million compared to $9.7 million during the first nine months of 2020.

Basic and diluted earnings per share attributable to common shareholders for the first nine months of 2021 were $2.84 and $2.82, calculated on 6,898,195 and 6,942,614 basic and diluted weighted average number of shares outstanding, respectively, compared to basic and diluted earnings per share of $0.52 for the first nine months of 2020, calculated on 5,621,159 basic and diluted weighted average number of shares outstanding.

Excluding the effect on the income attributable to common shareholders for the first nine months of 2021 of the unrealized gain on derivative and the net loss on sale of vessel, the adjusted earnings per share attributable to common shareholders for the nine-month period ended September 30, 2021 would have been $2.76 and $2.74 basic and diluted, respectively, compared to adjusted earnings of $0.15 per share basic and diluted for the same period in 2020, after excluding unrealized loss on derivative, net gain on sale of vessels, amortization of below market time charters acquired and loss on write down of vessel held for sale. As mentioned above, usually, security analysts do not include the above items in their published estimates of earnings per share.

Fleet Profile:

After the delivery of M/V Leo Paramount, the Euroseas Ltd. fleet profile will be as follows:

Name

Type

Dwt

TEU

Year Built

Employment(*)

TCE Rate ($/day)

Container Carriers

LEO PARAMOUNT (to be renamed MARCOS V)

Intermediate

72,968

6,350

2005

TC until Dec-24
plus 12 months option

$42,200
option $15,000

AKINADA BRIDGE(*)

Intermediate

71,366

5,610

2001

TC until Oct-22

$20,000

SYNERGY BUSAN(*)

Intermediate

50,726

4,253

2009

TC until Aug-24

$25,000

SYNERGY ANTWERP(*)

Intermediate

50,726

4,253

2008

TC until Sep-23

$18,000

SYNERGY OAKLAND(*)

Intermediate

50,787

4,253

2009

TC until Dec-21

$202,000

SYNERGY KEELUNG (+)

Intermediate

50,969

4,253

2009

TC until Jun-22 plus 8-12 months option

$11,750;
option $14,500

EM KEA (*)

Feeder

42,165

3,100

2007

TC until May-23

$22,000

EM ASTORIA (+)

Feeder

35,600

2,788

2004

TC until Feb-22

$18,650

EM CORFU(+)

Feeder

34,654

2,556

2001

TC until Nov-21 then repositioning trip to drydock

$10,200
$5,125 for up to 37 days ($35,000 if more than 37 days)

EVRIDIKI G (+)

Feeder

34,677

2,556

2001

TC until Jan-22

$15,500

DIAMANTIS P. (*)

Feeder

30,360

2,008

1998

TC until Oct-24

$27,000

EM SPETSES(*)

Feeder

23,224

1,740

2007

TC until Aug-24

$29,500

JONATHAN P(*)

Feeder

23,351

1,740

2006

TC until Sep-24

$26,662(**)

EM HYDRA(*)

Feeder

23,351

1,740

2005

TC until Apr-23

$20,000

JOANNA(*)

Feeder

22,301

1,732

1999

TC until Oct-22

$16,800

AEGEAN EXPRESS(*)

Feeder

18,581

1,439

1997

TC until Mar-22

$11,500

Total Container Carriers

16

635,806

50,371

Vessels under construction

Type

Dwt

TEU

To be delivered

H4201

Feeder

37,237

2,800

Q1 2023

H4202

Feeder

37,237

2,800

Q2 2023

Notes:
(*) TC denotes time charter. Charter duration indicates the earliest redelivery date; all dates listed are the earliest redelivery dates under each TC unless the contract rate is lower than the current market rate in which cases the latest redelivery date is assumed; vessels with the latest redelivery date shown are marked by (+).
(**) Rate is net of commissions (which are typically 5-6.25%)

Summary Fleet Data:

Three Months, Ended
September 30, 2020

Three Months, Ended
September 30, 2021

Nine Months, Ended
September 30, 2020

Nine Months, Ended
September 30, 2021

FLEET DATA

Average number of vessels (1)

16.52

14.0

18.17

14.0

Calendar days for fleet (2)

1,520.0

1,288.0

4,978.0

3,822.0

Scheduled off-hire days incl. laid-up (3)

57.3

210.3

57.3

Available days for fleet (4) = (2) – (3)

1,520.0

1,230.7

4,767.7

3,764.7

Commercial off-hire days (5)

32.3

132.1

Operational off-hire days (6)

1.8

14.4

71.5

56.7

Voyage days for fleet (7) = (4) – (5) – (6)

1,485.9

1,216.3

4,564.1

3,708.0

Fleet utilization (8) = (7) / (4)

97.8

%

98.8

%

95.7

%

98.5

%

Fleet utilization, commercial (9) = ((4) – (5)) / (4)

97.9

%

100.0

%

97.2

%

100.0

%

Fleet utilization, operational (10) = ((4) – (6)) / (4)

99.9

%

98.8

%

98.5

%

98.5

%

AVERAGE DAILY RESULTS (usd/day)

Time charter equivalent rate (11)

8,403

19,482

9,171

15,478

Vessel operating expenses excl. drydocking expenses (12)

6,307

6,741

5,777

6,445

General and administrative expenses (13)

452

580

457

588

Total vessel operating expenses (14)

6,759

7,321

6,234

7,033

Drydocking expenses (15)

40

2,073

88

758

(1) Average number of vessels is the number of vessels that constituted the Company’s fleet for the relevant period, as measured by the sum of the number of calendar days each vessel was a part of the Company’s fleet during the period divided by the number of calendar days in that period.

(2) Calendar days. We define calendar days as the total number of days in a period during which each vessel in our fleet was in our possession including off-hire days associated with major repairs, drydockings or special or intermediate surveys or days of vessels in lay-up. Calendar days are an indicator of the size of our fleet over a period and affect both the amount of revenues and the amount of expenses that we record during that period.

(3) The scheduled off-hire days including vessels laid-up, vessels committed for sale or vessels that suffered unrepaired damages, are days associated with scheduled repairs, drydockings or special or intermediate surveys or days of vessels in lay-up, or of vessels that were committed for sale or suffered unrepaired damages.

(4) Available days. We define available days as the Calendar days in a period net of scheduled off-hire days as defined above. We use available days to measure the number of days in a period during which vessels were available to generate revenues.

(5) Commercial off-hire days. We define commercial off-hire days as days a vessel is idle without employment.

(6) Operational off-hire days. We define operational off-hire days as days associated with unscheduled repairs or other off-hire time related to the operation of the vessels.

(7) Voyage days. We define voyage days as the total number of days in a period during which each vessel in our fleet was in our possession net of commercial and operational off-hire days. We use voyage days to measure the number of days in a period during which vessels actually generate revenues or are sailing for repositioning purposes.

(8) Fleet utilization. We calculate fleet utilization by dividing the number of our voyage days during a period by the number of our available days during that period. We use fleet utilization to measure a company’s efficiency in finding suitable employment for its vessels and minimizing the amount of days that its vessels are off-hire for reasons such as unscheduled repairs or days waiting to find employment.

(9) Fleet utilization, commercial. We calculate commercial fleet utilization by dividing our available days net of commercial off-hire days during a period by our available days during that period.

(10) Fleet utilization, operational. We calculate operational fleet utilization by dividing our available days net of operational off-hire days during a period by our available days during that period.

(11) Time charter equivalent rate, or TCE rate, is a measure of the average daily revenue performance of our vessels. Our method of calculating TCE is determined by dividing time charter revenue and voyage charter revenue net of voyage expenses by voyage days for the relevant time period. Voyage expenses primarily consist of port, canal and fuel costs that are unique to a particular voyage, which would otherwise be paid by the charterer under a time charter contract, or are related to repositioning the vessel for the next charter. TCE is a standard shipping industry performance measure used primarily to compare period-to-period changes in a shipping company’s performance despite changes in the mix of charter types (i.e., spot voyage charters, time charters and bareboat charters) under which the vessels may be employed between the periods. Our definition of TCE may not be comparable to that used by other companies in the shipping industry.

(12) Daily vessel operating expenses, which includes crew costs, provisions, deck and engine stores, lubricating oil, insurance, maintenance and repairs and management fees are calculated by dividing vessel operating expenses by fleet calendar days for the relevant time period. Drydocking expenses are reported separately.

(13) Daily general and administrative expense is calculated by dividing general and administrative expenses by fleet calendar days for the relevant time period.

(14) Total vessel operating expenses, or TVOE, is a measure of our total expenses associated with operating our vessels. TVOE is the sum of vessel operating expenses, management fees and general and administrative expenses; drydocking expenses are not included. Daily TVOE is calculated by dividing TVOE by fleet calendar days for the relevant time period.

(15) Drydocking expenses include expenses during drydockings that would have been capitalized and amortized under the deferral method divided by the fleet calendar days for the relevant period. Drydocking expenses could vary substantially from period to period depending on how many vessels underwent drydocking during the period. The Company expenses drydocking expenses as incurred.

Conference Call and Webcast:
Today, Tuesday, November 16, 2021 at 10:00 a.m. Eastern Standard Time, the Company’s management will host a conference call to discuss the results.

Conference Call details:
Participants should dial into the call 10 minutes before the scheduled time using the following numbers: 1 (877) 553-9962 (US Toll Free Dial In), 0(808) 238-0669 (UK Toll Free Dial In) or +44 (0) 2071 928592 (Standard International Dial In). Please quote “Euroseas” to the operator.

Audio webcast – Slides Presentation:
There will be a live and then archived webcast of the conference call and accompanying slides, available through the Company’s website. To listen to the archived audio file, visit our website http://www.euroseas.gr and click on Company Presentations under our Investor Relations page. Participants to the live webcast should register on the website approximately 10 minutes prior to the start of the webcast .The slide presentation on the third quarter ended September 30, 2021 will also be available in PDF format minutes prior to the conference call and webcast, accessible on the company’s website (www.euroseas.gr) on the webcast page. Participants to the webcast can download the PDF presentation.

Euroseas Ltd.
Unaudited Consolidated Condensed Statements of Operations
(All amounts expressed in U.S. Dollars – except number of shares)

Three Months Ended
September 30,

Three Months Ended
September 30,

Nine Months Ended
September 30,

Nine Months Ended
September 30,

2020

2021

2020

2021

Revenues

Time charter revenue

12,882,144

24,006,648

43,148,575

57,980,391

Commissions

(553,920

)

(966,598

)

(1,878,833

)

(2,340,579

)

Net revenues

12,328,224

23,040,050

41,269,742

55,639,812

Operating expenses / (income)

Voyage expenses

395,743

310,724

1,290,792

588,706

Vessel operating expenses

8,180,727

7,629,855

24,710,877

21,431,974

Drydocking expenses

60,737

2,669,597

437,106

2,898,981

Vessel depreciation

1,615,111

1,596,543

5,001,837

4,789,629

Related party management fees

1,406,437

1,052,884

4,048,805

3,201,105

Net (gain) / loss on sale of vessels

(1,305,016

)

(1,305,016

)

9,417

General and administrative expenses

686,928

744,624

2,274,205

2,247,097

Other operating income

(2,687,205

)

(1,298,318

)

Loss on write down of vessel held for sale

121,165

Total operating expenses, net

11,040,667

14,004,227

33,892,566

33,868,591

Operating income

1,287,557

9,035,823

7,377,176

21,771,221

Other (expenses) / income

Interest and other financing costs

(930,886

)

(621,410

)

(3,320,074

)

(2,003,077

)

(Loss) / gain on derivative, net

(96,485

)

33,163

(564,631

)

421,308

Foreign exchange (loss) / gain

(44,721

)

15,425

(42,538

)

7,921

Interest income

3,411

1,015

16,191

2,969

Other expenses, net

(1,068,681

)

(571,807

)

(3,911,052

)

(1,570,879

)


Net income

218,876

8,464,016

3,466,124

20,200,342

Dividend Series B Preferred shares

(185,552

)

(524,621

)

(255,324

)

Preferred deemed dividend

(345,423

)

Net income attributable to common shareholders

33,324

8,464,016

2,941,503

19,599,595

Weighted average number of shares outstanding, basic

5,708,610

7,198,991

5,621,159

6,898,195

Earnings per share, basic

0.01

1.18

0.52

2.84

Weighted average number of shares outstanding, diluted

5,708,610

7,241,740

5,621,159

6,942,614

Earnings per share, diluted

0.01

1.17

0.52

2.82

Euroseas Ltd.
Unaudited Consolidated Condensed Balance Sheets

December 31,
2020

September 30,
2021

ASSETS

Current Assets:

Cash and cash equivalents

3,559,399

5,880,947

Trade accounts receivable, net

2,013,023

1,705,921

Other receivables

1,866,624

1,041,524

Inventories

1,662,422

1,715,569

Restricted cash

345,010

160,859

Prepaid expenses

244,315

444,822

Total current assets

9,690,793

10,949,642

Fixed assets:

Vessels, net

98,458,447

94,436,772

Long-term assets:

Advances for vessel under construction

7,615,944

Advances for vessel acquisition

2,557,920

Restricted cash

2,433,768

4,200,000

Derivative

263,945

Total assets

110,583,008

120,024,223

LIABILITIES, MEZZANINE EQUITY AND SHAREHOLDERS’ EQUITY

Current liabilities:

Long-term bank loans, current portion

20,645,320

14,794,060

Related party loan, current

2,500,000

Trade accounts payable

2,854,377

3,004,209

Accrued expenses

1,300,420

2,188,222

Accrued preferred dividends

168,676

Deferred revenue

949,364

1,073,379

Due to related company

24,072

248,697

Derivative

203,553

277,061

Total current liabilities

28,645,782

21,585,628

Long-term liabilities:

Long-term bank loans, net of current portion

46,220,028

44,439,916

Derivative

362,195

Total long-term liabilities

46,582,223

44,439,916

Total liabilities

75,228,005

66,025,544

Mezzanine equity:

Series B Preferred shares (par value $0.01, 20,000,000 shares authorized, 8,365 and nil issued and outstanding, respectively)

8,019,636

Shareholders’ equity:

Common stock (par value $0.03, 200,000,000 shares authorized, 6,708,946 and 7,244,891, issued and outstanding)

201,268

217,347

Additional paid-in capital

257,467,980

264,515,618

Accumulated deficit

(230,333,881

)

(210,734,286

)

Total shareholders’ equity

27,335,367

53,998,679

Total liabilities, mezzanine equity and shareholders’ equity

110,583,008

120,024,223

Euroseas Ltd.
Unaudited Consolidated Condensed Statements of Cash Flows
(All amounts expressed in U.S. Dollars)

Nine Months Ended
September 30, 2020

Nine Months Ended
September 30, 2021

Cash flows from operating activities:

Net income

3,466,124

20,200,342

Adjustments to reconcile net income to net cash provided by operating activities:

Vessel depreciation

5,001,837

4,789,629

Amortization of deferred charges

216,524

150,008

Share-based compensation

91,546

73,676

Net (gain) / loss on sale of vessels

(1,305,016

)

9,417

Loss on write down of vessel held for sale

121,165

Gain on hull and machinery claim

(2,687,205

)

Amortization of fair value of below market time charters acquired

(1,473,731

)

Unrealized loss / (gain) on derivative

582,850

(552,632

)

Changes in operating assets and liabilities

(2,309,846

)

2,052,628

Net cash provided by operating activities

1,704,248

26,723,068

Cash flows from investing activities:

Cash paid for vessels under construction

(7,615,294

)

Cash paid for vessel acquisition and capitalized expenses

(2,550,714

)

Cash paid for vessel improvements

(451,846

)

(621,704

)

Proceeds from vessels sale

9,752,649

Insurance proceeds

2,226,140

Net cash provided by/ (used in) investing activities

11,526,943

(10,787,712

)

Cash flows from financing activities:

Proceeds from issuance of common stock, net of commissions paid

715,550

743,553

Redemption of Series B preferred shares

(2,000,000

)

Preferred dividends paid

(320,877

)

(424,000

)

Loan arrangement fees paid

(225,000

)

Offering expenses paid

(40,846

)

(69,900

)

Proceeds from long- term bank loans

10,000,000

Repayment of long-term bank loans

(14,076,150

)

(17,556,380

)

Repayment of related party loan

(625,000

)

(2,500,000

)

Net cash used in financing activities

(14,347,323

)

(12,031,727

)

Net (decrease)/ increase in cash, cash equivalents and restricted cash

(1,116,132

)

3,903,629

Cash, cash equivalents and restricted cash at beginning of period

5,930,061

6,338,177

Cash, cash equivalents and restricted cash at end of period

4,813,929

10,241,806

Cash breakdown

Cash and cash equivalents

2,271,069

5,880,947

Restricted cash, current

208,593

160,859

Restricted cash, long term

2,334,267

4,200,000

Total cash, cash equivalents and restricted cash shown in the statement of cash flows

4,813,929

10,241,806

Euroseas Ltd.
Reconciliation of Adjusted EBITDA to Net income
(All amounts expressed in U.S. Dollars)

Three Months Ended
September 30, 2020

Three Months Ended
September 30, 2021

Nine Months Ended
September 30, 2020

Nine Months Ended
September 30, 2021

Net income

218,876

8,464,016

3,466,124

20,200,342

Interest and other financing costs, net (incl. interest income)

927,475

620,395

3,303,883

2,000,108

Vessel depreciation

1,615,111

1,596,543

5,001,837

4,789,629

Net (gain) / loss on sale of vessels

(1,305,016

)

(1,305,016

)

9,417

Loss on write down of vessel held for sale

121,165

Amortization of below market time charters acquired

(312,892

)

(1,473,731

)

Loss / (gain) on interest rate swap derivative, net

96,485

(33,163

)

564,631

(421,308

)


Adjusted EBITDA

1,240,039

10,647,791

9,678,893

26,578,188

Adjusted EBITDA Reconciliation:
Euroseas Ltd. considers Adjusted EBITDA to represent net income before interest, income taxes, depreciation, loss / (gain) on interest rate swap, net (gain) / loss on sale of vessels, loss on write down of vessel held for sale and amortization of below market time charters acquired. Adjusted EBITDA does not represent and should not be considered as an alternative to net income, as determined by United States generally accepted accounting principles, or GAAP. Adjusted EBITDA is included herein because it is a basis upon which the Company assesses its financial performance because the Company believes that this non-GAAP financial measure assists our management and investors by increasing the comparability of our performance from period to period by excluding the potentially disparate effects between periods of, financial costs, net gain / (loss) on sale of vessels, loss on write down of vessel held for sale, amortization of below market time charters acquired and loss / (gain) on interest rate swap, and depreciation. The Company’s definition of Adjusted EBITDA may not be the same as that used by other companies in the shipping or other industries.


Euroseas Ltd.
Reconciliation of Net income to Adjusted net (loss) / income
(All amounts expressed in U.S. Dollars – except share data and number of shares)

Three Months Ended
September 30, 2020

Three Months Ended
September 30, 2021

Nine Months Ended
September 30, 2020

Nine Months Ended
September 30, 2021

Net income

218,876

8,464,016

3,466,124

20,200,342

Unrealized loss / (gain) on derivative

114,704

(78,985

)

582,850

(552,632

)

Net (gain) / loss on sale of vessels

(1,305,016

)

(1,305,016

)

9,417

Loss on write down of vessel held for sale

121,165

Amortization of below market time charters acquired

(314,434

)

(1,473,731

)

Adjusted net (loss) / income

(1,285,870

)

8,385,031

1,391,392

19,657,127

Preferred dividends

(185,552

)

(524,621

)

(255,324

)

Preferred deemed dividend

(345,423

)

Adjusted net (loss) / income attributable to common shareholders

(1,471,422

)

8,385,031

866,771

19,056,380

Adjusted (loss) / earnings per share, basic

(0.26

)

1.16

0.15

2.76

Weighted average number of shares, basic

5,708,610

7,198,991

5,621,159

6,898,195

Adjusted (loss) / earnings per share, diluted

(0.26

)

1.16

0.15

2.74

Weighted average number of shares, diluted

5,708,610

7,241,740

5,621,159

6,942,614

Adjusted net (loss) / income and Adjusted (loss) / earnings per share Reconciliation:
Euroseas Ltd. considers Adjusted net (loss) / income to represent net (loss) / income before unrealized loss / (gain) on derivative, net (gain) / loss on sale of vessels, loss on write down of vessel held for sale and amortization of below market time charters acquired. Adjusted net (loss) / income and Adjusted (loss) / earnings per share is included herein because we believe it assists our management and investors by increasing the comparability of the Company’s fundamental performance from period to period by excluding the potentially disparate effects between periods of unrealized loss / (gain) on derivative, net (gain) / loss on sale of vessels, loss on write down of vessel held for sale and amortization of below market time charters acquired, which items may significantly affect results of operations between periods.

Adjusted net (loss) / income and Adjusted (loss) / earnings per share do not represent and should not be considered as an alternative to net (loss) / income or (loss) / earnings per share, as determined by GAAP. The Company’s definition of Adjusted net (loss) / income and Adjusted (loss) / earnings per share may not be the same as that used by other companies in the shipping or other industries.

About Euroseas Ltd.
Euroseas Ltd. was formed on May 5, 2005 under the laws of the Republic of the Marshall Islands to consolidate the ship owning interests of the Pittas family of Athens, Greece, which has been in the shipping business over the past 140 years. Euroseas trades on the NASDAQ Capital Market under the ticker ESEA.

Euroseas operates in the container shipping market. Euroseas’ operations are managed by Eurobulk Ltd., an ISO 9001:2008 and ISO 14001:2004 certified affiliated ship management company, which is responsible for the day-to-day commercial and technical management and operations of the vessels. Euroseas employs its vessels on spot and period charters and through pool arrangements.

After the delivery of M/V Leo Paramount, the Company will have a fleet of 16 vessels comprising of 10 Feeder and 6 Intermediate containerships. Euroseas 16 containerships have a cargo capacity of 50,371 teu. Furthermore, after the delivery of two feeder containership newbuildings in the first half of 2023, Euroseas’ fleet will consist of 18 vessels with a total carrying capacity of 55,971 teu.

Forward Looking Statement
This press release contains forward-looking statements (as defined in Section 27A of the Securities Act of 1933, as amended, and Section 21E of the Securities Exchange Act of 1934, as amended) concerning future events and the Company’s growth strategy and measures to implement such strategy; including expected vessel acquisitions and entering into further time charters. Words such as “expects,” “intends,” “plans,” “believes,” “anticipates,” “hopes,” “estimates,” and variations of such words and similar expressions are intended to identify forward-looking statements. Although the Company believes that the expectations reflected in such forward-looking statements are reasonable, no assurance can be given that such expectations will prove to have been correct. These statements involve known and unknown risks and are based upon a number of assumptions and estimates that are inherently subject to significant uncertainties and contingencies, many of which are beyond the control of the Company. Actual results may differ materially from those expressed or implied by such forward-looking statements. Factors that could cause actual results to differ materially include, but are not limited to changes in the demand for containerships, competitive factors in the market in which the Company operates; risks associated with operations outside the United States; and other factors listed from time to time in the Company’s filings with the Securities and Exchange Commission. The Company expressly disclaims any obligations or undertaking to release publicly any updates or revisions to any forward-looking statements contained herein to reflect any change in the Company’s expectations with respect thereto or any change in events, conditions or circumstances on which any statement is based.

Visit our website www.euroseas.gr

Company Contact

Investor Relations / Financial Media

Tasos Aslidis
Chief Financial Officer
Euroseas Ltd.
11 Canterbury Lane,
Watchung, NJ 07069
Tel. (908) 301-9091
E-mail: aha@euroseas.gr

Nicolas Bornozis
President
Capital Link, Inc.
230 Park Avenue, Suite 1536
New York, NY 10169
Tel. (212) 661-7566
E-mail: nbornozis@capitallink.com

Release – Great Lakes Dredge Dock Corporation Signs Contract with Philly Shipyard


Great Lakes Dredge & Dock Corporation Signs Contract with Philly Shipyard, Inc. to Build the First Jones-Act Compliant Subsea Rock Installation Vessel for U.S. Offshore Wind


Great Lakes Dredge & Dock Corporation Signs Contract with Philly Shipyard, Inc. to Build the First Jones-Act Compliant Subsea Rock Installation Vessel for U.S. Offshore Wind

  • Historic milestone for domestic offshore wind industry, will create hundreds of U.S. jobs.
  • Major step in establishing U.S.-based rock supply chain for the offshore wind industry.
  • Vessel expected to be sea-ready by Q4 2024

HOUSTON, Nov. 16, 2021 (GLOBE NEWSWIRE) — Great Lakes Dredge & Dock Corporation (“Great Lakes Dredge & Dock” or the “Company”) (NASDAQ: GLDD), the largest provider of dredging services in the United States announced today that the Company has signed a contract with Philly Shipyard, Inc (OSE: PHLY) to build the first U.S.-flagged Jones Act-compliant, inclined fallpipe vessel for subsea rock installation. This vessel will service America’s growing offshore wind energy industry and help reach the Biden administration’s ambitious 30 GW of offshore wind goal by 2030. 

“This contract, valued at approximately $197 million, marks a milestone for our company, the U.S. offshore wind industry and our nation,” said Lasse Petterson, Great Lakes Dredge & Dock’s President and Chief Executive Officer. “Offshore wind will play a crucial role in helping the U.S. meet its decarbonization and clean energy goals. The unique, technologically advanced vessel we are constructing is an essential step towards building the marine infrastructure required for this new industry, which holds so much promise for our nation economically and environmentally.”

This Great Lakes Dredge & Dock vessel will be U.S. owned, U.S. built, U.S. operated and crewed by American union workers, and will meet all conditions of the Jones Act. The vessel will transport and strategically deposit loads of rock on the seabed, laying scour protection for offshore wind farm foundations, cables and other structures. The ship will have an overall length of 140.5 meters (461 feet) and a breadth of 34.1 meters (112 feet). Further, the vessel is expected to help spur additional job growth and regional economic opportunities through the creation of a U.S.-based rock supply chain network, which will be needed to supply subsea rock installation activities, from quarries in states along the East Coast.

Eleni Beyko, Great Lakes Dredge & Dock’s Senior Vice President, Offshore Wind, commented, “World-renowned engineering firm Ulstein Design and Solutions B.V. was commissioned by the Company to design the vessel using state-of-the-art technology, equipment, and automation. The design was reviewed and approved by the American Bureau of Shipping (“ABS”) and will be built with best-in-class safety and low emissions standards (LEV, Sustain2), EPA Tier 4 engines and plug-in capability to obtain power from shore while loading. The vessel will be able to run on biofuel which reduces the ship’s CO2 footprint and it will be equipped with advanced active emissions control technology to reduce NOx emissions to a minimum. The installed battery pack will shave peak loads to reduce fuel consumption and corresponding emissions. The vessel is expected to be sea-ready by Q4 2024, to coincide with major offshore wind project construction timelines previously announced.”

As the leading U.S. dredging company and with more than 130 years’ experience and expertise in dredging, marine engineering, specialized vessel design and safe offshore operations, Great Lakes Dredge & Dock believes the company is optimally positioned to make the business pivot into the offshore wind energy industry. The Company brings best practices to all the projects it undertakes, employing among the industry’s highest safety standards and quality control protocols.

“With this newbuild vessel purpose built to meet the needs of the U.S. offshore wind industry, we are essentially harnessing the best practices to create a new dimension to our legacy and help make history for our country,” concluded Petterson.

The Company

Great Lakes Dredge & Dock Corporation is the largest provider of dredging services in the United States. In addition, the Company has a long history of performing significant international projects. The Company employs experienced civil, ocean and mechanical engineering staff in its estimating, production and project management functions. In its over 130-year history, the Company has never failed to complete a marine project. Great Lakes owns and operates the largest and most diverse fleet in the U.S. dredging industry, comprising over 200 specialized vessels. Great Lakes has a disciplined training program for engineers that ensures experienced-based performance as they advance through Company operations. The Company’s Incident-and Injury-Free® (IIF®) safety management program is integrated into all aspects of the Company’s culture. The Company’s commitment to the IIF® culture promotes a work environment where employee safety is paramount. Great Lakes operates under the Jones Act which is a federal law that regulates maritime commerce in the United States and requires goods shipped between U.S. ports to be transported on ships that are built, owned and operated by U.S. citizens or permanent residents.

Cautionary Note Regarding Forward-Looking Statements
Certain statements in this press release may constitute “forward-looking” statements as defined in Section 21E of the Securities Exchange Act of 1934 (the “Exchange Act”), the Private Securities Litigation Reform Act of 1995 (the “PSLRA”) or in releases made by the Securities and Exchange Commission (the “SEC”), all as may be amended from time to time. Such forward-looking statements involve known and unknown risks, uncertainties and other important factors that could cause the actual results, performance or achievements of Great Lakes and its subsidiaries, or industry results, to differ materially from any future results, performance or achievements expressed or implied by such forward-looking statements. Statements that are not historical fact are forward-looking statements. These cautionary statements are being made pursuant to the Exchange Act and the PSLRA with the intention of obtaining the benefits of the “safe harbor” provisions of such laws. Great Lakes cautions investors that any forward-looking statements made by Great Lakes are not guarantees or indicative of future events.

Although Great Lakes believes that its plans, intentions and expectations reflected in this press release are reasonable, actual events could differ materially. The forward-looking statements contained in this press release are made only as of the date hereof and Great Lakes does not have or undertake any obligation to update or revise any forward-looking statements whether as a result of new information, subsequent events or otherwise, unless otherwise required by law.

For further information contact:
Tina Baginskis
Director, Investor Relations
630-574-3024

Release – Comtech Telecommunications Corp. Awarded $3.7 Million of Funding to Support State of Maryland Department of Human Services with IT Services


Comtech Telecommunications Corp. Awarded $3.7 Million of Funding to Support State of Maryland Department of Human Services with IT Services


MELVILLE, N.Y.–(BUSINESS WIRE)–Nov. 16, 2021– 
November 16, 2021 
Comtech Telecommunications Corp. (NASDAQ: CMTL), a leading global provider of next-generation 911 emergency systems and secure wireless communications technologies, announced today, that during its first quarter of fiscal 2022, it was awarded 
$3.7 million of funding to provide the 
State of Maryland Department of Human Services (“DHS”) with statewide 
Technical Operations Support Services (“TOSS”). 
Comtech and its experienced team members work directly with the personnel of DHS to develop, maintain and support the IT needs of DHS.

“Through our provisioning of high quality IT services on a consistent basis, we’ve become a trusted partner to the State of Maryland DHS. We look forward to continuing to provide service at an optimal level to all state agencies included in this extension of the contract,” said  Fred Kornberg, Chairman of the Board and Chief Executive Officer of 
Comtech Telecommunications Corp.

The Maryland DHS is the state’s primary social service provider, annually reaching more than one million people. Through its 24 local departments of social services, the agency pursues opportunities to assist people in economic need, provide preventive services, and protect vulnerable children and adults in each of Maryland’s 23 counties and 
Baltimore City. Additional information may be found at dhs.maryland.gov.

Comtech Telecommunications Corp. is a leading global provider of next-generation 911 emergency systems and secure wireless communications technologies to commercial and government customers around the world. Headquartered in 
Melville, New York and with a passion for customer success, 
Comtech designs, produces and markets advanced and secure wireless solutions. For more information, please visit www.comtechtel.com.

Certain information in this press release contains statements that are forward-looking in nature and involve certain significant risks and uncertainties. Actual results could differ materially from such forward-looking information. The Company’s 
Securities and Exchange Commission filings identify many such risks and uncertainties. Any forward-looking information in this press release is qualified in its entirety by the risks and uncertainties described in such 
Securities and Exchange Commission filings.

Comtech Investor Relations:
631-962-7005
investors@comtech.com

Source: 
Comtech Telecommunications Corp.

Release – Kratos Partners with RPS Defense for Tactical UAS Operational and Maintenance Services


Kratos Partners with RPS Defense for Tactical UAS Operational and Maintenance Services


SAN DIEGO
Nov. 16, 2021 (GLOBE NEWSWIRE) — 
Kratos Defense & Security Solutions, Inc. (NASDAQ: KTOS), a leading National Security Solutions provider and industry-leading provider of high-performance unmanned systems, announced today that 
Kratos Unmanned Aerial Systems (KUAS), a unit of the Kratos Unmanned Systems Division, has exclusively partnered with RPS Defense (RPS) to provide a range of operational and maintenance services to support Kratos Tactical UAS and the corresponding technologies during the transition of these systems from prototype and demonstration to real-world military operations.

Blake Stovall, CEO of RPS Defense, said, “We are excited to support and team with Kratos as they demonstrate and field transformational combat capabilities. We have a trusted partnership with Kratos’ leadership and share the same commitment to delivering performance and value to our customers. The disruptive technologies that Kratos brings to the fight, coupled with RPS Defense’s operational expertise and diverse service offerings, go hand-in-hand to deliver the next generation of combat capabilities to our customers.”

Steve Fendley, President of Kratos Unmanned Systems Division, said, “Part of our recipe for success at Kratos is key and effective partnerships. As a mid-tier prime, we complement our areas of expertise with that of our best-in-class partners to be able to offer best-in-class systems and services, always with affordability as a threshold criteria. RPS is an industry leader in tactical UAS operations and maintenance across the globe and the range of mission types—especially challenging operational scenarios. Our partnership enables Kratos to optimize its systems and operations for the ultimate purpose: to support and protect the warfighter.”

RPS Defense (www.rpsdefense.com) is a recognized and field-proven military services provider, headquartered in 
Dallas, TX, that has supported and flown hundreds of thousands of hours of combat C5ISR missions across a variety of unmanned platforms for the US government and other customers. Since its founding in 2013, RPS has grown significantly and supported defense programs around the globe through fielded operations, intelligence, test and development, combat training, and aircraft maintenance and munition services. Every day, RPS Defense supports the execution of ISR missions, capturing valuable data that informs strategic decisions and saves lives. Through its growth, the company’s vision has remained to provide its customers with the highest levels of support in the pursuit of becoming leaders in comprehensive aviation services.

Kratos Unmanned Aerial Systems is an industry leader in the rapid design, manufacture, and delivery of affordable, high-performance jet drone systems. Kratos’ high-performance drones are designed to satisfy 
DoD missions as threat representative aerial aircraft / cruise missile targets to exercise weapon, radar, and other systems; and tactical aerial drone systems for strike / ISR and force multiplication missions. The company is vertically integrated, possessing the technical expertise to design, build, operate, and control some of the world’s most advanced unmanned platforms.

About Kratos Defense & Security Solutions

Kratos Defense & Security Solutions, Inc. (NASDAQ:KTOS) develops and fields transformative, affordable technology, platforms and systems for United States National Security related customers, allies and commercial enterprises. Kratos is changing the way breakthrough technology for these industries are rapidly brought to market through proven commercial and venture capital backed approaches, including proactive research and streamlined development processes. At Kratos, affordability is a technology, and we specialize in unmanned systems, satellite communications, cyber security/warfare, microwave electronics, missile defense, hypersonic systems, training, combat systems and next generation turbo jet and turbo fan engine development. For more information, please visit www.KratosDefense.com.

Notice Regarding Forward-Looking Statements
Certain statements in this press release may constitute “forward-looking statements” within the meaning of the Private Securities Litigation Reform Act of 1995. These forward-looking statements are made on the basis of the current beliefs, expectations and assumptions of the management of Kratos and are subject to significant risks and uncertainty. Investors are cautioned not to place undue reliance on any such forward-looking statements. All such forward-looking statements speak only as of the date they are made, and Kratos undertakes no obligation to update or revise these statements, whether as a result of new information, future events or otherwise. Although Kratos believes that the expectations reflected in these forward-looking statements are reasonable, these statements involve many risks and uncertainties that may cause actual results to differ materially from what may be expressed or implied in these forward-looking statements. For a further discussion of risks and uncertainties that could cause actual results to differ from those expressed in these forward-looking statements, as well as risks relating to the business of Kratos in general, see the risk disclosures in the Annual Report on Form 10-K of Kratos for the year ended December 27, 2020, and in subsequent reports on Forms 10-Q and 8-K and other filings made with the SEC by Kratos.

Press Contact:
Yolanda White
858-812-7302 Direct

Investor Information:
877-934-4687
investor@kratosdefense.com

Source: Kratos Defense & Security Solutions, Inc.

Release – Gevo and Sweetwater Energy Sign MoU to Supply Lignocellulosic Feedstocks to Produce Cellulosic Alcohols and Sustainable Aviation Fuel


Gevo and Sweetwater Energy Sign MoU to Supply Lignocellulosic Feedstocks to Produce Cellulosic Alcohols and Sustainable Aviation Fuel


ENGLEWOOD, Colo., Nov. 16, 2021 (GLOBE NEWSWIRE) — Gevo, Inc. (NASDAQ: GEVO) is pleased to announce it has signed a memorandum of understanding (MoU) with Sweetwater Energy, Inc., regarding the use of sustainably sourced agricultural residues and woody biomass as a feedstock for producing cellulosic alcohols and energy-dense renewable liquid hydrocarbons.

As outlined in the MoU, Sweetwater plans to build, own and operate a facility adjacent to Gevo’s existing plant in Luverne, Minnesota to produce high-value, plant-based products from cellulose and lignin while supplying Gevo with up to 30,000 tons of biomass-derived cellulosic sugars annually, with opportunities for expansion. The new Sweetwater facility would utilize its proprietary Sunburst technology for deconstructing lignocellulosic biomass. Sweetwater’s anticipated plant-based product portfolio, derived from cellulose and lignin, is targeted for applications in packaging, resins, and other applications to increase performance and sustainability, while displacing petroleum-based products. Gevo plans to use the offtake of the low-cost, cellulosic sugars co-produced by Sweetwater for the anticipated production of cellulosic alcohols and renewable hydrocarbons.

“We’re very excited to work with Gevo,” says Arunas Chesonis, Chairman and CEO of Sweetwater Energy. “This partnership fits perfectly with our goal for the company—replacing petroleum products with renewable solutions at a price point so low that making the right decision for the planet is also the right decision for our customers. This is the beginning of a collaboration that will pay very real dividends for present and future generations.”

Gevo was the first company to demonstrate conversion of cellulosic sugars to make sustainable aviation fuel meeting the ASTM D7566 specification allowing it to be used for commercial flights. The company expects it can be commercialized effectively when cost-effective sources of these sugars meet sustainability goals. In addition, cellulosic D3 RINs are high value and create an opportunity for Gevo to leverage its Luverne plant with anticipated better returns to make higher value products that are in demand in the marketplace.

The potential partnership with Sweetwater to supply cellulosic sugars provides an exciting model for Gevo. Because this offtake model could be replicated globally in multiple locations to fill a gap in the marketplace, it could further expand the reach of Gevo’s systems approach to sustainability, while allowing the company to stay focused on its technology for the production of alcohols and hydrocarbon fuels. Developing new partnerships for the conversion of cellulosic biomass is expected to continue to be a part of Gevo’s strategic plan.

Since Sweetwater’s Sunburst technology is designed with the flexibility to pretreat many types of biomass and has been proven in operation at commercial scale at the Sweetwoods Project in Imavere, Estonia, Sweetwater plans to increase the types of feedstock used in the Luverne plant to include qualified wood products and agricultural residues. Construction of the Sweetwater facility adjacent to the Luverne facility is anticipated to begin in Q3 2022.

“Combining forces with Sweetwater is a great way to leverage the best technology and resources from both parties to expand our addressable feedstocks to produce cellulosic alcohols and energy dense hydrocarbon fuels and plant-based products,” says Dr. Paul Bloom, Chief Carbon and Innovation Officer of Gevo. “Working together we anticipate delivering products to the market faster while decreasing risk throughout the value chain and lowering overall product carbon intensities through a systems approach to decarbonization. This is an important step to expand the portfolio of carbohydrates we intend to process to include cellulosic sugars that represent a huge amount of feedstock globally.”

About Gevo

Gevo’s mission is to transform renewable energy and carbon into energy-dense liquid hydrocarbons. These liquid hydrocarbons can be used for drop-in transportation fuels such as gasoline, jet fuel and diesel fuel, that when burned have potential to yield net-zero greenhouse gas emissions when measured across the full life cycle of the products. Gevo uses low-carbon renewable resource-based carbohydrates as raw materials, and is in an advanced state of developing renewable electricity and renewable natural gas for use in production processes, resulting in low-carbon fuels with substantially reduced carbon intensity (the level of greenhouse gas emissions compared to standard petroleum fossil-based fuels across their life cycle). Gevo also plans to take advantage of decarbonization via geological sequestration in the future. Gevo’s products perform as well or better than traditional fossil-based fuels in infrastructure and engines, but with substantially reduced greenhouse gas emissions. In addition to addressing the problems of fuels, Gevo’s technology also enables certain plastics, such as polyester, to be made with more sustainable ingredients. Gevo’s ability to penetrate the growing low-carbon fuels market depends on the price of oil and the value of abating carbon emissions that would otherwise increase greenhouse gas emissions.

Gevo believes that its proven, patented technology enabling the use of a variety of low-carbon sustainable feedstocks to produce price-competitive low-carbon products such as gasoline components, jet fuel and diesel fuel yields the potential to generate project and corporate returns that justify the build- out of a multi-billion-dollar business.

Gevo believes that the Argonne National Laboratory GREET model is the best available standard of scientific-based measurement for life cycle inventory or LCI.

Learn more at Gevo’s website: www.gevo.com

About Sweetwater Energy, Inc.

Sweetwater Energy uses a unique technology for producing low-cost nanofibrillated cellulose, microcrystalline cellulose, cellulosic sugars, and clean lignin from non-food plant materials to help meet the modern world’s increasing bioenergy and biochemical demands. The company began in 2009 as a spinout from the Rochester Institute of Technology with funding from the New York State Energy Research and Development Authority. The initial goal was to develop a distributed method of creating ethanol on-site on farmland, but as the technology developed and its capabilities expanded, the company’s vision also grew. In early 2020, the first commercial Sunburst system was installed at the Sweetwoods Project in Imavere, Estonia, a €43.2 million collaboration of nine European companies deriving high-value products from wood via the Sunburst system.

Learn more at Sweetwater’s website: https://www.sweetwater.us/

Forward-Looking Statements

Certain statements in this press release may constitute “forward-looking statements” within the meaning of the Private Securities Litigation Reform Act of 1995. These forward-looking statements relate to a variety of matters, without limitation, including Sweetwater Energy, Inc. and its technology, engineering and constructing a facility in Luverne, Minnesota, the production of cellulosic sugars and high-value products derived from forestry and agricultural wastes, the production of alcohols and advanced renewable fuels including SAF, the attributes of Gevo’s products, and other statements that are not purely statements of historical fact. These forward-looking statements are made on the basis of the current beliefs, expectations and assumptions of the management of Gevo and are subject to significant risks and uncertainty. Investors are cautioned not to place undue reliance on any such forward-looking statements. All such forward-looking statements speak only as of the date they are made, and Gevo undertakes no obligation to update or revise these statements, whether as a result of new information, future events or otherwise. Although Gevo believes that the expectations reflected in these forward-looking statements are reasonable, these statements involve many risks and uncertainties that may cause actual results to differ materially from what may be expressed or implied in these forward-looking statements. For a further discussion of risks and uncertainties that could cause actual results to differ from those expressed in these forward-looking statements, as well as risks relating to the business of Gevo in general, see the risk disclosures in the Annual Report on Form 10-K of Gevo for the year ended December 31, 2020, and in subsequent reports on Forms 10-Q and 8-K and other filings made with the U.S. Securities and Exchange Commission by Gevo.

Gevo Investor and Media Contact

Heather L. Manuel

+1 720-418-0085

IR@gevo.com

Sweetwater Media Contact

Jonathan Sherwood

+1 585-647-5765

Jonathan.Sherwood@Sweetwater.us

Release – Voyager Digital Announces the Voyager Debit Mastercard


Voyager Digital Announces the Voyager Debit Mastercard®


The Voyager Debit Mastercard is the first crypto-based debit card that pays up to 9% annual rewards, and even more for Voyager Loyalty Program members

Voyager Digital Ltd. (“Voyager” or the “Company”) (TSX: VOYG; OTCQX: VYGVF; FRA: UCD2), one of the fastest-growing, publicly traded cryptocurrency platforms in the United States, today announced the launch of the Voyager Debit Mastercard, the first crypto-based debit card that pays up to 9% annual rewards to Voyager customers, as well as additional rewards for Voyager Loyalty Program members.

“With the Voyager Debit Mastercard, we continue to lead the future of finance by giving Voyager customers the benefit of earning rewards while instantly being able to spend their crypto on everyday purchases with the convenience of a debit card,” said Steve Ehrlich, CEO and co-founder of Voyager. “By basing our debit card on the USD Coin (USDC), a stable coin priced 1-to-1 to the US dollar, we are offering customers a predictable and rewarding way to hold and easily convert crypto for payments, while offering Voyager Loyalty Program members additional rewards.”

The Voyager Mastercard enables cardholders to instantly spend their crypto assets, seamlessly and automatically converting USDC to fiat currency in order to transact on the Mastercard network. Additional features include:

Starting today, consumers can pre-register for the Voyager Debit Mastercard through www.investvoyager.com/debitcard

Launch of the Voyager Debit Mastercard follows the announcement on November 10, 2021 that the company surpassed 1 million funded accounts, increasing funded accounts by 2,225% in just over ten months. In addition, Voyager announced registered users at 2.7 million, up from 1 million announced on April 6, 2021. This strong momentum demonstrates that consumers in the US are drawn to Voyager’s expanding crypto finance platform and that the company is the well positioned for continued growth.

Metropolitan Commercial Bank (NYSE: MCB) is the issuing bank and Usio (NASDAQ: USIO) will act at the program manager and processor for the Voyager Debit Mastercard.


About Voyager Digital Ltd.
Voyager Digital Ltd. (TSX: VOYG; OTCQX: VYGVF; FRA: UCD2) is a fast-growing, publicly traded cryptocurrency platform in the United States founded in 2018 to bring choice, transparency, and cost efficiency to the marketplace. Voyager offers a secure way to trade over 60 different crypto assets using its easy-to-use mobile application, and earn rewards up to 12 percent annually on more than 30 cryptocurrencies. Through its subsidiary Coinify ApS, Voyager provides crypto payment solutions for both consumers and merchants around the globe. To learn more about the company, please visit https://www.investvoyager.com.

About Metropolitan Commercial Bank
Metropolitan Bank Holding Corp. (NYSE: MCB) is the holding company for Metropolitan Commercial Bank. The Bank provides a broad range of business, commercial and personal banking products and services to small and middle-market businesses, public entities and affluent individuals in the New York metropolitan area. Founded in 1999, the Bank is headquartered in New York City and operates six locations in Manhattan, Brooklyn and Great Neck, Long Island. The Bank provides banking-as-a-service to its fintech partners, which includes serving as an issuing bank for third-party debit card programs nationwide. The Bank is a New York State chartered commercial bank and a Federal Reserve System member bank whose deposits are insured up to applicable limits by the Federal Deposit Insurance Corporation, and an equal opportunity lender. For more information, please visit www.mcbankny.com

About Usio, Inc.
Usio, Inc. (Nasdaq: USIO), a leading FinTech integrated payment solutions provider, offers a wide range of payment solutions to merchants, billers, banks, service bureaus, crypto exchanges and card issuers. The Company operates credit, debit/prepaid, and ACH payment processing platforms to deliver convenient, world-class payment solutions and services to its clients. The strength of the Company lies in its ability to provide tailored solutions for card issuance, payment acceptance, and bill payments as well as its unique technology in the prepaid sector. Usio is headquartered in San Antonio, Texas, and has offices in Austin, Texas and Franklin, Tennessee, just outside of Nashville.  Websites: www.usio.com, www.payfacinabox.com, www.akimbocard.com and www.usiooutput.com.  Find us on Facebook® and Twitter.  Usio Press and Investor Contact: Joe Hassett, Investor Relations joeh@gregoryfca.com, 484-686-6600
 
The TSX has not approved or disapproved of the information contained herein.
 
SOURCE Voyager Digital, Ltd.

Press Contacts
 
Voyager Digital Ltd.
Michael Legg
Chief Communications Officer
(212) 547-8807
mlegg@investvoyager.com

Voyager Public Relations Team
pr@investvoyager.com

Release – Voyager Digital Reports Quarter Ended September 30 2021


Voyager Digital Reports Quarter Ended September 30, 2021


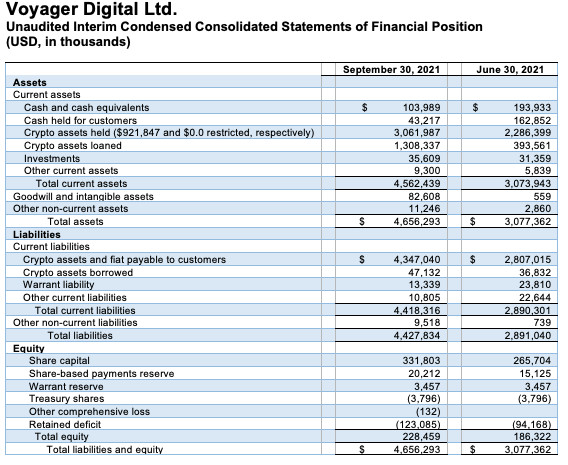
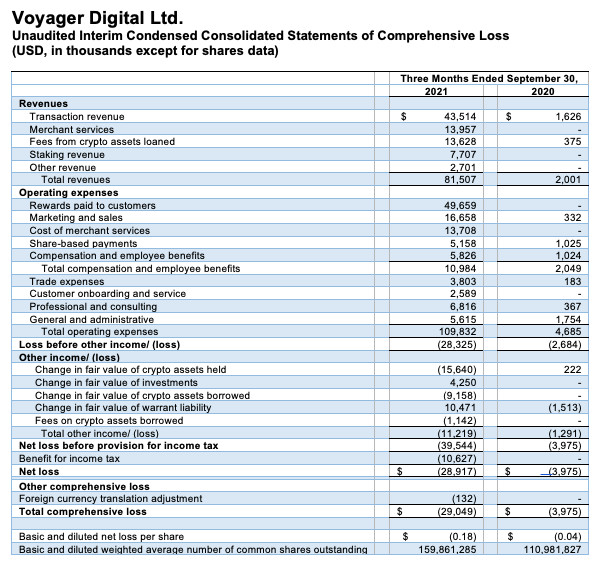
Voyager Digital Ltd. (“Voyager” or the “Company”) (TSX: VOYG; OTCQX: VYGVF; FRA: UCD2) one of the fastest-growing, publicly traded cryptocurrency platforms in the United States, today announced revenue and user metrics for the Fiscal 2022 First Quarter ended September 30, 2021.

“As we exit September and reflect on the growth of our platform, we’re glad to report that our Company is stronger than ever,” said Steve Ehrlich, CEO and Co-founder of Voyager. “Although the global crypto industry saw reduced volumes in the September quarter, our strategic decision to invest in customer acquisition and retention during that period has paid off as it resulted in a significant increase in downloads and a rise in the app rankings. That coupled with the volume uptick in the first half of the December quarter has Voyager well-positioned to exceed our June quarter record revenues in this quarter. If we look at our results on a calendar basis, we expect to exceed revenue of $360 million for the calendar year. We saw the September quarter as just a speed bump for the industry, experienced by other platforms as well, and Voyager has fared better than others on a comparative basis.”

“The dedication to our marketing efforts in the quarter is paying off as Voyager has seen increased accounts and volume growth in October and November. We will continue to invest in customer acquisition, engagement and retention, led by our industry leading loyalty program,” continued Ehrlich.

The Company is pleased to announce the following Fiscal 2022 First Quarter ended September 30, 2021 Financial and Operational Key Metrics:

 
All figures are preliminary and unaudited and subject to final adjustment. All amounts are in U.S. dollars, unless otherwise indicated.
 
“Although we continue to grow our funded accounts, Voyager’s transactional volume is contingent on market volume. Voyager plans to continue to diversify its revenues by adding additional coins that generate staking rewards as well as adding to our revenue streams through products such as NFTs and crypto based debit cards,” Ehrlich added.
 
Conference Call Details
Voyager will discuss its Fiscal 2022 First Quarter results today, November 16, 2021, via a conference call at 8:00 a.m. Eastern Time. To access the webcast, please register by clicking here. A live webcast and a replay will be available on the Investor Relations section of the Company’s website at investvoyager.com/investorrelations/events.
 
About Voyager Digital Ltd.
Voyager Digital Ltd. (TSX: VOYG; OTCQX: VYGVF; FRA: UCD2) is a fast-growing, publicly traded cryptocurrency platform in the United States founded in 2018 to bring choice, transparency, and cost efficiency to the marketplace. Voyager offers a secure way to trade over 65 different crypto assets using its easy-to-use mobile application and earn rewards up to 12 percent annually on more than 30 cryptocurrencies. Through its subsidiary Coinify ApS, Voyager provides crypto payment solutions for both consumers and merchants around the globe. To learn more about the company, please visit https://www.investvoyager.com.
 
The TSX has not approved or disapproved of the information contained herein.
 
Forward Looking Statements
Certain information in this press release, including, but not limited to, statements regarding future growth and performance of the business, momentum in the businesses, future adoption of digital assets, and the Company‘s anticipated results may constitute forward looking information (collectively, forward-looking statements), which can be identified by the use of terms such as “may,” “will,” “should,” “expect,” “anticipate,” “project,” “estimate,” “intend,” “continue” or “believe” (or the negatives) or other similar variations. Forward-looking statements involve known and unknown risks, uncertainties and other factors that may cause Voyager’s actual results, performance or achievements to be materially different from any of its future results, performance or achievements expressed or implied by forward-looking statements. Moreover, we operate in a very competitive and rapidly changing environment. New risks emerge from time to time. It is not possible for our management to predict all risks, nor can we assess the impact of all factors on our business or the extent to which any factor, or combination of factors, may cause actual results to differ materially from those contained in any forward-looking statements we may make. In light of these risks, uncertainties, and assumptions, the future events and trends discussed in this press release may not occur and actual results could differ materially and adversely from those anticipated or implied in the forward-looking statements. Forward looking statements are subject to the risk that the global economy, industry, or the Company’s businesses and investments do not perform as anticipated, that revenue or expenses estimates may not be met or may be materially less or more than those anticipated, that trading momentum does not continue or the demand for trading solutions declines, customer acquisition does not increase as planned, product and international expansion do not occur as planned, risks of compliance with laws and regulations that currently apply or become applicable to the business or the interpretation or application of laws and regulations by regulatory authorities, and those other risks contained in the Company’s public filings, including in its Management Discussion and Analysis and its Annual Information Form (AIF). Factors that could cause actual results of the Company and its businesses to differ materially from those described in such forward-looking statements include, but are not limited to, a decline in the digital asset market or general economic conditions; changes in laws or approaches to regulation, the failure or delay in the adoption of digital assets and the blockchain ecosystem by institutions; changes in the volatility of crypto currency, changes in demand for Bitcoin and Ethereum, changes in the status or classification of cryptocurrency assets, cybersecurity breaches, a delay or failure in developing infrastructure for the trading businesses or achieving mandates and gaining traction; failure to grow assets under management, an adverse development with respect to an issuer or party to the transaction or failure to obtain a required regulatory approval. In connection with the forward-looking statements contained in this press release, the Company has made assumptions that no significant events occur outside of the Company’s normal course of business and that current trends in respect of digital assets continue. Readers are cautioned that the key metrics disclosed in this press release, including, without limitation,  Assets Under Management and trading volumes fluctuate and may increase and decrease from time to time and that such fluctuations are beyond the Company’s control. Forward-looking statements, past and present performance and trends are not guarantees of future performance, accordingly, you should not put undue reliance on forward-looking statements, current or past performance, or current or past trends. Information identifying assumptions, risks, and uncertainties relating to the Company are contained in its filings with the Canadian securities regulators available at www.sedar.com. The forward-looking statements in this press release are applicable only as of the date of this release or as of the date specified in the relevant forward-looking statement and the Company undertakes no obligation to update any forward-looking statement to reflect events or circumstances after that date or to reflect the occurrence of unanticipated events. The Company assumes no obligation to provide operational updates, except as required by law. If the Company does update one or more forward-looking statements, no inference should be drawn that it will make additional updates with respect to those or other forward-looking statements, unless required by law.Readers are cautioned that past performance is not indicative of future performance and current trends in the business and demand for digital assets may not continue and readers should not put undue reliance on past performance and current trends. All figures are in U.S. dollars unless otherwise noted.
 
SOURCE Voyager Digital, Ltd.

Press Contacts
 
Voyager Digital, Ltd.
Michael Legg
Chief Communications Officer
(212) 547-8807
mlegg@investvoyager.com

Voyager Public Relations Team
pr@investvoyager.com
 

Statement of Financial Position

Statement of Loss

Schwazze (SHWZ) – Reports 3Q21 Results Adding Another Dispensary

Tuesday, November 16, 2021

Schwazze (SHWZ)
Reports 3Q21 Results; Adding Another Dispensary

Medicine Man Technologies, Inc. is now operating under its new trade name, Schwazze. Schwazze is executing its strategy to become a leading vertically integrated cannabis holding company with a portfolio consisting of top-tier licensed brands spanning cultivation, extraction, infused-product manufacturing, dispensary operations, consulting, and a nutrient line. Schwazze leadership includes Colorado cannabis leaders with proven expertise in product and business development as well as top-tier executives from Fortune 500 companies. As a leading platform for vertical integration, Schwazze is strengthening the operational efficiency of the cannabis industry in Colorado and beyond, promoting sustainable growth and increased access to capital, while delivering best-quality service and products to the end consumer. The corporate entity continues to be named Medicine Man Technologies, Inc.

Joe Gomes, Senior Research Analyst, Noble Capital Markets, Inc.

Joshua Zoepfel, Research Associate, Noble Capital Markets, Inc.

Refer to the full report for the price target, fundamental analysis, and rating.

This Company Sponsored Research is provided by Noble Capital Markets, Inc., a FINRA and S.E.C. registered broker-dealer (B/D).

*Analyst certification and important disclosures included in the full report. NOTE: investment decisions should not be based upon the content of this research summary.  Proper due diligence is required before making any investment decision. 

eSports Entertainment Group Inc. (GMBL) – Score One For The House

Tuesday, November 16, 2021

eSports Entertainment Group, Inc. (GMBL)
Score One For The House

Esports Entertainment Group Inc is a development-stage online gambling company focused purely on esports. The company’s principal business operations include design, develop and test wagering systems.

Michael Kupinski, Director of Research, Noble Capital Markets, Inc.

Refer to the full report for the price target, fundamental analysis, and rating.

This Company Sponsored Research is provided by Noble Capital Markets, Inc., a FINRA and S.E.C. registered broker-dealer (B/D).

*Analyst certification and important disclosures included in the full report. NOTE: investment decisions should not be based upon the content of this research summary.  Proper due diligence is required before making any investment decision. 

Release – Allegiant Prepares For Expansion Drilling At Its 100% Owned Eastside Gold Deposit With Commencement Of Road Construction


Allegiant Prepares For Expansion Drilling At Its 100% Owned Eastside Gold Deposit With Commencement Of Road Construction


Reno, Nevada /November 15, 2021 – Allegiant Gold Ltd. (“Allegiant” or the “Company”) (AUAU: TSX-V) (AUXXF: OTCQX) is pleased to announce the commencement of road construction in anticipation of drilling at its 100% owned Eastside Gold Deposit in Nevada (“Eastside”).

The road building is planned to commence in and around the recently discovered high-grade zone within the western edge of the Original Pit Zone (“OPZ”). Allegiant plans to drill up to nine diamond core (“Core”) holes to test the high-grade area at Eastside, where drilling returned:

Additional road construction will occur in and around areas to the east and west of the OPZ to test additional targets. It is expected that, in addition to the Core holes, Allegiant will drill up to 20-30 reverse-circulation (“RC”) holes at relatively shallow depths (see drill map below).

Map 1: 2021-2022 Original Pit Zone Drilling Map
https://allegiantgold.com/site/assets/files/2209/auau_eastside_2021-2022_drill_holes.jpg

Peter Gianulis, CEO of Allegiant Gold, commented: “The recently acquired permit expansion at Eastside has opened up significant drill targets in and around the Original Pit Zone. Road construction is an important next step to having the RC and Core rigs in place for this highly anticipated drilling program.”

Eastside is open in several directions and presently hosts an inferred resource of 1.09 million ounces of gold at 0.55 grams per tonne at the Original Pit Zone and an inferred resource of 314,000 gold ounces at 0.49 g/t Au in the Castle Area, both within pit-constrained models at a cut-off grade of 0.15 g/t Au, US$1,750/ounce gold price and a US$21.88 silver price. Eastside also hosts significant silver resources of 8.7 million ounces at 4.4 g/t Ag at the OPZ.

EASTSIDE RESOURCE ESTIMATE

The updated resource estimate (“Updated Resource Estimate and NI 43-101 Technical Report, Eastside and Castle Gold-Silver Project Technical Report, Esmeralda County, Nevada”) was conducted by Mine Development Associates (“MDA”), a division of RESPEC of Reno, Nevada with an effective date of July 30, 2021. Contained pit-constrained Inferred Resources (cut-off grade of 0.15 g/t) of 1,090,00 Au ounces in 61,730,000 tonnes at 0.55 g/t Au and 8,700,000 Ag ounces at 4.4 g/t Ag at the Original Pit Zone and 314,000 Au ounces in 19,986,000 tonnes at 0.49 g/t Au at the Castle Area. In accordance with NI 43-101, the MDA Technical Report dated July 30, 2021, was filed on SEDAR on August 16, 2021. This report builds on and supersedes the NI 43-101 reports of Ristorcelli (December 2016), Ristorcelli (July 2017), Ristorcelli (January 2020) and Ristorcelli (November 2020) titled “Amended Updated Resource Estimate and NI 43-101 Technical Report, Eastside and Castle Gold-Silver Project, Esmeralda County, Nevada” prepared for Allegiant with an Effective Date of December 30, 2019.

QUALIFIED PERSON

Andy Wallace is a Certified Professional Geologist (CPG) with the American Institute of Professional Geologists and is the Qualified Person under NI 43-101, Standards of Disclosure for Mineral Projects, who has reviewed and approved the scientific and technical content of this press release.

ABOUT ALLEGIANT

Allegiant owns 100% of 10 highly-prospective gold projects in the United States, seven of which are located in the mining-friendly jurisdiction of Nevada. Four of Allegiant’s projects are farmed-out, providing for cost reductions and cash-flow. Allegiant’s flagship, district-scale Eastside project hosts a large and expanding gold resource and is located in an area of excellent infrastructure. Preliminary metallurgical testing indicates that both oxide and sulphide gold mineralization at Eastside is amenable to heap leaching.

ON BEHALF OF THE BOARD

Peter Gianulis
CEO

For more information contact:

Investor Relations
(604) 634-0970 or
1-888-818-1364
ir@allegiantgold.com

Neither TSX Venture Exchange nor its Regulation Services Provider (as that term is defined in policies of the TSX Venture Exchange) accepts responsibility for the adequacy or accuracy of this release.

Certain statements and information contained in this press release constitute “forward-looking statements” within the meaning of applicable U.S. securities laws and “forward-looking information” within the meaning of applicable Canadian securities laws, which are referred to collectively as “forward-looking statements”. The United States Private Securities Litigation Reform Act of 1995 provides a “safe harbor” for certain forward-looking statements.Allegiant Gold Ltd.’s (“Allegiant”) exploration plans for its gold exploration properties, the drill program at Allegiant’s Eastside project, the preparation and publication of an updated resource estimate in respect of the Original Zone at the Eastside project, Allegiant’s future exploration and development plans, including anticipated costs and timing thereof; Allegiant’s plans for growth through exploration activities, acquisitions or otherwise; and expectations regarding future maintenance and capital expenditures, and working capital requirements. Forward-looking statements are statements and information regarding possible events, conditions or results of operations that are based upon assumptions about future economic conditions and courses of action. All statements and information other than statements of historical fact may be forward-looking statements. In some cases, forward-looking statements can be identified by the use of words such as “seek”, “expect”, “anticipate”, “budget”, “plan”, “estimate”, “continue”, “forecast”, “intend”, “believe”, “predict”, “potential”, “target”, “may”, “could”, “would”, “might”, “will” and similar words or phrases (including negative variations) suggesting future outcomes or statements regarding an outlook. Such forward-looking statements are based on a number of material factors and assumptions and involve known and unknown risks, uncertainties and other factors which may cause actual results, performance or achievements, or industry results, to differ materially from those anticipated in such forward-looking information. You are cautioned not to place undue reliance on forward-looking statements contained in this press release. Some of the known risks and other factors which could cause actual results to differ materially from those expressed in the forward-looking statements are described in the sections entitled “Risk Factors” in Allegiant’s Listing Application, dated January 24, 2018, as filed with the TSX Venture Exchange and available on SEDAR under Allegiant’s profile at www.sedar.com. Actual results and future events could differ materially from those anticipated in such statements. Allegiant undertakes no obligation to update or revise any forward-looking statements included in this press release if these beliefs, estimates and opinions or other circumstances should change, except as otherwise required by applicable law.

QuickChek – November 15, 2021


Schwazze Signs Definitive Agreement to Acquire Smoking Gun, LLC & Smoking Gun Land Company, LLC

Schwazze announced that it has signed definitive documents to acquire the assets of Smoking Gun, LLC and Smoking Gun Land Company, LLC

Research, News & Market Data on Schwazze

Watch recent presentation from Schwazze


Ayala Pharmaceuticals Reports Third Quarter 2021 Financial Results and Provides Business Update

Ayala Pharmaceuticals announced reported financial results for the period ended September 30, 2021 and highlighted recent progress and upcoming milestones for its pipeline programs

Research, News & Market Data on Ayala Pharmaceuticals

Watch recent presentation from Ayala Pharmaceuticals


Cocrystal Pharma Reports Third Quarter Financial Results and Provides an Update on Development Programs and Milestones

Cocrystal Pharma announced financial results for the three and nine months ended September 30, 2021, and provides updates on its antiviral pipeline, upcoming milestones and business activities

Research, News & Market Data on Cocrystal Pharma

Watch recent presentation from Cocrystal Pharma


Stay up to date. Follow us:


Release – Cocrystal Pharma Reports Third Quarter Financial Results and Provides an Update on Development Programs and Milestones


Cocrystal Pharma Reports Third Quarter Financial Results and Provides an Update on Development Programs and Milestones


BOTHELL, Wash., Nov. 15, 2021 (GLOBE NEWSWIRE) — Cocrystal Pharma, Inc. (Nasdaq: COCP) (“Cocrystal” or the “Company”), a clinical-stage biotechnology company, reports financial results for the three and nine months ended September 30, 2021, and provides updates on its antiviral pipeline, upcoming milestones and business activities.

“Today we are reporting progress with our promising COVID-19 antiviral development programs along with setting the goal of beginning first-in-human clinical studies with our novel SARS-CoV-2 protease inhibitors in 2022,” said Sam Lee, Ph.D., co-interim CEO and President of Cocrystal. “We expect comments from the U.S. Food and Drug Administration (FDA) by mid-December on our pre-IND briefing package for our intranasal/pulmonary-delivered SARS-CoV-2 protease inhibitor CDI-45205, our most advanced SARS-CoV-2 program. The FDA’s comments will be useful in designing the Phase 1 and Phase 2 clinical trial protocols for this program.

“Under our second SARS-CoV-2 program, this one targeting oral administration, by year-end 2021 we expect to select a lead candidate from novel SARS-CoV-2 protease inhibitors discovered using our proprietary structure-based technology,” he added. “We will then prepare a pre-IND briefing package to submit to the FDA with the goal of initiating a clinical trial in 2022. Work also continues with a third COVID-19 program using our platform to discover oral replication inhibitors for the treatment of COVID-19.

“Regarding our influenza programs, our supplier is manufacturing our novel PB2 inhibitor CC-42344 for pandemic and seasonal influenza A. We expect patient enrollment in our Phase 1 trial to begin in early 2022 with data readouts later that same year,” said Dr. Lee. “With the influenza A/B program, we anticipate providing an update on the development of the compounds jointly discovered with Merck using our technology platform in the first quarter 2022.”

“With the proceeds from financings completed earlier this year and a clean balance sheet, we believe our capital is sufficient to fund planned operations. This outlook includes our goal of having multiple high-value antiviral compounds in clinical development next year as we advance our programs toward commercialization,” said James Martin, co-interim CEO and CFO. “We are aggressively pursuing the advancement of these potent compounds as we navigate a challenging global supply chain. Thankfully our strong partnership with CROs has benefited us to that extent.”

Antiviral Pipeline Overview

COVID-19 and Other Coronavirus Programs

Influenza Programs

Norovirus Program

Hepatitis C Program

Third Quarter Financial Results

Throughout 2020 Cocrystal reported quarterly revenues under an influenza A/B collaboration with Merck consisting of research and development (R&D) services performed by Cocrystal and reimbursed by Merck.

As discussed above, in January 2021 Merck assumed all activities and expenses associated with the continued development of the influenza A/B compounds discovered under this collaboration. As anticipated, Cocrystal reported no revenues for the third quarter of 2021 compared with $489,000 in revenues for the third quarter of 2020. Under the terms of the Merck collaboration, Cocrystal is eligible to receive up to $156 million in payments related to designated developments, regulatory and sales milestones, as well as royalties on product sales.

R&D expenses for the third quarter of 2021 were $2.2 million compared with $2.1 million for the third quarter of 2020, with the increase primarily related to COVID-19 and influenza programs advancement. The Company expects R&D expenses to increase in the fourth quarter of 2021 due to the advancement of our influenza A program into clinical trials and progress with our pre-clinical COVID-19 program toward clinical development. General and administrative (G&A) expenses for the third quarter of 2021 were $1.8 million compared with $1.1 million for the prior-year quarter, with the increase primarily due to litigation settlements.

The net loss for the third quarter of 2021 was $3.9 million, or $0.04 per share, compared with a net loss for the third quarter of 2020 of $2.7 million, or $0.05 per share.

Year to Date Financial Results

The Company reported no revenues for the first nine months of 2021 versus $1.5 million for the first nine months of 2020. The 2020 revenues were from reimbursed R&D services performed under the influenza A/B program with Merck.

R&D expenses for the first nine months of 2021 increased 22% to $6.5 million and G&A expenses decreased 6% to $4.0 million, both compared with the first nine months of 2020. The higher R&D expenses in 2021 were primarily due to COVID-19 and influenza programs advancement.

The net loss for the nine months ended September 30, 2021 was $10.5 million, or $0.12 per share, compared with a net loss for the nine months ended September 30, 2020 of $8.2 million, or $0.16 per share.

The Company reported unrestricted cash of $61.6 million as of September 30, 2021 compared with $33.0 million as of December 31, 2020. The Company reported working capital of $61.2 million as of September 30, 2021.

About Cocrystal Pharma, Inc.
Cocrystal Pharma, Inc. is a clinical-stage biotechnology company discovering and developing novel antiviral therapeutics that target the replication process of influenza viruses, coronaviruses (including SARS-CoV-2), hepatitis C viruses and noroviruses. Cocrystal employs unique structure-based technologies and Nobel Prize-winning expertise to create first- and best-in-class antiviral drugs. For further information about Cocrystal, please visit www.cocrystalpharma.com.

Cautionary Note Regarding Forward-Looking Statements
press release contains forward-looking statements within the meaning of the Private Securities Litigation Reform Act of 1995, including statements regarding our goals of initiating Phase 1 studies in 2022, selection of a lead candidate for our second SARS-CoV-2 program by year end, our attempts to discover replication inhibitors, our initiation of the Australian clinical trial, our development of antiviral treatments for norovirus, our expectations concerning R&D expenses, our plans to provide a program update on the Merck influenza A/B research, and our liquidity. The words “believe,” “may,” “estimate,” “continue,” “anticipate,” “intend,” “should,” “plan,” “could,” “target,” “potential,” “is likely,” “will,” “expect” and similar expressions, as they relate to us, are intended to identify forward-looking statements. We have based these forward-looking statements largely on our current expectations and projections about future events. Some or all of the events anticipated by these forward-looking statements may not occur. Important factors that could cause actual results to differ from those in the forward-looking statements include, but are not limited to, the risks arising from supply chain disruptions on our ability to obtain products including raw materials and test animals as well as similar problems with our vendors and our current CRO and future CROs and CMOs, the impact of the COVID-19 pandemic on the national and global economy, the ability of our CROs to recruit volunteers for, and to proceed with, clinical trials, possible delays resulting from the lockdown in Australia, the cooperation of the FDA in accelerating development in our COVID-19 program, our reliance on Merck for further development in the influenza A/B program under the license and collaboration agreement, our collaboration partners’ technology and software performing as expected, the results of future preclinical and clinical trials, general risks arising from clinical trials, receipt of regulatory approvals, regulatory changes, and development of effective treatments and/or vaccines by competitors, including as part of the programs financed by the U.S. government. Further information on our risk factors is contained in our filings with the SEC, including our Annual Report on Form 10-K for the year ended December 31, 2020. Any forward-looking statement made by us herein speaks only as of the date on which it is made. Factors or events that could cause our actual results to differ may emerge from time to time, and it is not possible for us to predict all of them. We undertake no obligation to publicly update any forward-looking statement, whether as a result of new information, future developments or otherwise, except as may be required by law.

Investor Contact:
LHA Investor Relations
Jody Cain
310-691-7100
jcain@lhai.com

Financial Tables to follow

 COCRYSTAL PHARMA, INC.

CONSOLIDATED BALANCE SHEETS
(in thousands)

    September 30, 2021     December 31, 2020  
    (unaudited)        
Assets                
Current assets:                
Cash   $ 61,644     $ 33,010  
Restricted cash     50       50  
Accounts receivable           556  
Prepaid expenses and other current assets     747       399  
Total current assets     62,441       34,015  
Property and equipment, net     493       591  
Deposits     46       46  
Operating lease right-of-use assets, net (including $167 and $37, respectively, to related party)     526       498  
Goodwill     19,092       19,092  
Total assets   $ 82,598     $ 54,242  
Liabilities and stockholders’ equity                
Current liabilities:                
Accounts payable and accrued expenses   $ 961     $ 1,080  
Current maturities of finance lease liabilities     29       39  
Current maturities of operating lease liabilities (including $167 and $39, respectively, to related party)     204       178  
Derivative liabilities     34       61  
Total current liabilities     1,228       1,358  
Long-term liabilities:                
Finance lease liabilities     14       34  
Operating lease liabilities     344       345  
Total long-term liabilities     358       379  
Total liabilities     1,586       1,737  
Commitments and contingencies (note 9)                
Stockholders’ equity:                
Common stock, $0.001 par value; 150,000 shares authorized; 97,469 and 70,439 shares issued and outstanding as of September 30, 2021 and December 31, 2020, respectively     98       71  
Additional paid-in capital     336,322       297,342  
Accumulated deficit     (255,408 )     (244,908 )
Total stockholders’ equity     81,012       52,505  
Total liabilities and stockholders’ equity   $ 82,598     $ 54,242  

COCRYSTAL PHARMA, INC.

CONSOLIDATED STATEMENTS OF OPERATIONS
(in thousands, except per share data)

    Three months ended
September 30,
    Nine months ended
September 30,
 
    2021     2020     2021     2020  
                         
Revenues:                                
Collaboration revenue   $     $ 489     $     $ 1,504  
            489             1,504  
Operating expenses:                                
Research and development     2,165       2,077       6,489       5,336  
General and administrative     1,788       1,121       4,030       4,284  
Total operating expenses     3,953       3,198       10,519       9,624  
                                 
Loss from operations     (3,953 )     (2,709 )     (10,519 )     (8,120 )
                                 
Other income (expense):                                
Interest expense, net     (1 )     (2 )     (4 )     (6 )
Foreign exchange loss     (4 )           (4 )      
Change in fair value of derivative liabilities     17       41       27       (29 )
Total other income (expense), net     12       39       19       (35 )
Net loss   $ (3,941 )   $ (2,670 )   $ (10,500 )   $ (8,155 )
                                 
Net loss per common share, basic and diluted   $ (0.04 )   $ (0.05 )     (0.12 )     (0.16 )
Weighted average number of common shares outstanding, basic and diluted     97,469       57,555       85,301       50,491  

Source: Cocrystal Pharma, Inc.