![]()
Kelly® Declares Quarterly Dividend
Research, News, and Market Data on Kelly
About Kelly®
KLYA-FIN
ANALYST & MEDIA CONTACT:
(248) 244-4586
james_polehna@kellyservices.com
SOURCE
Looking for the next apple? This is the orchard.
![]()
Research, News, and Market Data on Kelly
About Kelly®
KLYA-FIN
ANALYST & MEDIA CONTACT:
(248) 244-4586
james_polehna@kellyservices.com
SOURCE
![]()
Research, News, and Market Data on Schwazze
Additional Indoor Grow Acquisition Increases Cultivation Capacity
Company Continues to Execute Growth Strategy Through Acquisitions
DENVER, Feb. 16, 2022 /CNW/ – Schwazze, (OTCQX: SHWZ) (“Schwazze” or the “Company”), announced today that it has closed the transaction to acquire the assets of Brow 2, LLC, located in Denver, Colorado. The planned transaction includes a 37,000 square foot building and equipment designed for indoor cultivation. This transaction continues Schwazze’s aggressive expansion in Colorado and will enhance the Company’s cultivation capabilities, providing product directly to its dispensaries. The consideration for the acquisition was $6.7 million and was paid in cash at closing.
“This is another step in building operational depth and capabilities in Colorado for Schwazze. This acquisition will add a talented team of growers, high-quality indoor flower cultivation capacity, new strain genetics, and another profitable asset to our platform. The new facility will supply our growing network of dispensaries and customers with a broad assortment of high-quality indoor flower,” said Justin Dye, Schwazze’s CEO.
Corporate Update
Late in 2021, Schwazze announced a transformational $95 million raise with institutional investors and individuals, allowing the Company to expedite its aggressive expansion plans and become a regional MSO with operations in Colorado and New Mexico. The Company’s differentiated strategy is to build a leadership position in retail and operational depth within its operating areas.
Since December 2021, Schwazze has completed five acquisitions adding a total of 15 cannabis dispensaries, including Smoking Gun (December 2021); Drift (February 2022); Emerald Fields (February 2022); and the ten Greenleaf New Mexico dispensaries (February 2022). See Figure #1, outlining Schwazze’s dispensary assets.
Since July 2021, the Company has acquired a total of six cultivation facilities, two in Colorado including, SCG Holding LLC (July 2021); and Brow 2 LLC (February 2022) – and four licensed in New Mexico (February 2022). The Greenleaf New Mexico acquisition also added a manufacturing asset, Elemental Kitchen & Laboratories, LLC to the Company’s Purplebee’s manufacturing plant in Colorado.
The Company continues to evaluate merger and acquisition transactions that meet our strategic screening criteria.
About Schwazze
Schwazze (OTCQX: SHWZ) is building a premier vertically integrated regional cannabis company with assets in Colorado and New Mexico and will continue to take its operating system to other states where it can develop a differentiated regional leadership position. Schwazze is the parent company of a portfolio of leading cannabis businesses and brands spanning seed to sale. The Company is committed to unlocking the full potential of the cannabis plant to improve the human condition. Schwazze is anchored by a high-performance culture that combines customer-centric thinking and data science to test, measure, and drive decisions and outcomes. The Company’s leadership team has deep expertise in retailing, wholesaling, and building consumer brands at Fortune 500 companies as well as in the cannabis sector. Schwazze is passionate about making a difference in our communities, promoting diversity and inclusion, and doing our part to incorporate climate-conscious best practices. Medicine Man Technologies, Inc. was Schwazze’s former operating trade name. The corporate entity continues to be named Medicine Man Technologies, Inc.
Schwazze derives its name from the pruning technique of a cannabis plant to enhance plant structure and promote healthy growth.
Figure #1
")
Forward-Looking Statements
This press release contains “forward-looking statements.” Such statements may be preceded by the words “plan,” “will,” “may,”, “predicts,” or similar words. Forward-looking statements are not guarantees of future events or performance, are based on certain assumptions, and are subject to various known and unknown risks and uncertainties, many of which are beyond the Company’s control and cannot be predicted or quantified. Consequently, actual events and results may differ materially from those expressed or implied by such forward-looking statements. Such risks and uncertainties include, without limitation, risks and uncertainties associated with (i) our inability to manufacture our products and product candidates on a commercial scale on our own or in collaboration with third parties; (ii) difficulties in obtaining financing on commercially reasonable terms; (iii) changes in the size and nature of our competition; (iv) loss of one or more key executives or scientists; (v) difficulties in securing regulatory approval to market our products and product candidates; (vi) our ability to successfully execute our growth strategy in Colorado and outside the state, (vii) our ability to consummate the acquisition described in this press release or to identify and consummate future acquisitions that meet our criteria, (viii) our ability to successfully integrate acquired businesses and realize synergies therefrom, (ix) the ongoing COVID-19 pandemic, * the timing and extent of governmental stimulus programs, (xi) the uncertainty in the application of federal, state and local laws to our business, and any changes in such laws, and * out ability to satisfy the closing conditions for the private finding described in this press release. More detailed information about the Company and the risk factors that may affect the realization of forward-looking statements is set forth in the Company’s filings with the Securities and Exchange Commission (SEC), including the Company’s Annual Report on Form 10-K and its Quarterly Reports on Form 10-Q. Investors and security holders are urged to read these documents free of charge on the SEC’s website at http://www.sec.gov. The Company assumes no obligation to publicly update or revise its forward-looking statements as a result of new information, future events or otherwise except as required by law.
SOURCE Schwazze

Wednesday, February 16, 2022
Euroseas Ltd. provides ocean-going transportation services worldwide. The company owns and operates containerships that transport dry and refrigerated containerized cargoes, including manufactured products and perishables; and drybulk carriers that transport iron ore, coal, grains, bauxite, phosphate, and fertilizers. As of March 31, 2017, it had a fleet of seven containerships; and six drybulk carriers, including three Panamax drybulk carriers, one Handymax drybulk carrier, one Kamsarmax drybulk carrier, and one Ultramax drybulk carrier. The company was founded in 2005 and is based in Maroussi, Greece.
Poe Fratt, Senior Research Analyst, Noble Capital Markets, Inc.
Refer to the full report for the price target, fundamental analysis, and rating.
Reported EBITDA of $26.1 million slightly above expectations. Adding back dry dock expenses, we calculate adjusted 4Q2021 EBITDA of $27.3 million on TCE rates of $30.0k/day. Full year adjusted EBITDA was $56.8 million on TCE rates of $19.3k/day.
Forward 2022 cover of 97% at average TCE rates of $30.0k/day creates high visibility. Recent fixtures pushed 2022 forward cover to 97%, and there are only two remaining opportunities to move TCE rates closer to market rates. At an average TCE rate of $30.6K/day, forward cover represents a solid base and our 2022 EBITDA estimate is $121.6 million, or well above our adjusted 2021 EBITDA of $56.8 …

This research is provided by Noble Capital Markets, Inc., a FINRA and S.E.C. registered broker-dealer (B/D).
*Analyst certification and important disclosures included in the full report. NOTE: investment decisions should not be based upon the content of this research summary. Proper due diligence is required before making any investment decision.
Wednesday, February 16, 2022
Voyager Digital Ltd through its subsidiary, operates as a crypto asset broker that provides retail and institutional investors with a turnkey solution to trade crypto assets. The company offers investors execution, data, wallet and custody services through its institutional-grade open architecture platform.
Joe Gomes, Senior Research Analyst, Noble Capital Markets, Inc.
Joshua Zoepfel, Research Associate, Noble Capital Markets, Inc.
Refer to the full report for the price target, fundamental analysis, and rating.
2Q22 Results. Voyager reported $164.8 million of revenue for 2Q22, in-line with the $165 million guidance. Merchant services added nearly $16 million of overall revenue and staking revenue was $20.7 million. We had projected revenue of $141 million. Voyager reported net income of $2.6 million for the quarter, or $0.01 per share, in-line with consensus, but below our $0.06 estimate.
Key Metrics. Total verified users grew to 3.2 million as of December 31st, up from 2.15 million on September 30th, while total funded accounts rose to 1.074 million from 860,000 over the same period. Total funded to total verified fell to .336 from .400. We expect a portion of this reflects the hugely successful Mavericks promotion. Net new deposits in the fiscal second quarter totaled $1.04 …
This Company Sponsored Research is provided by Noble Capital Markets, Inc., a FINRA and S.E.C. registered broker-dealer (B/D).
*Analyst certification and important disclosures included in the full report. NOTE: investment decisions should not be based upon the content of this research summary. Proper due diligence is required before making any investment decision.
Anne Trafton | MIT News Office
Many people develop Alzheimer’s or other forms of dementia as they get older. However, others remain sharp well into old age, even if their brains show underlying signs of neurodegeneration.
Among these cognitively resilient people, researchers have identified education level and amount of time spent on intellectually stimulating activities as factors that help prevent dementia. A new study by MIT researchers shows that this kind of enrichment appears to activate a gene family called MEF2, which controls a genetic program in the brain that promotes resistance to cognitive decline.
The researchers observed this link between MEF2 and cognitive resilience in both humans and mice. The findings suggest that enhancing the activity of MEF2 or its targets might protect against age-related dementia.
“It’s increasingly understood that there are resilience factors that can protect the function of the brain,” says Li-Huei Tsai, director of MIT’s Picower Institute for Learning and Memory. “Understanding this resilience mechanism could be helpful when we think about therapeutic interventions or prevention of cognitive decline and neurodegeneration-associated dementia.” Tsai is the senior author of the study, which appeared in Science Translational Medicine. The lead authors are recent MIT Ph.D. recipient Scarlett Barker and MIT postdoctoral fellow and Boston Children’s Hospital physician Ravikiran (Ravi) Raju.
Protective Effects
A large body of research suggests that environmental stimulation offers some protection against the effects of neurodegeneration. Studies have linked education level, type of job, number of languages spoken, and amount of time spent on activities such as reading and doing crossword puzzles to higher degrees of cognitive resilience.
The MIT team set out to try to figure how these environmental factors affect the brain at the neuronal level. They looked at human datasets and mouse models in parallel, and both tracks converged on MEF2 as a critical player.
MEF2 is a transcription factor that was originally identified as a factor important for cardiac muscle development but later was discovered to play a role in neuron function and neurodevelopment. In two human datasets comprising slightly more than 1,000 people altogether, the MIT team found that cognitive resilience was highly correlated with expression of MEF2 and many of the genes that it regulates.
Many of those genes encode ion channels, which control a neuron’s excitability, or how easily it fires an electrical impulse. The researchers also found, from a single-cell RNA-sequencing study of human brain cells, that MEF2 appears to be most active in a subpopulation of excitatory neurons in the prefrontal cortex of resilient individuals.
To study cognitive resilience in mice, the researchers compared mice who were raised in cages with no toys, and mice placed in a more stimulating environment with a running wheel and toys that were swapped out every few days. As they found in the human study, MEF2 was more active in the brains of the mice exposed to the enriched environment. These mice also performed better in learning and memory tasks.
When the researchers knocked out the gene for MEF2 in the frontal cortex, this blocked the mice’s ability to benefit from being raised in the enriched environment, and their neurons became abnormally excitable.
“This was particularly exciting as it suggested that MEF2 plays a role in determining overall cognitive potential in response to variables in the environment,” Raju says.
The researchers then explored whether MEF2 could reverse some of the symptoms of cognitive impairment in a mouse model that expresses a version of the tau protein that can form tangles in the brain and is linked with dementia. If these mice were engineered to overexpress MEF2 at a young age, they did not show the usual cognitive impairments produced by the tau protein later in life. In these mice, neurons overexpressing MEF2 were less excitable.
“A lot of human studies and mouse model studies of neurodegeneration have shown that the neurons become hyperexcitable in early stages of disease progression,” Raju says. “When we overexpressed MEF2 in a mouse model of neurodegeneration, we saw that it was able to prevent this hyperexcitability, which might explain why they performed cognitively better than control mice.”
Enhancing Resilience
The findings suggest that enhancing MEF2 activity could help to protect against dementia; however, because MEF2 also affects other types of cells and cellular processes, more study is needed to make sure that activating it wouldn’t have adverse side effects, the researchers say.
The MIT team now hopes to further investigate how MEF2 becomes activated by exposure to an enriching environment. They also plan to examine some of the effects of the other genes that MEF2 controls, beyond the ion channels they explored in this study. Such studies could help to reveal additional targets for drug treatments.
“You could potentially imagine a more targeted therapy by identifying a subset or a class of effectors that is critically important for inducing resilience and neuroprotection,” Raju says.
Suggested Reading
 Advancing Research into Alzheimer’s Disease with Stem Cells
|
 Understanding Alzheimer’s, Dementia, ALS, and Neurodegenerative Diseases
|
 The Anti-Aging and Rejuvenating Properties of Stem Cells
|
 FDA Oncology Director Expresses Concerns Over Applicability of Chinese Data
|

Stay up to date. Follow us:

|
![]()
Research, News, and Market Data on Schwazze
Additional Indoor Grow Acquisition Increases Cultivation Capacity
Company Continues to Execute Growth Strategy Through Acquisitions
DENVER, Feb. 16, 2022 /CNW/ – Schwazze, (OTCQX: SHWZ) (“Schwazze” or the “Company”), announced today that it has closed the transaction to acquire the assets of Brow 2, LLC, located in Denver, Colorado. The planned transaction includes a 37,000 square foot building and equipment designed for indoor cultivation. This transaction continues Schwazze’s aggressive expansion in Colorado and will enhance the Company’s cultivation capabilities, providing product directly to its dispensaries. The consideration for the acquisition was $6.7 million and was paid in cash at closing.
“This is another step in building operational depth and capabilities in Colorado for Schwazze. This acquisition will add a talented team of growers, high-quality indoor flower cultivation capacity, new strain genetics, and another profitable asset to our platform. The new facility will supply our growing network of dispensaries and customers with a broad assortment of high-quality indoor flower,” said Justin Dye, Schwazze’s CEO.
Corporate Update
Late in 2021, Schwazze announced a transformational $95 million raise with institutional investors and individuals, allowing the Company to expedite its aggressive expansion plans and become a regional MSO with operations in Colorado and New Mexico. The Company’s differentiated strategy is to build a leadership position in retail and operational depth within its operating areas.
Since December 2021, Schwazze has completed five acquisitions adding a total of 15 cannabis dispensaries, including Smoking Gun (December 2021); Drift (February 2022); Emerald Fields (February 2022); and the ten Greenleaf New Mexico dispensaries (February 2022). See Figure #1, outlining Schwazze’s dispensary assets.
Since July 2021, the Company has acquired a total of six cultivation facilities, two in Colorado including, SCG Holding LLC (July 2021); and Brow 2 LLC (February 2022) – and four licensed in New Mexico (February 2022). The Greenleaf New Mexico acquisition also added a manufacturing asset, Elemental Kitchen & Laboratories, LLC to the Company’s Purplebee’s manufacturing plant in Colorado.
The Company continues to evaluate merger and acquisition transactions that meet our strategic screening criteria.
About Schwazze
Schwazze (OTCQX: SHWZ) is building a premier vertically integrated regional cannabis company with assets in Colorado and New Mexico and will continue to take its operating system to other states where it can develop a differentiated regional leadership position. Schwazze is the parent company of a portfolio of leading cannabis businesses and brands spanning seed to sale. The Company is committed to unlocking the full potential of the cannabis plant to improve the human condition. Schwazze is anchored by a high-performance culture that combines customer-centric thinking and data science to test, measure, and drive decisions and outcomes. The Company’s leadership team has deep expertise in retailing, wholesaling, and building consumer brands at Fortune 500 companies as well as in the cannabis sector. Schwazze is passionate about making a difference in our communities, promoting diversity and inclusion, and doing our part to incorporate climate-conscious best practices. Medicine Man Technologies, Inc. was Schwazze’s former operating trade name. The corporate entity continues to be named Medicine Man Technologies, Inc.
Schwazze derives its name from the pruning technique of a cannabis plant to enhance plant structure and promote healthy growth.
Figure #1
Forward-Looking Statements
This press release contains “forward-looking statements.” Such statements may be preceded by the words “plan,” “will,” “may,”, “predicts,” or similar words. Forward-looking statements are not guarantees of future events or performance, are based on certain assumptions, and are subject to various known and unknown risks and uncertainties, many of which are beyond the Company’s control and cannot be predicted or quantified. Consequently, actual events and results may differ materially from those expressed or implied by such forward-looking statements. Such risks and uncertainties include, without limitation, risks and uncertainties associated with (i) our inability to manufacture our products and product candidates on a commercial scale on our own or in collaboration with third parties; (ii) difficulties in obtaining financing on commercially reasonable terms; (iii) changes in the size and nature of our competition; (iv) loss of one or more key executives or scientists; (v) difficulties in securing regulatory approval to market our products and product candidates; (vi) our ability to successfully execute our growth strategy in Colorado and outside the state, (vii) our ability to consummate the acquisition described in this press release or to identify and consummate future acquisitions that meet our criteria, (viii) our ability to successfully integrate acquired businesses and realize synergies therefrom, (ix) the ongoing COVID-19 pandemic, * the timing and extent of governmental stimulus programs, (xi) the uncertainty in the application of federal, state and local laws to our business, and any changes in such laws, and * out ability to satisfy the closing conditions for the private finding described in this press release. More detailed information about the Company and the risk factors that may affect the realization of forward-looking statements is set forth in the Company’s filings with the Securities and Exchange Commission (SEC), including the Company’s Annual Report on Form 10-K and its Quarterly Reports on Form 10-Q. Investors and security holders are urged to read these documents free of charge on the SEC’s website at http://www.sec.gov. The Company assumes no obligation to publicly update or revise its forward-looking statements as a result of new information, future events or otherwise except as required by law.
SOURCE Schwazze
![]()
Research, News, and Market Data on Euroseas Ltd
ATHENS, Greece, Feb. 15, 2022 (GLOBE NEWSWIRE) — Euroseas Ltd. (NASDAQ: ESEA, the “Company” or “Euroseas”), an owner and operator of container carrier vessels and provider of seaborne transportation for containerized cargoes, announced today its results for the three-month period and full year ended December 31, 2021.
Fourth Quarter 2021 Financial Highlights:
Total net revenues of $38.3 million. Net income and net income attributable to common shareholders of $22.7 million or $3.14 and $3.13 earnings per share basic and diluted, respectively. Adjusted net income attributable to common shareholders1 for the period was $22.9 million or $3.18 and $3.17 per share basic and diluted, respectively.
Adjusted EBITDA1 was $26.1 million.
An average of 15.01 vessels were owned and operated during the fourth quarter of 2021 earning an average time charter equivalent rate of $29,994 per day.
Full Year 2021 Highlights:
Total net revenues of $93.9 million. Net income of $42.9 million; net income attributable to common shareholders (after a $0.3 million dividend on Series B Preferred Shares and a $0.3 million of preferred deemed dividend arising out of the redemption of approximately $8.4 million of Series B Preferred Shares in the first half of 2021) of $42.3 million or $6.06 and $6.05 earnings per share basic and diluted, respectively. Adjusted net income attributable to common shareholders1 for the period was $42.0 million or $6.02 and $6.01 per share basic and diluted, respectively.
Adjusted EBITDA1 was $52.7 million.
An average of 14.25 vessels were owned and operated during the year 2021, earning an average time charter equivalent rate of $19,309 per day.
Recent developments
On January 28, 2022, we signed a contract for the construction of two additional Eco design fuel efficient containerships. The vessels will have a carrying capacity of about 2,800 teu each and will be built at Hyundai Mipo Dockyard Co. in South Korea. The two newbuildings are scheduled to be delivered during the fourth quarter of 2023 and first quarter of 2024, respectively. The total consideration for each of these two newbuilding contracts is approximately $43.15 million and will be financed with a combination of debt and equity. The vessels are sisterships of a pair of vessels ordered by Euroseas Ltd. in June 2021.
_____________________________________________
1Adjusted EBITDA, Adjusted net income and Adjusted earnings per share are not recognized measurements under U.S. GAAP (GAAP) and should not be used in isolation or as a substitute for Euroseas financial results presented in accordance with GAAP. Refer to a subsequent section of the Press Release for the definitions and reconciliation of these measurements to the most directly comparable financial measures calculated and presented in accordance with GAAP.
Aristides Pittas, Chairman and CEO of Euroseas commented:
“The fourth quarter of 2021 was a seminal one for Euroseas as we recorded the highest net income level in our history of about $22.7 million. At the same time, we have chartered about 92% of our available capacity in 2022, about 62% of our available capacity in 2023, and even about 40% of our available days in 2024. The high level of our contracted revenues secures extremely high profitability levels for Euroseas over the next two to three years.”
“In light of the increased environmental regulation that would reduce -on average- the transportation capacity of the existing fleet, we have shifted our strategic focus on how to position Euroseas post-pandemic and beyond. In this context, in January 2022, we placed an order for two more 2,800 teu vessels that we expect to have delivered in the fourth quarter of 2023 and first quarter of 2024. This brings our newbuilding program to four vessels and solidifies our market presence in the large eco feeder sector.”
“The retreat of the containerships rates during November and December 2021 proved to be short-lived. With the turn of the year, containership rates started increasing again and have returned to -and for some segments exceeded- the record high levels set only four months ago in October 2021. We are quite optimistic about the strength of the market over the next couple of years despite the expected easing of the inefficiencies in ports, due to the limited deliveries in the near term and the constraints on effective fleet supply of the emissions regulations from 2023 onwards alongside trade growth which has rebounded from the pandemic lows. We continuously monitor market developments and evaluate investment opportunities focusing on creating consistent returns for our shareholders and exploiting our public listing and increasing liquidity position.”
Tasos Aslidis, Chief Financial Officer of Euroseas commented: “The operating results of the fourth quarter of 2021 reflect the increased levels of charter rates in the containership markets as compared to the same period of 2020, with net income amounting to $22.7 million for the fourth quarter in 2021 compared to a net income of $0.6 million for the fourth quarter of 2020. On average, during the fourth quarter of 2021, our vessels earned approximately 185.7% higher time charter equivalent rates compared to the fourth quarter of 2020.”
“Total daily vessel operating expenses, including management fees, general and administrative expenses, but excluding drydocking costs, were higher by 7.6% during the fourth quarter of 2021 compared to the same quarter of last year. The increased operating expenses for the fourth quarter of 2021 are mainly due to higher hull and machinery insurance premiums and the increased crewing costs for our vessels resulting from difficulties in crew rotation due to COVID-19 related restrictions. Adjusted EBITDA during the fourth quarter of 2021 was $26.1 million compared to the $2.1 million achieved in fourth quarter of last year, and it reached $52.7 million versus $11.8 million for the respective twelve-month periods of 2021 and 2020.”
“As of December 31, 2021, our outstanding bank debt (excluding the unamortized loan fees) was $119.0 million, versus restricted and unrestricted cash of approximately $31.5 million. As of the same date, our scheduled debt repayments over the next 12 months amounted to about $29.3 million (excluding the unamortized loan fees).”
Fourth Quarter 2021 Results:
For the fourth quarter of 2021, the Company reported total net revenues of $38.3 million representing a 217.9% increase over total net revenues of $12.0 million during the fourth quarter of 2020, which was the result of the increased average time charter rates our vessels earned in the fourth quarter of 2021 compared to the corresponding period of 2020. The Company reported net income and net income attributable to common shareholders for the period of $22.7 million, as compared to a net income of $0.6 million and a net income attributable to common shareholders of $0.4 million for the fourth quarter of 2020.
Vessel operating expenses for the same period of 2021 amounted to $8.3 million as compared to $7.5 million for the same period of 2020. The increased amount is mainly due to the higher number of vessels owned and operated in the three months of 2021 compared to the same period of 2020, as well as the increased crewing costs for our vessels compared to the same period of 2020, resulting from difficulties in crew rotation due to COVID-19 related restrictions and the increase in hull and machinery insurance premiums. Drydocking expenses amounted to $1.2 million during the fourth quarter of 2021 comprising the cost of one vessel completing her special survey with drydock. For the same period of 2020 drydocking expenses amounted to $0.1 million comprising the cost of one vessel completing her intermediate survey in-water. Depreciation expense for the fourth quarter of 2021 increased to $2.4 million from $1.6 million in the fourth quarter of 2020, as a result of the increased number of vessels operated and the fact that the new vessels acquired in the fourth quarter of 2021 have a higher average daily depreciation charge as a result of their higher acquisition price compared to the remaining vessels. General and administrative expenses increased to $1.2 million in the fourth quarter of 2021, as compared to $0.8 million in the fourth quarter of 2020, mainly due to higher executive compensation expenses.
On average, 15.01 vessels were owned and operated during the fourth quarter of 2021 earning an average time charter equivalent rate of $29,994 per day compared to 14.43 vessels in the same period of 2020 earning on average $10,497 per day.
Interest and other financing costs for the fourth quarter of 2021 amounted to $0.78 million compared to $0.81 million for the same period of 2020. This decrease is due to the decrease in the weighted average LIBOR rate, partly offset by the increase in the Company’s average outstanding indebtedness in the current period compared to the same period of 2020.
Adjusted EBITDA1 for the fourth quarter of 2021 was $26.1 million compared to $2.1 million for the corresponding period in 2020.
Basic and diluted earnings per share attributable to common shareholders for the fourth quarter of 2021 was $3.14 and $3.13 calculated on 7,210,466 and 7,244,042 basic and diluted weighted average number of shares outstanding, respectively, compared to basic and diluted earnings per share of $0.07 for the fourth quarter of 2020, calculated on 6,149,300 basic and diluted weighted average number of shares outstanding.
Excluding the effect on the income attributable to common shareholders for the quarter of the unrealized loss on derivatives, the amortization of below market time charters acquired and the depreciation charged due to the increased value of the vessel acquired with below market time charter, the adjusted earnings attributable to common shareholders for the quarter ended December 31, 2021 would have been $3.18 and $3.17 per share basic and diluted, respectively, compared to an adjusted loss of $0.16 per share basic and diluted for the quarter ended December 31, 2020, after excluding unrealized gain on derivatives, net gain on sale of vessels, the amortization of below market time charters acquired and the depreciation charged due to the increased value of the vessels acquired with below market time charters. Usually, security analysts do not include the above items in their published estimates of earnings per share.
Full Year 2021 Results:
For the full year of 2021, the Company reported total net revenues of $93.9 million, representing a 76.2% increase, over total net revenues of $53.3 million during the twelve months of 2020. The Company reported a net income for the year of $42.9 million and a net income attributable to common shareholders of $42.3 million, as compared to a net income of $4.0 million and a net income attributable to common shareholders of $3.3 million for the twelve months of 2020. The results for the twelve months of 2021 include a $0.2 million of amortization of below market time charters acquired and a $0.2 million unrealized gain on derivatives. The results for the twelve months of 2020 included a $1.7 million of amortization of below market time charters acquired, a $0.6 million unrealized loss on derivatives, a $2.5 million net gain on sale of vessels and a $0.1 million loss on write-down of vessel held for sale.
Vessel operating expenses for the twelve months of 2021 amounted to $29.7 million as compared to $32.2 million for the same period of 2020. This decrease in vessel operating expenses is due to the lower average number of vessels operated by the Company in the twelve months of 2021 as compared to the same period of 2020, partly offset by the increased crewing costs for our vessels compared to the same period of 2020, resulting from difficulties in crew rotation due to COVID-19 related restrictions and the increase in hull and machinery insurance premiums. Depreciation expense for the twelve months of 2021 was $7.2 million compared to $6.6 million during the same period of 2020. Although the average number of vessels operating decreased in 2021 as compared to the same period of 2020, the new vessels acquired in the fourth quarter of 2021 have a higher average daily depreciation charge as a result of their higher acquisition price compared to the vessels sold during 2020, some of which were also fully depreciated.
Related party management fees for the twelve months of 2021 were $4.3 million compared to $5.3 million for the same period of 2020. This decrease in related party management fees is due to the lower average number of vessels operated by the Company in the twelve months of 2021 as compared to the same period of 2020, as well as due to termination fees paid in 2020 for the vessels sold during last year, in accordance with the management agreement. General and administrative expenses increased to $3.5 million during the twelve months of 2021 as compared to $3.0 million in the last year, mainly due to higher executive compensation expenses.
Drydocking expenses amounted to $4.1 million for the twelve months of 2021 (three vessels passed their special survey with drydock), compared to $0.5 million for the same period of 2020 (one vessel passed her intermediate survey in-water and three vessels passed their special survey in-water).
On average, 14.25 vessels were owned and operated during the twelve months of 2021 earning an average time charter equivalent rate of $19,309 per day compared to 17.23 vessels in the same period of 2020 earning on average $9,445 per day.
Interest and other financing costs for the twelve months of 2021 amounted to $2.8 million compared to $4.1million for the same period of 2020. This decrease is due to the decrease in the weighted average LIBOR rate, partly offset by the increase in the Company’s average outstanding indebtedness in the current period compared to the same period of 2020.
Adjusted EBITDA1 for the twelve months of 2021 was $52.7 million compared to $11.8 million during the twelve months of 2020.
Basic and diluted earnings per share attributable to common shareholders for the twelve months of 2021 was $6.06 and $6.05, calculated on 6,976,905 and 6,993,405 basic and diluted weighted average number of shares outstanding, respectively, compared to basic and diluted earnings per share of $0.58 for the twelve months of 2020, calculated on 5,753,917 basic and diluted weighted average number of shares outstanding.
Excluding the effect on the income attributable to common shareholders for the twelve months of 2021 of the unrealized gain on derivatives, the amortization of the below market time charters acquired, the depreciation charged due to the increased value of the vessel acquired with below market time charter and the net loss on sale of vessel, the adjusted earnings attributable to common shareholders for the year ended December 31, 2021 would have been $6.02 and $6.01 basic and diluted, respectively, compared to adjusted loss of $0.02 per share basic and diluted for 2020, after excluding unrealized loss on derivatives, net gain on sale of vessels, loss on write down of vessel held for sale, amortization of the below market time charters acquired and the depreciation charged due to the increased value of the vessels acquired with below market time charters. As previously mentioned, usually, security analysts do not include the above items in their published estimates of earnings per share.
Fleet Profile:
The Euroseas Ltd. fleet profile is as follows:
|
Name |
Type |
Dwt |
TEU |
Year Built |
Employment(*) |
TCE Rate ($/day) |
|
|
Container Carriers |
|||||||
|
MARCOS V |
Intermediate |
72,968 |
6,350 |
2005 |
TC until Dec-24 |
$42,200 |
|
|
AKINADA BRIDGE (*) |
Intermediate |
71,366 |
5,610 |
2001 |
TC until Oct-22 |
$20,000 |
|
|
SYNERGY BUSAN (*) |
Intermediate |
50,726 |
4,253 |
2009 |
TC until Aug-24 |
$25,000 |
|
|
SYNERGY ANTWERP (+) |
Intermediate |
50,726 |
4,253 |
2008 |
TC until Dec-23 |
$18,000 |
|
|
SYNERGY OAKLAND (*) |
Intermediate |
50,787 |
4,253 |
2009 |
TC until Apr-22 |
$160,000 (***) |
|
|
SYNERGY KEELUNG (+) |
Intermediate |
50,969 |
4,253 |
2009 |
TC until Jun-22 |
$11,750 |
|
|
EM KEA (*) |
Feeder |
42,165 |
3,100 |
2007 |
TC until May-23 |
$22,000 |
|
|
EM ASTORIA (+) |
Feeder |
35,600 |
2,788 |
2004 |
TC until Feb-22 |
$18,650 |
|
|
EVRIDIKI G (*) |
Feeder |
34,677 |
2,556 |
2001 |
TC until Feb-25 |
$40,000 |
|
|
EM CORFU (*) |
Feeder |
34,654 |
2,556 |
2001 |
TC until Feb-25 |
$40,000 |
|
|
DIAMANTIS P (*) |
Feeder |
30,360 |
2,008 |
1998 |
TC until Oct-24 |
$27,000 |
|
|
EM SPETSES (*) |
Feeder |
23,224 |
1,740 |
2007 |
TC until Aug-24 |
$29,500 |
|
|
JONATHAN P (*) |
Feeder |
23,351 |
1,740 |
2006 |
TC until Sep-24 |
$26,662(**) |
|
|
EM HYDRA (*) |
Feeder |
23,351 |
1,740 |
2005 |
TC until Apr-23 |
$20,000 |
|
|
JOANNA (*) |
Feeder |
22,301 |
1,732 |
1999 |
TC until Oct-22 |
$16,800 |
|
|
AEGEAN EXPRESS (*) |
Feeder |
18,581 |
1,439 |
1997 |
TC until Mar-22 |
$11,500 |
|
|
Total Container Carriers |
16 |
635,806 |
50,371 |
||||
|
Vessels under construction |
Type |
Dwt |
TEU |
To be delivered |
|
H4201 |
Feeder |
37,237 |
2,800 |
Q1 2023 |
|
H4202 |
Feeder |
37,237 |
2,800 |
Q2 2023 |
|
H4236 |
Feeder |
37,237 |
2,800 |
Q4 2023 |
|
H4237 |
Feeder |
37,237 |
2,800 |
Q1 2024 |
Notes:
(*) TC denotes time charter. All dates listed are the earliest redelivery dates under each time charter unless the contract rate is lower than the current market rate in which cases the latest redelivery date is assumed; vessels with the latest redelivery date shown are marked by (+).
(**) Rate is net of commissions (which are typically 5-6.25%)
(***) The previous charter of M/V Synergy Oakland of $202,000/day exceeded its maximum duration by about 25 days due to port delays with payment of the higher ($202,000/day) rate to the Company continuing during the extension. However, the extension resulted in the loss of the subsequent short-term charter of $130,000/day that was to be performed before the 4-year charter starts. The vessel, after an idle period of 15 days, was chartered for a single voyage charter at $160,000/day after the completion of which it will commence the 4-yr charter; the new charter arrangements will result in about the same average rate and total revenues as the original arrangements.
Summary Fleet Data:
|
Three Months, Ended |
Three Months, Ended |
Twelve Months, Ended |
Twelve Months, Ended |
|||||
|
FLEET DATA |
||||||||
|
Average number of vessels (1) |
14.43 |
15.01 |
17.23 |
14.25 |
||||
|
Calendar days for fleet (2) |
1,328.0 |
1,381.0 |
6,306.0 |
5,203.0 |
||||
|
Scheduled off-hire days incl. laid-up (3) |
73.1 |
31.1 |
283.4 |
88.4 |
||||
|
Available days for fleet (4) = (2) – (3) |
1,254.9 |
1,349.9 |
6,022.6 |
5,114.6 |
||||
|
Commercial off-hire days (5) |
18.5 |
– |
150.6 |
– |
||||
|
Operational off-hire days (6) |
46.6 |
20.5 |
118.1 |
77.2 |
||||
|
Voyage days for fleet (7) = (4) – (5) – (6) |
1,189.8 |
1,329.4 |
5,753.9 |
5,037.4 |
||||
|
Fleet utilization (8) = (7) / (4) |
94.8% |
98.5% |
95.5% |
98.5% |
||||
|
Fleet utilization, commercial (9) = ((4) – (5)) / (4) |
98.5% |
100.0% |
97.5% |
100.0% |
||||
|
Fleet utilization, operational (10) = ((4) – (6)) / (4) |
96.3% |
98.5% |
98.0% |
98.5% |
||||
|
AVERAGE DAILY RESULTS (usd/day) |
||||||||
|
Time charter equivalent rate (11) |
10,497 |
29,994 |
9,445 |
19,309 |
||||
|
Vessel operating expenses excl. drydocking expenses (12) |
6,586 |
6,807 |
5,949 |
6,541 |
||||
|
General and administrative expenses (13) |
578 |
901 |
482 |
671 |
||||
|
Total vessel operating expenses (14) |
7,164 |
7,708 |
6,431 |
7,212 |
||||
|
Drydocking expenses (15) |
75 |
866 |
85 |
787 |
||||
(1) Average number of vessels is the number of vessels that constituted the Company’s fleet for the relevant period, as measured by the sum of the number of calendar days each vessel was a part of the Company’s fleet during the period divided by the number of calendar days in that period.
(2) Calendar days. We define calendar days as the total number of days in a period during which each vessel in our fleet was in our possession including off-hire days associated with major repairs, drydockings or special or intermediate surveys or days of vessels in lay-up. Calendar days are an indicator of the size of our fleet over a period and affect both the amount of revenues and the amount of expenses that we record during that period.
(3) The scheduled off-hire days including vessels laid-up, vessels committed for sale or vessels that suffered unrepaired damages, are days associated with scheduled repairs, drydockings or special or intermediate surveys or days of vessels in lay-up, or with vessels that were committed for sale or suffered unrepaired damages.
(4) Available days. We define available days as the Calendar days in a period net of scheduled off-hire days as defined above. We use available days to measure the number of days in a period during which vessels were available to generate revenues.
(5) Commercial off-hire days. We define commercial off-hire days as days a vessel is idle without employment.
(6) Operational off-hire days. We define operational off-hire days as days associated with unscheduled repairs or other off-hire time related to the operation of the vessels.
(7) Voyage days. We define voyage days as the total number of days in a period during which each vessel in our fleet was in our possession net of commercial and operational off-hire days. We use voyage days to measure the number of days in a period during which vessels actually generate revenues or are sailing for repositioning purposes.
(8) Fleet utilization. We calculate fleet utilization by dividing the number of our voyage days during a period by the number of our available days during that period. We use fleet utilization to measure a company’s efficiency in finding suitable employment for its vessels and minimizing the amount of days that its vessels are off-hire for reasons such as unscheduled repairs or days waiting to find employment.
(9) Fleet utilization, commercial. We calculate commercial fleet utilization by dividing our available days net of commercial off-hire days during a period by our available days during that period.
(10) Fleet utilization, operational. We calculate operational fleet utilization by dividing our available days net of operational off-hire days during a period by our available days during that period.
(11) Time charter equivalent rate, or TCE rate, is a measure of the average daily net revenue performance of our vessels. Our method of calculating TCE is determined by dividing time charter revenue and voyage charter revenue net of voyage expenses by voyage days for the relevant time period. Voyage expenses primarily consist of port, canal and fuel costs that are unique to a particular voyage, which would otherwise be paid by the charterer under a time charter contract, or are related to repositioning the vessel for the next charter. TCE is a standard shipping industry performance measure used primarily to compare period-to-period changes in a shipping company’s performance despite changes in the mix of charter types (i.e., spot voyage charters, time charters and bareboat charters) under which the vessels may be employed between the periods. Our definition of TCE may not be comparable to that used by other companies in the shipping industry.
(12) Daily vessel operating expenses, which includes crew costs, provisions, deck and engine stores, lubricating oil, insurance, maintenance and repairs and management fees are calculated by dividing vessel operating expenses and related party management fees by fleet calendar days for the relevant time period. Drydocking expenses are reported separately.
(13) Daily general and administrative expense is calculated by dividing general and administrative expenses by fleet calendar days for the relevant time period.
(14) Total vessel operating expenses, or TVOE, is a measure of our total expenses associated with operating our vessels. TVOE is the sum of vessel operating expenses, management fees and general and administrative expenses; drydocking expenses are not included. Daily TVOE is calculated by dividing TVOE by fleet calendar days for the relevant time period.
(15) Drydocking expenses include expenses during drydockings that would have been capitalized and amortized under the deferral method, divided by the fleet calendar days for the relevant period. Drydocking expenses could vary substantially from period to period depending on how many vessels underwent drydocking during the period. The Company expenses drydocking expenses as incurred.
Conference Call and Webcast:
Today, Tuesday, February 15, 2022 at 10:30 a.m. Eastern Standard Time, the Company’s management will host a conference call to discuss the results.
Conference Call details:
Participants should dial into the call 10 minutes before the scheduled time using the following numbers: 1 (877) 553-9962 (US Toll Free Dial In), 0(808) 238- 0669 (UK Toll Free Dial In) or +44 (0) 2071 928592 (Standard International Dial In). Please quote “Euroseas” to the operator.
Audio Webcast – Slides Presentation:
There will be a live and then archived webcast of the conference call and accompanying slides, available through the Company’s website. To listen to the archived audio file, visit our website http://www.euroseas.gr and click on Company Presentations under our Investor Relations page. Participants to the live webcast should register on the website approximately 10 minutes prior to the start of the webcast.
The slide presentation on the fourth quarter ended December 31, 2021 will also be available in PDF format minutes prior to the conference call and webcast, accessible on the company’s website (www.euroseas.gr) on the webcast page. Participants to the webcast can download the PDF presentation.
Euroseas Ltd.
Unaudited Consolidated Condensed Statements of Operations
(All amounts expressed in U.S. Dollars – except number of shares)
|
Three Months Ended |
Three Months Ended |
Twelve Months Ended |
Twelve Months Ended |
|||||
|
2020 |
2021 |
2020 |
2021 |
|||||
|
Revenues |
||||||||
|
Time charter revenue |
12,532,549 |
39,999,276 |
55,681,124 |
97,979,667 |
||||
|
Commissions |
(499,174) |
(1,745,138) |
(2,378,007) |
(4,085,717) |
||||
|
Net revenues |
12,033,375 |
38,254,138 |
53,303,117 |
93,893,950 |
||||
|
Operating expenses/ (income) |
||||||||
|
Voyage expenses |
43,467 |
124,742 |
1,334,259 |
713,448 |
||||
|
Vessel operating expenses |
7,501,283 |
8,307,463 |
32,219,689 |
29,739,437 |
||||
|
Drydocking expenses |
99,093 |
1,195,712 |
536,199 |
4,094,693 |
||||
|
Vessel depreciation |
1,604,139 |
2,413,569 |
6,605,976 |
7,203,198 |
||||
|
Related party management fees |
1,244,394 |
1,093,684 |
5,293,199 |
4,294,789 |
||||
|
Net (gain) / loss on sale of vessels |
(1,148,720) |
– |
(2,453,736) |
9,417 |
||||
|
General and administrative expenses |
767,229 |
1,244,023 |
3,041,435 |
3,491,120 |
||||
|
Other operating income |
– |
– |
(2,687,205) |
(1,298,318) |
||||
|
Loss on write down of vessel held for sale |
– |
– |
121,165 |
– |
||||
|
Total operating expenses, net |
10,110,885 |
14,379,193 |
44,010,981 |
48,247,784 |
||||
|
Operating income |
1,922,490 |
23,874,945 |
9,292,136 |
45,646,166 |
||||
|
Other (expenses)/ income |
||||||||
|
Interest and other financing costs |
(805,076) |
(776,652) |
(4,125,150) |
(2,779,729) |
||||
|
Loss on debt extinguishment |
(491,571) |
– |
(491,571) |
– |
||||
|
Loss on derivatives, net |
(23,357) |
(448,449) |
(587,988) |
(27,141) |
||||
|
Foreign exchange (loss) / gain |
(20,469) |
26,497 |
(63,007) |
34,418 |
||||
|
Interest income |
820 |
541 |
17,011 |
3,510 |
||||
|
Other expenses, net |
(1,339,653) |
(1,198,063) |
(5,250,705) |
(2,768,942) |
||||
|
Net income |
582,837 |
22,676,882 |
4,041,431 |
42,877,224 |
||||
|
Dividend Series B Preferred shares |
(168,676) |
– |
(693,297) |
(255,324) |
||||
|
Preferred deemed dividend |
– |
– |
– |
(345,423) |
||||
|
Net income attributable to common shareholders |
414,161 |
22,676,882 |
3,348,134 |
42,276,477 |
||||
|
Weighted average number of shares outstanding, basic |
6,149,300 |
7,210,466 |
5,753,917 |
6,976,905 |
||||
|
Earnings per share attributable to common shareholders – basic |
0.07 |
3.14 |
0.58 |
6.06 |
||||
|
Weighted average number of shares outstanding, diluted |
6,149,300 |
7,244,042 |
5,753,917 |
6,993,405 |
||||
|
Earnings per share attributable to common shareholders – diluted |
0.07 |
3.13 |
0.58 |
6.05 |
||||
Euroseas Ltd.,
Unaudited Consolidated Condensed Balance Sheets
(All amounts expressed in U.S. Dollars – except number of shares)
|
December 31, |
December 31, |
|||||
|
ASSETS |
(unaudited) |
|||||
|
Current Assets: |
||||||
|
Cash and cash equivalents |
3,559,399 |
26,530,944 |
||||
|
Trade accounts receivable, net |
2,013,023 |
1,274,729 |
||||
|
Other receivables |
1,866,624 |
1,722,885 |
||||
|
Inventories |
1,662,422 |
2,185,740 |
||||
|
Restricted cash |
345,010 |
167,285 |
||||
|
Prepaid expenses |
244,315 |
382,729 |
||||
|
Derivatives |
– |
540,753 |
||||
|
Total current assets |
9,690,793 |
32,805,065 |
||||
|
Fixed assets: |
||||||
|
Vessels, net |
98,458,447 |
176,286,989 |
||||
|
Long-term assets: |
||||||
|
Advances for vessels under construction |
– |
7,615,958 |
||||
|
Restricted cash |
2,433,768 |
4,800,000 |
||||
|
Total assets |
110,583,008 |
221,508,012 |
||||
|
LIABILITIES, MEZZANINE EQUITY AND SHAREHOLDERS’ EQUITY |
||||||
|
Current liabilities: |
||||||
|
Long-term bank loans, current portion |
20,645,320 |
29,034,049 |
||||
|
Related party loan, current |
2,500,000 |
– |
||||
|
Trade accounts payable |
2,854,377 |
2,804,194 |
||||
|
Accrued expenses |
1,300,420 |
1,702,925 |
||||
|
Accrued preferred dividends |
168,676 |
– |
||||
|
Deferred revenue |
949,364 |
3,293,986 |
||||
|
Derivatives |
203,553 |
– |
||||
|
Due to related company |
24,072 |
309,969 |
||||
|
Total current liabilities |
28,645,782 |
37,145,123 |
||||
|
Long-term liabilities: |
||||||
|
Long -term bank loans, net of current portion |
46,220,028 |
89,004,951 |
||||
|
Derivatives |
362,195 |
952,666 |
||||
|
Fair value of below market time charters acquired |
– |
17,634,812 |
||||
|
Total long-term liabilities |
46,582,223 |
107,592,429 |
||||
|
Total liabilities |
75,228,005 |
144,737,552 |
||||
|
Mezzanine equity: |
||||||
|
Series B Preferred shares (par value $0.01, 20,000,000 shares authorized, 8,000 and nil issued and outstanding, respectively) |
8,019,636 |
– |
||||
|
Shareholders’ equity: |
||||||
|
Common stock (par value $0.03, 200,000,000 shares authorized, 6,708,946 and 7,294,541 issued and outstanding, respectively) |
201,268 |
218,836 |
||||
|
Additional paid-in capital |
257,467,980 |
264,609,028 |
||||
|
Accumulated deficit |
(230,333,881) |
(188,057,404) |
||||
|
Total shareholders’ equity |
27,335,367 |
76,770,460 |
||||
|
Total liabilities, mezzanine and shareholders’ equity |
110,583,008 |
221,508,012 |
||||
Euroseas Ltd.
Unaudited Consolidated Condensed Statements of Cash Flows
(All amounts expressed in U.S. Dollars)
|
Twelve Months |
Twelve Months |
|||
|
2020 |
2021 |
|||
|
Cash flows from operating activities: |
||||
|
Net income |
4,041,431 |
42,877,224 |
||
|
Adjustments to reconcile net income to net cash provided by operating activities: |
||||
|
Vessel depreciation |
6,605,976 |
7,203,198 |
||
|
Amortization and write off of deferred charges |
288,163 |
223,492 |
||
|
Share-based compensation |
121,631 |
182,324 |
||
|
Gain on hull & machinery claim |
(2,687,205) |
– |
||
|
Net (gain) / loss on sale of vessels |
(2,453,736) |
9,417 |
||
|
Loss on write down of vessel held for sale |
121,165 |
– |
||
|
Amortization of fair value of below market time charters acquired |
(1,714,370) |
(232,390) |
||
|
Unrealized loss / (gain) on derivatives |
565,748 |
(153,835) |
||
|
Loss on debt extinguishment |
491,571 |
– |
||
|
Changes in operating assets and liabilities |
(2,950,997) |
2,517,236 |
||
|
Net cash provided by operating activities |
2,429,377 |
52,626,666 |
||
|
Cash flows from investing activities: |
||||
|
Cash paid for vessels under construction |
– |
(7,615,958) |
||
|
Cash paid for vessel acquisitions and capitalized expenses |
– |
(65,523,144) |
||
|
Cash paid for vessel improvements |
(667,069) |
(974,058) |
||
|
Proceeds from sale of vessels |
14,622,768 |
– |
||
|
Insurance proceeds |
2,343,608 |
– |
||
|
Net cash provided by / (used in) investing activities |
16,299,307 |
(74,113,160) |
||
|
Cash flows from financing activities: |
||||
|
Redemption of Series B preferred shares |
– |
(2,000,000) |
||
|
Proceeds from issuance of common stock, net of commissions paid |
715,550 |
743,553 |
||
|
Preferred dividends paid |
(320,877) |
(424,000) |
||
|
Loan arrangement fees paid |
– |
(758,000) |
||
|
Offering expenses paid |
(184,321) |
(123,167) |
||
|
Proceeds from long- term bank loans |
– |
75,500,000 |
||
|
Repayment of long-term bank loans |
(17,905,920) |
(23,791,840) |
||
|
Repayment of related party loan |
(625,000) |
(2,500,000) |
||
|
Net cash (used in) / provided by financing activities |
(18,320,568) |
46,646,546 |
||
|
Net increase in cash, cash equivalents and restricted cash |
408,116 |
25,160,052 |
||
|
Cash, cash equivalents and restricted cash at beginning of year |
5,930,061 |
6,338,177 |
||
|
Cash, cash equivalents and restricted cash at end of year |
6,338,177 |
31,498,229 |
||
|
Cash breakdown |
||||
|
Cash and cash equivalents |
3,559,399 |
26,530,944 |
||
|
Restricted cash, current |
345,010 |
167,285 |
||
|
Restricted cash, long term |
2,433,768 |
4,800,000 |
||
|
Total cash, cash equivalents and restricted cash shown in the statement of cash flows |
6,338,177 |
31,498,229 |
||
Euroseas Ltd.
Reconciliation of Net income to Adjusted EBITDA
(All amounts expressed in U.S. Dollars)
|
Three Months Ended |
Three Months Ended |
Twelve Months Ended |
Twelve Months Ended |
|||||
|
Net income |
582,837 |
22,676,882 |
4,041,431 |
42,877,224 |
||||
|
Interest and other financing costs, net (incl. interest income and loss on debt extinguishment) |
1,295,827 |
776,111 |
4,599,710 |
2,776,219 |
||||
|
Vessel depreciation |
1,604,139 |
2,413,569 |
6,605,976 |
7,203,198 |
||||
|
Net (gain) / loss on sale of vessels |
(1,148,720) |
– |
(2,453,736) |
9,417 |
||||
|
Loss on write down of vessel held for sale |
– |
– |
121,165 |
– |
||||
|
Amortization of below market time charters acquired |
(240,639) |
(232,390) |
(1,714,370) |
(232,390) |
||||
|
Loss on interest rate swap derivatives |
23,357 |
448,449 |
587,988 |
27,141 |
||||
|
Adjusted EBITDA |
2,116,801 |
26,082,621 |
11,788,164 |
52,660,809 |
||||
Adjusted EBITDA Reconciliation:
Euroseas Ltd. considers Adjusted EBITDA to represent net income before interest, income taxes, depreciation, loss on interest rate swap derivatives, net (gain) / loss on sale of vessels, amortization of below market time charters acquired and loss on write down of vessel held for sale. Adjusted EBITDA does not represent and should not be considered as an alternative to net income, as determined by United States generally accepted accounting principles, or GAAP. Adjusted EBITDA is included herein because it is a basis upon which the Company assesses its financial performance and we believe that this non- GAAP financial measure assists our management and investors by increasing the comparability of our performance from period to period by excluding the potentially disparate effects between periods of, financial costs, amortization of below market time charters acquired, loss on interest rate swaps, net (gain) / loss on sale of vessels, loss on write down of vessel held for sale and depreciation. The Company’s definition of Adjusted EBITDA may not be the same as that used by other companies in the shipping or other industries.
Euroseas Ltd.
Reconciliation of Net income to Adjusted net (loss) / income
(All amounts expressed in U.S. Dollars – except share data and number of shares)
|
Three Months Ended |
Three Months Ended |
Twelve Months Ended |
Twelve Months Ended |
|||||
|
Net income |
582,837 |
22,676,882 |
4,041,431 |
42,877,224 |
||||
|
Unrealized (gain) / loss on derivatives |
(17,102) |
398,797 |
565,748 |
(153,835) |
||||
|
Net (gain)/ loss on sale of vessels |
(1,148,720) |
– |
(2,453,736) |
9,417 |
||||
|
Loss on write down of vessel held for sale |
– |
– |
121,165 |
– |
||||
|
Amortization of below market time charters acquired |
(240,639) |
(232,390) |
(1,714,370) |
(232,390) |
||||
|
Depreciation charged due to increase in vessel value from below market time charter acquired |
24,455 |
99,941 |
125,403 |
99,941 |
||||
|
Adjusted net (loss) / income |
(799,169) |
22,943,230 |
685,641 |
42,600,357 |
||||
|
Preferred dividends |
(168,676) |
– |
(693,297) |
(255,324) |
||||
|
Preferred deemed dividend |
– |
– |
– |
(345,423) |
||||
|
Adjusted net (loss) / income attributable to common shareholders |
(967,845) |
22,943,230 |
(7,656) |
41,999,610 |
||||
|
Adjusted (loss) / earnings per share, basic |
(0.16) |
3.18 |
(0.00) |
6.02 |
||||
|
Weighted average number of shares, basic |
6,149,300 |
7,210,466 |
5,753,917 |
6,976,905 |
||||
|
Adjusted (loss) / earnings per share, diluted |
(0.16) |
3.17 |
(0.00) |
6.01 |
||||
|
Weighted average number of shares, diluted |
6,149,300 |
7,244,042 |
5,753,917 |
6,993,405 |
||||
Adjusted net (loss) / income and Adjusted (loss) / earnings per share Reconciliation:
Euroseas Ltd. considers Adjusted net (loss) / income to represent net (loss) / income before unrealized (gain) / loss on derivatives, net (gain) / loss on sale of vessels, loss on write down of vessel held for sale, amortization of below market time charters acquired, and depreciation charged due to increase in vessel value from below market time charter acquired. Adjusted net (loss) / income and Adjusted (loss) / earnings per share is included herein because we believe it assists our management and investors by increasing the comparability of the Company’s fundamental performance from period to period by excluding the potentially disparate effects between periods of unrealized (gain) / loss on derivatives, net (gain) / loss on sale of vessels, loss on write down of vessel held for sale, amortization of below market time charters acquired and depreciation charged due to increase in vessel value from below market time charter acquired, which items may significantly affect results of operations between periods.
Adjusted net (loss) / income and Adjusted (loss) / earnings per share do not represent and should not be considered as an alternative to net income or earnings per share, as determined by GAAP. The Company’s definition of Adjusted net (loss) / income and Adjusted (loss) / earnings per share may not be the same as that used by other companies in the shipping or other industries.
About Euroseas Ltd.
Euroseas Ltd. was formed on May 5, 2005 under the laws of the Republic of the Marshall Islands to consolidate the ship owning interests of the Pittas family of Athens, Greece, which has been in the shipping business over the past 140 years. Euroseas trades on the NASDAQ Capital Market under the ticker ESEA.
Euroseas operates in the container shipping market. Euroseas’ operations are managed by Eurobulk Ltd., an ISO 9001:2008 and ISO 14001:2004 certified affiliated ship management company, which is responsible for the day-to-day commercial and technical management and operations of the vessels. Euroseas employs its vessels on spot and period charters and through pool arrangements.
The Company has a fleet of 16 vessels, including 10 Feeder containerships and 6 Intermediate Container carriers. Euroseas 16 containerships have a cargo capacity of 50,371 teu. After the delivery of four feeder containership newbuildings in 2023 and the first half of 2024, Euroseas’ fleet will consist of 20 vessels with a total carrying capacity of 61,571 teu.
Forward Looking Statement
This press release contains forward-looking statements (as defined in Section 27A of the Securities Act of 1933, as amended, and Section 21E of the Securities Exchange Act of 1934, as amended) concerning future events and the Company’s growth strategy and measures to implement such strategy; including expected vessel acquisitions and entering into further time charters. Words such as “expects,” “intends,” “plans,” “believes,” “anticipates,” “hopes,” “estimates,” and variations of such words and similar expressions are intended to identify forward-looking statements. Although the Company believes that the expectations reflected in such forward-looking statements are reasonable, no assurance can be given that such expectations will prove to have been correct. These statements involve known and unknown risks and are based upon a number of assumptions and estimates that are inherently subject to significant uncertainties and contingencies, many of which are beyond the control of the Company. Actual results may differ materially from those expressed or implied by such forward-looking statements. Factors that could cause actual results to differ materially include, but are not limited to changes in the demand for containerships, competitive factors in the market in which the Company operates; risks associated with operations outside the United States; and other factors listed from time to time in the Company’s filings with the Securities and Exchange Commission. The Company expressly disclaims any obligations or undertaking to release publicly any updates or revisions to any forward-looking statements contained herein to reflect any change in the Company’s expectations with respect thereto or any change in events, conditions or circumstances on which any statement is based.
Visit our website www.euroseas.gr
|
Company Contact |
Investor Relations / Financial Media |
|
Tasos Aslidis |
Nicolas Bornozis |
![]()
News and Market Data on Bunker Hill Mining
TORONTO, Feb. 15, 2022 (GLOBE NEWSWIRE) — Bunker Hill Mining Corp. (the “Company”) (CSE: BNKR, OTCQB: BHLL) is pleased to announce the appointment of Tom Francis as General Manager for the Bunker Hill Mine, and the execution of a mining services contract with Coeur d’Alene Mine Contracting LLC (“CMC”).
Sam Ash, CEO stated, “A critical driver of our success has been the strength that comes from building a world-class team, which will remain a central focus as we accelerate the restart of the Bunker Hill Mine. Tom’s demonstrated leadership skills and track record are a perfect fit for our needs, and I am pleased to welcome him on our journey towards not just building a mine, but a mining company. He will oversee all operational aspects of the restart of the Bunker Hill Mine including technical services, construction, contract management, and Safety and Health.”
“I am also pleased to announce the appointment of CMC as our mining contractor through planned commercial production. This extends an excellent and productive relationship that began in 2020, during which time they have demonstrated their world-class mining capabilities, knowledge of the Silver Valley, and ability to procure skilled personnel to meet our needs. Importantly, agreed rates are in line with those modelled in our PEA. Together with the MOU for the purchase of Teck’s Pend Oreille process plant for approximately $3 million, we are pleased that key capital and operating costs continue to be in line with estimates.”
APPOINTMENT OF TOM FRANCIS AS GENERAL MANAGER
The Company has appointed Tom Francis as General Manager of the Bunker Hill Mine. Mr. Francis joins the Bunker Hill team after 10 years with Rio Tinto, the second-largest mining company in the world, where he was most recently Mine Manager at the Kennecott Bingham Canyon Mine (“Kennecott”) in Utah, USA, its single largest mining operation. Among other achievements, his team delivered world-class payload metrics on Kennecott’s ultra-class truck fleet while simultaneously increasing average haul truck speeds and tire life. Previous roles with Rio Tinto included responsibility for productivity across the full Kennecott value stream (mine, concentrator, smelter and refinery), three years in the Group strategic investment analysis team assessing its global suite of projects (greenfield, brownfield & closure), and several years in Rio Tinto Exploration (RTX) managing operational support (incl. safety) for Rio Tinto’s Exploration’s projects across Africa and Eurasia.
Prior to his mining experience, Mr. Francis served as an officer in the Royal Marines and UK Special Forces, serving on multiple operational tours in Kosovo, Iraq & Afghanistan. He is a dual national US/UK citizen having lived, studied and worked in both the US and the UK. He holds a first-class degree from the University of Oxford (BA, Mathematics & Computation).
APPOINTMENT OF CMC AS MINING CONTRACTOR
The Company has also agreed a Contract Services Agreement (“CSA”) with Coeur d’Alene Mine Contracting, LLC for underground mining and development requirements through December 31, 2023, by which time it plans to be in commercial production. CMC is a locally owned and operated mining services company based in Idaho’s Silver Valley with extensive contracting experience in the deepest underground mines across North America. Their contract experience spans production, development, mine rehabilitation, mine start-ups and mine closures.
The CSA extends an ongoing relationship with CMC that has seen them work alongside the Bunker Hill team for the last two years, during which time they have performed safely, productively and developed an extensive first-hand knowledge of the Bunker Hill mine. Importantly, CMC has demonstrated an ability to grow in accordance with the step-up in physical activity at Bunker Hill without diluting operational performance. Labor and equipment rates in the CSA are consistent with the Company’s Preliminary Economic Assessment published in November 2021, and CMC has also been advising on and supporting the procurement of necessary additional equipment as operational activity increases.
ABOUT BUNKER HILL MINING CORP.
Under new Idaho-based leadership the Bunker Hill Mining Corp, intends to sustainably restart and develop the Bunker Hill Mine as the first step in consolidating a portfolio of North American mining assets with a focus on silver. Information about the Company is available on its website, www.bunkerhillmining.com , or within the SEDAR and EDGAR databases.
For additional information contact:
David Wiens, CFA
CFO & Corporate Secretary
+1 208 370 3665
ir@bunkerhillmining.com
Cautionary Statements
Certain statements in this news release are forward-looking and involve a number of risks and uncertainties. Such forward-looking statements are within the meaning of that term in Section 27A of the Securities Act of 1933, as amended, and Section 21E of the Securities Exchange Act of 1934, as amended, as well as within the meaning of the phrase ‘forward-looking information’ in the Canadian Securities Administrators’ National Instrument 51-102 – Continuous Disclosure Obligations. Forward-looking statements are not comprised of historical facts. Forward-looking statements include estimates and statements that describe the Company’s future plans, objectives or goals, including words to the effect that the Company or management expects a stated condition or result to occur. Forward-looking statements may be identified by such terms as “believes”, “anticipates”, “expects”, “estimates”, “may”, “could”, “would”, “will”, or “plan”. Since forward-looking statements are based on assumptions and address future events and conditions, by their very nature they involve inherent risks and uncertainties. Although these statements are based on information currently available to the Company, the Company provides no assurance that actual results will meet management’s expectations. Risks, uncertainties and other factors involved with forward-looking information could cause actual events, results, performance, prospects and opportunities to differ materially from those expressed or implied by such forward-looking information.
Forward looking information in this news release includes, but is not limited to, the Company’s intentions regarding its objectives, goals or future plans and statements. Factors that could cause actual results to differ materially from such forward-looking information include, but are not limited to: the ability to predict and counteract the effects of COVID-19 on the business of the Company, including but not limited to the effects of COVID-19 on the price of commodities, capital market conditions, restriction on labour and international travel and supply chains; failure to identify mineral resources; failure to convert estimated mineral resources to reserves; the inability to complete a feasibility study which recommends a production decision; the preliminary nature of metallurgical test results; the Company’s ability to restart and develop the Bunker Hill Mine and the risks of not basing a production decision on a feasibility study of mineral reserves demonstrating economic and technical viability, resulting in increased uncertainty due to multiple technical and economic risks of failure which are associated with this production decision including, among others, areas that are analyzed in more detail in a feasibility study, such as applying economic analysis to resources and reserves, more detailed metallurgy and a number of specialized studies in areas such as mining and recovery methods, market analysis, and environmental and community impacts and, as a result, there may be an increased uncertainty of achieving any particular level of recovery of minerals or the cost of such recovery, including increased risks associated with developing a commercially mineable deposit with no guarantee that production will begin as anticipated or at all or that anticipated production costs will be achieved; failure to commence production would have a material adverse impact on the Company’s ability to generate revenue and cash flow to fund operations; failure to achieve the anticipated production costs would have a material adverse impact on the Company’s cash flow and future profitability; delays in obtaining or failures to obtain required governmental, environmental or other project approvals; political risks; changes in equity markets; uncertainties relating to the availability and costs of financing needed in the future; the inability of the Company to budget and manage its liquidity in light of the failure to obtain additional financing, including the ability of the Company to complete the payments pursuant to the terms of the agreement to acquire the Bunker Hill Mine Complex; inflation; changes in exchange rates; fluctuations in commodity prices; delays in the development of projects; capital, operating and reclamation costs varying significantly from estimates and the other risks involved in the mineral exploration and development industry; and those risks set out in the Company’s public documents filed on SEDAR. Although the Company believes that the assumptions and factors used in preparing the forward-looking information in this news release are reasonable, undue reliance should not be placed on such information, which only applies as of the date of this news release, and no assurance can be given that such events will occur in the disclosed time frames or at all. The Company disclaims any intention or obligation to update or revise any forward-looking information, whether as a result of new information, future events or otherwise, other than as required by law. No stock exchange, securities commission or other regulatory authority has approved or disapproved the information contained herein.
Cautionary Note to United States Investors Concerning Estimates of Measured, Indicated and Inferred Resources
This press release has been prepared in accordance with the requirements of the securities laws in effect in Canada, which differ from the requirements of U.S. securities laws. Unless otherwise indicated, all resource and reserve estimates included in this press release have been disclosed in accordance with NI 43-101 and the Canadian Institute of Mining, Metallurgy, and Petroleum Definition Standards on Mineral Resources and Mineral Reserves. NI 43-101 is a rule developed by the Canadian Securities Administrators which establishes standards for all public disclosure an issuer makes of scientific and technical information concerning mineral projects. Canadian disclosure standards, including NI 43-101, differ significantly from the requirements of the United States Securities and Exchange Commission (“SEC”), and resource and reserve information contained in this press release may not be comparable to similar information disclosed by U.S. companies. In particular, and without limiting the generality of the foregoing, the term “resource” does not equate to the term “reserves”. Under U.S. standards, mineralization may not be classified as a “reserve” unless the determination has been made that the mineralization could be economically and legally produced or extracted at the time the reserve determination is made. The SEC’s disclosure standards normally do not permit the inclusion of information concerning “measured mineral resources”, “indicated mineral resources” or “inferred mineral resources” or other descriptions of the amount of mineralization in mineral deposits that do not constitute “reserves” by U.S. standards in documents filed with the SEC. Investors are cautioned not to assume that any part or all of mineral deposits in these categories will ever be converted into reserves. U.S. investors should also understand that “inferred mineral resources” have a great amount of uncertainty as to their existence and great uncertainty as to their economic and legal feasibility. It cannot be assumed that all or any part of an “inferred mineral resource” will ever be upgraded to a higher category. Investors are cautioned not to assume that all or any part of an “inferred mineral resource” exists or is economically or legally mineable. Disclosure of “contained ounces” in a resource is permitted disclosure under Canadian regulations; however, the SEC normally only permits issuers to report mineralization that does not constitute “reserves” by SEC standards as in-place tonnage and grade without reference to unit measures. The requirements of NI 43-101 for disclosure of “reserves” are also not the same as those of the SEC, and reserves disclosed by the Company in accordance with NI 43-101 may not qualify as “reserves” under SEC standards. Accordingly, information concerning mineral deposits contained in our website may not be comparable with information made public by companies that report in accordance with U.S. standards.
Image Credit: Livewire
On February 14, Michael Burry filed his company’s holdings report with the SEC. Relative to the previous quarter there was a little reshuffling of his positions. While many fund managers and successful investors such as Cathie Wood are talking about their ideas several times a week in the news, Burry is more quiet. A good way to understand Burry’s thinking and Scion Asset Management’s direction is to review changes to his 13F holdings. Or, hope for a rare
tweet.
Below we list all of Scion’s public company purchases and sales then provide information so you may drill down even deeper into Burry’s small and microcap holdings.
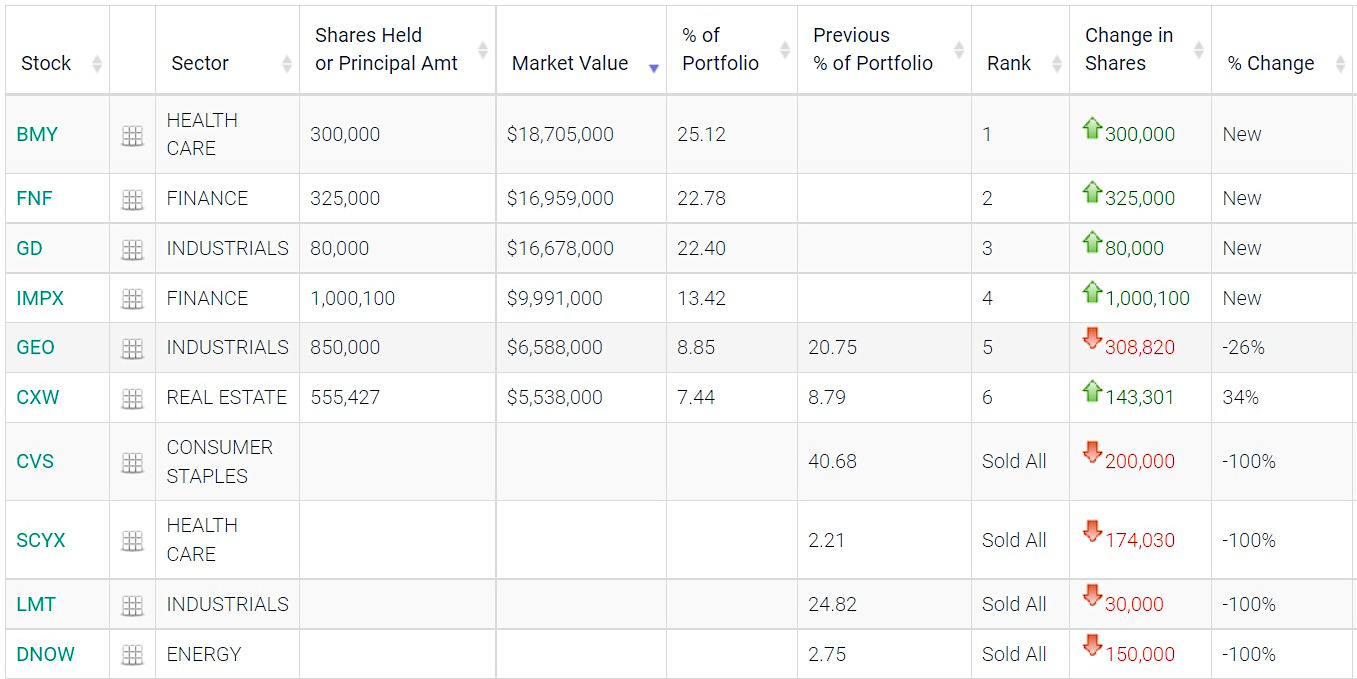
Why it Matters
No one would disagree that Burry’s investment universe is broader than the average self-directed investor and even deeper than the average hedge fund manager. With this in mind, out of the entire universe of publicly held corporations he could hold, there are only six that Burry’s portfolio owned at the end of the fourth quarter. One is a SPAC that is merging with an electric vehicle (EV) company. Two are small-cap holdings Scion had owned the previous quarter – Burry lightened up on one position and added to another. Three new large-cap purchases that round out the rest of the holdings span the defense, finance, and pharmaceutical industries.
Holdings Top to Bottom
Scion’s largest holding is Bristol-Myers Squibb (BMY). BMY had a market value on filing date of $18.7M, Scion’s position represents .014% of the company. The large pharmaceutical company was added last quarter while holdings in drug retailer CVS were brought to zero during the quarter.
Insurance company Fidelity National Financial, Inc. (FNF) provides various insurance products in the US with a large focus on real estate-related products. This includes title insurance, escrow, and other title-related services. FNF also provides technology and transaction services to the real estate and mortgage industries. Plus, life insurance products including annuities. The company had a market value on the filing date
of $16.96M, Scion’s position represents .114% of the company.
General Dynamics Corporation (GD) is a large U.S. aerospace and defense contractor. It operates through four segments: Aerospace, Marine Systems, Combat Systems, and Technologies. GD had a market value on the filing date of $16.68, Scion’s position represents .287% of the company. Scion’s position in defense contractor Lockheed Martin (LMT) was brought to zero during the quarter.
On Dec. 13, 2021 Harley-Davidson, Inc. (HOG), announced that AEA-Bridges Impact Corp. (IMPX), a special purpose acquisition company or SPAC with a focus on sustainability, entered into a definitive business combination agreement under which they will combine with LiveWire. LiveWire which will trade under ticker LVW is Harley-Davidson’s electric motorcycle division. The deal will create a new publicly-traded company. Michael Burry added this SPAC to Scion’s holdings. As of year-end, Scion owned 2.50% of the special purpose company or $9.99M.
The GEO Group (GEO) is a correctional facility that specializes in the ownership, leasing, and management of correctional, detention, and reentry facilities. The market value of Scion’s position was $6.69 million at quarter-end, which represented 6.94% of the company’s market value. Burry rebalanced this position which was carried over from the previous quarter as he reduced his holdings by 26%.
CoreCivic (CXW) is a publicly owned prison system that was trading as a REIT up until January 2021, it now trades as a Regular C-Corporation. Scion took a position during the third quarter of last year and apparently added to it. Burry’s quarter-end $5.54M position represents .46% of the company. During the quarter Burry increased the share of the company his fund holds by .34%.
Take-Away
Dr. Burry has an excellent record of spotting investment opportunities before the rest of the market catches up. His picks are as disparate as the mortgage market in 2008 and GameStop (GME) in 2020.
Recent research (GEO, CXW), and recorded interviews with management (CXW), and other small/microcap companies are available and regularly updated on Channelchek. Channelchek also closely follows and reports on the SPAC market with SPACtrac coverage and informative articles.
Sign-up to receive updates in your inbox.
Suggested Reading
 One Great Protection Inherent in SPACs for Investors
|
 Michael Burry’s Investments in Health, Bombs, and Bars
|
 EV SPAC Activity Accelerated in 2021
|
 Analysis of a SPAC
|
Sources
https://whalewisdom.com/filer/scion-asset-management-llc#tabholdings_tab_link
https://13f.info/manager/0001649339-scion-asset-management-llc
Stay up to date. Follow us:
|
|
![]()
News and Market Data on Bunker Hill Mining
TORONTO, Feb. 15, 2022 (GLOBE NEWSWIRE) — Bunker Hill Mining Corp. (the “Company”) (CSE: BNKR, OTCQB: BHLL) is pleased to announce the appointment of Tom Francis as General Manager for the Bunker Hill Mine, and the execution of a mining services contract with Coeur d’Alene Mine Contracting LLC (“CMC”).
Sam Ash, CEO stated, “A critical driver of our success has been the strength that comes from building a world-class team, which will remain a central focus as we accelerate the restart of the Bunker Hill Mine. Tom’s demonstrated leadership skills and track record are a perfect fit for our needs, and I am pleased to welcome him on our journey towards not just building a mine, but a mining company. He will oversee all operational aspects of the restart of the Bunker Hill Mine including technical services, construction, contract management, and Safety and Health.”
“I am also pleased to announce the appointment of CMC as our mining contractor through planned commercial production. This extends an excellent and productive relationship that began in 2020, during which time they have demonstrated their world-class mining capabilities, knowledge of the Silver Valley, and ability to procure skilled personnel to meet our needs. Importantly, agreed rates are in line with those modelled in our PEA. Together with the MOU for the purchase of Teck’s Pend Oreille process plant for approximately $3 million, we are pleased that key capital and operating costs continue to be in line with estimates.”
APPOINTMENT OF TOM FRANCIS AS GENERAL MANAGER
The Company has appointed Tom Francis as General Manager of the Bunker Hill Mine. Mr. Francis joins the Bunker Hill team after 10 years with Rio Tinto, the second-largest mining company in the world, where he was most recently Mine Manager at the Kennecott Bingham Canyon Mine (“Kennecott”) in Utah, USA, its single largest mining operation. Among other achievements, his team delivered world-class payload metrics on Kennecott’s ultra-class truck fleet while simultaneously increasing average haul truck speeds and tire life. Previous roles with Rio Tinto included responsibility for productivity across the full Kennecott value stream (mine, concentrator, smelter and refinery), three years in the Group strategic investment analysis team assessing its global suite of projects (greenfield, brownfield & closure), and several years in Rio Tinto Exploration (RTX) managing operational support (incl. safety) for Rio Tinto’s Exploration’s projects across Africa and Eurasia.
Prior to his mining experience, Mr. Francis served as an officer in the Royal Marines and UK Special Forces, serving on multiple operational tours in Kosovo, Iraq & Afghanistan. He is a dual national US/UK citizen having lived, studied and worked in both the US and the UK. He holds a first-class degree from the University of Oxford (BA, Mathematics & Computation).
APPOINTMENT OF CMC AS MINING CONTRACTOR
The Company has also agreed a Contract Services Agreement (“CSA”) with Coeur d’Alene Mine Contracting, LLC for underground mining and development requirements through December 31, 2023, by which time it plans to be in commercial production. CMC is a locally owned and operated mining services company based in Idaho’s Silver Valley with extensive contracting experience in the deepest underground mines across North America. Their contract experience spans production, development, mine rehabilitation, mine start-ups and mine closures.
The CSA extends an ongoing relationship with CMC that has seen them work alongside the Bunker Hill team for the last two years, during which time they have performed safely, productively and developed an extensive first-hand knowledge of the Bunker Hill mine. Importantly, CMC has demonstrated an ability to grow in accordance with the step-up in physical activity at Bunker Hill without diluting operational performance. Labor and equipment rates in the CSA are consistent with the Company’s Preliminary Economic Assessment published in November 2021, and CMC has also been advising on and supporting the procurement of necessary additional equipment as operational activity increases.
ABOUT BUNKER HILL MINING CORP.
Under new Idaho-based leadership the Bunker Hill Mining Corp, intends to sustainably restart and develop the Bunker Hill Mine as the first step in consolidating a portfolio of North American mining assets with a focus on silver. Information about the Company is available on its website, www.bunkerhillmining.com , or within the SEDAR and EDGAR databases.
For additional information contact:
David Wiens, CFA
CFO & Corporate Secretary
+1 208 370 3665
ir@bunkerhillmining.com
Cautionary Statements
Certain statements in this news release are forward-looking and involve a number of risks and uncertainties. Such forward-looking statements are within the meaning of that term in Section 27A of the Securities Act of 1933, as amended, and Section 21E of the Securities Exchange Act of 1934, as amended, as well as within the meaning of the phrase ‘forward-looking information’ in the Canadian Securities Administrators’ National Instrument 51-102 – Continuous Disclosure Obligations. Forward-looking statements are not comprised of historical facts. Forward-looking statements include estimates and statements that describe the Company’s future plans, objectives or goals, including words to the effect that the Company or management expects a stated condition or result to occur. Forward-looking statements may be identified by such terms as “believes”, “anticipates”, “expects”, “estimates”, “may”, “could”, “would”, “will”, or “plan”. Since forward-looking statements are based on assumptions and address future events and conditions, by their very nature they involve inherent risks and uncertainties. Although these statements are based on information currently available to the Company, the Company provides no assurance that actual results will meet management’s expectations. Risks, uncertainties and other factors involved with forward-looking information could cause actual events, results, performance, prospects and opportunities to differ materially from those expressed or implied by such forward-looking information.
Forward looking information in this news release includes, but is not limited to, the Company’s intentions regarding its objectives, goals or future plans and statements. Factors that could cause actual results to differ materially from such forward-looking information include, but are not limited to: the ability to predict and counteract the effects of COVID-19 on the business of the Company, including but not limited to the effects of COVID-19 on the price of commodities, capital market conditions, restriction on labour and international travel and supply chains; failure to identify mineral resources; failure to convert estimated mineral resources to reserves; the inability to complete a feasibility study which recommends a production decision; the preliminary nature of metallurgical test results; the Company’s ability to restart and develop the Bunker Hill Mine and the risks of not basing a production decision on a feasibility study of mineral reserves demonstrating economic and technical viability, resulting in increased uncertainty due to multiple technical and economic risks of failure which are associated with this production decision including, among others, areas that are analyzed in more detail in a feasibility study, such as applying economic analysis to resources and reserves, more detailed metallurgy and a number of specialized studies in areas such as mining and recovery methods, market analysis, and environmental and community impacts and, as a result, there may be an increased uncertainty of achieving any particular level of recovery of minerals or the cost of such recovery, including increased risks associated with developing a commercially mineable deposit with no guarantee that production will begin as anticipated or at all or that anticipated production costs will be achieved; failure to commence production would have a material adverse impact on the Company’s ability to generate revenue and cash flow to fund operations; failure to achieve the anticipated production costs would have a material adverse impact on the Company’s cash flow and future profitability; delays in obtaining or failures to obtain required governmental, environmental or other project approvals; political risks; changes in equity markets; uncertainties relating to the availability and costs of financing needed in the future; the inability of the Company to budget and manage its liquidity in light of the failure to obtain additional financing, including the ability of the Company to complete the payments pursuant to the terms of the agreement to acquire the Bunker Hill Mine Complex; inflation; changes in exchange rates; fluctuations in commodity prices; delays in the development of projects; capital, operating and reclamation costs varying significantly from estimates and the other risks involved in the mineral exploration and development industry; and those risks set out in the Company’s public documents filed on SEDAR. Although the Company believes that the assumptions and factors used in preparing the forward-looking information in this news release are reasonable, undue reliance should not be placed on such information, which only applies as of the date of this news release, and no assurance can be given that such events will occur in the disclosed time frames or at all. The Company disclaims any intention or obligation to update or revise any forward-looking information, whether as a result of new information, future events or otherwise, other than as required by law. No stock exchange, securities commission or other regulatory authority has approved or disapproved the information contained herein.
Cautionary Note to United States Investors Concerning Estimates of Measured, Indicated and Inferred Resources
This press release has been prepared in accordance with the requirements of the securities laws in effect in Canada, which differ from the requirements of U.S. securities laws. Unless otherwise indicated, all resource and reserve estimates included in this press release have been disclosed in accordance with NI 43-101 and the Canadian Institute of Mining, Metallurgy, and Petroleum Definition Standards on Mineral Resources and Mineral Reserves. NI 43-101 is a rule developed by the Canadian Securities Administrators which establishes standards for all public disclosure an issuer makes of scientific and technical information concerning mineral projects. Canadian disclosure standards, including NI 43-101, differ significantly from the requirements of the United States Securities and Exchange Commission (“SEC”), and resource and reserve information contained in this press release may not be comparable to similar information disclosed by U.S. companies. In particular, and without limiting the generality of the foregoing, the term “resource” does not equate to the term “reserves”. Under U.S. standards, mineralization may not be classified as a “reserve” unless the determination has been made that the mineralization could be economically and legally produced or extracted at the time the reserve determination is made. The SEC’s disclosure standards normally do not permit the inclusion of information concerning “measured mineral resources”, “indicated mineral resources” or “inferred mineral resources” or other descriptions of the amount of mineralization in mineral deposits that do not constitute “reserves” by U.S. standards in documents filed with the SEC. Investors are cautioned not to assume that any part or all of mineral deposits in these categories will ever be converted into reserves. U.S. investors should also understand that “inferred mineral resources” have a great amount of uncertainty as to their existence and great uncertainty as to their economic and legal feasibility. It cannot be assumed that all or any part of an “inferred mineral resource” will ever be upgraded to a higher category. Investors are cautioned not to assume that all or any part of an “inferred mineral resource” exists or is economically or legally mineable. Disclosure of “contained ounces” in a resource is permitted disclosure under Canadian regulations; however, the SEC normally only permits issuers to report mineralization that does not constitute “reserves” by SEC standards as in-place tonnage and grade without reference to unit measures. The requirements of NI 43-101 for disclosure of “reserves” are also not the same as those of the SEC, and reserves disclosed by the Company in accordance with NI 43-101 may not qualify as “reserves” under SEC standards. Accordingly, information concerning mineral deposits contained in our website may not be comparable with information made public by companies that report in accordance with U.S. standards.
Image Credit: Safe Harbor Financial
The latest SPAC or “blank check company” to find the desired target will help fulfill the growing need for banking services for cannabis-related businesses (CRB) in Colorado, and beyond. At the helm of the soon to be merged institution will be one of the pioneers that has helped lead the way by overcoming barriers to financial services for CRBs.
Career banker Sundie Seefried literally wrote the book on cannabis banking back in 2015. She says she was inspired by public safety risks posed by what was largely an all-cash business. After Colorado eased marijuana restrictions, she worked to serve this sector’s financial needs. Sundie became a leader in cannabis banking and has been providing guidance to other bankers, business owners, and policymakers. Ms. Seefried, who runs Safe Harbor Financial Corp. will soon be sowing more potent seeds within the industry.

Seefried’s Safe Harbor Financial announced a definitive agreement Monday to be taken public by Northern Lights Acquisition (NLIT) which was formed as a special purpose acquisition corporation (SPAC).
In a news release, Seefried explained the deal will position Safe Harbor to expand its financial services and support the growth of the cannabis industry. “Our goal is to become a ‘one stop-shop’ for cannabis business financial needs,” she added.
Terms of the Agreement
Under the merger, New York-based Northern Lights (NLIT), an affiliate of Luminous Capital, will pay $70 million in cash and $115 million in common stock to acquire Safe Harbor, a subsidiary of Colorado-based Partner Colorado Credit Union. The post-transaction equity value of the company is expected to be $327 million, according to the release.
The deal has already been approved by the board of directors and managers of Northern Lights, Partners Colorado and Safe Harbor, according to the news release. It remains subject to other closing conditions including approval by the stockholders of Northern Lights.
About Safe Harbor
Safe Harbor has nearly 600 accounts across 20 states. During 2021 it processed $4 billion in transactions, for a total of $11 billion since it began operations, according to the release.
Last year, Safe Harbor unveiled a commercial cannabis lending platform. Currently, it has an actionable pipeline of more than $300 million, including both existing and new customers, the release said.
John Darwin and Joshua Mann, co-CEOs of Northern Lights, will remain on Northern Lights’ board of directors after the sale is finalized. Sundie Seefried will serve as CEO of the merged company.
Suggested Reading
 Banks and Credit Unions Are Now Allowing Services For Marijuana And Cannabis Businesses
|
 What’s in the Senate’s Marijuana Tax Proposal
|
 Marijuana is Winning the Sports Battle
|
 Clarence Thomas’ Statement on Half-in, Half-out Marijuana Laws
|
Sources
https://shfinancial.org/resources/
https://www.facebook.com/SafeHarborFinancialLLC/photos/a.278325677682904/316238937224911
Stay up to date. Follow us:
|
|
Image Credit: Livewire
NEW Filing: Michael Burry’s Stock Market Holdings (Filed May 16, 2022)
On February 14, Michael Burry filed his company’s holdings report with the SEC. Relative to the previous quarter there was a little reshuffling of his positions. While many fund managers and successful investors such as Cathie Wood are talking about their ideas several times a week in the news, Burry is more quiet. A good way to understand Burry’s thinking and Scion Asset Management’s direction is to review changes to his 13F holdings. Or, hope for a rare
tweet.
Below we list all of Scion’s public company purchases and sales then provide information so you may drill down even deeper into Burry’s small and microcap holdings.
Why it Matters
No one would disagree that Burry’s investment universe is broader than the average self-directed investor and even deeper than the average hedge fund manager. With this in mind, out of the entire universe of publicly held corporations he could hold, there are only six that Burry’s portfolio owned at the end of the fourth quarter. One is a SPAC that is merging with an electric vehicle (EV) company. Two are small-cap holdings Scion had owned the previous quarter – Burry lightened up on one position and added to another. Three new large-cap purchases that round out the rest of the holdings span the defense, finance, and pharmaceutical industries.
Holdings Top to Bottom
Scion’s largest holding is Bristol-Myers Squibb (BMY). BMY had a market value on filing date of $18.7M, Scion’s position represents .014% of the company. The large pharmaceutical company was added last quarter while holdings in drug retailer CVS were brought to zero during the quarter.
Insurance company Fidelity National Financial, Inc. (FNF) provides various insurance products in the US with a large focus on real estate-related products. This includes title insurance, escrow, and other title-related services. FNF also provides technology and transaction services to the real estate and mortgage industries. Plus, life insurance products including annuities. The company had a market value on the filing date
of $16.96M, Scion’s position represents .114% of the company.
General Dynamics Corporation (GD) is a large U.S. aerospace and defense contractor. It operates through four segments: Aerospace, Marine Systems, Combat Systems, and Technologies. GD had a market value on the filing date of $16.68, Scion’s position represents .287% of the company. Scion’s position in defense contractor Lockheed Martin (LMT) was brought to zero during the quarter.
On Dec. 13, 2021 Harley-Davidson, Inc. (HOG), announced that AEA-Bridges Impact Corp. (IMPX), a special purpose acquisition company or SPAC with a focus on sustainability, entered into a definitive business combination agreement under which they will combine with LiveWire. LiveWire which will trade under ticker LVW is Harley-Davidson’s electric motorcycle division. The deal will create a new publicly-traded company. Michael Burry added this SPAC to Scion’s holdings. As of year-end, Scion owned 2.50% of the special purpose company or $9.99M.
The GEO Group (GEO) is a correctional facility that specializes in the ownership, leasing, and management of correctional, detention, and reentry facilities. The market value of Scion’s position was $6.69 million at quarter-end, which represented 6.94% of the company’s market value. Burry rebalanced this position which was carried over from the previous quarter as he reduced his holdings by 26%.
CoreCivic (CXW) is a publicly owned prison system that was trading as a REIT up until January 2021, it now trades as a Regular C-Corporation. Scion took a position during the third quarter of last year and apparently added to it. Burry’s quarter-end $5.54M position represents .46% of the company. During the quarter Burry increased the share of the company his fund holds by .34%.
Take-Away
Dr. Burry has an excellent record of spotting investment opportunities before the rest of the market catches up. His picks are as disparate as the mortgage market in 2008 and GameStop (GME) in 2020.
Recent research (GEO, CXW), and recorded interviews with management (CXW), and other small/microcap companies are available and regularly updated on Channelchek. Channelchek also closely follows and reports on the SPAC market with SPACtrac coverage and informative articles.
Sign-up to receive updates in your inbox.
Suggested Reading
One Great Protection Inherent in SPACs for Investors
|
Michael Burry’s Investments in Health, Bombs, and Bars
|
EV SPAC Activity Accelerated in 2021
|
Analysis of a SPAC
|
Sources
https://whalewisdom.com/filer/scion-asset-management-llc#tabholdings_tab_link
https://13f.info/manager/0001649339-scion-asset-management-llc
Stay up to date. Follow us:
|
|
![]()
Research, News, and Market Data on Euroseas Ltd
ATHENS, Greece, Feb. 15, 2022 (GLOBE NEWSWIRE) — Euroseas Ltd. (NASDAQ: ESEA, the “Company” or “Euroseas”), an owner and operator of container carrier vessels and provider of seaborne transportation for containerized cargoes, announced today its results for the three-month period and full year ended December 31, 2021.
Fourth Quarter 2021 Financial Highlights:
Total net revenues of $38.3 million. Net income and net income attributable to common shareholders of $22.7 million or $3.14 and $3.13 earnings per share basic and diluted, respectively. Adjusted net income attributable to common shareholders1 for the period was $22.9 million or $3.18 and $3.17 per share basic and diluted, respectively.
Adjusted EBITDA1 was $26.1 million.
An average of 15.01 vessels were owned and operated during the fourth quarter of 2021 earning an average time charter equivalent rate of $29,994 per day.
Full Year 2021 Highlights:
Total net revenues of $93.9 million. Net income of $42.9 million; net income attributable to common shareholders (after a $0.3 million dividend on Series B Preferred Shares and a $0.3 million of preferred deemed dividend arising out of the redemption of approximately $8.4 million of Series B Preferred Shares in the first half of 2021) of $42.3 million or $6.06 and $6.05 earnings per share basic and diluted, respectively. Adjusted net income attributable to common shareholders1 for the period was $42.0 million or $6.02 and $6.01 per share basic and diluted, respectively.
Adjusted EBITDA1 was $52.7 million.
An average of 14.25 vessels were owned and operated during the year 2021, earning an average time charter equivalent rate of $19,309 per day.
Recent developments
On January 28, 2022, we signed a contract for the construction of two additional Eco design fuel efficient containerships. The vessels will have a carrying capacity of about 2,800 teu each and will be built at Hyundai Mipo Dockyard Co. in South Korea. The two newbuildings are scheduled to be delivered during the fourth quarter of 2023 and first quarter of 2024, respectively. The total consideration for each of these two newbuilding contracts is approximately $43.15 million and will be financed with a combination of debt and equity. The vessels are sisterships of a pair of vessels ordered by Euroseas Ltd. in June 2021.
_____________________________________________
1Adjusted EBITDA, Adjusted net income and Adjusted earnings per share are not recognized measurements under U.S. GAAP (GAAP) and should not be used in isolation or as a substitute for Euroseas financial results presented in accordance with GAAP. Refer to a subsequent section of the Press Release for the definitions and reconciliation of these measurements to the most directly comparable financial measures calculated and presented in accordance with GAAP.
Aristides Pittas, Chairman and CEO of Euroseas commented:
“The fourth quarter of 2021 was a seminal one for Euroseas as we recorded the highest net income level in our history of about $22.7 million. At the same time, we have chartered about 92% of our available capacity in 2022, about 62% of our available capacity in 2023, and even about 40% of our available days in 2024. The high level of our contracted revenues secures extremely high profitability levels for Euroseas over the next two to three years.”
“In light of the increased environmental regulation that would reduce -on average- the transportation capacity of the existing fleet, we have shifted our strategic focus on how to position Euroseas post-pandemic and beyond. In this context, in January 2022, we placed an order for two more 2,800 teu vessels that we expect to have delivered in the fourth quarter of 2023 and first quarter of 2024. This brings our newbuilding program to four vessels and solidifies our market presence in the large eco feeder sector.”
“The retreat of the containerships rates during November and December 2021 proved to be short-lived. With the turn of the year, containership rates started increasing again and have returned to -and for some segments exceeded- the record high levels set only four months ago in October 2021. We are quite optimistic about the strength of the market over the next couple of years despite the expected easing of the inefficiencies in ports, due to the limited deliveries in the near term and the constraints on effective fleet supply of the emissions regulations from 2023 onwards alongside trade growth which has rebounded from the pandemic lows. We continuously monitor market developments and evaluate investment opportunities focusing on creating consistent returns for our shareholders and exploiting our public listing and increasing liquidity position.”
Tasos Aslidis, Chief Financial Officer of Euroseas commented: “The operating results of the fourth quarter of 2021 reflect the increased levels of charter rates in the containership markets as compared to the same period of 2020, with net income amounting to $22.7 million for the fourth quarter in 2021 compared to a net income of $0.6 million for the fourth quarter of 2020. On average, during the fourth quarter of 2021, our vessels earned approximately 185.7% higher time charter equivalent rates compared to the fourth quarter of 2020.”
“Total daily vessel operating expenses, including management fees, general and administrative expenses, but excluding drydocking costs, were higher by 7.6% during the fourth quarter of 2021 compared to the same quarter of last year. The increased operating expenses for the fourth quarter of 2021 are mainly due to higher hull and machinery insurance premiums and the increased crewing costs for our vessels resulting from difficulties in crew rotation due to COVID-19 related restrictions. Adjusted EBITDA during the fourth quarter of 2021 was $26.1 million compared to the $2.1 million achieved in fourth quarter of last year, and it reached $52.7 million versus $11.8 million for the respective twelve-month periods of 2021 and 2020.”
“As of December 31, 2021, our outstanding bank debt (excluding the unamortized loan fees) was $119.0 million, versus restricted and unrestricted cash of approximately $31.5 million. As of the same date, our scheduled debt repayments over the next 12 months amounted to about $29.3 million (excluding the unamortized loan fees).”
Fourth Quarter 2021 Results:
For the fourth quarter of 2021, the Company reported total net revenues of $38.3 million representing a 217.9% increase over total net revenues of $12.0 million during the fourth quarter of 2020, which was the result of the increased average time charter rates our vessels earned in the fourth quarter of 2021 compared to the corresponding period of 2020. The Company reported net income and net income attributable to common shareholders for the period of $22.7 million, as compared to a net income of $0.6 million and a net income attributable to common shareholders of $0.4 million for the fourth quarter of 2020.
Vessel operating expenses for the same period of 2021 amounted to $8.3 million as compared to $7.5 million for the same period of 2020. The increased amount is mainly due to the higher number of vessels owned and operated in the three months of 2021 compared to the same period of 2020, as well as the increased crewing costs for our vessels compared to the same period of 2020, resulting from difficulties in crew rotation due to COVID-19 related restrictions and the increase in hull and machinery insurance premiums. Drydocking expenses amounted to $1.2 million during the fourth quarter of 2021 comprising the cost of one vessel completing her special survey with drydock. For the same period of 2020 drydocking expenses amounted to $0.1 million comprising the cost of one vessel completing her intermediate survey in-water. Depreciation expense for the fourth quarter of 2021 increased to $2.4 million from $1.6 million in the fourth quarter of 2020, as a result of the increased number of vessels operated and the fact that the new vessels acquired in the fourth quarter of 2021 have a higher average daily depreciation charge as a result of their higher acquisition price compared to the remaining vessels. General and administrative expenses increased to $1.2 million in the fourth quarter of 2021, as compared to $0.8 million in the fourth quarter of 2020, mainly due to higher executive compensation expenses.
On average, 15.01 vessels were owned and operated during the fourth quarter of 2021 earning an average time charter equivalent rate of $29,994 per day compared to 14.43 vessels in the same period of 2020 earning on average $10,497 per day.
Interest and other financing costs for the fourth quarter of 2021 amounted to $0.78 million compared to $0.81 million for the same period of 2020. This decrease is due to the decrease in the weighted average LIBOR rate, partly offset by the increase in the Company’s average outstanding indebtedness in the current period compared to the same period of 2020.
Adjusted EBITDA1 for the fourth quarter of 2021 was $26.1 million compared to $2.1 million for the corresponding period in 2020.
Basic and diluted earnings per share attributable to common shareholders for the fourth quarter of 2021 was $3.14 and $3.13 calculated on 7,210,466 and 7,244,042 basic and diluted weighted average number of shares outstanding, respectively, compared to basic and diluted earnings per share of $0.07 for the fourth quarter of 2020, calculated on 6,149,300 basic and diluted weighted average number of shares outstanding.
Excluding the effect on the income attributable to common shareholders for the quarter of the unrealized loss on derivatives, the amortization of below market time charters acquired and the depreciation charged due to the increased value of the vessel acquired with below market time charter, the adjusted earnings attributable to common shareholders for the quarter ended December 31, 2021 would have been $3.18 and $3.17 per share basic and diluted, respectively, compared to an adjusted loss of $0.16 per share basic and diluted for the quarter ended December 31, 2020, after excluding unrealized gain on derivatives, net gain on sale of vessels, the amortization of below market time charters acquired and the depreciation charged due to the increased value of the vessels acquired with below market time charters. Usually, security analysts do not include the above items in their published estimates of earnings per share.
Full Year 2021 Results:
For the full year of 2021, the Company reported total net revenues of $93.9 million, representing a 76.2% increase, over total net revenues of $53.3 million during the twelve months of 2020. The Company reported a net income for the year of $42.9 million and a net income attributable to common shareholders of $42.3 million, as compared to a net income of $4.0 million and a net income attributable to common shareholders of $3.3 million for the twelve months of 2020. The results for the twelve months of 2021 include a $0.2 million of amortization of below market time charters acquired and a $0.2 million unrealized gain on derivatives. The results for the twelve months of 2020 included a $1.7 million of amortization of below market time charters acquired, a $0.6 million unrealized loss on derivatives, a $2.5 million net gain on sale of vessels and a $0.1 million loss on write-down of vessel held for sale.
Vessel operating expenses for the twelve months of 2021 amounted to $29.7 million as compared to $32.2 million for the same period of 2020. This decrease in vessel operating expenses is due to the lower average number of vessels operated by the Company in the twelve months of 2021 as compared to the same period of 2020, partly offset by the increased crewing costs for our vessels compared to the same period of 2020, resulting from difficulties in crew rotation due to COVID-19 related restrictions and the increase in hull and machinery insurance premiums. Depreciation expense for the twelve months of 2021 was $7.2 million compared to $6.6 million during the same period of 2020. Although the average number of vessels operating decreased in 2021 as compared to the same period of 2020, the new vessels acquired in the fourth quarter of 2021 have a higher average daily depreciation charge as a result of their higher acquisition price compared to the vessels sold during 2020, some of which were also fully depreciated.
Related party management fees for the twelve months of 2021 were $4.3 million compared to $5.3 million for the same period of 2020. This decrease in related party management fees is due to the lower average number of vessels operated by the Company in the twelve months of 2021 as compared to the same period of 2020, as well as due to termination fees paid in 2020 for the vessels sold during last year, in accordance with the management agreement. General and administrative expenses increased to $3.5 million during the twelve months of 2021 as compared to $3.0 million in the last year, mainly due to higher executive compensation expenses.
Drydocking expenses amounted to $4.1 million for the twelve months of 2021 (three vessels passed their special survey with drydock), compared to $0.5 million for the same period of 2020 (one vessel passed her intermediate survey in-water and three vessels passed their special survey in-water).
On average, 14.25 vessels were owned and operated during the twelve months of 2021 earning an average time charter equivalent rate of $19,309 per day compared to 17.23 vessels in the same period of 2020 earning on average $9,445 per day.
Interest and other financing costs for the twelve months of 2021 amounted to $2.8 million compared to $4.1million for the same period of 2020. This decrease is due to the decrease in the weighted average LIBOR rate, partly offset by the increase in the Company’s average outstanding indebtedness in the current period compared to the same period of 2020.
Adjusted EBITDA1 for the twelve months of 2021 was $52.7 million compared to $11.8 million during the twelve months of 2020.
Basic and diluted earnings per share attributable to common shareholders for the twelve months of 2021 was $6.06 and $6.05, calculated on 6,976,905 and 6,993,405 basic and diluted weighted average number of shares outstanding, respectively, compared to basic and diluted earnings per share of $0.58 for the twelve months of 2020, calculated on 5,753,917 basic and diluted weighted average number of shares outstanding.
Excluding the effect on the income attributable to common shareholders for the twelve months of 2021 of the unrealized gain on derivatives, the amortization of the below market time charters acquired, the depreciation charged due to the increased value of the vessel acquired with below market time charter and the net loss on sale of vessel, the adjusted earnings attributable to common shareholders for the year ended December 31, 2021 would have been $6.02 and $6.01 basic and diluted, respectively, compared to adjusted loss of $0.02 per share basic and diluted for 2020, after excluding unrealized loss on derivatives, net gain on sale of vessels, loss on write down of vessel held for sale, amortization of the below market time charters acquired and the depreciation charged due to the increased value of the vessels acquired with below market time charters. As previously mentioned, usually, security analysts do not include the above items in their published estimates of earnings per share.
Fleet Profile:
The Euroseas Ltd. fleet profile is as follows:
|
Name |
Type |
Dwt |
TEU |
Year Built |
Employment(*) |
TCE Rate ($/day) |
|
|
Container Carriers |
|||||||
|
MARCOS V |
Intermediate |
72,968 |
6,350 |
2005 |
TC until Dec-24 |
$42,200 |
|
|
AKINADA BRIDGE (*) |
Intermediate |
71,366 |
5,610 |
2001 |
TC until Oct-22 |
$20,000 |
|
|
SYNERGY BUSAN (*) |
Intermediate |
50,726 |
4,253 |
2009 |
TC until Aug-24 |
$25,000 |
|
|
SYNERGY ANTWERP (+) |
Intermediate |
50,726 |
4,253 |
2008 |
TC until Dec-23 |
$18,000 |
|
|
SYNERGY OAKLAND (*) |
Intermediate |
50,787 |
4,253 |
2009 |
TC until Apr-22 |
$160,000 (***) |
|
|
SYNERGY KEELUNG (+) |
Intermediate |
50,969 |
4,253 |
2009 |
TC until Jun-22 |
$11,750 |
|
|
EM KEA (*) |
Feeder |
42,165 |
3,100 |
2007 |
TC until May-23 |
$22,000 |
|
|
EM ASTORIA (+) |
Feeder |
35,600 |
2,788 |
2004 |
TC until Feb-22 |
$18,650 |
|
|
EVRIDIKI G (*) |
Feeder |
34,677 |
2,556 |
2001 |
TC until Feb-25 |
$40,000 |
|
|
EM CORFU (*) |
Feeder |
34,654 |
2,556 |
2001 |
TC until Feb-25 |
$40,000 |
|
|
DIAMANTIS P (*) |
Feeder |
30,360 |
2,008 |
1998 |
TC until Oct-24 |
$27,000 |
|
|
EM SPETSES (*) |
Feeder |
23,224 |
1,740 |
2007 |
TC until Aug-24 |
$29,500 |
|
|
JONATHAN P (*) |
Feeder |
23,351 |
1,740 |
2006 |
TC until Sep-24 |
$26,662(**) |
|
|
EM HYDRA (*) |
Feeder |
23,351 |
1,740 |
2005 |
TC until Apr-23 |
$20,000 |
|
|
JOANNA (*) |
Feeder |
22,301 |
1,732 |
1999 |
TC until Oct-22 |
$16,800 |
|
|
AEGEAN EXPRESS (*) |
Feeder |
18,581 |
1,439 |
1997 |
TC until Mar-22 |
$11,500 |
|
|
Total Container Carriers |
16 |
635,806 |
50,371 |
||||
|
Vessels under construction |
Type |
Dwt |
TEU |
To be delivered |
|
H4201 |
Feeder |
37,237 |
2,800 |
Q1 2023 |
|
H4202 |
Feeder |
37,237 |
2,800 |
Q2 2023 |
|
H4236 |
Feeder |
37,237 |
2,800 |
Q4 2023 |
|
H4237 |
Feeder |
37,237 |
2,800 |
Q1 2024 |
Notes:
(*) TC denotes time charter. All dates listed are the earliest redelivery dates under each time charter unless the contract rate is lower than the current market rate in which cases the latest redelivery date is assumed; vessels with the latest redelivery date shown are marked by (+).
(**) Rate is net of commissions (which are typically 5-6.25%)
(***) The previous charter of M/V Synergy Oakland of $202,000/day exceeded its maximum duration by about 25 days due to port delays with payment of the higher ($202,000/day) rate to the Company continuing during the extension. However, the extension resulted in the loss of the subsequent short-term charter of $130,000/day that was to be performed before the 4-year charter starts. The vessel, after an idle period of 15 days, was chartered for a single voyage charter at $160,000/day after the completion of which it will commence the 4-yr charter; the new charter arrangements will result in about the same average rate and total revenues as the original arrangements.
Summary Fleet Data:
|
Three Months, Ended |
Three Months, Ended |
Twelve Months, Ended |
Twelve Months, Ended |
|||||
|
FLEET DATA |
||||||||
|
Average number of vessels (1) |
14.43 |
15.01 |
17.23 |
14.25 |
||||
|
Calendar days for fleet (2) |
1,328.0 |
1,381.0 |
6,306.0 |
5,203.0 |
||||
|
Scheduled off-hire days incl. laid-up (3) |
73.1 |
31.1 |
283.4 |
88.4 |
||||
|
Available days for fleet (4) = (2) – (3) |
1,254.9 |
1,349.9 |
6,022.6 |
5,114.6 |
||||
|
Commercial off-hire days (5) |
18.5 |
– |
150.6 |
– |
||||
|
Operational off-hire days (6) |
46.6 |
20.5 |
118.1 |
77.2 |
||||
|
Voyage days for fleet (7) = (4) – (5) – (6) |
1,189.8 |
1,329.4 |
5,753.9 |
5,037.4 |
||||
|
Fleet utilization (8) = (7) / (4) |
94.8% |
98.5% |
95.5% |
98.5% |
||||
|
Fleet utilization, commercial (9) = ((4) – (5)) / (4) |
98.5% |
100.0% |
97.5% |
100.0% |
||||
|
Fleet utilization, operational (10) = ((4) – (6)) / (4) |
96.3% |
98.5% |
98.0% |
98.5% |
||||
|
AVERAGE DAILY RESULTS (usd/day) |
||||||||
|
Time charter equivalent rate (11) |
10,497 |
29,994 |
9,445 |
19,309 |
||||
|
Vessel operating expenses excl. drydocking expenses (12) |
6,586 |
6,807 |
5,949 |
6,541 |
||||
|
General and administrative expenses (13) |
578 |
901 |
482 |
671 |
||||
|
Total vessel operating expenses (14) |
7,164 |
7,708 |
6,431 |
7,212 |
||||
|
Drydocking expenses (15) |
75 |
866 |
85 |
787 |
||||
(1) Average number of vessels is the number of vessels that constituted the Company’s fleet for the relevant period, as measured by the sum of the number of calendar days each vessel was a part of the Company’s fleet during the period divided by the number of calendar days in that period.
(2) Calendar days. We define calendar days as the total number of days in a period during which each vessel in our fleet was in our possession including off-hire days associated with major repairs, drydockings or special or intermediate surveys or days of vessels in lay-up. Calendar days are an indicator of the size of our fleet over a period and affect both the amount of revenues and the amount of expenses that we record during that period.
(3) The scheduled off-hire days including vessels laid-up, vessels committed for sale or vessels that suffered unrepaired damages, are days associated with scheduled repairs, drydockings or special or intermediate surveys or days of vessels in lay-up, or with vessels that were committed for sale or suffered unrepaired damages.
(4) Available days. We define available days as the Calendar days in a period net of scheduled off-hire days as defined above. We use available days to measure the number of days in a period during which vessels were available to generate revenues.
(5) Commercial off-hire days. We define commercial off-hire days as days a vessel is idle without employment.
(6) Operational off-hire days. We define operational off-hire days as days associated with unscheduled repairs or other off-hire time related to the operation of the vessels.
(7) Voyage days. We define voyage days as the total number of days in a period during which each vessel in our fleet was in our possession net of commercial and operational off-hire days. We use voyage days to measure the number of days in a period during which vessels actually generate revenues or are sailing for repositioning purposes.
(8) Fleet utilization. We calculate fleet utilization by dividing the number of our voyage days during a period by the number of our available days during that period. We use fleet utilization to measure a company’s efficiency in finding suitable employment for its vessels and minimizing the amount of days that its vessels are off-hire for reasons such as unscheduled repairs or days waiting to find employment.
(9) Fleet utilization, commercial. We calculate commercial fleet utilization by dividing our available days net of commercial off-hire days during a period by our available days during that period.
(10) Fleet utilization, operational. We calculate operational fleet utilization by dividing our available days net of operational off-hire days during a period by our available days during that period.
(11) Time charter equivalent rate, or TCE rate, is a measure of the average daily net revenue performance of our vessels. Our method of calculating TCE is determined by dividing time charter revenue and voyage charter revenue net of voyage expenses by voyage days for the relevant time period. Voyage expenses primarily consist of port, canal and fuel costs that are unique to a particular voyage, which would otherwise be paid by the charterer under a time charter contract, or are related to repositioning the vessel for the next charter. TCE is a standard shipping industry performance measure used primarily to compare period-to-period changes in a shipping company’s performance despite changes in the mix of charter types (i.e., spot voyage charters, time charters and bareboat charters) under which the vessels may be employed between the periods. Our definition of TCE may not be comparable to that used by other companies in the shipping industry.
(12) Daily vessel operating expenses, which includes crew costs, provisions, deck and engine stores, lubricating oil, insurance, maintenance and repairs and management fees are calculated by dividing vessel operating expenses and related party management fees by fleet calendar days for the relevant time period. Drydocking expenses are reported separately.
(13) Daily general and administrative expense is calculated by dividing general and administrative expenses by fleet calendar days for the relevant time period.
(14) Total vessel operating expenses, or TVOE, is a measure of our total expenses associated with operating our vessels. TVOE is the sum of vessel operating expenses, management fees and general and administrative expenses; drydocking expenses are not included. Daily TVOE is calculated by dividing TVOE by fleet calendar days for the relevant time period.
(15) Drydocking expenses include expenses during drydockings that would have been capitalized and amortized under the deferral method, divided by the fleet calendar days for the relevant period. Drydocking expenses could vary substantially from period to period depending on how many vessels underwent drydocking during the period. The Company expenses drydocking expenses as incurred.
Conference Call and Webcast:
Today, Tuesday, February 15, 2022 at 10:30 a.m. Eastern Standard Time, the Company’s management will host a conference call to discuss the results.
Conference Call details:
Participants should dial into the call 10 minutes before the scheduled time using the following numbers: 1 (877) 553-9962 (US Toll Free Dial In), 0(808) 238- 0669 (UK Toll Free Dial In) or +44 (0) 2071 928592 (Standard International Dial In). Please quote “Euroseas” to the operator.
Audio Webcast – Slides Presentation:
There will be a live and then archived webcast of the conference call and accompanying slides, available through the Company’s website. To listen to the archived audio file, visit our website http://www.euroseas.gr and click on Company Presentations under our Investor Relations page. Participants to the live webcast should register on the website approximately 10 minutes prior to the start of the webcast.
The slide presentation on the fourth quarter ended December 31, 2021 will also be available in PDF format minutes prior to the conference call and webcast, accessible on the company’s website (www.euroseas.gr) on the webcast page. Participants to the webcast can download the PDF presentation.
Euroseas Ltd.
Unaudited Consolidated Condensed Statements of Operations
(All amounts expressed in U.S. Dollars – except number of shares)
|
Three Months Ended |
Three Months Ended |
Twelve Months Ended |
Twelve Months Ended |
|||||
|
2020 |
2021 |
2020 |
2021 |
|||||
|
Revenues |
||||||||
|
Time charter revenue |
12,532,549 |
39,999,276 |
55,681,124 |
97,979,667 |
||||
|
Commissions |
(499,174) |
(1,745,138) |
(2,378,007) |
(4,085,717) |
||||
|
Net revenues |
12,033,375 |
38,254,138 |
53,303,117 |
93,893,950 |
||||
|
Operating expenses/ (income) |
||||||||
|
Voyage expenses |
43,467 |
124,742 |
1,334,259 |
713,448 |
||||
|
Vessel operating expenses |
7,501,283 |
8,307,463 |
32,219,689 |
29,739,437 |
||||
|
Drydocking expenses |
99,093 |
1,195,712 |
536,199 |
4,094,693 |
||||
|
Vessel depreciation |
1,604,139 |
2,413,569 |
6,605,976 |
7,203,198 |
||||
|
Related party management fees |
1,244,394 |
1,093,684 |
5,293,199 |
4,294,789 |
||||
|
Net (gain) / loss on sale of vessels |
(1,148,720) |
– |
(2,453,736) |
9,417 |
||||
|
General and administrative expenses |
767,229 |
1,244,023 |
3,041,435 |
3,491,120 |
||||
|
Other operating income |
– |
– |
(2,687,205) |
(1,298,318) |
||||
|
Loss on write down of vessel held for sale |
– |
– |
121,165 |
– |
||||
|
Total operating expenses, net |
10,110,885 |
14,379,193 |
44,010,981 |
48,247,784 |
||||
|
Operating income |
1,922,490 |
23,874,945 |
9,292,136 |
45,646,166 |
||||
|
Other (expenses)/ income |
||||||||
|
Interest and other financing costs |
(805,076) |
(776,652) |
(4,125,150) |
(2,779,729) |
||||
|
Loss on debt extinguishment |
(491,571) |
– |
(491,571) |
– |
||||
|
Loss on derivatives, net |
(23,357) |
(448,449) |
(587,988) |
(27,141) |
||||
|
Foreign exchange (loss) / gain |
(20,469) |
26,497 |
(63,007) |
34,418 |
||||
|
Interest income |
820 |
541 |
17,011 |
3,510 |
||||
|
Other expenses, net |
(1,339,653) |
(1,198,063) |
(5,250,705) |
(2,768,942) |
||||
|
Net income |
582,837 |
22,676,882 |
4,041,431 |
42,877,224 |
||||
|
Dividend Series B Preferred shares |
(168,676) |
– |
(693,297) |
(255,324) |
||||
|
Preferred deemed dividend |
– |
– |
– |
(345,423) |
||||
|
Net income attributable to common shareholders |
414,161 |
22,676,882 |
3,348,134 |
42,276,477 |
||||
|
Weighted average number of shares outstanding, basic |
6,149,300 |
7,210,466 |
5,753,917 |
6,976,905 |
||||
|
Earnings per share attributable to common shareholders – basic |
0.07 |
3.14 |
0.58 |
6.06 |
||||
|
Weighted average number of shares outstanding, diluted |
6,149,300 |
7,244,042 |
5,753,917 |
6,993,405 |
||||
|
Earnings per share attributable to common shareholders – diluted |
0.07 |
3.13 |
0.58 |
6.05 |
||||
Euroseas Ltd.,
Unaudited Consolidated Condensed Balance Sheets
(All amounts expressed in U.S. Dollars – except number of shares)
|
December 31, |
December 31, |
|||||
|
ASSETS |
(unaudited) |
|||||
|
Current Assets: |
||||||
|
Cash and cash equivalents |
3,559,399 |
26,530,944 |
||||
|
Trade accounts receivable, net |
2,013,023 |
1,274,729 |
||||
|
Other receivables |
1,866,624 |
1,722,885 |
||||
|
Inventories |
1,662,422 |
2,185,740 |
||||
|
Restricted cash |
345,010 |
167,285 |
||||
|
Prepaid expenses |
244,315 |
382,729 |
||||
|
Derivatives |
– |
540,753 |
||||
|
Total current assets |
9,690,793 |
32,805,065 |
||||
|
Fixed assets: |
||||||
|
Vessels, net |
98,458,447 |
176,286,989 |
||||
|
Long-term assets: |
||||||
|
Advances for vessels under construction |
– |
7,615,958 |
||||
|
Restricted cash |
2,433,768 |
4,800,000 |
||||
|
Total assets |
110,583,008 |
221,508,012 |
||||
|
LIABILITIES, MEZZANINE EQUITY AND SHAREHOLDERS’ EQUITY |
||||||
|
Current liabilities: |
||||||
|
Long-term bank loans, current portion |
20,645,320 |
29,034,049 |
||||
|
Related party loan, current |
2,500,000 |
– |
||||
|
Trade accounts payable |
2,854,377 |
2,804,194 |
||||
|
Accrued expenses |
1,300,420 |
1,702,925 |
||||
|
Accrued preferred dividends |
168,676 |
– |
||||
|
Deferred revenue |
949,364 |
3,293,986 |
||||
|
Derivatives |
203,553 |
– |
||||
|
Due to related company |
24,072 |
309,969 |
||||
|
Total current liabilities |
28,645,782 |
37,145,123 |
||||
|
Long-term liabilities: |
||||||
|
Long -term bank loans, net of current portion |
46,220,028 |
89,004,951 |
||||
|
Derivatives |
362,195 |
952,666 |
||||
|
Fair value of below market time charters acquired |
– |
17,634,812 |
||||
|
Total long-term liabilities |
46,582,223 |
107,592,429 |
||||
|
Total liabilities |
75,228,005 |
144,737,552 |
||||
|
Mezzanine equity: |
||||||
|
Series B Preferred shares (par value $0.01, 20,000,000 shares authorized, 8,000 and nil issued and outstanding, respectively) |
8,019,636 |
– |
||||
|
Shareholders’ equity: |
||||||
|
Common stock (par value $0.03, 200,000,000 shares authorized, 6,708,946 and 7,294,541 issued and outstanding, respectively) |
201,268 |
218,836 |
||||
|
Additional paid-in capital |
257,467,980 |
264,609,028 |
||||
|
Accumulated deficit |
(230,333,881) |
(188,057,404) |
||||
|
Total shareholders’ equity |
27,335,367 |
76,770,460 |
||||
|
Total liabilities, mezzanine and shareholders’ equity |
110,583,008 |
221,508,012 |
||||
Euroseas Ltd.
Unaudited Consolidated Condensed Statements of Cash Flows
(All amounts expressed in U.S. Dollars)
|
Twelve Months |
Twelve Months |
|||
|
2020 |
2021 |
|||
|
Cash flows from operating activities: |
||||
|
Net income |
4,041,431 |
42,877,224 |
||
|
Adjustments to reconcile net income to net cash provided by operating activities: |
||||
|
Vessel depreciation |
6,605,976 |
7,203,198 |
||
|
Amortization and write off of deferred charges |
288,163 |
223,492 |
||
|
Share-based compensation |
121,631 |
182,324 |
||
|
Gain on hull & machinery claim |
(2,687,205) |
– |
||
|
Net (gain) / loss on sale of vessels |
(2,453,736) |
9,417 |
||
|
Loss on write down of vessel held for sale |
121,165 |
– |
||
|
Amortization of fair value of below market time charters acquired |
(1,714,370) |
(232,390) |
||
|
Unrealized loss / (gain) on derivatives |
565,748 |
(153,835) |
||
|
Loss on debt extinguishment |
491,571 |
– |
||
|
Changes in operating assets and liabilities |
(2,950,997) |
2,517,236 |
||
|
Net cash provided by operating activities |
2,429,377 |
52,626,666 |
||
|
Cash flows from investing activities: |
||||
|
Cash paid for vessels under construction |
– |
(7,615,958) |
||
|
Cash paid for vessel acquisitions and capitalized expenses |
– |
(65,523,144) |
||
|
Cash paid for vessel improvements |
(667,069) |
(974,058) |
||
|
Proceeds from sale of vessels |
14,622,768 |
– |
||
|
Insurance proceeds |
2,343,608 |
– |
||
|
Net cash provided by / (used in) investing activities |
16,299,307 |
(74,113,160) |
||
|
Cash flows from financing activities: |
||||
|
Redemption of Series B preferred shares |
– |
(2,000,000) |
||
|
Proceeds from issuance of common stock, net of commissions paid |
715,550 |
743,553 |
||
|
Preferred dividends paid |
(320,877) |
(424,000) |
||
|
Loan arrangement fees paid |
– |
(758,000) |
||
|
Offering expenses paid |
(184,321) |
(123,167) |
||
|
Proceeds from long- term bank loans |
– |
75,500,000 |
||
|
Repayment of long-term bank loans |
(17,905,920) |
(23,791,840) |
||
|
Repayment of related party loan |
(625,000) |
(2,500,000) |
||
|
Net cash (used in) / provided by financing activities |
(18,320,568) |
46,646,546 |
||
|
Net increase in cash, cash equivalents and restricted cash |
408,116 |
25,160,052 |
||
|
Cash, cash equivalents and restricted cash at beginning of year |
5,930,061 |
6,338,177 |
||
|
Cash, cash equivalents and restricted cash at end of year |
6,338,177 |
31,498,229 |
||
|
Cash breakdown |
||||
|
Cash and cash equivalents |
3,559,399 |
26,530,944 |
||
|
Restricted cash, current |
345,010 |
167,285 |
||
|
Restricted cash, long term |
2,433,768 |
4,800,000 |
||
|
Total cash, cash equivalents and restricted cash shown in the statement of cash flows |
6,338,177 |
31,498,229 |
||
Euroseas Ltd.
Reconciliation of Net income to Adjusted EBITDA
(All amounts expressed in U.S. Dollars)
|
Three Months Ended |
Three Months Ended |
Twelve Months Ended |
Twelve Months Ended |
|||||
|
Net income |
582,837 |
22,676,882 |
4,041,431 |
42,877,224 |
||||
|
Interest and other financing costs, net (incl. interest income and loss on debt extinguishment) |
1,295,827 |
776,111 |
4,599,710 |
2,776,219 |
||||
|
Vessel depreciation |
1,604,139 |
2,413,569 |
6,605,976 |
7,203,198 |
||||
|
Net (gain) / loss on sale of vessels |
(1,148,720) |
– |
(2,453,736) |
9,417 |
||||
|
Loss on write down of vessel held for sale |
– |
– |
121,165 |
– |
||||
|
Amortization of below market time charters acquired |
(240,639) |
(232,390) |
(1,714,370) |
(232,390) |
||||
|
Loss on interest rate swap derivatives |
23,357 |
448,449 |
587,988 |
27,141 |
||||
|
Adjusted EBITDA |
2,116,801 |
26,082,621 |
11,788,164 |
52,660,809 |
||||
Adjusted EBITDA Reconciliation:
Euroseas Ltd. considers Adjusted EBITDA to represent net income before interest, income taxes, depreciation, loss on interest rate swap derivatives, net (gain) / loss on sale of vessels, amortization of below market time charters acquired and loss on write down of vessel held for sale. Adjusted EBITDA does not represent and should not be considered as an alternative to net income, as determined by United States generally accepted accounting principles, or GAAP. Adjusted EBITDA is included herein because it is a basis upon which the Company assesses its financial performance and we believe that this non- GAAP financial measure assists our management and investors by increasing the comparability of our performance from period to period by excluding the potentially disparate effects between periods of, financial costs, amortization of below market time charters acquired, loss on interest rate swaps, net (gain) / loss on sale of vessels, loss on write down of vessel held for sale and depreciation. The Company’s definition of Adjusted EBITDA may not be the same as that used by other companies in the shipping or other industries.
Euroseas Ltd.
Reconciliation of Net income to Adjusted net (loss) / income
(All amounts expressed in U.S. Dollars – except share data and number of shares)
|
Three Months Ended |
Three Months Ended |
Twelve Months Ended |
Twelve Months Ended |
|||||
|
Net income |
582,837 |
22,676,882 |
4,041,431 |
42,877,224 |
||||
|
Unrealized (gain) / loss on derivatives |
(17,102) |
398,797 |
565,748 |
(153,835) |
||||
|
Net (gain)/ loss on sale of vessels |
(1,148,720) |
– |
(2,453,736) |
9,417 |
||||
|
Loss on write down of vessel held for sale |
– |
– |
121,165 |
– |
||||
|
Amortization of below market time charters acquired |
(240,639) |
(232,390) |
(1,714,370) |
(232,390) |
||||
|
Depreciation charged due to increase in vessel value from below market time charter acquired |
24,455 |
99,941 |
125,403 |
99,941 |
||||
|
Adjusted net (loss) / income |
(799,169) |
22,943,230 |
685,641 |
42,600,357 |
||||
|
Preferred dividends |
(168,676) |
– |
(693,297) |
(255,324) |
||||
|
Preferred deemed dividend |
– |
– |
– |
(345,423) |
||||
|
Adjusted net (loss) / income attributable to common shareholders |
(967,845) |
22,943,230 |
(7,656) |
41,999,610 |
||||
|
Adjusted (loss) / earnings per share, basic |
(0.16) |
3.18 |
(0.00) |
6.02 |
||||
|
Weighted average number of shares, basic |
6,149,300 |
7,210,466 |
5,753,917 |
6,976,905 |
||||
|
Adjusted (loss) / earnings per share, diluted |
(0.16) |
3.17 |
(0.00) |
6.01 |
||||
|
Weighted average number of shares, diluted |
6,149,300 |
7,244,042 |
5,753,917 |
6,993,405 |
||||
Adjusted net (loss) / income and Adjusted (loss) / earnings per share Reconciliation:
Euroseas Ltd. considers Adjusted net (loss) / income to represent net (loss) / income before unrealized (gain) / loss on derivatives, net (gain) / loss on sale of vessels, loss on write down of vessel held for sale, amortization of below market time charters acquired, and depreciation charged due to increase in vessel value from below market time charter acquired. Adjusted net (loss) / income and Adjusted (loss) / earnings per share is included herein because we believe it assists our management and investors by increasing the comparability of the Company’s fundamental performance from period to period by excluding the potentially disparate effects between periods of unrealized (gain) / loss on derivatives, net (gain) / loss on sale of vessels, loss on write down of vessel held for sale, amortization of below market time charters acquired and depreciation charged due to increase in vessel value from below market time charter acquired, which items may significantly affect results of operations between periods.
Adjusted net (loss) / income and Adjusted (loss) / earnings per share do not represent and should not be considered as an alternative to net income or earnings per share, as determined by GAAP. The Company’s definition of Adjusted net (loss) / income and Adjusted (loss) / earnings per share may not be the same as that used by other companies in the shipping or other industries.
About Euroseas Ltd.
Euroseas Ltd. was formed on May 5, 2005 under the laws of the Republic of the Marshall Islands to consolidate the ship owning interests of the Pittas family of Athens, Greece, which has been in the shipping business over the past 140 years. Euroseas trades on the NASDAQ Capital Market under the ticker ESEA.
Euroseas operates in the container shipping market. Euroseas’ operations are managed by Eurobulk Ltd., an ISO 9001:2008 and ISO 14001:2004 certified affiliated ship management company, which is responsible for the day-to-day commercial and technical management and operations of the vessels. Euroseas employs its vessels on spot and period charters and through pool arrangements.
The Company has a fleet of 16 vessels, including 10 Feeder containerships and 6 Intermediate Container carriers. Euroseas 16 containerships have a cargo capacity of 50,371 teu. After the delivery of four feeder containership newbuildings in 2023 and the first half of 2024, Euroseas’ fleet will consist of 20 vessels with a total carrying capacity of 61,571 teu.
Forward Looking Statement
This press release contains forward-looking statements (as defined in Section 27A of the Securities Act of 1933, as amended, and Section 21E of the Securities Exchange Act of 1934, as amended) concerning future events and the Company’s growth strategy and measures to implement such strategy; including expected vessel acquisitions and entering into further time charters. Words such as “expects,” “intends,” “plans,” “believes,” “anticipates,” “hopes,” “estimates,” and variations of such words and similar expressions are intended to identify forward-looking statements. Although the Company believes that the expectations reflected in such forward-looking statements are reasonable, no assurance can be given that such expectations will prove to have been correct. These statements involve known and unknown risks and are based upon a number of assumptions and estimates that are inherently subject to significant uncertainties and contingencies, many of which are beyond the control of the Company. Actual results may differ materially from those expressed or implied by such forward-looking statements. Factors that could cause actual results to differ materially include, but are not limited to changes in the demand for containerships, competitive factors in the market in which the Company operates; risks associated with operations outside the United States; and other factors listed from time to time in the Company’s filings with the Securities and Exchange Commission. The Company expressly disclaims any obligations or undertaking to release publicly any updates or revisions to any forward-looking statements contained herein to reflect any change in the Company’s expectations with respect thereto or any change in events, conditions or circumstances on which any statement is based.
Visit our website www.euroseas.gr
|
Company Contact |
Investor Relations / Financial Media |
|
Tasos Aslidis |
Nicolas Bornozis |