Release – Motorsport Games Reports Second Quarter 2022 Financial Results


Motorsport Games Reports Second Quarter 2022 Financial Results

Research, News, and Market Data on Motorsport Games

MIAMI, Aug. 10, 2022 (GLOBE NEWSWIRE) — Motorsport Games Inc. (NASDAQ: MSGM) (“Motorsport Games” or the “Company”) today reported financial results for its second quarter ended June 30, 2022 (“Q2 2022”). The Company has also posted to the Company’s investor relations website a Q2 2022 Quarter End Review video and a Q2 2022 earnings slide deck, which highlight certain key milestones that occurred in the period, as well as an updated Investor Presentation.

Dmitry Kozko, Chief Executive Officer of Motorsport Games, commented, “In Q2 2022, Motorsport Games continued its product and content releases to best deliver against our product roadmap. Within rFactor 2, we released new features and official BTCC content for our fans to enjoy. A promotional plan was announced, helping guide us further along in the lead up to the 2024 release of the official BTCC game. Our growing esports initiatives were further bolstered by the announcement of this year’s 2022/23 Le Mans Virtual Series schedule, which has continued to grow in stature, recognition and scale since the inaugural event. Lastly, we’ve delivered the highly anticipated next-gen console update for NASCAR 21: Ignition for our players on Xbox Series S and X, as well as PlayStation 5.”

Kozko added, “While we continue to explore multiple funding options to provide the Company sufficient liquidity to develop our products, we remain confident in our ability to deliver against our product roadmap.”

Second Quarter 2022
Business Update

?

NASCAR 21: Ignition Patch
Released Providing Native Support for PlayStation 5 and Xbox Series X|S.
 The Company released a patch for NASCAR 21: Ignition bringing support for 4K resolutions with next-generation consoles from Microsoft and Sony. The patch is free to everyone who owns the game and will be a free upgrade moving forward.


?

Le Mans Virtual Series
Returns for more Elite Esports Competition Including the Award Winning 24
Hours of Le Mans Virtual.
 The Le Mans Virtual Series returns this September with more of the elite, endurance esports competition, that has attracted world motor racing champions, captured global attention and received plaudits from teams, drivers and fans alike. All 5 rounds of the coming series will be held online on the rFactor2 platform, including the 24 Hours of Le Mans Virtual, the climax of the premier endurance esports championship. This format allows teams to compete virtually on simulators located all around the world for a total prize fund of US $250,000.


?

Future Promotional Plan to
Upcoming Official BTCC Game Announced. 
The Company announced a promotional plan update, including activations, content releases and ‘first-play content’ tech demos through rFactor 2, to its planned British Touring Car Championship (“BTCC”) official game, which will release in 2024, as previously disclosed by the Company.  


?

rFactor 2 Quarterly Content
Update. 
In May 2022, the Company released a collection of improvements, new features and content. A new sound engine, wet weather updates, particles and sparks, and shift protection bring more realism to the rFactor 2 racing simulation platform. Several BTCC cars and tracks were also released bringing more of the BTCC experience to the fans.  


?

KartKraft Single Console
Release Schedule Update.
 The timing of the next KartKraft release on one of the consoles, which was originally planned for a 2022 release date, will now likely move into 2023, due to potential opportunities we are exploring with a first party platform and their potential interest in an exclusive title release next year.


Financial Results for
the Three Months Ended June 30, 2022

Revenues for Q2 2022 were $2.0 million, as compared to $2.2 million for Q2 2021. The $0.2 million, or 10%, quarter-over-quarter decrease reflects $0.3 million lower gaming sales, partially offset by a $0.1 million increase in esports revenues, primarily from the 24 Hours of Le Mans esports event held in January 2022.

Q2 2022 net loss was $7.5 million, a $1.5 million increase compared to the Q2 2021 net loss of $6.0 million. The increase in net loss was driven by: (i) a $0.9 million increase in Q2 2022 development expenditures; (ii) a $0.8 million increase in sales and marketing spend (iii) a $0.6 million increase in foreign currency losses; (iv) a $0.2 million decrease in gross profit (v) a $0.2 million increase in interest expense (vi) a $0.1 million increase in impairment; and (vii) a $0.1 million increase in depreciation and amortization. The increases in Q2 2022 expenses described above were partially offset by a $1.4 million reduction in general and administrative expenses driven primarily by a $1.1 million payment in Q2 2021 for the settlement of certain stock appreciation rights.

Q2 2022 Adjusted EBITDA loss(1) was $4.9 million, a $1.2 million increase in loss when compared to Q2 2021 Adjusted EBITDA loss of $3.7 million. The increase in Adjusted EBITDA loss(1) was primarily driven by the same factors causing the increase in Q2 2022 net loss. 

The following table provides a reconciliation from net loss to Adjusted EBITDA(1) for Q2 2022 and Q2 2021, respectively:


Three
Months Ended June 30, 2022


Three
Months Ended June 30, 2021


Net Loss


$

(7,487,671

)


$

(5,960,943

)

Interest expense


191,662


31,899


Depreciation and Amortization


493,658


522,709


EBITDA


(6,802,351

)


(5,406,335

)

Acquisition-related expenses


1,467,492


1,600,087


Impairment of goodwill and intangible assets


149,048


Stock-based compensation


238,573


116,274


Adjusted EBITDA


$

(4,947,238

)


$

(3,689,974

)


Financial Results for
the Six Months Ended June 30, 2022

Revenues were $5.3 million and $4.7 million for the six months ended June 30, 2022 and 2021, respectively, an increase of $0.6 million, or 13%, period over period. For the six months ended June 30, 2022, revenues from our Gaming Segment increased $0.2 million, or 5%, to $4.9 million, compared to $4.7 million for the six months ended June 30, 2021, while revenues from our Esport Segment increased by $0.4 million for the six months ended June 30, 2022, when compared to the six months ended June 30, 2021. The increase in our Gaming segment revenues compared to the 2021 period was primarily due to $0.7 million in higher game sales and an increase of $0.6 million in additional revenues earned through the development of simulation platforms using our rFactor 2 platform for third parties. These increases were partially offset by $1.1 million in retail pricing concessions. The increase in our Esport Segment revenues was primarily driven by the 24 Hours of Le Mans esports event held in January 2022.

The net loss for the six months ended June 30, 2022 was $23.5 million, an increase of $3.5 million when compared to the $20.0 million net loss for the six months ended June 30, 2021. The increase in net loss was driven by: (i) a $9.4 million increase in goodwill and intangible asset impairment; (ii) a $2.0 million increase in development expenditures; (iii) a $1.5 million increase in sales and marketing spend; (iv) a $1.4 million decrease in gains from equity method investments; (v) a $0.9 million increase in foreign currency losses; (vi) a $0.6 million decrease in gross profit; and (vii) a $0.2 million increase in interest expense. These increases were offset by $12.7 million of lower general and administrative expense. 

For the six months ended June 30, 2022, Adjusted EBITDA loss(1) was $10.5 million, a $4.0 million increase, when compared to the $6.5 million Adjusted EBITDA loss for the six months ended June 30, 2021. The increase in Adjusted EBITDA loss(1) was primarily driven by the same factors as the increase in net loss for the six months ended June 30, 2022, when compared to the six months ended June 30, 2021.

The following table provides a reconciliation from net loss to Adjusted EBITDA(1) for the six months ended June 30, 2022 and the six months ended June 30, 2021:


Six
Months Ended

June 30, 2022


Six
Months Ended

June 30, 2021


Net Loss


$

(23,454,716

)


$

(20,046,367

)

Interest expense


393,258


151,438


Depreciation and Amortization


1,071,172


659,309


EBITDA


(21,990,286

)


(19,235,620

)

IPO-related expenses


2,947,192


Acquisition-related expenses


1,468,742


1,930,566


Impairment of goodwill and intangible assets


9,428,370


Gain attributable to equity method investment


(1,370,837

)

Stock-based compensation


591,603


9,193,190


Adjusted EBITDA


$

(10,501,571

)


$

(6,535,509

)


Cash Flow and
Liquidity

For the six months ended June 30, 2022, the Company had negative cash flows from operations of approximately $12.0 million. The Company expects to continue to have negative operating cash flows for the foreseeable future, as it continues to incur expenses to develop new game franchises. The Company’s existing cash on hand will be insufficient to fund its minimum liquidity requirements for at least the next 12 months and will need to be supplemented with additional debt and/or equity financing, cash generated by cost control initiatives, and/or additional changes to our product roadmap to reduce working capital requirements.

The Company’s future liquidity and capital requirements include funds to support the planned costs to operate its business, including amounts required to fund working capital, support the development and introduction of new products, maintain existing game titles and certain capital expenditures. The adequacy of the Company’s available funds generally depends on many factors, including its ability to successfully develop consumer-preferred new products or enhancements to its existing products, continued development and expansion of the Company’s esports platform and its ability to collaborate with and/or acquire other companies or technologies to enhance or complement the Company’s product and service offerings. 

The Company is currently seeking additional funds through a variety of arrangements and through maintaining and enhancing strong cost controls. There can be no assurances that the sources of liquidity referred to above will provide the Company with sufficient liquidity to meet its ongoing cash requirements as, among other things, the Company’s liquidity can be impacted by a number of factors, including the Company’s level of sales and expenditures, as well as accounts receivable, sales allowances, prepaid manufacturing expenses and accrued expenses.

(1)Use of Non-GAAP Financial Measures

Adjusted EBITDA (the “Non-GAAP Measure”) is not a financial measure defined by U.S. generally accepted accounting principles (“U.S. GAAP”). See the reconciliations of the Non-GAAP Measure to its most directly comparable U.S. GAAP measure in the financial tables above.

Adjusted EBITDA, a measure used by management to assess the Company’s operating performance, is defined as EBITDA, which is net (loss) plus interest (income) expense, depreciation and amortization, less income tax benefit (if any), adjusted to exclude: (i) IPO-related expenses; (ii) acquisition related expenses; (iii) gain attributable to equity method investment resulting from the acquisition of additional equity interest in Le Mans Esports Series Ltd.; (iv) stock-based compensation expenses; (v) impairment of goodwill and intangible assets; and (vi) other charges or gains resulting from non-recurring events.

The Company uses the Non-GAAP Measure to manage its business and evaluate its financial performance, as Adjusted EBITDA eliminates items that affect comparability between periods that the Company believes are not representative of its core ongoing operating business. Additionally, management believes that using the Non-GAAP Measure is useful to its investors because it enhances investors’ understanding and assessment of the Company’s normalized operating performance and facilitates comparisons to prior periods and its competitors’ results (who may define Adjusted EBITDA differently).

The Non-GAAP Measure is not a recognized term under U.S. GAAP and does not purport to be an alternative to revenue, income/loss from operations, net (loss) income, or cash flows from operations or as a measure of liquidity or any other performance measure derived in accordance with U.S. GAAP. Additionally, the Non-GAAP Measure is not intended to be a measure of free cash flows available for management’s discretionary use, as it does not consider certain cash requirements, such as interest payments, tax payments, working capital requirements and debt service requirements. The Non-GAAP Measure has limitations as an analytical tool, and investors should not consider it in isolation or as a substitute for the Company’s results as reported under U.S. GAAP. Management compensates for the limitations of using non-GAAP financial measures by using them to supplement U.S. GAAP results to provide a more complete understanding of the factors and trends affecting the business than would be presented by using only measures in accordance with U.S. GAAP. Because not all companies use identical calculations, the Company’s measures may not be comparable to other similarly titled measures of other companies. Reconciliations of the Non-GAAP Measure to net loss, its most directly comparable financial measure, calculated and presented in accordance with U.S. GAAP, are presented in the table above.

Conference Call and
Webcast Details

The Company will host a conference call and webcast at 5:00 p.m. ET today, August 10, 2022, to discuss its financial results. The live conference call can be accessed by dialing 1-877-407-0784 from the U.S. or 1-201-689-8560. Alternatively, participants may access the live webcast on the Motorsport Games Investor Relations website at https://ir.motorsportgames.com under “Events.”

About Motorsport Games

Motorsport Games, a Motorsport Network company, combines innovative and engaging video games with exciting esports competitions and content for racing fans and gamers around the globe. The Company is the officially licensed video game developer and publisher for iconic motorsport racing series across PC, PlayStation, Xbox, Nintendo Switch and mobile, including NASCAR, INDYCAR, 24 Hours of Le Mans and the British Touring Car Championship (“BTCC”). Motorsport Games is an award-winning esports partner of choice for 24 Hours of Le Mans, Formula E, BTCC, the FIA World Rallycross Championship and the eNASCAR Heat Pro League, among others.

For more information about Motorsport Games visit: www.motorsportgames.com

Forward-Looking
Statements

Certain statements in this press release, the related conference call and webcast which are not historical facts are forward-looking statements within the meaning of Section 27A of the Securities Act of 1933, as amended, and Section 21E of the Securities Exchange Act of 1934, as amended, and are provided pursuant to the safe harbor provisions of the Private Securities Litigation Reform Act of 1995. Any statements in this press release, the related conference call and webcast that are not statements of historical fact may be deemed forward-looking statements. Words such as “continue,” “will,” “may,” “could,” “should,” “expect,” “expected,” “plans,” “intend,” “anticipate,” “believe,” “estimate,” “predict,” “potential,” and similar expressions are intended to identify such forward-looking statements. These forward-looking statements include, but are not limited to, statements concerning: (i) Motorsport Games’ future business, future results of operations and/or financial condition; (ii) the expected future impact of new or planned products or offerings and the timing of launching such products and offerings, including, without limitation our belief that we will deliver against our product roadmap, our expectation to release the official BTCC game in 2024 and the next KartKraft release on one of the consoles in 2023; (iii) the expected future impact of implementing management strategies and the impact of other industry trends, including, without limitation our ability to execute a business continuity plan and adapt to developments real-time, as well as our business plan to increase and diversify our revenue stream; (iv) our expectation that the Company will continue to have negative operating cash flows for the foreseeable future, as we continue to incur expenses to develop new game franchises; and (v) our liquidity and capital requirements, including, without limitation, our ability to continue as a going concern, our belief that our existing cash on hand will not be sufficient to fund our liquidity requirements for at least the next 12 months and our expectation to supplement liquidity with additional debt and/or equity financing, cash generated by cost control initiatives, and/or additional changes to our product roadmap to reduce working capital requirements, as well as statements regarding our cash flows and anticipated uses of cash. All forward-looking statements involve significant risks and uncertainties that could cause actual results to differ materially from those expressed or implied in the forward-looking statements, many of which are generally outside the control of Motorsport Games and are difficult to predict. Examples of such risks and uncertainties include, but are not limited to: (i) difficulties, delays or less than expected results in achieving the Company’s growth plans, objectives and expectations, such as due to a slower than anticipated economic recovery and/or the Company’s inability, in whole or in part, to continue to execute its business strategies and plans, such as due to less than anticipated customer acceptance of the Company’s new game titles, the Company’s experiencing difficulties or the inability to launch its games as planned, less than anticipated performance of the games impacting customer acceptance and sales and/or greater than anticipated costs and expenses to develop and launch its games, including, without limitation, higher than expected labor costs and, in addition to the factors set forth in (ii) through (iv) below, the Company’s continuing financial condition and ability to obtain additional debt and/or equity financing to meet its liquidity requirements, such as the going concern qualification on the Company’s annual audited financial statements posing difficulties in obtaining new financing on terms acceptable to the Company, or at all; (ii) difficulties, delays in or unanticipated events that may impact the timing and scope of new product launches, such as due to difficulties or delays in using its product development personnel in Russia due to the Russia invasion of Ukraine and the related sanctions and/or more restrictive sanctions rendering transacting in the region more difficult or costly and/or difficulties and/or delays arising out of any resurgence of the ongoing and prolonged COVID-19 pandemic; (iii) less than expected benefits from implementing the Company’s management strategies and/or adverse economic, market and geopolitical conditions that negatively impact industry trends, such as significant changes in the labor markets, an extended or higher than expected inflationary environment (such as the impact on consumer discretionary spending as a result of significant increases in energy and gas prices which have been increasing since early in 2020), a higher interest rate environment, tax increases impacting consumer discretionary spending and or quantitative easing that results in higher interest rates that negatively impact consumers’ discretionary spending, or adverse developments relating to the Russia invasion of Ukraine; (iv) greater than anticipated negative operating cash flows such as due to higher than expected development costs, higher interest rates and/or higher inflation; and/or (v) difficulties and/or delays in resolving our liquidity and capital requirements, including without limitation, difficulties in securing funding that is on commercially acceptable terms to us or at all, such as our inability to complete in whole or in part any potential debt and/or equity financing transactions, as well as any inability to achieve cost reductions. Factors other than those referred to above could also cause Motorsport Games’ results to differ materially from expected results. Additional examples of such risks and uncertainties include, but are not limited to: (i) delays and higher than anticipated expenses related to the ongoing and prolonged COVID-19 pandemic, any resurgence of COVID-19 and the Russia invasion of Ukraine; (ii) Motorsport Games’ ability (or inability) to maintain existing, and to secure additional, licenses and other agreements with various racing series; (iii) Motorsport Games’ ability to successfully manage and integrate any joint ventures, acquisitions of businesses, solutions or technologies; (iv) unanticipated operating costs, transaction costs and actual or contingent liabilities; (v) the ability to attract and retain qualified employees and key personnel; (vi) adverse effects of increased competition; (vii) changes in consumer behavior, including as a result of general economic factors, such as increased inflation, higher energy prices and higher interest rates; (viii) Motorsport Games’ inability to protect its intellectual property; and/or (ix) local, industry and general business and economic conditions. Additional factors that could cause actual results to differ materially from those expressed or implied in the forward-looking statements can be found in Motorsport Games’ filings with the SEC, including its Annual Report on Form 10-K for the fiscal year ended December 31, 2021, its Quarterly Reports on Form 10-Q filed with the SEC during 2022, as well as in its subsequent filings with the SEC. Motorsport Games anticipates that subsequent events and developments may cause its plans, intentions and expectations to change. Motorsport Games assumes no obligation, and it specifically disclaims any intention or obligation, to update any forward-looking statements, whether as a result of new information, future events or otherwise, except as expressly required by law. Forward-looking statements speak only as of the date they are made and should not be relied upon as representing Motorsport Games’ plans and expectations as of any subsequent date. 

Website and Social
Media Disclosure

Investors and others should note that we announce material financial information to our investors using our investor relations website (ir.motorsportgames.com), SEC filings, press releases, public conference calls and webcasts. We use these channels, as well as social media and blogs, to communicate with our investors and the public about our company and our products. It is possible that the information we post on our websites, social media and blogs could be deemed to be material information. Therefore, we encourage investors, the media and others interested in our company to review the information we post on the websites, social media channels and blogs, including the following (which list we will update from time to time on our investor relations website):

Websites


Social Media

motorsportgames.com

Twitter: @msportgames & @traxiongg

traxion.gg

Instagram: msportgames & traxiongg

motorsport.com
 

Facebook: Motorsport Games & traxiongg


LinkedIn: Motorsport Games


Twitch: traxiongg


Reddit: traxiongg

The contents of these websites and social media channels are not part of, nor will they be incorporated by reference into, this press release.

Contacts:

Investors:
Investors@motorsportgames.com 

Media:
ASTRSK PR
motorsportgames@astrskpr.com

Appendix:

The following table provide a comparative summary of the Company’s financial results for the periods presented:

MOTORSPORT GAMES INC. AND SUBSIDIARIES
CONDENSED CONSOLIDATED STATEMENTS OF OPERATIONS
(Unaudited)


Three
Months Ended

June 30,


Six
Months Ended

June 30,


2022


2021


2022


2021


Revenues


$

2,008,987


$

2,238,927


$

5,330,776


$

4,713,059


Cost of revenues


856,157


906,303


2,869,963


1,688,111


Gross profit


1,152,830


1,332,624


2,460,813


3,024,948


Operating expenses:


Sales and marketing


1,540,220


704,222


3,228,669


1,728,440


Development


2,681,643


1,818,178


5,085,980


3,068,540


General and administrative


3,349,609


4,717,180


6,772,763


19,481,218


Impairment of goodwill


4,788,268


Impairment of intangible assets


149,048


4,640,102


Depreciation and amortization


117,725


66,448


233,796


97,223


Total operating expenses


7,838,245


7,306,028


24,749,578


24,375,421


Loss from operations


(6,685,415

)


(5,973,404

)


(22,288,765

)


(21,350,473

)

Interest expense


(191,662

)


(31,899

)


(393,258

)


(151,438

)

Gain attributable to equity method investment


1,370,837


Other (loss) income, net


(610,594

)


44,360


(772,693

)


84,707


Net loss


(7,487,671

)


(5,960,943

)


(23,454,716

)


(20,046,367

)

Less: Net loss attributable to non-controlling interest


(82,375

)


(180,849

)


(911,803

)


(454,299

)

Net loss attributable to Motorsport Games
Inc.


$

(7,405,296

)


$

(5,780,094

)


$

(22,542,913

)


$

(19,592,068

)


Net loss attributable to Class A common stock per share:


Basic and diluted


$

(0.63

)


$

(0.50

)


$

(1.93

)


$

(1.88

)


Weighted-average shares of Class A common stock outstanding:


Basic and diluted


11,673,587


11,494,919


11,670,888


10,421,910


Release – Comtech Appoints Ken Peterman President and Chief Executive Officer


Comtech Appoints Ken Peterman President and Chief Executive Officer

Research, News, and Market Data on Comtech Telecommunications

Company reiterates its financial guidance for the fiscal fourth
quarter and full year 2022

MELVILLE, N.Y.–(BUSINESS WIRE)–Aug. 10, 2022– August 10, 2022 — Comtech Telecommunications Corp. (NASDAQ: CMTL) today announced that its Board of Directors has appointed Chairman Ken Peterman President and Chief Executive Officer, succeeding Michael Porcelain effective immediately. Mr. Porcelain has also resigned from Comtech’s Board of Directors. Mr. Porcelain will be available to assist in the transition as needed.

Mr. Peterman joined the Comtech Board in May 2022 after the Board initiated a national search process in January 2022 with the goal of deepening the Board’s industry experience and strengthening its executive leadership expertise. Mr. Peterman’s career spans over 40 years leading major organizations in the creation of innovative, technology-enabled solutions addressing some of the world’s most challenging customer problems. A recognized thought leader in defense and aerospace, Mr. Peterman earned distinguished credentials across multiple technology sectors in both commercial and government markets at companies including Viasat, ITT/Exelis, Collins Aerospace, Raytheon and SpyGlass Group. Most recently, Mr. Peterman served as President of the Government Systems Segment of Viasat.

“Based on the Board’s extensive interactions with Ken since the beginning of 2022, we are confident Ken is the right leader to accelerate Comtech’s ongoing transformation,” said Lead Independent Director Lawrence Waldman. “The refreshed Board is excited to support Ken as he executes on his strategic vision for the Company.”

“I am genuinely excited about Comtech’s enormous potential. Thanks to our dedicated employees, our mission-critical technology portfolio, and our customer-centric culture, I believe Comtech is uniquely positioned to capitalize on the significant investment, steepening growth trajectories and continual renewal cycles taking place in assured communications, space and satellite networks and next-generation 911 failsafe communications infrastructures,” said Chairman and CEO Ken Peterman. “I’d like to thank Mike for his hard work and long-standing dedication to Comtech as well as for the recent groundwork he established to set the stage for the Company’s exciting next chapter. I look forward to engaging more deeply with our employees, customers, partners, and shareholders around the world over the coming weeks.”

“We’re grateful to Mike for his many contributions to the Company over the past 20 years in a variety of key positions,” added Judy Chambers, Head of the Nominating and Governance Committee of the Comtech Board. “We thank him for his longtime commitment to the Company, its customers, and its employees.”

“It has been an honor to lead Comtech,” said Mr. Porcelain. “After serving more than 20 years as a senior executive and positioning the Company for its next chapter, it is the right time for me to take a breather and spend time with my family before moving on to my next endeavor. I appreciated the opportunity to work with the Board to set the Company on a new path, and I know our platform, technologies and teams are in good hands. I intend to remain a shareholder of the Company and will be rooting for Comtech every step of the way.”

The Company reiterates its financial guidance for the fiscal fourth quarter and full year 2022, as provided in a press release issued on June 9, 2022.

About Comtech

Comtech Telecommunications Corp. is a leading global provider of next-generation 911 emergency systems and secure wireless communications technologies to commercial and government customers around the world. Headquartered in Melville, New York and with a passion for customer success, Comtech designs, produces and markets advanced and secure wireless solutions. For more information, please visit www.comtech.com.

Forward-Looking
Statements

Certain information in this press release contains statements that are forward-looking in nature and involve certain significant risks and uncertainties. Actual results could differ materially from such forward-looking information. The Company’s Securities and Exchange Commission filings identify many such risks and uncertainties. Any forward-looking information in this press release is qualified in its entirety by the risks and uncertainties described in such Securities and Exchange Commission filings.

PCMTL

View source version on businesswire.comhttps://www.businesswire.com/news/home/20220809006117/en/

Investor
Relations

Robert Samuels
631-962-7102

robert.samuels@comtech.com

Source: Comtech Telecommunications Corp.


Defense Metals Corp. (DFMTF) – Setting Up for a Compelling Preliminary Feasibility Study

Wednesday, August 10, 2022

Defense Metals Corp. (DFMTF)
Setting Up for a Compelling Preliminary Feasibility Study

Defense Metals Corp. is a mineral exploration and development company focused on the acquisition, exploration and development of mineral deposits containing metals and elements commonly used in the electric power market, defense industry, national security sector and in the production of green energy technologies, such as, rare earths magnets used in wind turbines and in permanent magnet motors for electric vehicles. Defense Metals owns 100% of the Wicheeda Rare Earth Element Property located near Prince George, British Columbia, Canada. Defense Metals Corp. trades in Canada under the symbol “DEFN” on the TSX Venture Exchange, in the United States, under “DFMTF” on the OTCQB and in Germany on the Frankfurt Exchange under “35D”.

Mark Reichman, Senior Research Analyst, Natural Resources, Noble Capital Markets, Inc.

Refer to the full report for the price target, fundamental analysis, and rating.

Resource infill and exploration drilling completed. Defense Metals announced the completion of its 2022 resource infill and exploration diamond drilling program. A total of 12 holes, representing over 3,500 meters, were drilled with initial assay results expected during September or October 2022. Drilling was centered in northern and central areas of the Wicheeda REE deposit pit area outlined in the company’s preliminary economic assessment (PEA).

Geotechnical drilling commences. Geotechnical drilling will aid optimizing the open pit slope design. Five geotechnical drill holes are contemplated and will target the north, west, south, and east high walls of the pit in the Wicheeda PEA mine plan. Data from the geotechnical drilling will be used to support future advanced economic studies….

This Company Sponsored Research is provided by Noble Capital Markets, Inc., a FINRA and S.E.C. registered broker-dealer (B/D).

*Analyst certification and important disclosures included in the full report. NOTE: investment decisions should not be based upon the content of this research summary. Proper due diligence is required before making any investment decision. 

New Proposal to Monitor Cryptocurrency in Large Hedge Funds


Image Credit: Global Commodities Forum (Flickr)


Private Funds May Soon be Mandated to Disclose Digital Asset Holdings and Performance

The Securities and Exchange Commission (SEC) and Commodity Futures Trade Commission (CFTC) have issued a joint proposal to better “assess systemic risk” of private fund advisors. The proposal includes language that would require reporting of cryptocurrency positions and performance measures of large hedge funds.


What is Form PF?

The form is a jointly adopted requirement used by both the SEC and CFTC. It’s a regulatory filing that mandates private fund advisers report regulatory assets under management to the Financial Stability Oversight Council (FSOC). The purpose is to monitor risks to the US financial system. Form PF affects SEC-registered managers of private equity funds, real estate funds, hedge funds, and liquidity funds with at least US$150 million in private fund assets.


The Proposal

Both Commissions settled on the proposed inclusion after consulting with the Treasury Department and Federal Reserve on potential financial-stability risks in the private-funds industry. SEC Chairman Gary Gensler noted that private funds’ total assets are nearing the size of the banking sector’s assets. “In the decade since the SEC and CFTC jointly adopted Form PF, regulators have gained vital insight with respect to private funds. Since then, though, the private fund industry has grown in gross asset value by nearly 150 percent and evolved in terms of its business practices, complexity, and investment strategies,” said SEC Chair Gary Gensler.

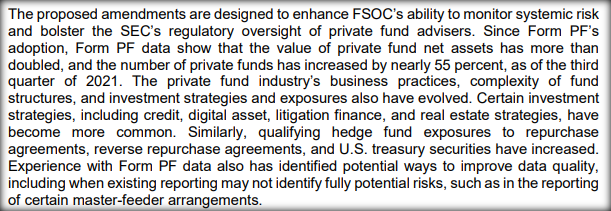
The SEC/CFTC Proposed Amendments to Form PF include a number of amendments designed to enhance the FSOC’s ability to monitor systemic risk and bolster regulatory oversight of private fund advisors. Beyond crypto, the proposal would require hedge funds with more than $500 million of net assets to report more information on Form PF about their investment exposures, portfolio concentrations, and borrowing arrangements.


Image: Selection from

The proposal on Wednesday (August 10) would add “digital assets” for the first time on Form PF. It also defines what a digital asset is in the eye of the regulators. It has opened a 60-day comment period on whether funds should report detailed information about the cryptocurrencies they hold. This includes identifying specifically or describing their characteristics.

The proposal notes that many hedge funds have been formed recently to invest in crypto, while some other existing funds have added the asset class to portfolios.


Expected Benefit

The recent drop in the prices of digital tokens like bitcoin and Ether has not spread to other asset classes. But the implosion of a crypto-focused hedge fund earlier this summer created a chain reaction that dragged a number of its creditors into bankruptcy.

Regulators want to get ahead of any chain reaction that could extend into traditional markets if mainstream financial institutions increase their adoption of cryptocurrencies before additional guardrails are put in place. “Gathering such information would help the commissions and [financial-stability regulators] better to observe how large hedge funds interconnect with the broader financial services industry,” Mr. Gensler said.

Paul Hoffman

Managing Editor, Channelchek

Suggested Content


Who will Regulate Cryptocurrencies? The Senate May Have a Favorite


Looming Cryptocurrency Regulation and SEC Thoughts


The Fed Chairman is Less Likely to Box Himself in With Specific Promises


SEC’s Controversial Game Show Themed Education Campaign


Sources

https://www.sec.gov/rules/proposed/2022/ia-6083.pdf

https://www.sec.gov/files/formpf.pdf

https://www.wsj.com/articles/regulators-weigh-asking-hedge-funds-to-report-crypto-exposure-11660140000?mod=djemalertNEWS

https://www.wsj.com/articles/mainstream-hedge-funds-pour-billions-of-dollars-into-crypto-11646808223?mod=article_inline

Stay up to date. Follow us:


ACCO Brands (ACCO) – Post Call Commentary

Wednesday, August 10, 2022

ACCO Brands (ACCO)
Post Call Commentary

ACCO Brands Corporation is one of the world’s largest designers, marketers and manufacturers of branded academic, consumer and business products. Our widely recognized brands include AT-A-GLANCE®, Esselte®, Five Star®, GBC®, Kensington®, Leitz®, Mead®, PowerA®, Quartet®, Rapid®, Rexel®, Swingline®, Tilibra®, and many others. Our products are sold in more than 100 countries around the world. More information about ACCO Brands, the Home of Great Brands Built by Great People, can be found at www.accobrands.com.

Joe Gomes, Senior Research Analyst, Noble Capital Markets, Inc.

Joshua Zoepfel, Research Associate, Noble Capital Markets, Inc.

Refer to the full report for the price target, fundamental analysis, and rating.

Hit the Reset Button. The major drag on 2Q results and full year guidance is PowerA. After a fantastic 2021, a lack of chips for consoles and a more normalized level of demand post-COVID resulted in PowerA sales declining in 2Q. ACCO’s management also gave an updated full year projection for PowerA, for which sales are estimated to be down 10-15%, or about $25-$40 million, for all of 2022.

Forex No Friend. The other major contributor to reduced guidance is forex headwinds. Forex is now expected to have a negative 4.5% impact on revenue for the year, up 200 bp from management’s previous expectation. Outside of PowerA and forex, the rest of ACCO’s business looks solid, although a significant economic downturn could change that view….

This Company Sponsored Research is provided by Noble Capital Markets, Inc., a FINRA and S.E.C. registered broker-dealer (B/D).

*Analyst certification and important disclosures included in the full report. NOTE: investment decisions should not be based upon the content of this research summary. Proper due diligence is required before making any investment decision. 

Kratos Defense & Security (KTOS) – Building Award Momentum

Wednesday, August 10, 2022

Kratos Defense & Security (KTOS)
Building Award Momentum

Kratos Defense & Security Solutions, Inc. (NASDAQ:KTOS) develops and fields transformative, affordable technology, platforms, and systems for United States National Security related customers, allies, and commercial enterprises. Kratos is changing the way breakthrough technologies for these industries are rapidly brought to market through proven commercial and venture capital backed approaches, including proactive research, and streamlined development processes. At Kratos, affordability is a technology, and we specialize in unmanned systems, satellite communications, cyber security/warfare, microwave electronics, missile defense, hypersonic systems, training and combat systems and next generation turbo jet and turbo fan engine development. For more information go to www.kratosdefense.com.

Joe Gomes, Senior Research Analyst, Noble Capital Markets, Inc.

Joshua Zoepfel, Research Associate, Noble Capital Markets, Inc.

Refer to the full report for the price target, fundamental analysis, and rating.

Awards. Kratos announced the receipt of two drone contract awards over the past two days, building momentum in the space. The first is an approximate $20 million production contract for high performance, jet powered, unmanned aerial target drone systems. The second is an approximate $14 million tactical jet drone contract award. While details of the tactical drone award were limited, we note the Company does reference its manned-unmanned teaming capabilities and the evolution of certain of Kratos’ highest performance, most capable unmanned aerial systems. Kratos is working on a number of manned-unmanned platforms, of which Skyborg is the most well known.

Capabilities. We believe these contract awards are representative of Kratos’ industry leading position for certain of the highest performance and most capable jet drone aircraft flying in the world today. Kratos today has multiple active production lines producing approximately 150 target and tactical jet drone aircraft annually. These new drone production contract awards are a key element of the Company’s future expected growth trajectory….

This Research is provided by Noble Capital Markets, Inc., a FINRA and S.E.C. registered broker-dealer (B/D).

*Analyst certification and important disclosures included in the full report. NOTE: investment decisions should not be based upon the content of this research summary. Proper due diligence is required before making any investment decision. 

PDS Biotechnology Corp (PDSB) – As PDS0101 Trials Continue, Preparations For Pivotal Studies Begin.

Wednesday, August 10, 2022

PDS Biotechnology Corp (PDSB)
As PDS0101 Trials Continue, Preparations For Pivotal Studies Begin.

PDS Biotech is a clinical-stage immunotherapy company developing a growing pipeline of molecularly targeted cancer and infectious disease immunotherapies based on the Company’s proprietary Versamune® and Infectimune™ T-cell activating technology platforms. Our Versamune®-based products have demonstrated the potential to overcome the limitations of current immunotherapy by inducing in vivo, large quantities of high-quality, highly potent polyfunctional tumor specific CD4+ helper and CD8+ killer T-cells. PDS Biotech has developed multiple therapies, based on combinations of Versamune® and disease-specific antigens, designed to train the immune system to better recognize diseased cells and effectively attack and destroy them. The Company’s pipeline products address various cancers including HPV16-associated cancers (anal, cervical, head and neck, penile, vaginal, vulvar) and breast, colon, lung, prostate and ovarian cancers.

Robert LeBoyer, Vice President, Research Analyst, Life Sciences , Noble Capital Markets, Inc.

Refer to the full report for the price target, fundamental analysis, and rating.

Quarterly Loss Was Less Than We Estimated.  PDS Biotech reported 2Q22 loss of $5.8 million or $(0.20) per share, beating our estimated loss of $8.8 million or $(0.34) per share. The differences were largely due to R&D expense of $3.7 million compared with our estimate of $5.3 million, as well as a $1.2 million tax benefit. The company ended the quarter with $53.0 million in cash.

As The Versatile-002 Trial Continues, Phase 3 Planning Begins.  The Phase 2 Versatile-002 trial, testing PDS0101 in combination with the checkpoint inhibitor Keytruda, received a positive opinion from its independent Data Safety Monitoring Board. The recommendation was to continue the trial to completion without any changes to the protocol.  In June, the combination of PDS0101 with Keytruda received Fast-Track designation from the FDA….

This Company Sponsored Research is provided by Noble Capital Markets, Inc., a FINRA and S.E.C. registered broker-dealer (B/D).

*Analyst certification and important disclosures included in the full report. NOTE: investment decisions should not be based upon the content of this research summary. Proper due diligence is required before making any investment decision. 

Release – Defense Metals Diamond Drilling Update Infill and Exploration Drilling Complete And Pit Slope Geotechnical Drilling Underway


Defense Metals Diamond Drilling Update Infill and Exploration Drilling Complete And Pit Slope Geotechnical Drilling Underway

News, and Market Data on Defense Metals

VANCOUVER, BC, Aug. 9, 2022 /CNW/ – Defense Metals Corp. (“Defense
Metals
” or the “Company“) (TSXV: DEFN) (OTCQB: DFMTF) (FSE: 35D) is pleased to provide an update for its ongoing diamond drilling at its Wicheeda Rare Earth Element (REE) deposit. The 2022 resource infill and exploration diamond drill campaign is now complete and pit slope geotechnical drilling underway.

Figure 1. Wicheeda REE Deposit PEA Ultimate Pit Geotechnical Drill Plan (CNW Group/Defense Metals Corp.)

A total of 12 diamond drill holes totalling over 3,500 metres have been drilled to date within the northern and central areas of the Wicheeda REE Deposit preliminary economic assessment (PEA) mine plan ultimate pit area, with initial assays results from the earliest drill holes expected during September or October 2022.

All materials, instrumentation, and technical personnel have now been mobilized to site to commence geotechnical drilling for the purpose of open pit slope design optimization. A total of 5 geotechnical drill holes targeting the north, west, south, and east high walls of the Wicheeda PEA mine plan ultimate pit are planned (Figure 1). Data collection will include oriented drill core, field point load and laboratory-based intact rock and discontinuity strength testing, vibrating wire piezometer, and standpipe piezometer installation for hydrogeological investigations.

Kristopher Raffle, P.Geo., Director and QP of Defense Metals commented: “Defense
Metals is very pleased with the progress of the 2022 infill and exploration
drilling to date, and we look forward to gathering important pit slope
geotechnical data to support future Wicheeda REE Deposit advanced economic
studies.”

Management Site Visit

Concurrent with the commencement of geotechnical investigations Defense Metals’ management has arranged for a Wicheeda field visit during the week of August 15, 2022, to accompany strategic interested parties and capital market analysts.

About the Wicheeda REE
Property

The 100% owned 4,244-hectare Wicheeda REE Property, located approximately 80 km northeast of the city of Prince George, British Columbia, is readily accessible by all-weather gravel roads and is near infrastructure, including power transmission lines, the CN railway, and major highways.

The Wicheeda REE Project yielded a robust 2021 PEA that demonstrated an after-tax net present value (NPV@8%) of $517 million, and 18% IRR1. A unique advantage of the Wicheeda REE Project is the production of a saleable high-grade flotation-concentrate. The PEA contemplates a 1.8 Mtpa (million tonnes per year) mill throughput open pit mining operation with 1.75:1 (waste:mill feed) strip ratio over a 19 year mine (project) life producing and average of 25,423 tonnes REO annually. A Phase 1 initial pit strip ratio of 0.63:1 (waste:mill feed) would yield rapid access to higher grade surface mineralization in year 1 and payback of $440 million initial capital within 5 years.

____________________________

1 Independent Preliminary Economic Assessment for the Wicheeda Rare Earth Element Project, British Columbia, Canada, dated January 6, 2022, with an effective date of November 7, 2021, and prepared by SRK Consulting (Canada) Inc. is filed under Defense Metals Corp.’s Issuer Profile on SEDAR (www.sedar.com).

Qualified Person

The scientific and technical information contained in this news release as it relates to the Wicheeda REE Project has been reviewed and approved by Kristopher J. Raffle, P.Geo. (BC) Principal and Consultant of APEX Geoscience Ltd. of Edmonton, AB, a director of Defense Metals and a “Qualified Person” as defined in NI 43-101. Mr. Raffle verified the data disclosed which includes a review of the sampling, analytical and test data underlying the information and opinions contained therein.

About Defense Metals
Corp.

Defense Metals Corp. is a mineral exploration and development company focused on the acquisition, exploration and development of mineral deposits containing metals and elements commonly used in the electric power market, defense industry, national security sector and in the production of green energy technologies, such as, rare earths magnets used in wind turbines and in permanent magnet motors for electric vehicles. Defense Metals owns 100% of the Wicheeda Rare Earth Element Property located near Prince George, British Columbia, Canada. Defense Metals Corp. trades in Canada under the symbol “DEFN” on the TSX Venture Exchange, in the United States, under “DFMTF” on the OTCQB and in Germany on the Frankfurt Exchange under “35D”.

For further information,
please contact:

Todd Hanas, Bluesky Corporate Communications Ltd.
Vice President, Investor Relations
Tel: (778) 994 8072
Email: 
todd@blueskycorp.ca

Neither
the TSX Venture Exchange nor its Regulation Services Provider (as that term is
defined in the policies of the TSX Venture Exchange) accepts responsibility for
the adequacy or accuracy of this news release.

Cautionary Statement
Regarding “Forward-Looking” Information

This news release contains “forward?looking information or statements” within the meaning of applicable securities laws, which may include, without limitation, statements relating to advancing the Wicheeda REE Project, drill results including anticipated timeline of such results/assays, the Company’s plans for its Wicheeda REE Project, expanded resource and scale of expanded resource, expected results and outcomes, Wicheeda site visit and expected outcomes, the technical, financial and business prospects of the Company, its project and other matters. All statements in this news release, other than statements of historical facts, that address events or developments that the Company expects to occur, are forward-looking statements. Although the Company believes the expectations expressed in such forward-looking statements are based on reasonable assumptions, such statements are not guarantees of future performance and actual results may differ materially from those in the forward-looking statements. Such statements and information are based on numerous assumptions regarding present and future business strategies and the environment in which the Company will operate in the future, including the price of rare earth elements, the anticipated costs and expenditures, the ability to achieve its goals, that general business and economic conditions will not change in a material adverse manner, that financing will be available if and when needed and on reasonable terms. Such forward-looking information reflects the Company’s views with respect to future events and is subject to risks, uncertainties and assumptions, including the risks and uncertainties relating to the interpretation of exploration results, risks related to the inherent uncertainty of exploration and cost estimates, the potential for unexpected costs and expenses and those other risks filed under the Company’s profile on SEDAR at www.sedar.com. While such estimates and assumptions are considered reasonable by the management of the Company, they are inherently subject to significant business, economic, competitive and regulatory uncertainties and risks. Factors that could cause actual results to differ materially from those in forward looking statements include, but are not limited to, continued availability of capital and financing and general economic, market or business conditions, adverse weather and climate conditions, failure to maintain or obtain all necessary government permits, approvals and authorizations, failure to maintain community acceptance (including First Nations),  risks relating to unanticipated operational difficulties (including failure of equipment or processes to operate in accordance with specifications or expectations, cost escalation, unavailability of personnel, materials and equipment, government action or delays in the receipt of government approvals, industrial disturbances or other job action, and unanticipated events related to health, safety and environmental matters), risks relating to inaccurate geological and engineering assumptions, decrease in the price of rare earth elements, the impact of Covid-19 or other viruses and diseases on the Company’s ability to operate, an inability to predict and counteract the effects of COVID-19 on the business of the Company, including but not limited to, the effects of COVID-19 on the price of commodities, capital market conditions, restriction on labour and international travel and supply chains, loss of key employees, consultants, or directors, increase in costs, delayed drilling results, litigation, and failure of counterparties to perform their contractual obligations. The Company does not undertake to update forward?looking statements or forward?looking information, except as required by law.

SOURCE Defense Metals Corp.


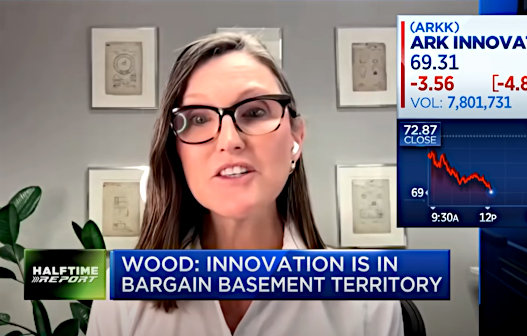
Cathie Wood’s Expectations for Inflation, Recession, Markets, China, and Jobs


Image: Bloomberg TV (August 8, 2022)


Why Cathie Wood Thinks We Will Emerge from A Recession More Quickly than Others

Cathie Wood, the founder, and CIO of Ark Invest, was asked in an interview, “Is the Fed going to continue hiking rates, or are they going to stop and turn around and come back down next year?” Her response was not initially uplifting, but as she explained why her firm has evaluated the current economic growth trajectory and what the future may bring, the fund manager, that focuses on innovative sectors, was actually optimistic.


Are Jobs Strong?

Wood brought up July’s huge unexpected increase in Non-Farm Payroll and contrasted it with the Household Employment numbers (a broader-based survey). She reminded the Bloomberg interviewer that Household Employment “…has been flat to down for the last four months.”  She added, “If you look at [unemployment] claims, we’ve never seen a faster increase.” She thinks people don’t weigh in the fact that we are up 50% off the low in unemployment. Cathie Wood also mentioned that large numbers of people are being laid off, then she referenced a Challenger survey that reported layoffs are up 55-60% year-over-year.

The reason she gave for the layoffs is inventory levels. “We have a massive inventory glut.” She believes the push to hire is ending and unwinding.


Is Inflation a Non-Issue?

Cathie Wood had been on record as previously saying, “deflation is more of a concern than inflation.” She was asked if she still feels this way. “I still think that because the evidence is piling up. Now the CPI and to some measure the PPI, both of those are lagging indicators.” She emphasized, “The Fed is driving policy off lagging indicators.”

What she prefers to look at is the price of commodities used for building and growth like copper. She said that copper took a decisive break to the downside (20%), but the decrease hasn’t yet fed into the inflation indexes. Wood says a better measure of where inflation is headed is gold. “Prices [Gold] peaked August 2020, we’ve been in a trading range, we’re at the low end of the trading range now.” She believes if the Fed continues to tighten, her firm’s expectation is the dollar will turn back up, and commodities will continue
to fall
.

The next inflation report is due Wednesday (August 10). An Econoday consensus estimate puts July headline inflation at 8.7%, cooling from 9.1% in June.


Are We in a Recession?

“Yes, we believe we are in a recession.” Wood told the interviewer. She explained that the economy receded for two consecutive quarters, which is the beginning of the definition. Three consecutive declines in leading indicators would suggest the same, she explained. “Our point of view is this is going to be a severe inventory recession, but we don’t have the systemic excesses like we did pre-2008, 2009 in the mortgage market.” She explained that while many economists use the inverted yield curve and say it indicates a recession next year, she believes we will be coming out of our current recession next year.


What’s Going on in China?

Cathie Wood says the big question is what is going on in China? She offered that perhaps the commodity prices unraveling has to do with the Chinese economy, especially their growth-inhibiting policies and real estate problems. She thinks China’s economy is going to be more difficult for them to control than they anticipated.


Why Stay Invested?

She was asked if it makes sense to move to cash since there are possible trouble spots on the horizon. In classic, confident optimism, Cathie Wood responded, “We are going to stay 100% in innovation.” Her reason is innovation is going to be a critical allocation in the years ahead. She explained, “Innovation saves time. Innovation solves problems.” She then listed the current problems, as supply chain, and energy, and food price increases. “Better, cheaper, faster, more productive, more efficient, more creative, is going to win,”  she exclaimed.

Wood thinks most asset allocators are short the innovation categories. Her idea of the sector is not current day high tech Nasdaq 100, but what Nasdaq used to be in the 1990s.

The Federal Reserve will reverse course on interest-rate policy next year by yanking down borrowing rates in the face of weaker activity in the US economy, disruptive-tech investor Cathie Wood told Bloomberg TV.

“We’re getting all kinds of signals that the economy is very weak,” which will prompt the Fed to start rate cuts in 2023, she said Monday.


Take Away

The well-followed manager always has strong convictions, they are often contrary to popular opinion. These forecasts have both served her firm and investors well and have caused disappointment when the volatile innovative sector is giving back gains.

She said that she will stay 100% invested as the industries and companies her funds are most heavily weighted in will be the kind of companies that help resolve issues weighing on consumers and economies today.

Did you know Channelchek has no paywall – and never will? Take the time to sign-up now for regular emails on quality research of innovative companies and insightful articles and ideas.

Paul Hoffman

Managing Editor, Channelchek

Suggested Content


Cathie Wood Thinks if There is No Blood in Your Street, You Should Move


Michael Burry vs Cathie Wood is Not an Even Competition


Peter Lynch Echoes Michael Burry’s Warning About Index Investments


A Look at Global Inflation and its Causes


https://www.bloomberg.com/news/videos/2022-08-08/cathie-wood-on-the-fed-economy-coinbase-tesla-video

https://www.econoday.com/august-boe-mpc-preview-time-for-a-change-of-gear/

Stay up to date. Follow us:


Release – V2X (Formerly Vectrus) Reports Strong Second Quarter 2022 Results


V2X (Formerly Vectrus) Reports Strong Second Quarter 2022 Results

Research, News, and Market Data on V2X

Company Release – 
8/9/2022

Important Note: On July 5, 2022, Vectrus, Inc. closed on the
merger with The Vertex Company (“the Transaction”) and in connection
with the closing was renamed V2X, Inc. “Reported results” reflect the
contributions of Vectrus, Inc. based on results prior to the close of the
Transaction, unless otherwise noted.

Vectrus Second Quarter Highlights:

  • Second quarter revenues of $498 million, up +6% Y/Y
  • Operating income (inclusive of V2X transaction expenses) of $15.0 million with a margin of 3.0%
  • Adjusted EBITDA1 of $24.7 million with a margin of 5.0%
  • Second quarter fully diluted EPS of $0.88; Adjusted diluted EPS1 of $1.41
  • Strong second quarter operating cash flow of $46 million

Guidance:

  • The V2X merger closed on July 5, 2022, creating a more diversified company generating approximately $3.6 billion in combined pro forma annual revenue
  • Establishing second-half 2022 guidance for V2X that reflects the contributions of both Vectrus and Vertex with a total revenue range of $1.90 to $1.94 billion, an Adjusted EBITDA1 range of $140 to $150 million, and an operating cash flow range of $130 to $150 million

MCLEAN, Va., Aug. 9, 2022 /PRNewswire/ — V2X, Inc. (NYSE:VVX) announced second quarter 2022 financial results. The second quarter 2022 results are based on Vectrus’ stand-alone financial metrics for the period ended July 1, 2022, and do not include contribution from The Vertex Company.

V2X (PRNewsfoto/V2X, Inc.)

Transaction
Update

“We’re excited to announce the successful combination of Vectrus and The Vertex Company, creating a larger, higher margin and more diversified, V2X,” said Chuck Prow, Chief Executive Officer of V2X.  “With 14,000 employees, $3.6 billion in pro forma annual revenue, and $290 million of Adjusted EBITDA, V2X is a leader in the operational segment of the federal services market providing converged solutions throughout the mission lifecycle of our clients most critical and enduring global missions.”

Prow continued, “V2X has a strong financial profile with significant free cash flow and long-term revenue visibility through several notable contract wins that are in the early stages of their lifecycle. These wins are reflected in the company’s trailing twelve-month awards of approximately $6 billion, which include two recent significant awards at Vertex, the Naval Test Wing Atlantic, a seven-year program valued at $850 million, and the Air Force Global Strike Command five-year contract valued at $130 million. This also includes $600 million of awards booked at Vectrus during the quarter that were driven by expansion and increased scope on existing programs as well as follow-on contracts. The strong velocity of awards has resulted in a significant backlog of approximately $12 billion that provides solid visibility over the next several years.”

“In summary, the financial and strategic attributes of V2X are compelling,” added Prow. “Our integration activities are well underway and the commitment to our clients, the missions we are privileged to support, and delivering results remains our focus.”

Vectrus
Second Quarter Results

“Second quarter results for stand-alone Vectrus were strong, propelled by top-line performance and favorable operating cash flow,” said Prow.  “During the quarter, revenue grew 6% year-over-year and 9% sequentially to $498 million. Revenue growth was driven by building on the momentum of programs in INDOPACOM and Europe, along with successful phase-in of new contracts, including the Logistics Readiness Center at Fort Benning,” said Prow.  “Each day, our global team of dedicated employees execute on our core programs while also bringing innovation and technology-oriented solutions to complex challenges throughout the mission lifecycle.”  

“With a high-level readiness to meet the needs of our clients, the team continued its support of several important missions during the quarter, including providing the DoD with urgent and compelling services for the European Deterrence Initiative,” said Prow. “We leveraged our rapid response capability and over 40-year history of operating in Europe to provide the DoD with unique services in support of this complex and ongoing mission. Additionally, achieving full operational capability on LOGCAP V Kwajalein, approximately a month and a half ahead of schedule, has helped to expand our footprint in the INDOPACOM region. Activity in the region remains robust and our position continues to expand. For example, we recently expanded our scope of responsibilities at Subic Bay in the Philippines.  This program is expected to run over the next eight years and provides strategic logistics services to the DoD.  Work content in the INDOPACOM region now represents 9% of total revenue, up 3% from last year, and positions us well to support the DoD in a full range of operations over the next ten years.”

“Adjusted EBITDA for the quarter was strong at $24.7 million or 5.0% margin.  Adjusted EBITDA increased sequentially $6.5 million and was driven by higher revenue volume and success on operational excellence initiatives.  We remain focused on margin improvement, and this quarter’s results reflect our ability to expand earnings even as we execute on several programs in the early phases of period of performance. As we have noted in the past, LOGCAP V is generating higher revenue volume with a greater amount of material and pass-through content that has a different margin complexion. However, our teams are focused on driving program efficiencies and improving margin rates through contract add-on work while working with clients to convert certain components of work to more advantageous contract structures.”

Prow concluded, “Our second quarter results demonstrate the Company’s success in achieving top-line growth through increased work scope on existing programs, expansion of capabilities, broadening our geographic footprint, and adding new clients.  As we embark on the Company’s new chapter as V2X, I am excited about the greater scale, market leadership, and enhanced portfolio of offerings with the Vectrus/Vertex combination.”

Second quarter 2022 revenue of $498.1 million was up $27.2 million year on year.  “Revenue grew 6% year-over-year, driven by our transition to full operational capability on LOGCAP V programs in Iraq and Kuwait late last year, and INDOPACOM this year. In addition, revenue benefitted from transitioning Fort Benning and volume associated with rapid response and contingency efforts,” said Susan Lynch, Senior Vice President and Chief Financial Officer. “This revenue growth demonstrates achievement of our enterprise goal of growing the business through contract expansion and portfolio diversity despite the headwinds associated with the withdrawal of the US military from Afghanistan,” added Lynch. 

Operating income was $15.0 million or 3.0% margin.  This includes M&A and integration related expenses of $5.9 million and amortization of acquired intangible assets of $2.1 million which were incurred in the quarter.  Adjusted operating income1 was $23.0 million or 4.6% margin, increasing sequentially by $6.4 million and 100 basis points.  Adjusted EBITDA1 was $24.7 million or 5.0% margin, increasing sequentially by $6.5 million and 100 basis points.  Adjusted EBITDA margin compares to $26.6 million or 5.6% in the prior year period. “The year-on-year margin change was influenced by the significant amount of revenue and contracts that are in the early stages of their lifecycle.  In aggregate, on average and over time, we expect to see improvement in the margin profile as we drive operational efficiencies and diversify into higher margin scopes of work,” said Lynch.

Fully diluted EPS for the second quarter of 2022 was $0.88 as compared to $1.35 in the prior year.  Fully diluted EPS in the quarter included the aforementioned M&A and integration related costs.  Adjusted diluted EPS1 was $1.41 in the quarter as compared to $1.52 in the prior year. The year-on-year change in Adjusted diluted EPS1 was primarily due to the above-mentioned change in Adjusted EBITDA1.

Cash generated from operating activities for the quarter was $46.0 million.  Through July 1, 2022, net cash from operating activities was $19.6 million, compared to net cash from operating activities of $14.0 million through the second quarter of 2021. Cash from operating activities through the first half of 2022 was negatively impacted by an approximately $8.0 million repayment of CARES Act tax deferrals and $5.8 million of merger-related payments.

Net debt on July 1, 2022, was $58.4 million, compared to $105.2 million on July 2, 2021.  Total debt on July 1, 2022, was $90.2 million, down $84.8 million from $175.0 million on July 2, 2021. Cash at quarter-end was $35.1 million.  Total consolidated indebtedness to consolidated EBITDA1 (total leverage ratio) was 1.09x compared to 1.76x at the same time last year.

Total backlog as of July 1, 2022, was $4.6 billion.  Funded backlog was $1.3 billion. 

V2X
Guidance

Lynch continued, “We are establishing second half 2022 guidance ranges for V2X, which includes the contribution from both Vectrus and The Vertex Company.”

V2X guidance for the second half (2H) 2022 is as follows:

$
millions, except for EBITDA margins and per share amounts

V2X 2H 2022 Guidance

Revenue

$1,900

to

$1,940

Adjusted EBITDA1

$140

to

$150

Adjusted Diluted Earnings Per Share 1

$1.94

to

$2.19

Net Cash Provided by Operating Activities

$130

to

$150

Forward-looking statements are based upon current expectations and are subject to factors that could cause actual results to differ materially from those suggested here, including those factors set forth in the Safe Harbor Statement below. 

Second Quarter 2022 Conference Call

Management will conduct a conference call with analysts and investors at 4:30 p.m. ET on Tuesday, August 9, 2022. U.S.-based participants may dial in to the conference call at 877-242-2259, while international participants may dial 416-981-9017. A live webcast of the conference call as well as an accompanying slide presentation will be available on the Vectrus Investor Relations website at https://app.webinar.net/P4Qe37VDnop.

A replay of the conference call will be posted on the V2X website shortly after completion of the call and will be available for one year. A telephonic replay will also be available through August 23, 2022, at 844-512-2921 (domestic) or 412-317-6671 (international) with passcode 22020062.    

Footnotes:

1 See “Key Performance Indicators and Non-GAAP Financial Measures” for descriptions and reconciliations.

About V2X

V2X is a leading provider of critical mission solutions and support to defense clients globally, formed by the 2022 merger of Vectrus and The Vertex Company to build on more than 120 combined years of successful mission support. The Company delivers a comprehensive suite of integrated solutions across the operations and logistics, aerospace, training and technology markets to national security, defense, civilian and international clients. Our global team of approximately 14,000 employees brings innovation to every point in the mission lifecycle, from preparation, to operations, to sustainment, as it tackles the most complex challenges with agility, grit, and dedication.

Safe Harbor Statement

Safe Harbor Statement under the Private Securities Litigation Reform Act of 1995 (the “Act”): Certain material presented herein includes forward-looking statements intended to qualify for the safe harbor from liability established by the Act. These forward-looking statements include, but are not limited to, all the statements and items listed in the table in “2022 Guidance” above and other assumptions contained therein for purposes of such guidance, other statements about our 2021 performance outlook, five-year growth plan, revenue, DSO, contract opportunities, the potential impact of COVID-19, and any discussion of future operating or financial performance.

Forward-looking statements generally can be identified by the use of forward-looking terminology such as “may,” “will,” “expect,” “intend,” “estimate,” “anticipate,” “believe,” “could,” “potential,” “continue” or similar terminology. These statements are based on the beliefs and assumptions of the management of the Company based on information currently available to management.

These forward-looking statements are not guarantees of future performance, conditions, or results, and involve a number of known and unknown risks, uncertainties, assumptions, and other important factors, many of which are outside our management’s control, that could cause actual results to differ materially from the results discussed in the forward-looking statements.  In addition, forward-looking statements are subject to certain risks and uncertainties that could cause actual results to differ materially from the Company’s historical experience and our present expectations or projections. For a discussion of some of the risks and important factors that could cause actual results to differ from such forward-looking statements, see the risks and other factors detailed from time to time our Annual Report on Form 10-K, Quarterly Reports on Form 10-Q, and other filings with the U.S. Securities and Exchange Commission.

We undertake no obligation to update any forward-looking statements, whether as a result of new information, future events or otherwise, except as required by law.

V2X, INC.
CONDENSED CONSOLIDATED STATEMENTS OF INCOME (UNAUDITED)

Three Months Ended

Six Months Ended

July 1,

July 2,

July 1,

July 2,

(In
thousands, except per share data)

2022

2021

2022

2021

Revenue

$      498,066

$             470,845

$         954,537

$         904,849

Cost of revenue

453,305

422,660

872,581

816,308

Selling, general, and administrative expenses

29,740

25,605

61,699

49,427

Operating income

15,021

22,580

20,257

39,114

Interest expense, net

(1,963)

(2,253)

(3,643)

(4,186)

Income from operations before income taxes

13,058

20,327

16,614

34,928

Income tax expense

2,586

4,393

3,287

6,946

Net income

$         10,472

$               15,934

$           13,327

$           27,982

Earnings per share

Basic

$           0.89

$                   1.36

$               1.13

$               2.40

Diluted

$           0.88

$                   1.35

$               1.12

$               2.37

Weighted average common shares
outstanding – basic

11,826

11,715

11,793

11,681

Weighted average common shares
outstanding – diluted

11,954

11,828

11,917

11,823


V2X, INC.
CONDENSED CONSOLIDATED BALANCE SHEETS (UNAUDITED)

July 1,

December 31,

(In
thousands, except per share information)

2022

2021

Assets

Current assets

Cash and cash equivalents

$                   31,760

$                   38,513

Restricted cash

3,311

__—_

Receivables

374,980

348,605

Prepaid expenses

26,262

21,160

Other current assets

10,646

15,062

Total current assets

446,959

423,340

Property, plant, and equipment, net

23,530

23,758

Goodwill

321,734

321,734

Intangible assets, net

62,159

66,582

Right-of-use assets

39,705

43,651

Other non-current assets

11,760

10,394

Total non-current assets

458,888

466,119

Total Assets

$                 905,847

$                 889,459

Liabilities and Shareholders’ Equity

Current liabilities

Accounts payable

$                 244,080

$                 212,533

Compensation and other employee benefits

82,534

80,284

Short-term debt

10,400

10,400

Other accrued liabilities

48,322

55,031

Total current liabilities

385,336

358,248

Long-term debt, net

78,884

94,246

Deferred tax liability

32,489

32,214

Operating lease liability

30,719

34,536

Other non-current liabilities

14,941

20,128

Total non-current liabilities

157,033

181,124

Total liabilities

542,369

539,372

Commitments and contingencies (Note 9)

Shareholders’ Equity

Preferred stock; $0.01 par value; 10,000,000
shares authorized; No shares issued and outstanding

Common stock; $0.01 par value; 100,000 shares
authorized; 11,846 and 11,738 shares issued and
outstanding as of July 1, 2022, and December 31,
2021, respectively                                      

118

117

Additional paid in capital

91,464

88,116

Retained earnings

281,081

267,754

Accumulated other comprehensive loss

(9,185)

(5,900)

Total shareholders’ equity

363,478

350,087

Total Liabilities and Shareholders’ Equity

$                 905,847

$                 889,459


V2X, INC.
CONDENSED CONSOLIDATED STATEMENTS OF CASH FLOWS (UNAUDITED)

Six Months Ended

July 1,

July 2,

(In
thousands)

2022

2021

Operating activities

Net income

$              13,327

$              27,982

Adjustments to reconcile net income to net cash provided by
operating activities:

Depreciation expense

3,238

3,097

Amortization of intangible assets

4,423

4,891

(Gain) Loss on disposal of property, plant, and equipment

(15)

60

Stock-based compensation

4,725

4,923

Amortization of debt issuance costs

388

463

Changes in assets and liabilities:

Receivables

(29,302)

(38,882)

Prepaid expenses

(5,321)

(4,660)

Other assets

5,185

597

Accounts payable

32,470

18,784

Deferred taxes

370

Compensation and other employee benefits

2,507

11,285

Other liabilities

(11,989)

(14,884)

Net cash provided by operating activities

19,636

14,026

Investing activities

Purchases of capital assets

(3,492)

(4,833)

Proceeds from the disposition of assets

18

16

Business acquisition purchase price adjustment

262

Contribution to joint venture

(2,113)

(1,846)

Net cash used in investing activities

(5,587)

(6,401)

Financing activities

Repayments of long-term debt

(5,200)

(4,000)

Proceeds from revolver

392,000

215,000

Repayments of revolver

(402,000)

(215,000)

Proceeds from exercise of stock options

370

113

Payment of debt issuance costs

(458)

(17)

Payments of employee withholding taxes on share-based
compensation

(1,696)

(2,272)

Net cash used in financing activities

(16,984)

(6,176)

Exchange rate effect on cash

(507)

(373)

Net change in cash, cash equivalents and restricted cash

(3,442)

1,076

Cash, cash equivalents and restricted cash – beginning of year

38,513

68,727

Cash, cash equivalents and restricted cash – end of period

$              35,071

$              69,803

Supplemental disclosure of cash flow information:

Interest paid

$                3,409

$                3,111

Income taxes paid

$                6,112

$                5,747

Purchase of capital assets on account

$                    13

$                   618

Key Performance Indicators and Non-GAAP Measures

The primary financial performance measures we use to manage our business and monitor results of operations are revenue trends and operating income trends. Management believes that these financial performance measures are the primary drivers for our earnings and net cash from operating activities. Management evaluates its contracts and business performance by focusing on revenue, operating income, and operating margin. Operating income represents revenue less both cost of revenue and selling, general and administrative (SG&A) expenses. Cost of revenue consists of labor, subcontracting costs, materials, and an allocation of indirect costs, which includes service center transaction costs. SG&A expenses consist of indirect labor costs (including wages and salaries for executives and administrative personnel), bid and proposal expenses and other general and administrative expenses not allocated to cost of revenue. We define operating margin as operating income divided by revenue.

We manage the nature and amount of costs at the program level, which forms the basis for estimating our total costs and profitability. This is consistent with our approach for managing our business, which begins with management’s assessing the bidding opportunity for each contract and then managing contract profitability throughout the performance period.

In addition to the key performance measures discussed above, we consider adjusted operating income, adjusted operating margin, adjusted net income, adjusted diluted earnings per share, EBITDA, adjusted EBITDA, EBITDA margin, adjusted EBITDA margin, and organic revenue to be useful to management and investors in evaluating our operating performance, and to provide a tool for evaluating our ongoing operations. This information can assist investors in assessing our financial performance and measures our ability to generate capital for deployment among competing strategic alternatives and initiatives. We provide this information to our investors in our earnings releases, presentations, and other disclosures.

Adjusted operating income, adjusted operating margin, adjusted net income, adjusted diluted earnings per share, EBITDA, adjusted EBITDA, EBITDA margin, adjusted EBITDA margin, and organic revenue, however, are not measures of financial performance under GAAP and should not be considered a substitute for operating income, operating margin, net income, and diluted earnings per share as determined in accordance with GAAP.  Definitions and reconciliations of these items are provided below.

  • Adjusted
    operating income
     is defined as operating income, adjusted to exclude items that may include, but are not limited to significant charges or credits, and unusual and infrequent non-operating items, such as M&A, integration and related costs, LOGCAP V pre-operational legal costs, and amortization of acquired intangible assets that impact current results but are not related to our ongoing operations.
  • Adjusted
    operating margin
     is defined as adjusted operating income divided by revenue.
  • Adjusted
    net income
     is defined as net income, adjusted to exclude items that may include, but are not limited to, significant charges or credits, and unusual and infrequent non-operating items, such as M&A, integration and related costs, LOGCAP V pre-operational legal costs, and amortization of acquired intangible assets that impact current results but are not related to our ongoing operations.
  • Adjusted
    diluted earnings per share
     is defined as adjusted net income divided by the weighted average diluted common shares outstanding.
  • EBITDA is defined as operating income, adjusted to exclude depreciation and amortization.
  • Adjusted
    EBITDA
     is defined as EBITDA, adjusted to exclude items that may include, but are not limited to, significant charges or credits and unusual and infrequent non-operating items, such as M&A, integration and related costs, LOGCAP V pre-operational legal costs that impact current results but are not related to our ongoing operations.
  • EBITDA
    margin
     is defined as EBITDA divided by revenue.
  • Adjusted
    EBITDA margin
     is defined as Adjusted EBITDA divided by revenue.


Adjusted Net Income, Adjusted Diluted Earnings Per
Share (Non-GAAP Measures)

($K,
except per share data)

Three Months
Ended July
01, 2022 As
Reported

M&A,
Integration

and Related
Costs

LOGCAP V
Pre-

Operational

Legal Costs

Amortization
of Acquired
Intangible

Assets

Three
Months

Ended July
01, 2022 –
Adjusted

Revenue

$       498,066

$                      —

$                     —

$                     —

$       498,066

Growth

5.8 %

5.8 %

Operating income

$         15,021

$                5,879

$                     —

$          2,122

$         23,022

Operating margin

3.0 %

4.6 %

Interest expense, net

$          (1,963)

$                      —

$                     —

$                     —

$          (1,963)

Income from operations before income taxes

$            13,058

$                5,879

$                     —

$               2,122

$         21,059

Income tax expense

$               2,586

$                1,164

$                     —

$                  420

$           4,170

Income tax rate

19.8 %

19.8 %

Net income

$            10,472

$                4,715

$                     —

$               1,702

$         16,889

Weighted average common shares outstanding, diluted

11,954

11,954

Diluted earnings per share

$              0.88

$                  0.39

$                     —

$                 0.14

$             1.41

EBITDA (Non-GAAP Measures)

($K)

Three Months
Ended July
01, 2022 As
Reported

M&A,
Integration

and Related
Costs

LOGCAP V
Pre-

Operational

Legal Costs

Amortization
of Acquired
Intangible

Assets

Three
Months

Ended July
01, 2022 –
Adjusted

Operating Income

$         15,021

$                5,879

$                     —

$               2,122

$         23,022

Add:

Depreciation and amortization

$        3,769

$                      —

$                     —

$               (2,122)

$           1,647

EBITDA

$         18,790

$                5,879

$                     —

$                     —

$         24,669

EBITDA Margin

3.8 %

5.0 %


Adjusted Net Income, Adjusted Diluted Earnings Per
Share (Non-GAAP Measures)

($K,
except per share data)

Three Months
Ended July
02, 2021 As
Reported

M&A,
Integration

and Related
Costs

LOGCAP V
Pre-

Operational

Legal Costs

Amortization
of Acquired
Intangible Assets

Three Months
Ended July
02, 2021 –
Adjusted

Revenue

$       470,845

$                     —

$                     —

$                     —

$       470,845

Operating income

$      22,580

$                     —

$                   21

$               2,436

$         25,037

Operating margin

4.8 %

5.3 %

Interest expense, net

$          (2,253)

$                     —

$                     —

$                     —

$          (2,253)

Income from operations before income taxes

$         20,327

$                     —

$                   21

$               2,436

$         22,784

Income tax expense

$            4,393

$                     —

$                     4

$                   463

$           4,860

Income tax rate

21.6 %

21.3 %

Net income

$         15,934

$                     —

$                   17

$               1,973

$         17,924

Weighted average common shares outstanding, diluted

11,828

11,828

Diluted earnings per share

$              1.35

$                     —

$                 0.00

$                 0.17

$              1.52

EBITDA (Non-GAAP Measures)

($K)

Three Months
Ended July
02, 2021 As
Reported

M&A,
Integration

and

Related Costs

LOGCAP V
Pre-

Operational

Legal Costs

Amortization
of Acquired
Intangible Assets

Three Months
Ended July
02, 2021 –
Adjusted

Operating Income

$         22,580

$                     —

$                   21

$               2,436

$         25,037

Add:

Depreciation and amortization

$            3,991

$                     —

$                     —

$            (2,436)

$           1,555

EBITDA

$         26,571

$                     —

$                   21

$                     —

$         26,592

EBITDA Margin

5.6 %

5.6 %


Adjusted Net Income, Adjusted Diluted Earnings Per
Share (Non-GAAP Measures)

($K,
except per share data)

Six Months
Ended July
01, 2022 As
Reported

M&A,
Integration and
Related Costs

LOGCAP V
Pre-

Operational

Legal Costs

Amortization
of Acquired
Intangible Assets

Six Months
Ended July
01, 2022 –
Adjusted

Revenue

$       954,537

$                     —

$                     —

$                     —

$      954,537

Growth

5.5 %

5.5 %

Operating income

$         20,257

$             14,947

$                   —

$               4,423

$        39,627

Operating margin

2.1 %

4.2 %

Interest expense, net

$          (3,643)

$                     —

$                     —

$                     —

$         (3,643)

Income from operations before income taxes

$         16,614

$             14,947

$                   —

$               4,423

$        35,984

Income tax expense

$            3,287

$               2,957

$                     —

$                    875

$          7,119

Income tax rate

19.8 %

19.8 %

Net income

$              13,327

$             11,990

$                   —

$               3,548

$        28,865

Weighted average common shares outstanding, diluted

11,917

11,917

Diluted earnings per share

$              1.12

$                 1.01

$                 —

$                 0.30

$             2.42

EBITDA (Non-GAAP Measures)

($K)

Six Months
Ended July
01, 2022 As
Reported

M&A,
Integration and
Related Costs

LOGCAP V
Pre-

Operational

Legal Costs

Amortization
of Acquired
Intangible Assets

Six Months
Ended July
01, 2022 –
Adjusted

Operating Income

$         20,257

$             14,947

$                   —

$               4,423

$        39,627

Add:

Depreciation and amortization

$            7,661

$                     —

$                     —

$                (4,423)

$            3,238

EBITDA

$         27,918

$             14,947

$                   —

$                     —

$        42,865

EBITDA Margin

2.9 %

4.5 %


Adjusted Net Income, Adjusted Diluted Earnings Per
Share (Non-GAAP Measures)

($K,
except per share data)

Six Months
Ended July
02, 2021 As
Reported

M&A,
Integration and
Related Costs

LOGCAP V
Pre-

Operational

Legal Costs

Amortization
of Acquired
Intangible Assets

Six Months
Ended July
02, 2021 –
Adjusted

Revenue

$      904,849

$                    —

$                    —

$                    —

$      904,849

Operating income

$        39,114

$                     —

$                 178

$              4,891

$        44,183

Operating margin

4.3 %

4.9 %

Interest expense, net

$         (4,186)

$                    —

$                    —

$                    —

$         (4,186)

Income from operations before income taxes

$        34,928

$                     —

$                 178

$              4,891

$        39,997

Income tax expense

$          6,946

$                     —

$                   34

$                 929

$          7,909

Income tax rate

19.9 %

19.9 %

Net income

$        27,982

$                     —

$                 144

$              3,962

$        32,088

Weighted average common shares outstanding, diluted

11,823

11,823

Diluted earnings per share

$             2.37

$                     —

$                0.01

$                0.33

$             2.71

EBITDA (Non-GAAP Measures)

($K)

Six Months
Ended July
02, 2021 As
Reported

M&A,
Integration and
Related Costs

LOGCAP V
Pre-

Operational

Legal Costs

Amortization
of Acquired
Intangible Assets

Six Months
Ended July
02, 2021 –
Adjusted

Operating Income

$        39,114

$                     —

$                 178

$              4,891

$        44,183

Add:

Depreciation and amortization

$          7,988

$                    —

$                    —

$           (4,891)

$          3,097

EBITDA

$        47,102

$                     —

$                 178

$                    —

$        47,280

EBITDA Margin

5.2 %

5.2 %


SUPPLEMENTAL INFORMATION

Revenue by client branch, contract type, contract relationship, and geographic region for the periods presented below was as follows: 

Revenue
by Client

Three Months Ended

Six Months Ended

July 1,

July 2,

July 1,

July 2,

(In
thousands)

2022

%

2021

%

2022

%

2021

%

Army

$    326,756

65 %

$    310,638

66 %

$     606,869

63 %

$      567,987

63 %

Air Force

68,457

14 %

63,206

13 %

129,930

14 %

141,375

16 %

Navy

64,885

13 %

56,399

12 %

140,102

15 %

112,827

12 %

Other

37,968

8 %

40,602

9 %

77,636

8 %

82,660

9 %

Total revenue

$    498,066

$    470,845

$     954,537

$      904,849

Revenue
by Contract Type

Three Months Ended

Six Months Ended

July 1,

July 2,

July 1,

July 2,

(In
thousands)

2022

%

2021

%

2022

%

2021

%

Cost-plus and cost-reimbursable

$    355,559

71 %

$    344,189

73 %

$     666,653

70 %

$      634,420

70 %

Firm-fixed-price

128,348

26 %

111,416

24 %

256,352

27 %

240,173

27 %

Time and material

14,159

3 %

15,240

3 %

31,532

3 %

30,256

3 %

Total revenue

$    498,066

$    470,845

$     954,537

$      904,849

Revenue
by Contract Relationship

Three Months Ended

Six Months Ended

July 1,

July 2,

July 1,

July 2,

(In
thousands)

2022

%

2021

%

2022

%

2021

%

Prime contractor

$    468,453

94 %

$    440,040

93 %

$     895,546

94 %

$      843,303

93 %

Subcontractor

29,613

6 %

30,805

7 %

58,991

6 %

61,546

7 %

Total revenue

$    498,066

$    470,845

$     954,537

$      904,849

Revenue
by Geographic Region

Three Months Ended

Six Months Ended

July 1,

July 2,

July 1,

July 2,

(In
thousands)

2022

%

2021

%

2022

%

2021

%

Middle East

$    250,222

50 %

$    258,488

55 %

$     485,313

51 %

$      498,500

55 %

United States

158,719

32 %

146,549

31 %

325,454

34 %

296,362

33 %

Europe

42,739

9 %

36,084

8 %

81,178

8 %

76,706

8 %

Asia

46,386

9 %

29,724

6 %

62,592

7 %

33,281

4 %

Total revenue

$    498,066

$    470,845

$     954,537

$      904,849

CONTACT: 
V2X, Inc. 
Mike Smith, CFA
719-637-5773


Should Medical Cannabis Patients be Forbidden from Owning Firearms?


Image Credit: Raymond Clark (Flickr)


The DOJ’s Case Against Allowing Medical Marijuana Users from Purchasing a Gun

Is it  “dangerous to trust regular marijuana users to exercise sound judgment” with firearms? The Department of Justice responded to a lawsuit asking the court to dismiss a medical marijuana lawsuit on Monday (August 7). The suit was filed by an agriculture official in Florida. The circumstances involved patients using cannabis; it claims that the federal government is unconstitutionally depriving them of their Second Amendment right to purchase and possess firearms. The DOJ asked a federal court to dismiss the lawsuit claiming it seeks to overturn policy involving medical marijuana users and their inability to own firearms.

The suit was filed by Agriculture and Consumer Services Commissioner Nikki Fried (D), who is a candidate in Florida for governor. It made a unique legal argument that a congressional spending rider prevents the use of Justice Department funds to interfere in the implementation of medical marijuana programs.

Presently, in order to buy a gun, citizens are required to fill out a federal form that explicitly asks about the use of (federally) illegal drugs. Applicants that use cannabis, which is legal for medical use in Florida, are not allowed to purchase a gun and could face up to five years in prison if they lie on the application.

This case has national implications and is of interest not just to those that benefit from medical cannabis but also to investors in medical marijuana.


Components of the Case

The suit alleges a federal rule that bars medical marijuana patients from having guns is unconstitutional.

In its motion to dismiss the case or secure a favorable judgment, the U.S. DOJ claimed that the policies being challenged by the lawsuit only apply to people who use illegal drugs, in this case, cannabis. Therefore, Second Amendment rights of law-abiding citizens are not barred.

“These laws merely prevent drug users who commit federal crimes by unlawfully possessing drugs from possessing and receiving firearms, and only for so long as they are actively engaged in that criminal activity,” the DOJ brief to dismiss claimed.

The DOJ referenced Florida’s own medical consent form accepted by Florida marijuana regulators; the DOJ noted that it warns, that marijuana “impairs judgment, cognition and physical coordination, including ‘the ability to think, judge and reason.'” The DOJ added that there was a deeply rooted practice in American law and policy of not allowing dangerous or lawbreaking individuals to possess firearms.

“A long tradition exists of viewing intoxication as a condition that renders firearms possession dangerous, and accordingly restricting the firearms rights of those who become intoxicated,” the brief said.

In the complaint, filed April 20, 2022, the plaintiffs claim the central question in the case is whether the physical and/or psychological effects of medical marijuana render users “sufficiently dangerous or violent” so that possession or use of a firearm would cause concern.

They further referenced a study that demonstrated that medical marijuana has no such effect. The plaintiffs referenced the 2013, Office of National Drug Control Policy study that concluded there was “little support for a contemporaneous, causal relationship between the use of marijuana ‘and either violent or property crime.'”

In its Monday brief, the DOJ countered that “marijuana users with firearms pose a danger comparable to, if not greater than, other groups that have historically been disarmed,” in part because cannabis remains federally illegal.

The government argued further that Nicole Fried, the state Department of Agriculture and Consumer Services commissioner who brought the lawsuit, had no standing to bring the action since she did not allege her right to possess firearms had been infringed.

The DOJ is seeking the dismissal of all claims.

The case is Fried et al. v. Garland et al., case number 4:22-cv-00164, in the U.S. District Court for the Northern District of Florida.


Take Away

It is presumed by many that marijuana for medical use and study will at some point be
dropped as a schedule 1 drug. Despite a number of bills in the house and the Senate that, if passed and signed into law, would accomplish reclassification, to date, marijuana is still illegal on a federal level.

The status is complicated by the fact that 37 of the 50 states allow medical use for qualified individuals. The case filed by Florida’s Agricultural Secretary Fried attempts to still uphold second amendment rights to those approved for and using medical marijuana in Florida. The U.S. Department of Justice is opposed.

There is no indication whether a change in federal legal status would change, in the DOJ’s mind, the dangers of allowing firearm ownership to these patients.

Paul Hoffman

Managing Editor, Channelchek

Suggested Content


Senate Marijuana Bill Expected Before Summer Break


Lawmakers and Insider Trading Laws


Cannabis Vape Distribution Limited Under New Law


Evaluating Opportunity With the iPhone New Marijuana Policy


Sources

https://www.orlandosentinel.com/news/os-ne-prem-nikki-fried-medical-marijuana-20210611-dzil5daz7rfw7k7mjf6szxpo7y-story.html

https://www.marijuanamoment.net/florida-official-sues-biden-administration-over-gun-rights-for-medical-marijuana-patients-on-4-20/

https://www.law360.com/health/articles/1519290/doj-says-medical-pot-patients-have-no-right-to-bear-arms?copied=1

https://unicourt.com/case/pc-db5-fried-et-al-v-garland-et-al-1182072

https://www.dea.gov/sites/default/files/2020-06/Marijuana-Cannabis-2020_0.pdf

Stay up to date. Follow us:


Release – Eskay Mining Discovers a New VMS Center at Jeff North and Intercepts Polymetallic VMS Mineralization in Two Areas Along TV-Jeff Corridor


Eskay Mining Discovers a New VMS Center at Jeff North and Intercepts Polymetallic VMS Mineralization in Two Areas Along TV-Jeff Corridor

Research, News and Market Data on Eskay Mining

TORONTO, ON / ACCESSWIRE / August 9, 2022 / Eskay Mining Corp. (“Eskay” or the “Company”) (TSXV:ESK)(OTCQX:ESKYF)(Frankfurt:KN7) (WKN:A0YDPM) is pleased to announce discovery of a new volcanogenic massive sulfide (“VMS”) center at Jeff North as well as recent drill intercepts of polymetallic mineralization in two areas along the TV-Jeff corridor, part of its 100% controlled Consolidated Eskay project, British Columbia. As of this release, over 13,000m of diamond drilling has been undertaken in numerous drill holes along 3.7km of strike at TV-Jeff. Diamond drilling also continues at the Scarlet Ridge area, subject of a Company news release dated July 27, 2022. To date, the Company has completed approximately 15,600m of diamond core drilling, approximately 52% of the 30,000m planned to be completed in 2022. Drill production remains on target to reach this aggressive goal with four drills fully operational.

“As with the Scarlet Ridge-Tarn Lake VMS corridor, the TV-Jeff VMS corridor is proving itself to be another large VMS complex with sulfide mineralization focused along multiple syn-volcanic fault structures each closely associated with intense hydrothermal alteration of volcanic rocks”, commented Dr. John DeDecker, Eskay Mining’s VP of Exploration. “The discovery of Jeff North now extends the strike length of the known TV-Jeff VMS corridor to 3.7km. Importantly, recent drill holes completed in two areas have yielded intercepts of polymetallic sulfide mineralization with abundant chalcopyrite and sphalerite. Spot XRF readings taken from core indicates promising pathfinder element support including silver from this style of mineralization. Also encouraging, anomalous geochemical results recently received from soil samples collected at the very start of the 2022 exploration season indicate mineralization potentially extends another 2 km further north from Jeff North. We are optimistic that multiple other VMS targets we have recently identified along the TV-Jeff trend will prove mineralized, and we continue to grow confident about the potential for the Consolidated Eskay project to host an entire VMS district.”

Jeff North

Drilling at Jeff North targeted a large conductive SkyTEM anomaly coincident with a ridge of silicified peperitic basalt displaying strong Ag-in-soil anomalies from samples collected during the 2021 program. Strong VMS stockwork mineralization encountered in recent drilling at Jeff North lies 600m north of Jeff and extends at least 700m northwards along strike remaining open to the north. Some stockwork intervals are distinctly polymetallic displaying abundant sphalerite and chalcopyrite in addition to the ubiquitous pyrite. This mineralogy coupled with the presence of strong pathfinder elements including Ag, As, Sb, Cu, Zn, and Pb as detected by handheld XRF provide encouragement for presence of Au and Ag, both of which must be assayed for accurate measurement.Core is being logged, split and sampled in preparation for submittal for assaying.

Jeff North Drilling Highlights

  • At present, drilling at Jeff North has ceased and the focus has moved onto TV, the area between TV and Jeff (Figures 1 and 2), and Scarlet Ridge. This said, Eskay is prepared to follow up with drilling at Jeff North late-season should assays confirm this to be a significant new discovery.
  • Jeff North represents a new VMS discovery beginning 600m north of Jeff and extending at least 700m northwards. Sulfide mineralization is hosted by intensely silicified peperitic basalt and andesite flows (Figures 3 and 4). Mineralization remains open to the north as well as down-dip.
  • J22-118 intercepted a 12.7m interval of polymetallic sulfide mineralization hosted within a silica-rich hydrothermal breccia and surrounding silicified mudstone (Figures 5 and 6). Sulfide mineralization includes abundant chalcopyrite and sphalerite. The presence of chalcopyrite with intense silicification suggests the proximity to a higher temperature VMS feeder zone than those encountered at TV and Jeff.
  • Handheld XRF analyses of sulfide mineralization in several drill holes from Jeff North show high concentrations of the pathfinder elements Ag, As, Sb, Cu, Zn, and Pb.
  • Early results from the 2022 soil sampling program show Ag and Hg anomalism extends 2km further north than hole J22-99 (Figure 9), the northernmost drill hole completed at Jeff North. Given that the Jeff North target was recognized as a SkyTEM conductivity high with an accompanying soil geochemical anomaly, Eskay’s exploration team is optimistic that the Jeff North VMS system extends further northward. Soil sampling over a large SkyTEM conductive high approximately 1.8km north of Jeff North is currently underway.
  • J22-122 intercepted a 9.0 m interval of polymetallic sulfide mineralization hosted by intensely silicified andesitic peperite and associated mudstone (Figures 7 and 8). Polymetallic mineralization in both J22-118 and J22-122 occur at an equivalent horizon to the lower stockwork zone at Jeff 125 m south of J22-122.

Commencement of Drilling at TV

  • Drilling has commenced at TV focusing on expanding upon the core body of mineralization identified in 2021 drilling. Planned drill holes will test extensions of TV mineralization further down-dip, along strike to the north and south, and up stratigraphic section.
  • Testing of nearby IP-resistivity and SkyTEM targets is also scheduled. Based on past success of targeting VMS mineralization using SkyTEM and soil data at Jeff North, Jeff, and TV, the Eskay team is optimistic that a cluster of SkyTEM conductivity highs surrounding TV will lead to discovery of additional VMS mineralization.
  • The first 2022 drill hole at TV, TV22-84, intercepted approximately 40m of stockwork sulfide mineralization 65m down-dip from TV21-54, a very promising indication the system remains open in this direction (Figures 10 and 11).

To date, Eskay Mining has completed approximately 15,600m of diamond core drilling, approximately 52% of the 30,000m planned for 2022. Thus far, drilling has occurred around the area called Jeff North, Scarlet Ridge and now, at TV. At present, four drills are fully operational and drill production is on track to reach Eskay’s aggressive goal of 30,000 m.

Dr. Quinton Hennigh, P. Geo., a Director of the Company and its technical adviser, a qualified person as defined by National Instrument 43-101, has reviewed and approved the technical contents of this news release.

About Eskay Mining Corp:

Eskay Mining Corp (TSX-V:ESK) is a TSX Venture Exchange listed company, headquartered in Toronto, Ontario. Eskay is an exploration company focused on the exploration and development of precious and base metals along the Eskay rift in a highly prolific region of northwest British Columbia known as the “Golden Triangle,” 70km northwest of Stewart, BC. The Company currently holds mineral tenures in this area comprised of 177 claims (52,600 hectares).

All material information on the Company may be found on its website at www.eskaymining.com and on SEDAR at www.sedar.com.

For further information, please contact:

Mac Balkam
President & Chief Executive Officer

T: 416 907 4020
E: 
Mac@eskaymining.com

Neither the
TSX Venture Exchange nor its Regulation Services Provider (as that term is
defined in the policies of the TSX Venture Exchange) accepts responsibility for
the adequacy or accuracy of this release.

Forward-Looking
Statements: This Press Release contains forward-looking statements that
involve risks and uncertainties, which may cause actual results to differ
materially from the statements made. When used in this document, the words
“may”, “would”, “could”, “will”, “intend”, “plan”, “anticipate”, “believe”,
“estimate”, “expect” and similar expressions are intended to identify
forward-looking statements. Such statements reflect our current views with
respect to future events and are subject to risks and uncertainties. Many
factors could cause our actual results to differ materially from the statements
made, including those factors discussed in filings made by us with the Canadian
securities regulatory authorities. Should one or more of these risks and
uncertainties, such as actual results of current exploration programs, the
general risks associated with the mining industry, the price of gold and other
metals, currency and interest rate fluctuations, increased competition and
general economic and market factors, occur or should assumptions underlying the
forward looking statements prove incorrect, actual results may vary materially
from those described herein as intended, planned, anticipated, or expected. We
do not intend and do not assume any obligation to update these forward-looking
statements, except as required by law. Shareholders are cautioned not to put
undue reliance on such forward-looking statements.


Full Press Release with appendix images available at
eskaymining.com


Release – Comstock Announces Second Quarter 2022 Results


Comstock Announces Second Quarter 2022 Results

Research, News, and Market Data on Comstock Mining

Cellulosic
Breakthrough Unlocks Massive New Feedstock Model for Net Zero Energy
Independence

VIRGINIA
CITY, NEVADA, AUGUST 9, 2022
 – Comstock Inc. (NYSE: LODE) (“Comstock” and the “Company”) today announced its recent business development highlights, second quarter 2022 results, and updated outlook.  

Selected Strategic Highlights – Cellulosic Fuels

  • Expanded our leading cellulosic fuels technology portfolio by filing for a new patent covering breakthrough pathways to produce Bioleum a renewable offset for petroleum and multiple drop-in renewable fuels from woody biomass.
  • Filed a preliminary application for a U.S. Department of Energy (“DOE”) grant opportunity for a pilot scale system to validate enhanced production metrics of purified bio-intermediaries and renewable fuels from woody biomass.
  • Received a notification of “encouragement” from the U.S. Department of Energy for this same grant opportunity.
  • Established strategic collaborations with leading industry partners, including feedstock and offtake relationships, for the development of renewable fuels, from woody biomass, at dramatically improved yield, efficiency, and cost.
  • Advanced the engineering and development of our cellulosic fuel demonstration facility.

Selected Strategic Highlights – Lithium Extraction
and Electrification Products

  • Commissioned our proprietarylithium-ion battery (“LIB”) pilot crushing, separation, and conditioning system.
  • Enhanced the design and commenced upgrades on our proprietary LIB pilot crushing and separation system.
  • Completed construction of our prototype lithium extraction system in our R&D facility and commenced testing.
  • Advanced permitting for our state-of-the-art battery metal recycling facility in Nevada.
  • Production of high-purity black mass to commence in our battery metal recycling facility by Q2 2023.
  • Production of battery grade lithium carbonate to commence in our battery metal recycling facility by Q3 2023.

Selected Financial Highlights

  • Total assets were $117,826,063 as of June 30, 2022, as compared to $115,119,393 at March 31, 2022.
  • Operating expenses were $5,896,617 for the second quarter 2022, including selling, general and administrative expenses of $2,508,573 and research and development expenses of $2,579,150, and depreciation of $808,894.
  • Second quarter 2022 net loss was $13,766,846 or $(0.20) per share, as compared to second quarter 2021 net loss of $6,320,992 or $(0.15) per share. The 2022 results were primarily driven by increases in research and development expenditures and changes in fair values of derivatives.
  • Advanced non-strategic asset monetization efforts with asset sales proceeds expected at $20 million. 
  • Debt was $4,572,356 on June 30, 2022, net of discount, representing an unsecured promissory note.
  • Cash and cash equivalents were $4,345,315 on June 30, 2022.
  • Outstanding common shares were 76,822,049 at June 30, 2022, and 78,737,632 at August 8, 2022.

“Our financial results reflect the impact of our continued investment in the research, development and commercialization of our renewable energy businesses,” said Corrado De Gasperis, Comstock’s executive chairman and chief executive officer. “The building and operating of these proprietary demonstration systems are critical prerequisites for full scale commercialization.”

Cellulosic Fuels

The Company recently announced a significant expansion of its leading cellulosic technology portfolio by filing for a new patent covering breakthrough pathways to produce renewable diesel, sustainable aviation fuel (“SAF”) gasoline and marine fuel from woody biomass, at dramatically improved yield, efficiency, and cost in comparison to all known methods.

Renewable fuels provide a critical opportunity for decarbonization, however, most of the existing U.S. renewable fuel refineries draw from the same limited pool of constrained feedstocks. Comstock’s plans to decarbonize with renewable fuels involves abundant feedstocks that are not used today, enabling a vast untapped energy source with superior benefits. 

“Our new patent covers processes and compositions that have been validated at our existing two ton per day cellulosic fuels pilot facility, verifying that we can simultaneously produce multiple purified biointermediates that are uniquely isolated and free of the contaminants that have frustrated prior attempts at commercializing cellulosic fuel technologies,” added De Gasperis.

Based on current data, Comstock projects best-in-class renewable yields exceeding 80 gallons per dry ton of woody biomass (on a gasoline gallon equivalent basis), with lifecycle greenhouse gas emissions reductions exceeding 80% over petroleum.

The Company is currently expanding its existing cellulosic demonstration systems to include the production of Bioleum™ and expects these demonstration systems to add to our existing capabilities for producing carbon-neutral pulps, cellulosic sugar and cellulosic ethanol.  The expansion into Bioleum™ will demonstrate the full capability of producing these bio-intermediaries suitable for the production of renewable diesel, marine, SAF and gasoline from woody biomass.

The Company recently submitted a preliminary grant application to the U.S. Department of Energy (“DOE”) entitled “Production of Renewable Diesel,
Sustainable Aviation Fuel, Gasoline, and Marine Fuel from Lignocellulosic
Biomass at Dramatically Improved Yield, Efficiency, and Cost” 
and received a DOE notification of encouragement to apply for this funding opportunity, reflecting positively on the Company technology readiness and the strength of its collaboration partners.

De Gasperis continued, “The existing U.S. biorefining capacity is far greater than current feedstocks can support, and the DOE clearly recognizes the need for expanded feedstocks. We believe that our expanded technology solutions, and the magnitude of feedstocks that they enable, unblock one of the most critical supply chain constraints across the U.S. and global markets.”

Electrification Products

The Company completed construction and initial commissioning of its breakthrough LIB crushing, separating, and conditioning process during the second quarter, successfully confirming the production of highly concentrated “black mass.”

“We have successfully developed a proprietary system that produces a novel and pure black mass, further positioning us for high efficiency metals extraction, starting with lithium,” said Mr. De Gasperis. “Our team is enhancing the pilot system for deployment in Nevada where we will ultimately integrate our black mass production and lithium extraction process in 2023.”  

The Company expects to receive its main operating permit during the fourth quarter of 2022 and complete the submission of its modified air quality permits for our LIB processes at our state-of-the-art, battery metal recycling facility in the third quarter.

“The cleaning and repairs of our facility in Nevada are near complete and truly look outstanding.  The facility can now be readied for the receipt and installations of pilot and demonstration units for crushing, separating and conditioning of our novel black mass and subsequently, our lithium extraction, while the permitting process continues” concluded Mr. De Gasperis.

Corporate

Cash and cash equivalents were $4,345,315 on June 30, 2022. The Company expects over $20 million in proceeds over the next two quarters from the sale of its non-mining properties, non-strategic investments, and collection of advances receivable, including the Daney Ranch for $2.5 million, net, and proceeds from Sierra Springs Opportunity Fund totaling over $18 million.

Conference Call Details

Comstock will host the conference call on Tuesday, August 9, 2022, at 1:15 p.m. PDT  (4:15 p.m. EDT) and the webcast will include a moderated question and answer session following the Company’s prepared remarks.  Please click the link below to register in advance and please join the event at least 10 minutes prior to the scheduled start time. Once registered, you will receive a confirmation email containing information about joining the Webcast. Please 
click here to register in advance.

About
Comstock

Comstock (NYSE: LODE) innovates technologies that contribute to global decarbonization and circularity by efficiently converting under-utilized natural resources into renewable fuels and electrification products that contribute to balancing global uses and emissions of carbon. The Company intends to achieve exponential growth and extraordinary financial, natural, and social gains by building, owning, and operating a fleet of advanced carbon neutral extraction and refining facilities, by selling an array of complimentary process solutions and related services, and by licensing selected technologies to qualified strategic partners. To learn more, please visit www.comstock.inc.

Forward-Looking
Statements 

This press release and any related calls or discussions may include forward-looking statements within the meaning of Section 27A of the Securities Act of 1933, as amended, and Section 21E of the Securities Exchange Act of 1934, as amended. All statements, other than statements of historical facts, are forward-looking statements. The words “believe,” “expect,” “anticipate,” “estimate,” “project,” “plan,” “should,” “intend,” “may,” “will,” “would,” “potential” and similar expressions identify forward-looking statements, but are not the exclusive means of doing so. Forward-looking statements include statements about matters such as: future industry market conditions; future explorations or acquisitions; future changes in our exploration activities; future changes in our research and development; and future prices and sales of, and demand for, our products and services. Except as may be required by securities or other law, we undertake no obligation to publicly update or revise any forward-looking statements, whether as a result of new information, future events, or otherwise.

Neither this press release nor any related call or discussion constitutes an offer to sell, the solicitation of an offer to buy or a recommendation with respect to any securities of the Company, the fund or any other issuer.

  Contact
information:


Comstock Mining Inc.
P.O. Box 1118
Virginia City, NV 89440
www.comstock.inc

Corrado De Gasperis
Executive Chairman & CEO
Tel (775) 847-4755
degasperis@comstockmining.com

Zach Spencer
Director of External Relations
Tel (775) 847-5272 Ext.151
questions@comstockmining.com