Two Ways Artificial Intelligence is Helping Cybersecurity


Image Credit: Tara Winstead (Pexels)


How AI is Shaping the Cybersecurity Arms Race


The average business receives 10,000 alerts every day from the various software tools it uses to monitor for intruders, malware and other threats. Cybersecurity staff often find themselves inundated with data they need to sort through to manage their cyber defenses.

The stakes are high. Cyberattacks are increasing and affect thousands of organizations and millions of people in the U.S. alone.

These challenges underscore the need for better ways to stem the tide of cyber-breaches. Artificial intelligence is particularly well suited to finding patterns in huge amounts of data. As a researcher who studies AI and cybersecurity, I find that AI is emerging as a much-needed tool in the cybersecurity toolkit.


This article was republished with permission from 
The Conversation, a news site dedicated to sharing ideas from academic experts. It represents the research-based findings and thoughts of 
Sagar Samtani, Assistant Professor of Operations and Decision Technologies, Indiana University.


Helping Humans

There are two main ways AI is bolstering cybersecurity. First, AI can help automate many tasks that a human analyst would often handle manually. These include automatically detecting unknown workstations, servers, code repositories and other hardware and software on a network. It can also determine how best to allocate security defenses. These are data-intensive tasks, and AI has the potential to sift through terabytes of data much more efficiently and effectively than a human could ever do.

Second, AI can help detect patterns within large quantities of data that human analysts can’t see. For example, AI could detect the key linguistic patterns of hackers posting emerging threats in the dark web and alert analysts.

More specifically, AI-enabled analytics can help discern the jargon and code words hackers develop to refer to their new tools, techniques and procedures. One example is using the name Mirai to mean botnet. Hackers developed the term to hide the botnet topic from law enforcement and cyberthreat intelligence professionals.

AI has already seen some early successes in cybersecurity. Increasingly, companies such as FireEye, Microsoft and Google are developing innovative AI approaches to detect malware, stymie phishing campaigns and monitor the spread of disinformation. One notable success is Microsoft’s Cyber Signals program that uses AI to analyze 24 trillion security signals, 40 nation-state groups and 140 hacker groups to produce cyberthreat intelligence for C-level executives.

Federal funding agencies such as the Department of Defense and the National Science Foundation recognize the potential of AI for cybersecurity and have invested tens of millions of dollars to develop advanced AI tools for extracting insights from data generated from the dark web and open-source software platforms such as GitHub, a global software development code repository where hackers, too, can share code.


Downsides of AI

Despite the significant benefits of AI for cybersecurity, cybersecurity professionals have questions and concerns about AI’s role. Companies might be thinking about replacing their human analysts with AI systems, but might be worried about how much they can trust automated systems. It’s also not clear whether and how the well-documented AI problems of bias, fairness, transparency and ethics will emerge in AI-based cybersecurity systems.

Also, AI is useful not only for cybersecurity professionals trying to turn the tide against cyberattacks, but also for malicious hackers. Attackers are using methods like reinforcement learning and generative adversarial networks, which generate new content or software based on limited examples, to produce new types of cyberattacks that can evade cyber defenses.

Just as AI can generate realistic-looking fake faces from photos of real people, the software can be used to create new forms of malware based on existing code.

Researchers and cybersecurity professionals are still learning all the ways malicious hackers are using AI.


The Road Ahead

Looking forward, there is significant room for growth for AI in cybersecurity. In particular, the predictions AI systems make based on the patterns they identify will help analysts respond to emerging threats. AI is an intriguing tool that could help stem the tide of cyberattacks and, with careful cultivation, could become a required tool for the next generation of cybersecurity professionals.

The current pace of innovation in AI, however, indicates that fully automated cyber battles between AI attackers and AI defenders is likely years away.


Suggested Reading


Zero-Trust Security: Assume Everyone and Everything on the Internet is Out to Get You


Edge Computing Importance to AI Applications


Robotics and AI Are Being Tapped by Cannabis Growers


The Various Ways to Allocate into “War Investments”


Stay up to date. Follow us:


Scheduled Speakers – NobleCon18

NobleCon18 Confirmed Speakers


REGISTER FREE AS AN INVESTOR  |  PRESENTING COMPANY INQUIRIES  |  NOBLECON18.COM


Bert Alfonso – CFO
Information Services (III)

Robert Archer – CEO and Director
Newrange Gold Corp. (NRGOF)

Douglas Bartole – President / CEO
InPlay Oil (IPOOF)

Michael Bondi – CFO
Comtech (CMTL)

Michael Borton – CFO
Flotek Industries (FTK)

Andrew Bowden – CEO
Item 9 Labs Corp. (INLB)

Brian Cantrell – SVP and CFO
Alliance Resource Partners, L.P. (ARLP)

Daniel Carcillo – CEO
Wesana Health Holdings Inc. (WSNAF)

John Carlesso – CEO
FenixOro Gold Corp. (FDVXF)

Mark Chalmers – President & CEO
Energy Fuels (UUUU)

Bradley Chhay – CFO
RCI Hospitality Holdings, Inc. (RICK)

Michael Connors – CEO
Information Services (III)

Lisa Conte – CEO
Jaguar Health (JAGX)

Robert Crane – CFO
Axcella Therapeutics (AXLA)

Gianni Del Signore – CFO
Pangaea Logistics (PANL)

Warren Duncan – CFO
Filament Health Corp. (FLHLF)

Justin Dye – CEO
Schwazze (SHWZ)

Stephen Ehrlich – CEO
Voyager Digital Ltd. (VYGVF)

Brian Evans – CFO
The GEO Group, Inc. (GEO)

Peter Gianulis – CEO
Allegiant Gold (AUXXF)

John Gibson – CEO
Flotek Industries (FTK)

Ryan Goepel – CFO
Global Crossing Airlines Inc. (JETMF)

Ilan Hadar – CEO
PainReform Ltd. (PRFX)

Arjan Haverhals – President & CEO
Milestone Scientific (MLSS)

Gerri Henwood – President & CEO
Baudax Bio, Inc. (BXRX)

Nancy Huber – CFO
Schwazze (SHWZ)

Kathryn JohnBull – CFO
DLH (DLHC)

Lauri Kearnes – CFO
Harte Hanks (HHS)

John Keeler – CEO
Blue Star Foods Corp. (BSFC)

David Kelley – CEO
Chakana Copper Corp (CHKKF)

Gust Kepler – CEO & Co-Founder
Blackboxstocks Inc. (BLBX)

Giorgi Khazaradze – CEO
Aurox

Eric Langan – CEO
RCI Hospitality Holdings, Inc. (RICK)

Seth Lederman, MD – Co-Founder, CEO & Chairman
Tonix Pharmaceuticals (TNPX)

Ben Lightburn – Co-Founder & CEO
Filament Health Corp. (FLHLF)

Brian Linscott – CEO
Harte Hanks (HHS)

Ken Londoner – CEO, Executive Chairman & Co-Founder
BioSig Technologies (BSGM)

Paul Manley – VP Investor Relations
Wrap Technologies, Inc. (WRAP)

Cary Marshall – VP, Corp Finance & Treasurer
Alliance Resource Partners, L.P. (ARLP)

James Martin – CFO & Corporate Secretary
Cocrystal Pharma Inc. (COCP)

Evan Masyr – CFO
Salem Media Group (SALM)

Margot M. Micallef – Founder & CEO
GABY Inc. (GABLF)

Tim Millage – CFO
Lee Enterprises, Inc. (LEE)

Kevin Mowbray – President / CEO / Director
Lee Enterprises, Inc. (LEE)

Shankar Musunuri, PhD – Founder, Chairman & CEO
Ocugen (OCGN)

Nir Naor – CFO
HMNC Holding GmbH

Chris Naprawa – President
TAAL Distributed Information Technologies (TAALF)

Robert Nistico – CEO
Splash Beverage Group, Inc. (SBEV)

Steve O’Laughlin – Principal Financial Officer
Actinium Pharmaceuticals (ATNM)

Christiana Papadopoulos – IR Mgr
Sierra Metals (SMTS)

Zachary Parker – President and CEO
DLH (DLHC)

Eric Pharis – COO
Blackboxstocks Inc. (BLBX)

Michael Porcelain – CEO
Comtech (CMTL)

Scott Powell – EVP Investor Relations
VolitionRx (VNRX)

Evan Psaropoulos – CFO
Voyager Digital Ltd. (VYGVF)

Peter Quigley – President & CEO
Kelly Services (KELYA)

Jeffrey I. Rassás – Chief Strategy Officer
Item 9 Labs Corp. (INLB)

Dave Rosa – CEO
Neuroone Medical Technologies Corp. (NMTC)

Stuart Rosenstein – CFO
Townsquare Media (TSQ)

Lena Russomagno – Associate Director of Operations
Tonix Pharmaceuticals (TNPX)

Corey Ruttan – CEO
Alvopetro Energy (ALVOF)

David Santrella – President, Broadcast Media
Salem Media Group (SALM)

Matt Singh – CCO
Psyched Wellness Ltd. (PSYCF)

Russell Skibsted – EVP, CFO & CBO
Rockwell Medical (RMTI)

Arthur Smith – CEO
Digerati Technologies, Inc. (DTGI)

Jeff Stevens – CEO
Psyched Wellness Ltd. (PSYCF)

Sanjay Subramanian – CFO
Ocugen (OCGN)

Marie Tedesco – CFO
Beasley Broadcast Group (BBGI)

Olivier Thirot – CFO
Kelly Services (KELYA)

Suresh Venkatachari – Chairman & CEO
Healthcare Triangle (HCTI)

William Willoughby – Director and CEO
Cypress Development Corp. (CYDVF)

Bill Wilson – CEO
Townsquare Media (TSQ)

Mark Wingertzahn – Chief Science Officer
Wesana Health Holdings Inc. (WSNAF)

Robert Winspear – CFO
Blackboxstocks Inc. (BLBX)

David Wolfin – President & CEO
Avino Silver & Gold (ASM)

Zhenyu Wu – CFO
Elite Education Group International Ltd. (EEIQ)

Chris Young – EVP, CFO & Treasurer
Entravision Communications (EVC)

Harte Hanks (HHS) – The Start Of A New Chapter

Monday, February 28, 2022

Harte Hanks (HHS)
The Start Of A New Chapter

Harte-Hanks is a marketing services company that provides multichannel marketing solutions as well as consulting, data analytics, and strategic assessment. The company’s offerings focus on business-to-business, retail, finance, and automotive segments through digital, social, mobile, and print media offerings. Harte-Hanks strives to develop better customer relationships through its marketing and analytical services for clients. The majority of its revenue is derived from its marketing services in the retail, technology, and consumer brand segments.

Michael Kupinski, Director of Research, Noble Capital Markets, Inc.

Refer to the full report for the price target, fundamental analysis, and rating.

    Revenue and cash flow beat. The company reported full year 2021 revenue of $194.6 million, compared with our estimate of $191.3 million, a solid 10% increase from the year earlier. Full year adj. EBITDA of $18 million beat our $17.1 million forecast by 5%, over 460% above the year earlier.

    Customer Care still rolling.  The Customer Care segment generated $19.2 million in revenue in Q4 compared with our upwardly revised estimate of $17.5 million. The segment’s robust quarter was driven by several new clients acquired during the period and continued Covid related, healthcare business …


This Company Sponsored Research is provided by Noble Capital Markets, Inc., a FINRA and S.E.C. registered broker-dealer (B/D).

*Analyst certification and important disclosures included in the full report. NOTE: investment decisions should not be based upon the content of this research summary.  Proper due diligence is required before making any investment decision. 

Gevo (GEVO) – Another Quarterly Loss But Year of Progress

Monday, February 28, 2022

Gevo (GEVO)
Another Quarterly Loss But Year of Progress

Gevo Inc is a renewable chemicals and biofuels company engaged in the development and commercialization of alternatives to petroleum-based products based on isobutanol produced from renewable feedstocks. Its operating segments are the Gevo segment and the Gevo Development/Agri-Energy segment. By its segments, it is involved in research and development activities related to the future production of isobutanol, including the development of its biocatalysts, the production and sale of biojet fuel, its Retrofit process and the next generation of chemicals and biofuels that will be based on its isobutanol technology. Gevo Development/Agri-Energy is the key revenue generating segment which involves the operation of the Luverne Facility and production of ethanol, isobutanol and related products.

Poe Fratt, Senior Research Analyst, Noble Capital Markets, Inc.

Refer to the full report for the price target, fundamental analysis, and rating.

    EBITDA losses continued in 4Q2021. Given the early stage of development of the renewable fuels concept, it isn’t surprising that EBITDA was negative $10.9 million due to limited revenue and continuing corporate/development costs. We expect negative EBITDA to continue into at least late next year. Gross losses of $4.3 million were slightly higher than $1.4 million last year due to operating expenses of $2.8 million, but total development and overhead costs dropped $4.4 million to $12.2 million.

    Funding is visible into next year, but development goal of 1 BGPY by 2030 likely to require added capital.  Given 4Q2021 cash of $476 million and the scheduled financial closing of Net Zero One in 1Q2023, we don’t believe that added capital is required right now. Current cash creates a funding fairway into late 2022/early 2023, and we expect the recently refreshed $500 million ATM program will not …


This Company Sponsored Research is provided by Noble Capital Markets, Inc., a FINRA and S.E.C. registered broker-dealer (B/D).

*Analyst certification and important disclosures included in the full report. NOTE: investment decisions should not be based upon the content of this research summary.  Proper due diligence is required before making any investment decision. 

The SPAC Advantage in a Volatile or Bear Market


Image Credit: Kampus (Pexels)


Why it May be Prudent in a Down-Market to Allocate to Individual SPACs


When the markets were roaring upwards in 2020 investment capital was abundant, the number of Special Purpose Acquisition Companies (SPACs) going public broke records. Competition to find ideal companies to merge with to fulfill the SPAC’s mission, intensified. Almost two years have passed since SPAC IPOs’ popularity emerged following a much quieter period for these equities. The 2020 vintage SPACs are now nearing their deadlines to find acquisitions or disseminate the money held in escrow back to shareholders. What does this mean to stock market investors?

Background

IPOs offered as SPACs in 2020 broke all previous records, in terms of the number of offerings, and gross proceeds. In 2021 there was even more issuance. SPACs are not new; they have existed for decades, they are sometimes referred to as blank check companies and shell companies. They have also been called “backdoor IPOs” because it allows a private company to go public without the normal process of filing and disclosures through the regular IPO filing process. Filing for an IPO with a SPAC is much quicker for private companies than going the traditional IPO route.

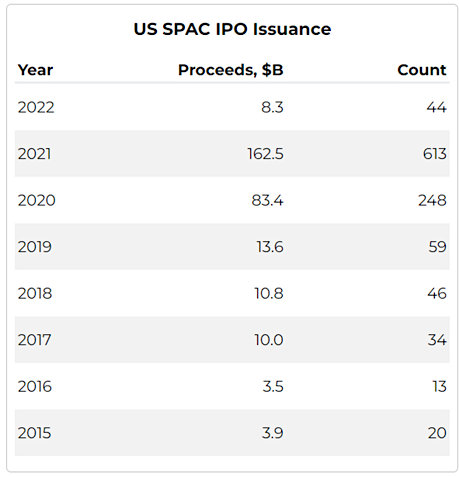
Currently, there are 602 SPACs with 162.4 billion in combined funds looking to find acquisitions. There are SPACs succeeding in finding acquisition targets, tickers like BOWL, DWAC, CPSR have recently either merged or are in a deSPAC phase, headed toward merging. But it is unlikely that there are 600 well-suited, private companies looking to go public via SPAC acquisition.  This isn’t necessarily bad for the investors in the stock, if there is a downside it is to the finance entities that went through the expense and management of the SPAC for two years.

Investors lose little more than opportunity while their funds were tied up. This is because when a SPAC fails to merge, the funds from the IPO, less expenses, plus accrued interest, are then all returned to the current holder of shares.


Performance

So far this year SPACs have outperformed the market significantly. This may be because SPACs don’t have as much downside, as mentioned, the initial investment is held in an escrow account that typically earns interest. Should the SPAC not merge after 24 months, investors have a fairly good idea of what they can expect to be returned to them. They may not make money, but depending on their purchase price they shouldn’t lose much. The returned cash is most often just below the initial $10 offering price. This protection prevents the SPAC from decreasing in value greatly from its offering price, while still maintaining the potential to find a target that could drive the price significantly upward. The structure demonstrates a level of safety that is not shared by other common stocks.


There is an enhanced benefit to SPAC owners in 2022 that barely existed in 2020 and early 2021 when so many of the SPACs came to market, interest rates are now averaging 3% in the escrow accounts. This is up from when rates approximated 0% when the older SPACs came to market.

SPCX used in the chart above is an actively managed ETF comprised of SPAC IPOs. Using it as a proxy for the SPAC market and comparing its performance to the S&P 500 YTD, it’s clear that SPAC stocks are a diversifier in a portfolio – they trade off their own fundamentals. The very big risk-flattening mechanism is that they effectively have a price floor for each individual SPAC.

Portfolios looking to reduce downside risk yet maintain upside potential may want to allocate into well-selected individual SPACs. To do this some investors research by evaluating the market value of the issuance and comparing it to escrow trust account value balance. What they are looking for is pre-deal shell companies that are worth more than their market price. These situations where one pays less in cash than the cash the company holds is a strategy that is gaining popularity as all markets weaken. 


Source: SPAC Research


Take-Away

Competition to find perfect merger candidates intensified to an extreme never before seen for SPACs as issuance rose from 59 deals in 2019, to 248 in 2020, and 613 in 2021. A failed SPAC (one that doesn’t find a target in 24 months) is unfortunate for the finance company issuer, but it is not necessarily bad for the stockholder. Stockholders have the option if the company finds a target, of opting out and collecting their pro-rata share of the trust or retaining the stock and owning the company it acquires. If there is no acquisition within the specified period, the stockholder is cashed out at their pro-rata share of the trust. There are stocks that are trading for less than their escrow value, some investors seek these out.

For updates on small and microcap stocks, including SPACS, sign-up to receive Channelchek daily research and information.


Paul Hoffman

Managing Editor, Channelchek


Suggested Reading


Investors Watch Media SPAC Stay in the Green as Markets Falter


Analysis of a SPAC


Merger of a SPAC, the De-SPAC Phase Explained


Lifecycle of a SPAC


Sources

https://www.spcxetf.com/the-fund/

https://www.spacresearch.com/


Stay up to date. Follow us:


E.W. Scripps (SSP) – A Softer Than Expected Start

Monday, February 28, 2022

E.W. Scripps (SSP)
A Softer Than Expected Start

The E.W. Scripps Co. (www.scripps.com) serves audiences and businesses through a growing portfolio of television, print and digital media brands. After approval of its acquisition of two Granite Broadcasting stations later this year, Scripps will own 21 local television stations as well as daily newspapers in 13 markets across the United States. It also runs an expanding collection of local and national digital journalism and information businesses including digital video news service Newsy. Scripps also produces television programming, runs an award-winning investigative reporting newsroom in Washington, D.C., and serves as the longtime steward of one of the nation’s largest, most successful and longest-running educational programs, Scripps National Spelling Bee. Founded in 1879, Scripps is focused on the stories of tomorrow.

Michael Kupinski, Director of Research, Noble Capital Markets, Inc.

Refer to the full report for the price target, fundamental analysis, and rating.

    Full-year results. The company reported total full-year 2021 revenue of $2.283 billion, modestly lower than our $2.29 billion estimate. The largest variance to our revenue estimate was in its Networks business. Full-year Adj. EBITDA was a strong $604.5 million, beating our $589 million adj. EBITDA estimate by 2.6%.

    Political advertising expected to be strong.  Management indicated that it expects Political advertising to be $270 million in 2022, above our current $256 million estimate. Given the very high margin, management anticipates full year 2022 free cash flow to be in the range of $400 million to $450 million, which is earmarked for debt reduction …


This research is provided by Noble Capital Markets, Inc., a FINRA and S.E.C. registered broker-dealer (B/D).

*Analyst certification and important disclosures included in the full report. NOTE: investment decisions should not be based upon the content of this research summary.  Proper due diligence is required before making any investment decision. 

Baudax Bio (BXRX) – Public Offering Announced Revising EPS and Price Target

Monday, February 28, 2022

Baudax Bio (BXRX)
Public Offering Announced; Revising EPS and Price Target

Baudax Bio is a biopharmaceutical company focused on developing therapies for post-operative pain, peri-operative pain, and anesthesia. The company currently has one approved therapy in ANJESO for post-operative pain. Proprietary ANJESO (meloxicam) injection is the first and only once-daily IV analgesic. The company also has a pipeline of early-stage candidates with two novel neuromuscular blocking agents (NMBAs), a proprietary related reversal agent to their NMBAs, and Dex-IN, an intranasal formulation of dexmedetomidine (Dex) that has sedative, analgesic, and anti-anxiety properties.

Gregory Aurand, Senior Research Analyst, Noble Capital Markets, Inc.

Refer to the full report for the price target, fundamental analysis, and rating.

    Announced offering. Last Friday, Baudax Bio announced a $10 million public offering, composed of 3,508,772 shares of common stock sold together with 3,508,772 warrants allowing for the purchase of a common share at $3.25. The offering price of the stock and warrant unit is $2.85. The warrants will be exercisable immediately after the offering and expire in five years. The offering is expected to close on or about March 1, 2022.

    Current market environment increases the share count.  While the capital raise was anticipated, the market environment has been decidedly unforgiving. While we believe it is unwarranted, the stock price has declined roughly 70% from where it was prior to the announced split. With the stock price decline, a greater number of shares are required to support company needs. With the weakness, the issued …


This Company Sponsored Research is provided by Noble Capital Markets, Inc., a FINRA and S.E.C. registered broker-dealer (B/D).

*Analyst certification and important disclosures included in the full report. NOTE: investment decisions should not be based upon the content of this research summary.  Proper due diligence is required before making any investment decision. 

Ocugen (OCGN) – Pipeline Progress Updated With Fourth Quarter Financial Report

Monday, February 28, 2022

Ocugen (OCGN)
Pipeline Progress Updated With Fourth Quarter Financial Report

Ocugen Inc is a clinical stage biopharmaceutical company. It is focused on discovering, developing and commercializing a pipeline of innovative therapies that address rare and underserved eye diseases. Ocugen offers a diversified ophthalmology portfolio that includes novel gene therapies, biologics, and small molecules and targets a broad range of high-need retinal and ocular surface diseases.

Robert LeBoyer, Senior Research Analyst, Noble Capital Markets, Inc.

Refer to the full report for the price target, fundamental analysis, and rating.

    Summary.  Ocugen reported a net loss of $14.6 million or $(0.07) per share for 4Q21, bringing FY21 loss to $58.4 million or $(0.30) per share. The company also gave updates on recent developments for its development programs. Cash at December 31, 2021 was $95.1 million, excluding proceeds of an offering completed in late February 2022.

    Covaxin Is Progressing Through FDA and Heath Canada.  The FDA lifted the Clinical Hold on the IND application for the Phase 2/3 clinical trial, allowing the bridging study to continue. The Emergency Use Authorization (EUA) application submitted in November 2022 has been supplemented with safety data and studies showing neutralization of the Delta and Omicron variants …


This Company Sponsored Research is provided by Noble Capital Markets, Inc., a FINRA and S.E.C. registered broker-dealer (B/D).

*Analyst certification and important disclosures included in the full report. NOTE: investment decisions should not be based upon the content of this research summary.  Proper due diligence is required before making any investment decision. 

Pros and Cons of a Company Like Berkshire Hathaway in your Portfolio


Image: BuffettNews.com


Berkshire Hathaway’s Annual Report Highlights Pros and Cons of Investing in a Giant


There were a few surprises in Warren Buffett’s annual letter to shareholders released Saturday, the least of these will probably garner a good deal of attention at the Berkshire Hathaway Shareholder Meeting. As announced by Mr. Buffett in the letter, “’Cousin” Jimmy Buffett has designed a pontoon “party” boat that is now being manufactured by Forest River, a Berkshire subsidiary. The boat will be introduced on April 29 at our Berkshire Bazaar of Bargains. And, for two days only, shareholders will be able to purchase Jimmy’s masterpiece at a 10% discount. Your bargain-hunting chairman will be buying a boat for his family’s use. Join me.” Other, more critical but less fun surprises are covered below.


Impact of interest Rates on Berkshire

Berkshire’s balance sheet includes $144 billion of cash and cash equivalents. Of this sum, $120 billion is held in U.S. Treasury bills. US T-bills are structured to mature in one year or less. At least two things are worth noting from this. First, T-bills as of February 25th are yielding from .03% in a one-month maturity, to 1.13% out a full year. Most expect the Fed to tighten during 2022, with some forecasters expecting as many as eight 25bp to 50bp (0.25% to 0.50%) increases each. If the Fed does tighten by only 25bp eight times it will likely serve to raise the T-bill curve levels up 2% or more. A 2% increase on the “risk free” rate would add $2.4 billion to Berkshires bottom line.  In 2021 Berkshire Hathaway reported revenue of $90 billion. The interest rate hike would be meaningful to the companies earnings. The other interesting fact worth paying attention to is that the amount Berkshire Hathaway owns in U.S. Treasuries is equal to 0.50% of the publicly held national debt of the U.S. If Berkshire should go on a buying spree and not roll their maturing T-bills, this by itself could cause upward pressure on U.S. interest rates. 

The CEO’s letter to shareholders made clear that, although they have committed to holding $30 billion in cash, they would prefer not to have as much excess cash available as they do. There is also a concern when looking to invest in public entities that interest rates that are low push the prices of all productive investments upward, whether these are stocks, real estate, farms, oil wells, etc.. Buffett writes, “Other factors influence valuations as well, but interest rates will always be important.”


Why Not Repurchase Shares?

Buffett explains there are three ways to increase investor value. First and most important is to increase the long-term earning power of Berkshire’s controlled businesses through internal growth or by making acquisitions. Currently, internal opportunities deliver better returns than acquisitions. Berkshire’s resources are far greater than available opportunities. The second method is buying stock in good companies.  While there are times when there are many attractive opportunities, Buffett writes, “Today, though, we find little that excites us.”

So, if Berkshire Hathaway is such a good investment, why not repurchase shares and allow the company to multiply its benefit to itself? In answering this question, Buffett says about share repurchase, “Through that simple act, we increase your share of the many controlled and non-controlled businesses Berkshire owns. When the price/value equation is right, this path is the easiest and most certain way for us to increase your wealth.” During the past two years, Berkshire did repurchase 9% of their outstanding shares.  Buffett says, “I want to underscore that for Berkshire repurchases to make sense, our shares must offer appropriate value. We don’t want to overpay for the shares of other companies, and it would be value-destroying if we were to overpay when we are buying Berkshire.”

Take-Away

The success of Berkshire Hathaway and the “Oracle of Omaha” that remains at the helm are worth watching if you’re an investor at any level. In addition to the decades of success, there is another story of big versus small or even young versus old. It’s the story of a company too large to efficiently benefit from its success. While their decision-making capacity may be second to none, much of their massive “firepower” remains underutilized. This makes Berkshire Hathaway worth considering as a core long-term holding in much the same way one invests in a large balanced mutual fund focused on stable growth. Investors that seek companies with maximum efficiency and capital deployment with far more growth potential should consider allocating at least a portion of their investments to smaller well researched companies. The data and research within Channelchek focus exclusively on small and microcap companies that aren’t burdened by billions in underperforming assets. Sign-up for daily emails and access to top-tier research.


Paul Hoffman

Managing Editor, Channelchek


Suggested Reading


It’s Officially Warren Buffett Season – Hints on What to Expect


Long Term Retirement Money and Fledgling Companies


Is GDP Growth Transitory and Inflation Persistent?


Why Goldman Says to Buy the Dip


Sources

https://datalab.usaspending.gov/americas-finance-guide/#_blank

https://www.cnbc.com/2022/02/26/read-warren-buffetts-annual-letter-to-berkshire-hathaway-shareholders.html

https://www.forestriverinc.com/Our-Products/Pontoon-Boats

https://omaha.com/business/warren-watch-buffett-cousins-warren-and-jimmy-share-an-on-air-moment/article_40fec2ad-c1c3-5d12-9c1b-8b6319e73670.html


Stay up to date. Follow us:


Retail Traders and One Top Hedge Fund Have Something in Common


Image Credit: Slices of Light (Flickr)


Institutional Shorts of Meme Stocks Reduced While Top Hedge Fund Adds Long Positions


It’s the premise of many movies; two unlikely partners fighting for a common goal.

In their quarterly SEC filing, it was discovered that Renaissance Technologies (RenTech), considered one of the best-performing giant hedge funds in history, added substantially to its AMC Entertainment (AMC) position and GameStop (GME) holdings. Meanwhile, hedge fund Citadel LLC., is further reducing its shares in a short fund managed by Melvin Capital that was near collapse early last year after suffering substantial difficulties with short positions including AMC and GME. 

According to The Wall Street Journal, Citadel LLC is further reducing its once $2 billion investment in Melvin Capital Management’s Short Fund. During late January, Citadel asked to redeem half the firm’s remaining position in Melvin.  It had previously halved the investment late last year after Melvin produced double-digit losses for the second January in a row. The Journal reported the recent redemption request would be paid out at the end of March.

Shares in GameStop and AMC were severely underperforming the S&P 500 year-to-date 2022. As of Thursday (February 24), the S&P 500 averaged -10.34%, while GME had a negative return of -18.49% and AMC dropped more substantially with a -33.33% return on the year.

This may have turned around this week. As the market traded off in response to Russia invading Ukraine, reporting by RenTech showed they are aggressively adding to their positions, this helped push the two stocks up. During the fourth quarter they nearly doubled their holding of AMC to 4.7 million shares and the fund has also gotten back involved with Gamestop with a 2600 share position at year-end.


The recent advance of AMC and Gamestop creates curious allies. RenTech is a huge hedge fund. It was founded by Jim Simons, a former NSA codebreaker and MIT math professor. The quantitative fund relies on algorithms to decide many of its trades. The retail investing “Apes” said to derive their decisions from social media and stock memes owned 80% of AMC by November 2021. The social media-driven positions of the retail accounts and the Renaissance Technologies PhDs developing sophisticated models make for peculiar allies. But together, they are causing the likes of Citadel to continue its retreat. The more those that are short, give up ground, the more likely the stocks will trade up. For now, the PhDs and the “Apes” seem to control the “battlefield.” The proof is in the price movement of AMC and GME.


Paul Hoffman

Managing Editor, Channelchek


Suggested Reading


More Power to the Individual Investor


Is Biden Tightening the Reins on Large Companies?


Can Small Investors Compete With Wall Street?


Reddit Era Investors May Want to HODL this New Book


Sources

https://markets.businessinsider.com/news/stocks/jim-simons-renaissance-technologies-rentech-amc-entertainment-gamestop-tesla-stock-2022-2

https://www.marketwatch.com/story/meme-stocks-soar-on-bad-news-for-melvin-capital-and-russias-invasion-of-ukraine-11645744516

https://www.cnbc.com/video/2021/10/29/how-the-amc-apes-are-taking-on-wall-street.html

www.koyfin

https://www.wsj.com/articles/citadel-is-further-paring-back-2-billion-melvin-investment-11645710666?mod=rss_markets_main–


Stay up to date. Follow us:


Release – Gevo Reports Fourth Quarter 2021 Financial Results


Gevo Reports Fourth Quarter 2021 Financial Results

Research, News, and Market Data on Gevo


ENGLEWOOD, Colo., Feb. 24, 2022 (GLOBE NEWSWIRE) — Gevo, Inc. (NASDAQ: GEVO) today announced financial results for the fourth quarter of 2021 and summarized recent corporate highlights.

Recent Corporate Highlights

  • On December 7, 2021, Kolmar Americas Inc and Gevo entered into a financeable fuel supply agreement for 45 million gallons per year of renewable, energy-dense liquid hydrocarbons.
  • On November 16, 2021, Gevo signed a memorandum of understanding (MoU) with Sweetwater Energy, Inc., regarding the use of sustainably sourced agricultural residues and woody biomass as a feedstock for producing cellulosic alcohols and energy-dense renewable liquid hydrocarbons.
  • On October 25, 2021, ADM, a global leader in nutrition and agricultural origination and processing, and Gevo signed a MoU to support the production of sustainable aviation fuel and other low carbon-footprint hydrocarbon fuels.
  • On October 12, 2021, Gevo and Axens North America, Inc. (“Axens”) entered into an agreement that establishes a strategic alliance aimed at accelerating the commercialization of sustainable ethanol-to-jet projects in the United States.
  • In December 2021, Argonne National Laboratory (“ANL”), a U.S. Department of Energy multidisciplinary science and engineering research center, reported the preliminary results of its life cycle analysis of Gevo’s planned Net-Zero plant to Gevo. ANL’s preliminary findings were consistent with Gevo’s findings that when renewable energy is used to power production processes, and the corn is produced with climate smart ag practices that drive the carbon intensity score of corn down, then the sustainable aviation fuel (“SAF”) that would be produced could achieve net-zero life-cycle emissions when measured using ANL’s GREET Model. When carbon capture sequestration technology is added as a de-carbonization tool, the life-cycle emissions should be negative according to the model. ANL is currently working through the scientific peer reviewed publication process.
  • In January 2022, Gevo’s renewable natural gas (“RNG”) facilities in NW Iowa began to start-up operations. The start-up process is expected to take a few months and reach a steady state operation in the second quarter of 2022 which will allow time for Gevo to apply for credits under the federal Renewable Fuel Standard Program (“RFS”) and the Low Carbon Fuel Standard (“LCFS”) in California, including verification of carbon intensity levels and other requirements. Depending on the timing of the qualification and approval processes for obtaining credits under RFS and LCFS, Gevo expects to generate biogas revenues starting in the second quarter of 2022 and sales of credits under RFS and LCFS in the second half of 2022. Gevo expects that the RNG Project EBITDA1 should generate approximately $16-22 million per year by 2023 depending on a variety of assumptions, including the value of credits under RFS and LCFS.   

2021 Fourth Quarter Financial Highlights

  • Ended the quarter with cash, cash equivalents, restricted cash and marketable securities of $475.8 million compared to $522.4 as of the end Q3 2021
  • Revenue of $0.1 million for the quarter compared to $0.5 million in Q4 2020
  • Loss from operations of ($16.5) million for the quarter compared to ($7.6) million in Q4 2020
  • Non-GAAP cash EBITDA loss2 of ($10.9) million for the quarter compared to ($5.7) million in Q4 2020
  • Net loss per share of ($0.08) for the quarter compared to ($0.15) in Q4 2020
  • Non-GAAP adjusted net loss per share3 of ($0.08) for the quarter compared to ($0.07) in Q4 2020

Net-Zero 1 Update

Gevo continues to make progress on the design and engineering work related to its Net-Zero 1 Project. As a result of Gevo’s agreement and relationship with Axens, Gevo recently made the decision to utilize ethanol fermentation technology instead of isobutanol fermentation technology to produce SAF and other renewable hydrocarbon products at Net-Zero 1.

Gevo believes that there are several advantages of using ethanol fermentation technology at Net-Zero 1, including the following:

  • Lower capital costs per gallon of hydrocarbon produced
  • Increased production capacity of renewable hydrocarbons from 45MGPY to 60MGPY
  • Process guarantees from Axens on the conversion of ethanol into SAF
  • Lower technology and execution risk which are expected to make debt financing more readily available
  • Leverages previous Net-Zero 1 engineering and design work from 2021
  • The hydrocarbon plant design for Net-Zero 1 can be used at any ethanol plant that meets certain sustainability and carbon intensity score requirements which should enable Gevo to grow more rapidly to meet demand

Gevo currently expects to construct Net-Zero 1 in Lake Preston, South Dakota. In addition to Lake Preston, Gevo has identified several other attractive greenfield sites that are at least as attractive as Lake Preston from the standpoint of fundamental economics, access to sustainable feedstocks, deployment of renewable energy and transportation of finished product to market. Lake Preston is the furthest developed of the sites that Gevo has identified for Net-Zero 1. Gevo expects final site selection for Net-Zero 1 to occur later in 2022.

Gevo is targeting Net-Zero 1 to be mechanically complete in late 2024 and operational in 2025. Based on current assumptions, including those around future commodity pricing and future environmental benefit credit values, and preliminary engineering work, Gevo estimates Net-Zero 1 will have a fully installed and non-recourse project financed capital cost of approximately $900 million, to generate approximately $150-200 million of Net-Zero 1 Project EBITDA4 per year. Because Gevo can leverage a substantial amount of the work already done for Net-Zero 1, Gevo expects to order long lead equipment and begin site preparation in late 2022 with full construction commencing in 2023.

Commenting on the fourth quarter of 2021 and recent corporate developments, Dr. Patrick R. Gruber, Gevo’s Chief Executive Officer, said “It’s an exciting time to work for Gevo with plans moving forward on our first of its kind, fully-decarbonized alcohol-to-SAF plant that will produce commercial volumes of SAF. Our relationship with Axens is bearing fruit. Knowing how to convert ethanol into net-zero SAF and other hydrocarbons is key to our growth strategy, especially with the potential commercial relationships with ADM and other partners.”

Dr. Gruber continued, “Over the last twelve months, we’ve hired the leaders for our Net-Zero 1 Project. We are focused on engineering Net-Zero 1 so that we can get it built and operating.”

Fourth Quarter 2021 Financial Results

Revenue for the three months ended December 31, 2021 was $0.1 million compared with $0.5 million in the same period in 2020.

During the three months ended December 31, 2021, hydrocarbon revenue was nil compared to $0.4 million during the three months ended December 31, 2020. Gevo’s hydrocarbon revenue is comprised of sales of SAF and renewable premium gasoline.

During the three months ended December 31, 2021 and 2020, no significant revenue was derived at Gevo’s production facility in Luverne, Minnesota (the “Luverne Facility”) related to ethanol sales and related products.

As a result of COVID-19 and in response to an unfavorable commodity environment, Gevo terminated its production of ethanol and distiller grains in March 2020. As previously announced, the Luverne Facility is currently producing isobutanol that will be used as a feedstock for us to produce SAF and renewable premium gasoline to fulfill existing sales contracts. We also expect to utilize some of the isobutanol produced to develop certain isobutanol specialty markets. These renewable hydrocarbons will be produced at Gevo’s demonstration plant at the South Hampton Resources, Inc. facility in Silsbee, Texas (the “South Hampton Facility”).

Cost of goods sold was $2.8 million for the three months ended December 31, 2021, compared with $0.9 million in the same period in 2020. We began producing isobutanol during the third quarter 2021 resulting in higher production costs. The cost of goods sold was significantly higher for isobutanol without the coproduction of ethanol as operated in previous years as we worked to improve and refine our production processes. Cost of goods sold included costs associated with the production of isobutanol, SAF and isooctane as well as maintenance of the Luverne Facility and the South Hampton Facility.

Depreciation and amortization for the three months ended December 31, 2021 totaled approximately $1.1 million related to production costs. Depreciation and amortization for the three months ended December 31, 2021 totaled approximately $0.5 million related to research and development expense and sales, general and administrative expense.

Gross loss was ($3.8) million for the three months ended December 31, 2021, compared with a ($1.4) million gross loss in the same period in 2020.

Research and development expense increased by approximately $1.1 million during the three months ended December 31, 2021, compared with the three months ended December 31, 2020, due primarily to an increase in personnel and recruiting costs related to increased headcount and stock-based compensation as we work to improve our process for growing and fermenting yeast strains.

Selling, general and administrative expense increased by approximately $4.5 million during the three months ended December 31, 2021, compared with the three months ended December 31, 2020, due primarily to increases in personnel costs and recruiting related to increased headcount and stock-based compensation, increased professional fees, higher costs for insurance and increased consulting fees related to documenting our compliance with Section 404(b) of the Sarbanes-Oxley Act.

Preliminary stage project costs related to our RNG and Net-Zero projects were approximately $2.1 million during the three months ended December 31, 2021 compared to $1.0 million for the three months ended December 31, 2020. During the three months ended December 31, 2021, the preliminary stage project costs were primarily related to consulting for preliminary engineering costs and for personnel expenses to support the growth in business activity at our Net-Zero projects. During the three months ended December 31, 2020, the preliminary stage project costs were primarily related to consulting for preliminary engineering costs and for personnel expenses to support the growth in business activity at our RNG project. During the three months ended December 31, 2021, we began capitalizing our Net-Zero 1 project costs after completing certain front-end engineering studies and determining it was probable that we would build the Net-Zero 1 project.

Loss from operations in the three months ended December 31, 2021 was ($16.5) million, compared with a ($7.6) million loss from operations in the same period in 2020.

Non-GAAP cash EBITDA loss5 in the three months ended December 31, 2021 was ($10.9) million, compared with a ($5.7) million non-GAAP cash EBITDA loss in the same period in 2020.

Interest expense decreased by $0.4 million in the three months ended December 31, 2021 as compared to the same period in 2020, due to the conversion of all Gevo’s 12% convertible senior secured notes due 2020/2021 to common stock during 2020.

Interest and dividend income during the three months ended December 31, 2021 increased $0.2 million compared to the three months ended December 31, 2020, primarily due to income received on marketable securities and restricted cash.

Gevo incurred a net loss for the three months ended December 31, 2021 of ($16.5) million, compared with a net loss of ($18.1) million during the same period in 2020. Non-GAAP adjusted net loss6 for the three months ended December 31, 2021 was ($16.5) million, compared with a non-GAAP adjusted net loss of ($8.1) million during the same period in 2020.

Cash, cash equivalents, restricted cash and marketable securities at December 31, 2021 totaled $475.8 million compared to $522.4 as of the end Q3 2021.

Webcast and Conference Call Information

Hosting today’s conference call at 4:30 p.m. EDT (2:30 p.m. MDT) will be Dr. Patrick R. Gruber, Chief Executive Officer, L. Lynn Smull, Chief Financial Officer, Heather Manuel, Vice President – Investor Relations & Communications and John Richardson, Investor Relations Manager. They will review Gevo’s financial results and provide an update on recent corporate highlights.

To participate in the conference call, please dial 1 (833) 729-4776 (inside the U.S.) or 1 (830) 213-7701 (outside the U.S.) and reference the access code 3465026# or through the event weblink https://edge.media-server.com/mmc/p/38zwqbqa.

A replay of the call and webcast will be available two hours after the conference call ends on February 24, 2022. To access the replay, please visit https://edge.media-server.com/mmc/p/38zwqbqa. The archived webcast will be available in the Investor Relations section of Gevo’s website at www.gevo.com.

About Gevo

Gevo’s mission is to transform renewable energy and carbon into energy-dense liquid hydrocarbons. These liquid hydrocarbons can be used for drop-in transportation fuels such as gasoline, jet fuel, and diesel fuel, that when burned have potential to yield net-zero greenhouse gas emissions when measured across the full lifecycle of the products. Gevo uses low-carbon renewable resource-based carbohydrates as raw materials and is in an advanced state of developing renewable electricity and renewable natural gas for use in production processes, resulting in low-carbon fuels with substantially reduced carbon intensity (the level of greenhouse gas emissions compared to standard petroleum fossil-based fuels across their lifecycle). Gevo’s products perform as well or better than traditional fossil-based fuels in infrastructure and engines, but with substantially reduced greenhouse gas emissions. In addition to addressing the problems of fuels, Gevo’s technology also enables certain plastics, such as polyester, to be made with more sustainable ingredients. Gevo’s ability to penetrate the growing low-carbon fuels market depends on the price of oil and the value of abating carbon emissions that would otherwise increase greenhouse gas emissions. Gevo believes that its proven, patented, technology enabling the use of a variety of low-carbon sustainable feedstocks to produce price-competitive low carbon products such as gasoline components, jet fuel, and diesel fuel yields the potential to generate project and corporate returns that justify the build-out of a multi-billion-dollar business.

Gevo believes that Argonne National Laboratory GREET model is the best available standard of scientific based measurement for life cycle inventory or LCI.

Learn more at Gevo’s website: www.gevo.com

Forward-Looking Statements

Certain statements in this press release may constitute “forward-looking statements” within the meaning of the Private Securities Litigation Reform Act of 1995. These forward-looking statements relate to a variety of matters, including, without limitation, Gevo’s business development activities, Gevo’s agreement with Kolmar Americas Inc., Gevo’s Net-Zero Projects, Gevo’s RNG project, fermentation technologies, the status of the engineering and design work for the Net-Zero 1 Project, the timing of Net-Zero 1, projections concerning Net-Zero 1, including projected capital costs, projected internal rates of return and projected EBITDA, Gevo’s ability to the commercialize its projects, Gevo’s offtake agreements, Gevo’s plans to develop its business, Gevo’s ability to successfully construct and finance its operations and growth projects, Gevo’s ability to achieve cash flow from its planned projects, the ability of Gevo’s products to contribute to lower greenhouse gas emissions and other statements that are not purely statements of historical fact. These forward-looking statements are made based on the current beliefs, expectations and assumptions of the management of Gevo and are subject to significant risks and uncertainty. Investors are cautioned not to place undue reliance on any such forward-looking statements. All such forward-looking statements speak only as of the date they are made, and Gevo undertakes no obligation to update or revise these statements, whether as a result of new information, future events or otherwise. Although Gevo believes that the expectations reflected in these forward-looking statements are reasonable, these statements involve many risks and uncertainties that may cause actual results to differ materially from what may be expressed or implied in these forward-looking statements. For a further discussion of risks and uncertainties that could cause actual results to differ from those expressed in these forward-looking statements, as well as risks relating to the business of Gevo in general, see the risk disclosures in the Annual Report on Form 10-K of Gevo for the year ended December 31, 2021 and in subsequent reports on Forms 10-Q and 8-K and other filings made with the U.S. Securities and Exchange Commission by Gevo.

Non-GAAP Financial Information

This press release contains financial measures that do not comply with U.S. generally accepted accounting principles (“GAAP”), including non-GAAP cash EBITDA loss, non-GAAP adjusted net loss and non-GAAP adjusted net loss per share. Non-GAAP cash EBITDA loss excludes depreciation and amortization and non-cash stock-based compensation. Non-GAAP adjusted net loss and adjusted net loss per share excludes non-cash gains and/or losses recognized in the quarter due to the changes in the fair value of certain of Gevo’s financial instruments, such as warrants, convertible debt and embedded derivatives. Management believes these measures are useful to supplement its GAAP financial statements with this non-GAAP information because management uses such information internally for its operating, budgeting and financial planning purposes. These non-GAAP financial measures also facilitate management’s internal comparisons to Gevo’s historical performance as well as comparisons to the operating results of other companies. In addition, Gevo believes these non-GAAP financial measures are useful to investors because they allow for greater transparency into the indicators used by management as a basis for its financial and operational decision making. Non-GAAP information is not prepared under a comprehensive set of accounting rules and therefore, should only be read in conjunction with financial information reported under GAAP when understanding Gevo’s operating performance. A reconciliation between GAAP and non-GAAP financial information is provided in the financial statement tables below.

1 RNG Project EBITDA is a non-GAAP financial measure that we define as total operating revenues less total operating expenses for the project.
2 Cash EBITDA loss is a non-GAAP measure calculated by adding back depreciation and amortization and non-cash stock compensation to GAAP loss from operations. A reconciliation of cash EBITDA loss to GAAP loss from operations is provided in the financial statement tables following this release.
3 Adjusted net loss per share is a non-GAAP measure calculated by adding back non-cash gains and/or losses recognized in the quarter due to the changes in the fair value of certain of our financial instruments, such as warrants, convertible debt and embedded derivatives, to GAAP net loss per share. A reconciliation of adjusted net loss per share to GAAP net loss per share is provided in the financial statement tables following this release.
4 Net-Zero 1 Project EBITDA is a non-GAAP financial measure that we define as total operating revenues less total operating expenses for the project.
5 Cash EBITDA loss is a non-GAAP measure calculated by adding back depreciation and amortization and non-cash stock compensation to GAAP loss from operations. A reconciliation of cash EBITDA loss to GAAP loss from operations is provided in the financial statement tables following this release.
6 Adjusted net loss is a non-GAAP measure calculated by adding back non-cash gains and/or losses recognized in the quarter due to the changes in the fair value of certain of our financial instruments, such as warrants, convertible debt and embedded derivatives, to GAAP net loss. A reconciliation of adjusted net loss to GAAP net loss is provided in the financial statement tables following this release.

Gevo, Inc.
Condensed Consolidated Balance Sheets Information
(Unaudited, in thousands, except share and per share amounts)

  December 31,   December 31,
    2021       2020  
Assets      
Current assets      
Cash and cash equivalents $ 40,833     $ 78,338  
Marketable securities (current)   275,340        
Restricted cash (current)   25,032        
Accounts receivable, net   978       527  
Inventories   2,751               2,491  
Prepaid expenses and other current assets   6,857               1,914  
Total current assets   351,791       83,270  
       
Property, plant and equipment, net   139,141       66,408  
Long-term marketable securities   64,396        
Long-term restricted cash   70,168        
Operating right-of-use assets          2,414                 133  
Finance right-of-use assets   27,297                176  
Intangible assets, net                    8,938                 114  
Deposits and other assets               2,331                 1,998  
Total assets $ 666,476     $ 152,099  
       
Liabilities      
Current liabilities      
Accounts payable and accrued liabilities $ 28,288     $ 3,943  
Operating lease liabilities (current)   772       172  
Financing lease liabilities (current)   3,413       10  
Loans payable – other (current)   158       807  
Total current liabilities   32,631       4,932  
       
2021 Bonds payable (long-term)   66,486        
Loans payable – other (long-term)   318       447  
Operating lease liabilities (long-term)   1,902        
Finance lease liabilities (long-term)   17,797       162  
Other long-term liabilities   87       179  
Total liabilities   119,221       5,720  
       
Commitments and Contingencies      
       
Stockholders’ Equity      
Common Stock, $0.01 par value per share; 250,000,000 authorized, 201,988,662 and 128,138,311 shares issued and outstanding at December 31, 2021 and 2020, respectively.   2,020       1,282  
Additional paid-in capital   1,103,224       643,269  
Accumulated other comprehensive loss   (614 )      
Accumulated deficit   (557,375 )     (498,172 )
Total stockholders’ equity   547,255           146,379  
Total liabilities and stockholders’ equity $ 666,476     $ 152,099  
       

Gevo, Inc.
Condensed Consolidated Statements of Operations Information
(Unaudited, in thousands, except share and per share amounts)

  Three Months Ended December 31,
    2021       2020       2019  
Revenue and cost of goods sold          
Ethanol sales and related products, net $ 34     $ 5     $ 5,931  
Hydrocarbon revenue   20       416       957  
Other revenue         110        
Total revenues   54       531       6,888  
           
Cost of goods sold (exclusive of depreciation shown below)   2,791       866       7,836  
Depreciation and amortization   1,104       1,094       1,591  
           
Gross loss   (3,841 )     (1,429 )     (2,539 )
           
Operating Expenses          
Research and development expense   2,570       1,507       271  
Selling, general and administrative expense   7,546       3,010       3,155  
Preliminary stage project costs   2,069       998       205  
Loss on disposal of assets         587       23  
Depreciation and amortization   452       56       57  
Total operating expenses   12,637       6,158       3,711  
           
Loss from operations   (16,478 )     (7,587 )     (6,250 )
           
Other income (expense)          
Interest expense   (173 )     (535 )     (611 )
Interest and dividend income   183       26       32  
(Loss) on modification of 2020 Notes         (6 )      
(Loss) on conversion of 2020/21 Notes to common stock         (1,373 )      
(Loss) from change in fair value of 2020/21 Notes embedded derivative liability         (8,578 )      
Other income (expense), net   (45 )     (1 )     10  
Total other income (expense)   (35 )     (10,467 )     (569 )
           
Net loss $ (16,513 )   $ (18,054 )   $ (6,819 )
           
Net loss per share – basic and diluted $ (0.08 )   $ (0.15 )   $ (0.50 )
           
Weighted-average number of common shares outstanding – basic and diluted   201,892,596       120,017,120       13,659,944  
                       

Gevo, Inc.
Condensed Consolidated Statements of Operations Information
(Unaudited, in thousands, except share and per share amounts)

  Year Ended December 31,
    2021       2020       2019  
Revenue and cost of goods sold          
Ethanol sales and related products, net $ 50     $ 3,809     $ 22,115  
Hydrocarbon revenue   483       1,501       2,338  
Other revenue   178       226       34  
Total revenues   711       5,536       24,487  
           
Cost of goods sold (exclusive of depreciation shown below)   7,687       9,313       30,286  
Depreciation and amortization   4,478       5,690       6,447  
           
Gross loss   (11,454 )     (9,467 )     (12,246 )
           
Operating Expenses          
Research and development expense   6,775       3,511       3,868  
Selling, general and administrative expense   25,493       11,192       9,823  
Preliminary stage project costs   10,581       1,698       205  
Loss on disposal of assets   5,137       625       4  
Depreciation and amortization   650       214       209  
Restructuring expense         254        
Total operating expenses   48,636       17,494       14,109  
           
Loss from operations   (60,090 )     (26,961 )     (26,355 )
           
Other income (expense)          
Gain on forgiveness of SBA Loans   641              
Interest expense   (251 )     (2,094 )     (2,738 )
Interest and dividend income   571       102       33  
(Loss) on modification of 2020 Notes         (732 )      
(Loss) on conversion of 2020/21 Notes to common stock         (1,916 )      
(Loss) from change in fair value of 2020/21 Notes embedded derivative liability         (8,607 )     394  
Other income (expense), net   (74 )     22       6  
Total other income (expense)   887       (13,225 )     (2,305 )
           
Net loss $ (59,203 )   $ (40,186 )   $ (28,660 )
           
Net loss per share – basic and diluted $ (0.30 )   $ (0.71 )   $ (2.35 )
           
Weighted-average number of common shares outstanding – basic and diluted   195,794,606       56,881,586       12,177,906  
           

Gevo, Inc.
Condensed Consolidated Statements of Comprehensive Income
(Unaudited, in thousands, except share and per share amounts)

  Three Months Ended December 31,
    2021       2020       2019  
           
Net Loss $ (16,513 )   $ (18,054 )   $    (6,815 )
Other comprehensive income (loss):          
Unrealized (loss) on available-for-sale securities, net of tax   (262 )            
Adjustment for net (loss) realized and included in net income   (56 )            
Total change in unrealized (loss) on marketable debt securities   (318 )            
           
Comprehensive loss $ (16,831 )   $ (18,054 )   $    (6,815 )
           
           
  Year Ended December 31,
    2021       2020       2020  
           
Net Loss $ (59,203 )   $ (40,186 )   $ (28,660 )
Other comprehensive income (loss):          
Unrealized (loss) on available-for-sale securities, net of tax   (524 )            
Adjustment for net (loss) realized and included in net income   (90 )            
Total change in unrealized (loss) on marketable debt securities   (614 )            
           
Comprehensive loss $ (59,817 )   $ (40,186 )   $ (28,660 )
           

Gevo, Inc.
Condensed Consolidated Statements of Stockholders’ Equity Information
(Unaudited, in thousands, except share amounts)

  Common Stock   Paid-In Capital
 
  Comprehensive Loss
 
  Accumulated Deficit
 
  Stockholders’ Equity
 
Shares   Amount
                       
Balance, December 31, 2018 8,640,583   $ 86   $ 518,027     $     $ (429,326 )   $ 88,787  
                       
Issuance of common stock, net of issue costs 3,965,688     40     11,317                   11,357  
Non-cash stock-based compensation         1,221                   1,221  
Issuance of common stock under stock plans, net of taxes 1,476,961     15     (216 )                 (201 )
Net loss                     (28,660 )     (28,660 )
                       
Balance, December 31, 2019 14,083,232     141     530,349             (457,986 )     72,504  
                       
Issuance of common stock and common stock warrants, net of issue costs 46,290,808     463     69,614                   70,077  
Issuance of common stock upon exercise of warrants 53,678,400     537     16,545                   17,082  
Issuance of common stock upon conversion of 2020/21 Notes 9,842,080     99     24,958                   25,057  
Issuance of common stock in exchange for services rendered 101,730     1     93                   94  
Non-cash stock-based compensation         2,101                   2,101  
Issuance of common stock under stock plans, net of taxes 4,142,061     41     (391 )                 (350 )
Net loss                     (40,186 )     (40,186 )
                       
Balance December 31, 2020 128,138,311     1,282     643,269             (498,172 )     146,379  
                       
Issuance of common stock, net of issue costs 68,170,579     682     456,765                   457,447  
Issuance of common stock upon exercise of warrants 1,866,758     18     1,103                   1,121  
Non-cash stock-based compensation         7,700                   7,700  
Issuance of common stock under stock plans, net of taxes 3,813,014     38     (5,613 )                 (5,575 )
Other comprehensive loss               (614 )           (614 )
Net loss                     (59,203 )     (59,203 )
                       
Balance, December 31, 2021 201,988,662   $ 2,020   $ 1,103,224     $ (614 )   $ (557,375 )   $ 547,255  


Gevo, Inc.
Condensed Consolidated Cash Flow Information
(Unaudited, in thousands)

    Three Months Ended December 31,
      2021       2020       2019  
Operating Activities             
Net loss   $     (16,513 )   $ (18,054 )   $ (6,815 )
Adjustments to reconcile net loss to net cash used in operating activities:            
Loss from change in fair value of 2020/21 Notes embedded derivative liability                   8,578        
Loss on conversion of 2020/21 Notes to common stock           1,373             –  
Loss on disposal of assets           587       23  
Stock-based compensation          4,051       778       411  
Depreciation and amortization          1,556       1,150       1,807  
Non-cash lease expense     45             17       23  
Non-cash interest expense                    (28 )              155       257  
Changes in operating assets and liabilities:            
Accounts receivable     (271 )     (157 )     (757 )
Inventories     (409 )     295       (239 )
Prepaid expenses and other current assets, deposits and other assets                  1,330       1,395       (1,801 )
Accounts payable, accrued expenses and long-term liabilities     (4,604 )     (874 )     1,050  
Net cash used in operating activities     (14,843 )     (4,757 )     (6,041 )
              
Investing Activities            
Acquisitions of property, plant and equipment     (28,707 )     (4,149 )     (210 )
Acquisition of patents                (170 )            
Proceeds from sale marketable securities                45,242                              –  
Proceeds from sale of property, plant and equipment                                 13     
Net cash used in investing activities           16,365       (4,149 )     (197 )
                
Financing Activities               
Debt and equity offering costs     (36 )     (200 )     (54 )
Proceeds from issuance of common stock and common stock warrants                   1,824       6,429              1,942  
Proceeds from the exercise of warrants                        2                  435        
Net settlement of common stock under stock plans                (1,904 )     (19 )      
Payment of loans payable – other     (56 )     (20 )     (292 )
Payment of finance lease liabilities             (1,492 )                       (2 )                   –  
Net cash provided by financing activities     (1,662 )     6,623             1,596  
             
Net (decrease) in cash and cash equivalents and restricted cash              (140 )     (2,283 )     (4,642 )
              
Cash, cash equivalents and restricted cash             
Beginning of period     136,173               80,621              20,944  
             
End of period   $ 136,033     $ 78,338     $ 16,302  
             

Gevo, Inc.
Condensed Consolidated Cash Flow Information
(Unaudited, in thousands)

    Year to Date December 31,
      2021       2020       2019  
Operating Activities            
Net loss   $ (59,203 )   $ (40,186 )   $ (28,660 )
Adjustments to reconcile net loss to net cash used in operating activities:            
Loss (gain) from change in fair value of 2020/21 Notes and 2020 Notes embedded derivative liability        –       8,607       (394 )
Loss on conversion of 2020/21 Notes to common stock           1,916        
Loss on disposal of assets     5,137            625       4  
(Gain) on forgiveness of SBA Loans     (641 )            
Stock-based compensation     9,874       2,125       1,349  
Depreciation and amortization     5,128       5,904       6,656  
Non-cash lease expense     52       62       48  
Non-cash interest expense                      37       761       1,346  
Changes in operating assets and liabilities:            
Accounts receivable     (257 )     608       (609 )
Inventories     (259 )     945       (35 )
Prepaid expenses and other current assets, deposits and other assets          (3,133 )       782       (1,824 )
Accounts payable, accrued expenses and long-term liabilities     (271 )     (1,487 )     1,280  
Net cash used in operating activities     (43,536 )     (19,338 )     (20,839 )
                
Investing Activities               
Acquisitions of property, plant and equipment     (59,662 )     (5,905 )     (5,989 )
Acquisition of patents            (9,170 )            
Proceeds from sale marketable securities     79,574                              –  
Purchase of marketable securities          (422,362 )            
Proceeds from sale of property, plant and equipment                –                              32     
Investment in Juhl                 (1,500 )
Net cash used in investing activities     (411620 )     (5,905 )     (7,457 )
                
Financing Activities               
Proceeds from issuance of 2021 Bonds              68,995              
Debt and equity offering costs     (34,955 )     (6,370 )     (232 )
Proceeds from issuance of common stock and common stock warrants     489,373         76,414       11,589  
Proceeds from the exercise of warrants     1,121             17,082        
Net settlement of common stock under stock plans     (7,041 )     (350 )                   (201 )
Payment of loans payable – other     (154 )     (501 )     (292 )
Payment of finance lease liabilities                (4,488 )                       (2 )                   –  
Proceeds from SBA Loans                   1,006        
Net cash provided by financing activities     512,851            87,279       10,864  
             
Net increase (decrease) in cash and cash equivalents and restricted cash     57,695            62,036       (17,432 )
                
Cash, cash equivalents and restricted cash               
Beginning of period     78,338             16,302       33,734  
             
End of period   $ 136,033     $ 78,338     $ 16,302  
             

Gevo, Inc.
Reconciliation of GAAP to Non-GAAP Financial Information
(Unaudited, in thousands, except share and per share amounts)

  Three Months Ended December 31,
Non-GAAP Cash EBITDA:   2021       2020       2019  
             
Loss from operations $ (16,478 )   $ (7,587 )     $ (6,250 )
Stock-based compensation           4,051                 778                   411  
Depreciation and amortization   1,556       1,150                   1,807  
Non-GAAP cash EBITDA $ (10,871 )   $ (5,659 )     $ (4,032 )
           
Non-GAAP Adjusted Net Loss:          
Net loss $ (16,513 )   $ (18,054 )   $ (6,819 )
Adjustments:          
(Loss) on conversion of 2020/21 Notes to common stock         (1,373 )        
(Loss) from change in fair value of 2020/21 Notes embedded derivative liability         (8,578 )      
Total adjustments         (9,951 )        
Non-GAAP Net Income (Loss) $ (16,513 )   $ (8,103 )     $ (6,819 )
Non-GAAP adjusted net loss per share – basic and diluted $ (0.08 )   $ (0.07 )     $ (0.50 )
Weighted-average number of common shares outstanding – basic and diluted   201,892,596       120,017,120         13,659,944  
           
Non-GAAP Cash EBITDA: Years Ended December 31,
    2021       2020         2019  
           
Loss from operations $ (60,090 )   $ (26,961 )     $ (26,355 )
Stock-based compensation           9,874       2,125       1,349  
Depreciation and amortization   5,128       5,904         6,656  
Non-GAAP cash EBITDA $ (45,088 )   $ (18,932 )     $ (18,350 )
           
Non-GAAP Adjusted Net Loss:          
Net loss          
Net loss $ (59,203 )   $ (40,186 )   $ (28,660 )
Adjustments:          
(Loss) on conversion of 2020/21 Notes to common stock         (1,916 )        
(Loss) from change in fair value of 2020/21 Notes and 2020 Notes embedded derivative liability         (8,607 )     394  
Total adjustments         (10,523 )       394  
Non-GAAP Net Income (Loss) $ (59,203 )   $ (29,663 )     $ (29,054 )
Non-GAAP adjusted net loss per share – basic and diluted $ (0.30 )   $ (0.52 )     $ (2.39 )
Weighted-average number of common shares outstanding – basic and diluted   195,794,606       56,881,586         12,177,906  
           

Investor and Media Contact
Heather Manuel
+1 720-418-0085
IR@gevo.com

Genco Shipping (GNK) – Results Slightly Short of Estimates But Positive Outlook Intact

Friday, February 25, 2022

Genco Shipping (GNK)
Results Slightly Short of Estimates But Positive Outlook Intact

Genco Shipping & Trading Limited, incorporated on September 27, 2004, transports iron ore, coal, grain, steel products and other drybulk cargoes along shipping routes through the ownership and operation of drybulk carrier vessels. The Company is engaged in the ocean transportation of drybulk cargoes around the world through the ownership and operation of drybulk carrier vessels. As of December 31, 2016, its fleet consisted of 61 drybulk carriers, including 13 Capesize, six Panamax, four Ultramax, 21 Supramax, two Handymax and 15 Handysize drybulk carriers, with an aggregate carrying capacity of approximately 4,735,000 deadweight tons (dwt). Of the vessels in its fleet, 15 are on spot market-related time charters, and 27 are on fixed-rate time charter contracts. As of December 31, 2016, additionally, 19 of the vessels in its fleet were operating in vessel pools.

Poe Fratt, Senior Research Analyst, Noble Capital Markets, Inc.

Refer to the full report for the price target, fundamental analysis, and rating.

    Robust 4Q2021 Results and Dividend Slightly Short of Estimates Due to Higher Costs. Reported EBITDA of $102.3 million was short of our EBITDA estimate of $109.2 million due to lower TCE rates and higher operating expenses. TCE rates of $35.2k/day were $800 below our estimate of $36.0k/day. Based on total ownership days and versus our estimates, operating costs of $5,766k/day were $666 higher and G&A expenses of $1,755/day were $417 higher. As a result, the 4Q2021 dividend of $0.67/share was below our estimate of $0.80/share.

    Fine tuning 2022 EBITDA and dividend estimates.  Forward cover of 87% of 4Q2021 days booked at ~$24.2k/day creates a solid base and the quarter should be solid even though the BCI and BSI weakened over the past quarter before rebounding ahead of Chinese New Year. Our 2022 EBITDA estimate increases to $261.5 million from $249.4 million based on TCE rates of $24.5k/day, but our 2022 dividend estimate …


This research is provided by Noble Capital Markets, Inc., a FINRA and S.E.C. registered broker-dealer (B/D).

*Analyst certification and important disclosures included in the full report. NOTE: investment decisions should not be based upon the content of this research summary.  Proper due diligence is required before making any investment decision. 

Release – Gray Reports Solid 2021 Performance and is Poised for a Strong 2022


Gray Reports Solid 2021 Performance and is Poised for a Strong 2022

Research, News, and Market Data on Gray Television


ATLANTA, Feb. 25, 2022 (GLOBE NEWSWIRE) — Gray Television, Inc. (“Gray,” “we,” “us” or “our”) (NYSE: GTN) today announced financial results for the fourth quarter ended December 31, 2021. While the quarter did not include political advertising revenue at the robust levels experienced in the fourth quarter of 2020, our total revenues of $721 million were strong for an off-year of the two-year political advertising cycle, and higher than our anticipated results due to continued improvement in economic conditions and our acquisition of the Local Media Group of Meredith Corporation on December 1, 2021, and Quincy Media on August 2, 2021. Most notably, in the fourth quarter 2021 our combined local and national broadcast advertising revenue, excluding political advertising revenue (“Total Core Revenue”) increased by 26%, and our retransmission consent revenue increased by 35%. Our total revenue for the year ended December 31, 2021 was $2.4 billion, the highest we have ever reported.

Due to the significant effect that material transactions have had on our results of our operations, we present the financial information herein consistent with both U.S. Generally Accepted Accounting Principles (“GAAP” or “As Reported Basis”) and on a Combined Historical Basis (“CHB”), which incorporates certain historical results of acquired businesses, less the historical results of divested businesses. We also furnish certain other detailed non-GAAP metrics to provide more meaningful period-over-period comparisons to assist the public in its analysis and valuation of the Company. This additional information includes a summary of incremental expenses that were specific to our acquisitions, divestitures, and related financing activities (“Transaction Related Expenses”), non-cash stock-based compensation expenses and certain non-GAAP terms common in our industry. Please refer to the detailed discussion of the foregoing terms and concepts included elsewhere herein.

Summary of Operating Results

As Reported Basis (the respective 2021 periods reflect the “off-year” of the two year political advertising cycle):

For the fourth quarter of 2021:

  • Total revenue was $721 million, a decrease of 9% from the fourth quarter of 2020, primarily due to the cyclical decline in political advertising revenue.

  • Net income attributable to common stockholders was $16 million, or $0.17 per fully diluted share, a decrease of 92% from the fourth quarter of 2020. Excluding Transaction Related Expenses and non-cash stock compensation totaling $59 million, our net income attributable to common stockholders would have been $60 million.

  • Broadcast Cash Flow was $258 million, a decrease of 39% from the fourth quarter of 2020.

  • Adjusted EBITDA was $224 million, a decrease of 45% from the fourth quarter of 2020.

For the full year 2021:

  • Revenue was $2.4 billion, an increase of 1% from 2020, marking our highest ever annual revenue.

  • Net income attributable to common stockholders was $38 million, a decrease of 89% from 2020. Excluding Transaction Related Expenses and non-cash stock compensation totaling $95 million, our net income attributable to common stockholders would have been $109 million.

  • Broadcast Cash Flow was $813 million, a decrease of 19% from 2020.

  • Adjusted EBITDA was $739 million, a decrease of 21% from 2020.

Combined Historical Basis (the respective 2021 periods reflect the “off-year” of the two year political advertising cycle):

For the fourth quarter of 2021:

  • Revenue was $857 million, a decrease of 24% from the fourth quarter of 2020. Total Core Revenue increased by 11% from the fourth quarter of 2020.

  • Broadcast Cash Flow was $311 million, a decrease of 50% from the fourth quarter of 2020.

For the full year 2021:

  • Revenue was $3.2 billion, a decrease of 6% from 2020. Total Core Revenue increased by 18% from 2020.

  • Broadcast Cash Flow was $1.1 billion, a decrease of 24% from 2020.

Other Key Metrics

  • As of December 31, 2021, our Total Leverage Ratio, Net of all Cash, was 5.47 times on a trailing eight-quarter basis, netting our total cash balance of $189 million and giving effect to all Transaction Related Expenses.

  • During the fourth quarter of 2021, we repurchased 1,501,088 shares of our common stock at an average price of $19.98 per share, including commissions, for a total cost of approximately $30 million. We have not repurchased any shares since the close of the fourth quarter. Currently, we have 87,742,758 common shares and 7,560,937 Class A common shares outstanding and $174 million remaining under our share repurchase authorization.

  • Throughout 2021 and 2020, we incurred Transaction Related Expenses on an As Reported Basis that included but were not limited to legal and professional fees, severance and incentive compensation and contract termination fees. In addition, we recorded certain non-cash stock-based compensation expenses. These expenses are summarized as follows (in millions):

Three Months Ended

Year Ended

December 31,

December 31,

2021

2020

2021

2020

Transaction Related Expenses:

Broadcasting

$

3

$

$

3

$

Corporate and administrative

52

1

71

1

Miscellaneous expense

7

Total Transaction Related Expenses

$

55

$

1

$

81

$

1

Total non-cash stock-based compensation

$

4

$

4

$

14

$

16

Taxes

  • During 2021 and 2020, we made aggregate federal and state income tax payments (net of refunds) of $149 million and $70 million, respectively. During 2022, we anticipate making income tax payments (net of refunds) within a range of $170 million to $190 million.

  • As of December 31, 2021, we have $10 million of federal operating loss carryforwards, which we expect to utilize in 2022. In addition, we have an aggregate of $424 million of various state operating loss carryforwards, of which we expect that approximately half will be utilized.

Guidance for the Three-Months Ending March 31, 2022

Based on our current forecasts for the quarter ending March 31, 2022, we anticipate the following key financial results, as outlined below in approximate ranges. We present revenue net of agency commissions. We present operating expenses net of depreciation, amortization and gain/loss on disposal of assets.

  • Revenue:

    • Local revenue of $270 to $275 million, and national revenue of $81 to $86 million.

      • Total Core Revenue of $351 to $361 million, which reflects an increase by 0% to 3% on a Combined Historical Basis.

    • Retransmission revenue of $380 to $385 million.

    • Political revenue of $20 to $25 million.

    • Production company revenue of $20 to $22 million.

    • Total revenue of $789 to $812 million.

  • Operating Expenses:

    • Broadcasting expenses of $535 to $545 million, including retransmission expense of approximately $225 million and transaction related expenses of approximately $3 million and non-cash stock-based compensation expense of approximately $1 million.

    • Production company expenses of approximately $25 million.

    • Corporate expenses of $29 to $33 million, including transaction related expenses of approximately $1 million and non-cash stock-based compensation expense of approximately $4 million.

Selected Operating Data on As Reported Basis (Unaudited)

Three Months Ended December 31,

2021

2020

% Change
2021 to
2020

2019

% Change
2021 to
2019

(dollars in millions)

Revenue (less agency commissions):

Broadcasting

$

692

$

763

(9

)%

$

554

25

%

Production companies

29

29

0

%

25

16

%

Total revenue

$

721

$

792

(9

)%

$

579

25

%

Political advertising revenue

$

20

$

245

(92

)%

$

38

(47

)%

Operating expenses (1):

Broadcasting

$

449

$

355

26

%

$

339

32

%

Production companies

$

23

$

20

15

%

$

17

35

%

Corporate and administrative

$

84

$

18

367

%

$

21

300

%

Net income

$

29

$

224

(87

)%

$

94

(69

)%

Non-GAAP Cash Flow (2):

Broadcast Cash Flow

$

258

$

424

(39

)%

$

229

13

%

Broadcast Cash Flow Less Cash Corporate Expenses

$

177

$

409

(57

)%

$

212

(17

)%

Free Cash Flow

$

59

$

300

(80

)%

$

108

(45

)%

Year Ended December 31,

2021

2020

% Change
2021 to
2020

2019

% Change
2021 to
2019

(dollars in millions)

Revenue (less agency commissions):

Broadcasting

$

2,340

$

2,320

1

%

$

2,035

15

%

Production companies

73

61

20

%

87

(16

)%

Total revenue

$

2,413

$

2,381

1

%

$

2,122

14

%

Political advertising revenue

$

44

$

430

(90

)%

$

68

(35

)%

Operating expenses (1):

Broadcasting

$

1,548

$

1,340

16

%

$

1,325

17

%

Production companies

$

62

$

52

19

%

$

74

(16

)%

Corporate and administrative

$

159

$

65

145

%

$

104

53

%

Net income

$

90

$

410

(78

)%

$

179

(50

)%

Non-GAAP Cash Flow (2):

Broadcast Cash Flow

$

813

$

999

(19

)%

$

729

12

%

Broadcast Cash Flow Less Cash Corporate Expenses

$

666

$

945

(30

)%

$

636

5

%

Free Cash Flow

$

238

$

559

(57

)%

$

273

(13

)%

(1) Excludes depreciation, amortization and gain on disposal of assets, net.
(2) See definition of non-GAAP terms and a reconciliation of the non-GAAP amounts to net income included herein.


Selected Operating Data for the Fourth Quarter of 2021 on As Reported Basis
(Unaudited)

Three Months Ended December 31,

2021

2020

Amount

Percent

Percent

Percent

Increase

Increase

Amount

of Total

Amount

of Total

(Decrease)

(Decrease)

(dollars in millions)

Revenue (less agency commissions):

Local (including internet/digital/mobile)

$

277

38

%

$

222

28

%

$

55

25

%

National

82

11

%

62

8

%

20

32

%

Political

20

3

%

245

31

%

(225

)

(92

)%

Retransmission consent

294

41

%

217

27

%

77

35

%

Production companies

29

4

%

29

4

%

0

%

Other

19

3

%

17

2

%

2

12

%

Total

$

721

100

%

$

792

100

%

$

(71

)

(9

)%

Total local and national revenue

combined (“Total Core Revenue”)

$

359

50

%

$

284

36

%

$

75

26

%

Operating Expenses (before

depreciation, amortization and

gain on disposal of assets, net):

Broadcasting:

Station expenses

$

274

61

%

$

230

65

%

$

44

19

%

Retransmission expense

171

38

%

125

35

%

46

37

%

Transaction Related Expenses

3

1

%

0

%

3

Non-cash stock-based compensation

1

0

%

0

%

1

Total broadcasting expense

$

449

100

%

$

355

100

%

$

94

26

%

Production companies expense

$

23

$

20

$

3

15

%

Corporate and administrative:

Corporate expenses

$

29

35

%

$

13

72

%

$

16

123

%

Transaction Related Expenses

52

61

%

1

6

%

51

5100

%

Non-cash stock-based compensation

3

4

%

4

22

%

(1

)

(25

)%

Total corporate and

administrative expense

$

84

100

%

$

18

100

%

$

66

367

%

Selected Operating Data for the Full Year 2021 on As Reported Basis
(Unaudited)

Year Ended December 31,

2021

2020

Amount

Percent

Percent

Percent

Increase

Increase

Amount

of Total

Amount

of Total

(Decrease)

(Decrease)

(dollars in millions)

Revenue (less agency commissions):

Local (including internet/digital/mobile)

$

934

39

%

$

771

32

%

$

163

21

%

National

256

11

%

198

8

%

58

29

%

Political

44

2

%

430

18

%

(386

)

(90

)%

Retransmission consent

1,049

43

%

867

36

%

182

21

%

Production companies

73

3

%

61

3

%

12

20

%

Other

57

2

%

54

3

%

3

6

%

Total

$

2,413

100

%

$

2,381

100

%

$

32

1

%

Total Core Revenue

$

1,190

50

%

$

969

40

%

$

221

23

%


Operating Expenses (before

depreciation, amortization and

gain on disposal of assets, net):

Broadcasting:

Station expenses

$

928

60

%

$

839

63

%

$

89

11

%

Retransmission expense

615

40

%

496

37

%

119

24

%

Transaction Related Expenses

3

0

%

0

%

3

Non-cash stock-based compensation

2

0

%

5

0

%

(3

)

(60

)%

Total broadcasting expense

$

1,548

100

%

$

1,340

100

%

$

208

16

%

Production companies expense

$

62

$

52

$

10

19

%

Corporate and administrative:

Corporate expenses

$

76

48

%

$

53

81

%

$

23

43

%

Transaction Related Expenses

71

45

%

1

2

%

70

7000

%

Non-cash stock-based compensation

12

7

%

11

17

%

1

9

%

Total corporate and

administrative expense

$

159

100

%

$

65

100

%

$

94

145

%


Detail Table of Operating Results on As Reported Basis
(Unaudited)

Three Months Ended

Year Ended

December 31,

December 31,

2021

2020

2021

2020

(in millions, except for net income per share data)

Revenue (less agency commissions):

Broadcasting

$

692

$

763

$

2,340

$

2,320

Production companies

29

29

73

61

Total revenue (less agency commissions)

721

792

2,413

2,381

Operating expenses before depreciation, amortization and gain on

disposal of assets, net:

Broadcasting

449

355

1,548

1,340

Production companies

23

20

62

52

Corporate and administrative

84

18

159

65

Depreciation

28

27

104

96

Amortization of intangible assets

36

27

117

105

(Gain) loss on disposal of assets, net

(4

)

(6

)

42

(29

)

Operating expenses

616

441

2,032

1,629

Operating income

105

351

381

752

Other (expense) income:

Miscellaneous (expense) income, net

(1

)

(8

)

(5

)

Interest expense

(62

)

(48

)

(205

)

(191

)

Loss on early extinguishment of debt

(12

)

(12

)

Income before income tax

42

291

168

544

Income tax expense

13

67

78

134

Net income

29

224

90

410

Preferred stock dividends

13

13

52

52

Net income attributable to common stockholders

$

16

$

211

$

38

$

358

Basic per share information:

Net income attributable to common stockholders

$

0.17

$

2.24

$

0.40

$

3.73

Weighted-average shares outstanding

95

94

95

96

Diluted per share information:

Net income attributable to common stockholders

$

0.17

$

2.22

$

0.40

$

3.69

Weighted-average shares outstanding

95

95

95

97

Selected Operating Data on Combined Historical Basis (Unaudited)

Three Months Ended December 31,

2021

2020

% Change
2021 to
2020

2019

% Change
2021 to
2019

(dollars in millions)

Revenue (less agency commissions):

Broadcast

$

828

$

1,104

(25

)%

$

774

7

%

Production companies

29

30

(3

)%

25

16

%

Total revenue

$

857

$

1,134

(24

)%

$

799

7

%

Political advertising revenue

$

25

$

383

(93

)%

$

45

(44

)%

Operating expenses (1):

Broadcast

$

536

$

518

3

%

$

481

11

%

Production companies

$

23

$

21

10

%

$

17

35

%

Corporate and administrative

$

84

$

18

367

%

$

20

320

%

Non-GAAP Cash Flow (2):

Broadcast Cash Flow

$

311

$

624

(50

)%

$

336

(7

)%

Broadcast Cash Flow Less Cash Corporate Expenses

$

230

$

609

(62

)%

$

319

(28

)%

Operating Cash Flow as Defined in our Senior Credit Agreement

$

285

$

609

(53

)%

$

320

(11

)%

Free Cash Flow

$

139

$

423

(67

)%

$

168

(17

)%

Year Ended December 31,

2021

2020

% Change
2021 to
2020

2019

% Change
2021 to
2019

(dollars in millions)

Revenue (less agency commissions):

Broadcast

$

3,080

$

3,291

(6

)%

$

2,854

8

%

Production companies

73

61

20

%

87

(16

)%

Total revenue

$

3,153

$

3,352

(6

)%

$

2,941

7

%

Political advertising revenue

$

60

$

652

(91

)%

$

79

(24

)%

Operating expenses (1):

Broadcast

$

2,059

$

1,923

7

%

$

1,885

9

%

Production companies

$

62

$

53

17

%

$

74

(16

)%

Corporate and administrative

$

160

$

65

146

%

$

104

54

%

Non-GAAP Cash Flow (2):

Broadcast Cash Flow

$

1,105

$

1,459

(24

)%

$

1,121

(1

)%

Broadcast Cash Flow Less Cash Corporate Expenses

$

958

$

1,405

(32

)%

$

1,028

(7

)%

Operating Cash Flow as Defined in our Senior Credit Agreement

$

1,029

$

1,403

(27

)%

$

1,060

(3

)%

Free Cash Flow

$

443

$

809

(45

)%

$

533

(17

)%

(1) Excludes depreciation, amortization and gain on disposal of assets, net.
(2) See definition of non-GAAP terms and a reconciliation of the non-GAAP amounts to net income included herein.

Selected Operating Data for the Fourth Quarter of 2021 on Combined Historical Basis
(Unaudited)

Three Months Ended December 31,

2021

2020

Amount

Percent

Percent

Percent

Increase

Increase

Amount

of Total

Amount

of Total

(Decrease)

(Decrease)

(dollars in millions)

Revenue (less agency commissions):

Local (including internet/digital/mobile)

$

317

37

%

$

287

25

%

$

30

10

%

National

105

12

%

92

8

%

13

14

%

Political

25

3

%

383

34

%

(358

)

(93

)%

Retransmission consent

358

42

%

319

28

%

39

12

%

Production companies

29

3

%

30

3

%

(1

)

(3

)%

Other

23

3

%

23

2

%

0

%

Total

$

857

100

%

$

1,134

100

%

$

(277

)

(24

)%

Total Core Revenue

$

422

49

%

$

379

33

%

$

43

11

%

Operating Expenses (before

depreciation, amortization and

gain on disposal of assets, net):

Broadcasting:

Station expenses

$

321

60

%

$

331

64

%

$

(10

)

(3

)%

Retransmission expense

211

39

%

186

36

%

25

13

%

Transaction Related Expenses

3

1

%

0

%

3

Non-cash stock-based compensation

1

0

%

1

0

%

Total broadcasting expense

$

536

100

%

$

518

100

%

$

18

3

%

Production companies expense

$

23

$

21

$

2

10

%

Corporate and administrative:

Corporate expenses

$

29

35

%

$

13

72

%

$

16

123

%

Transaction Related Expenses

52

61

%

1

6

%

51

5100

%

Non-cash stock-based compensation

3

4

%

4

22

%

(1

)

(25

)%

Total corporate and

administrative expense

$

84

100

%

$

18

100

%

$

66

367

%

Selected Operating Data for the Full Year 2021 on Combined Historical Basis
(Unaudited)

Year Ended December 31,

2021

2020

Amount

Percent

Percent

Percent

Increase

Increase

Amount

of Total

Amount

of Total

(Decrease)

(Decrease)

(dollars in millions)

Revenue (less agency commissions):

Local (including internet/digital/mobile)

$

1,158

37

%

$

1,000

30

%

$

158

16

%

National

357

11

%

289

9

%

68

24

%

Political

60

2

%

652

19

%

(592

)

(91

)%

Retransmission consent

1,429

45

%

1,276

38

%

153

12

%

Production companies

73

2

%

61

2

%

12

20

%

Other

76

3

%

74

2

%

2

3

%

Total

$

3,153

100

%

$

3,352

100

%

$

(199

)

(6

)%

Total Core Revenue

$

1,515

48

%

$

1,289

38

%

$

226

18

%

Operating Expenses (before

depreciation, amortization and

gain on disposal of assets, net):

Broadcasting:

Station expenses

$

1,210

59

%

$

1,184

62

%

$

26

2

%

Retransmission expense

842

41

%

732

38

%

110

15

%

Transaction Related Expenses

3

0

%

0

%

3

Non-cash stock-based compensation

4

0

%

7

0

%

(3

)

(43

)%

Total broadcasting expense

$

2,059

100

%

$

1,923

100

%

$

136

7

%

Production companies expense

$

62

$

53

$

9

17

%

Corporate and administrative:

Corporate expenses

$

77

48

%

$

53

81

%

$

24

45

%

Transaction Related Expenses

71

44

%

1

2

%

70

7000

%

Non-cash stock-based compensation

12

8

%

11

17

%

1

9

%

Total corporate and

administrative expense

$

160

100

%

$

65

100

%

$

95

146

%

Other Financial Data,
As Reported Basis

As of December 31,

2021

2020

(in millions)

Cash

$

189

$

773

Long-term debt, including current portion, less deferred

financing costs

$

6,755

$

3,974

Series A perpetual preferred stock

$

650

$

650

Borrowing availability under senior credit facility

$

497

$

200

Year Ended December 31,

2021

2020

(in millions)

Net cash provided by operating activities

$

300

$

652

Net cash used in investing activities

(3,534

)

(211

)

Net cash provided by financing activities

2,650

120

Net (decrease) increase in cash

$

(584

)

$

561

Additional Information

The Company

We are a multimedia company headquartered in Atlanta, Georgia. We are the nation’s largest owner of top-rated local television stations and digital assets in the United States. Our television stations serve 113 television markets that collectively reach approximately 36 percent of US television households. This portfolio includes 80 markets with the top-rated television station and 100 markets with the first and/or second highest rated television station. We also own video program companies Raycom Sports, Tupelo Honey, PowerNation Studios and Third Rail Studios.

Cautionary Statements for Purposes of the “Safe Harbor” Provisions of the Private Securities Litigation Reform Act

This press release contains certain forward-looking statements that are based largely on our current expectations and reflect various estimates and assumptions by us. These statements are statements other than those of historical fact and may be identified by words such as “estimates,” “expect,” “anticipate,” “will,” “implied,” “assume” and similar expressions. Forward-looking statements are subject to certain risks, trends and uncertainties that could cause actual results and achievements to differ materially from those expressed in such forward-looking statements. Such risks, trends and uncertainties, which in some instances are beyond our control, include our inability to achieve expected synergies from recent transactions on a timely basis or at all, the impact of recently completed transactions, estimates of future revenue, future expenses and other future events. We are subject to additional risks and uncertainties described in our quarterly and annual reports filed with the Securities and Exchange Commission from time to time, including in the “Risk Factors,” and “Management’s Discussion and Analysis of Financial Condition and Results of Operations” sections contained therein, which reports are made publicly available via our website, www.gray.tv. Any forward-looking statements in this press release should be evaluated in light of these important risk factors. This press release reflects management’s views as of the date hereof. Except to the extent required by applicable law, Gray undertakes no obligation to update or revise any information contained in this press release beyond the published date, whether as a result of new information, future events or otherwise.

Conference Call Information

We will host a conference call to discuss our fourth quarter operating results on February 25, 2022. The call will begin at 11:00 a.m. Eastern Time. The live dial-in number is 1-855-493-3489 and the confirmation code is 8667075. The call will be webcast live and available for replay at www.gray.tv. The taped replay of the conference call will be available at 1-855-859-2056, Confirmation Code is 8667075 until March 25, 2022.

Gray Contacts

Web site: www.gray.tv

Hilton H. Howell, Jr., Executive Chairman and Chief Executive Officer, 404-266-5513

Pat LaPlatney, President and Co-Chief Executive Officer, 334-206-1400

Jim Ryan, Executive Vice President and Chief Financial Officer, 404-504-9828

Kevin P. Latek, Executive Vice President, Chief Legal and Development Officer, 404-266-8333

Effects of Acquisitions and Divestitures on Our Results of Operations and Non-GAAP Terms

From January 1, 2019 through December 31, 2021, we completed several acquisition and divestiture transactions. As more fully described in our Form 10-K to be filed with the Securities and Exchange Commission today and in our prior disclosures, these transactions materially affected our operations. We refer to the 2021 Acquisitions collectively with all other television stations acquired or divested on or subsequent to January 1, 2019 as the “Acquisitions”.

Due to the significant effect that the Acquisitions have had on our results of operations, and in order to provide more meaningful period over period comparisons, we present herein certain financial information on a Combined Historical Basis (or “CHB”). Combined Historical Basis financial information does not include any adjustments for other events attributable to the Acquisitions unless otherwise described. Certain of the Combined Historical Basis financial information has been derived from, and adjusted based on unaudited, unreviewed financial information prepared by other entities, which Gray cannot independently verify. We cannot assure you that such financial information would not be materially different if such information were audited or reviewed and no assurances can be provided as to the accuracy of such information, or that our actual results would not differ materially from the Combined Historical Basis financial information if the Acquisitions had been completed at the stated date. In addition, the presentation of Combined Historical Basis may not comply with United Stated Generally Accepted Accounting Principles (“GAAP”) or the requirements for proforma financial information under Regulation S-X under the Securities Act.

From time to time, we supplement our financial results prepared in accordance with GAAP by disclosing the non-GAAP financial measures Broadcast Cash Flow, Broadcast Cash Flow Less Cash Corporate Expenses, Operating Cash Flow as defined in the Senior Credit Agreement, Free Cash Flow, Adjusted EBITDA and Total Leverage Ratio, Net of All Cash. These non-GAAP amounts are used by us to approximate amounts used to calculate key financial performance covenants contained in our debt agreements and are used with our GAAP data to evaluate our results and liquidity.

We define Broadcast Cash Flow as net income or loss plus loss on early extinguishment of debt, non-cash corporate and administrative expenses, non-cash stock-based compensation, depreciation and amortization (including amortization of intangible assets and program broadcast rights), any loss on disposal of assets, any miscellaneous expense, interest expense, any income tax expense, non-cash 401(k) expense, Broadcast Transactions Related Expenses and broadcast other adjustments less any gain on disposal of assets, any miscellaneous income, any income tax benefits and payments for program broadcast rights.

We define Broadcast Cash Flow Less Cash Corporate Expenses as net income or loss plus loss on early extinguishment of debt, non-cash stock-based compensation, depreciation and amortization (including amortization of intangible assets and program broadcast rights), any loss on disposal of assets, any miscellaneous expense, interest expense, any income tax expense, non-cash 401(k) expense, Transaction Related Expenses and other adjustments less any gain on disposal of assets, any miscellaneous income, any income tax benefits and payments for program broadcast rights.

We define Operating Cash Flow as defined in our Senior Credit Agreement as net income or loss plus loss on early extinguishment of debt, non-cash stock-based compensation, depreciation and amortization (including amortization of intangible assets and program broadcast rights), any loss on disposal of assets, any miscellaneous expense, interest expense, any income tax expense, non-cash 401(k) expense, Transaction Related Expenses, other adjustments, certain pension expenses, synergies and other adjustments less any gain on disposal of assets, any miscellaneous income, any income tax benefits, payments for program broadcast rights, pension income and contributions to pension plans.

Operating Cash Flow as defined in our Senior Credit Agreement gives effect to the revenue and broadcast expenses of all completed acquisitions and divestitures as if they had been acquired or divested, respectively, on January 1, 2019. It also gives effect to certain operating synergies expected from the acquisitions and related financings and adds back professional fees incurred in completing the acquisitions. Certain of the financial information related to the acquisitions has been derived from, and adjusted based on, unaudited, un-reviewed financial information prepared by other entities, which Gray cannot independently verify. We cannot assure you that such financial information would not be materially different if such information were audited or reviewed and no assurances can be provided as to the accuracy of such information, or that our actual results would not differ materially from this financial information if the acquisitions had been completed on the stated date. In addition, the presentation of Operating Cash Flow as defined in the Senior Credit Agreement and the adjustments to such information, including expected synergies resulting from such transactions, may not comply with GAAP or the requirements for pro forma financial information under Regulation S-X under the Securities Act of 1933.

We define Free Cash Flow as net income or loss, plus loss on early extinguishment of debt, non-cash stock-based compensation, depreciation and amortization (including amortization of intangible assets and program broadcast rights), any loss on disposal of assets, any miscellaneous expense, any income tax expense, non-cash 401(k) expense, Transactions Related Expenses, broadcast other adjustments, certain pension expenses, synergies, other adjustments and amortization of deferred financing costs less any gain on disposal of assets, any miscellaneous income, any income tax benefits, payments for program broadcast rights, pension income, contributions to pension plans, preferred dividends, purchase of property and equipment (net of reimbursements and certain defined purchases) and income taxes paid (net of any refunds received and certain defined payments).

We define Adjusted EBITDA as net income or loss, plus loss on early extinguishment of debt, non-cash stock-based compensation, depreciation and amortization of intangible assets, any loss on disposal of assets, any miscellaneous expense, interest expense, any income tax expense, non-cash 401(k) expense, Transaction Related Expenses less any gain on disposal of assets, any miscellaneous income and any income tax benefits.

Our Total Leverage Ratio, Net of All Cash is determined by dividing our Adjusted Total Indebtedness, Net of All Cash, by our Operating Cash Flow as defined in our Senior Credit Agreement, divided by two. Our Adjusted Total Indebtedness, Net of All Cash, represents the total outstanding principal of our long-term debt, plus certain other obligations as defined in our Senior Credit Agreement, less all cash (excluding restricted cash). Our Operating Cash Flow, as defined in our Senior Credit Agreement, divided by two, represents our average annual Operating Cash Flow as defined in our Senior Credit Agreement for the preceding eight quarters.

We define Transaction Related Expenses as incremental expenses incurred specific to acquisitions and divestitures, including but not limited to legal and professional fees, severance and incentive compensation, and contract termination fees. We present certain line items from our selected operating data, net of Transaction Related Expenses, in order to present a more meaningful comparison between periods of our operating expenses and our results of operations.

These non-GAAP terms are not defined in GAAP and our definitions may differ from, and therefore may not be comparable to, similarly titled measures used by other companies, thereby limiting their usefulness. Such terms are used by management in addition to, and in conjunction with, results presented in accordance with GAAP and should be considered as supplements to, and not as substitutes for, net income and cash flows reported in accordance with GAAP.

Reconciliation of Non-GAAP Terms on As Reported Basis, in millions:

Three Months Ended

December 31,

2021

2020

2019

Net income

$

29

$

224

$

94

Adjustments to reconcile from net income to

Free Cash Flow:

Depreciation

28

27

20

Amortization of intangible assets

36

27

29

Non-cash stock-based compensation

4

4

6

Non-cash 401(k) expense, excluding corporate portion

7

6

5

Gain on disposal of assets, net

(4

)

(6

)

(27

)

Miscellaneous expense, net

1

Interest expense

62

48

54

Loss on early extinguishment of debt

12

Income tax expense

13

67

32

Amortization of program broadcast rights

12

10

9

Payments for program broadcast rights

(11

)

(10

)

(10

)

Corporate and administrative expenses before

depreciation, amortization of intangible assets and

non-cash stock-based compensation

81

15

17

Broadcast Cash Flow

258

424

229

Corporate and administrative expenses excluding

depreciation, amortization of intangible assets and

non-cash stock-based compensation

(81

)

(15

)

(17

)

Broadcast Cash Flow Less Cash Corporate Expenses

177

409

212

Interest expense

(62

)

(48

)

(54

)

Amortization of deferred financing costs

2

2

2

Preferred stock dividends

(13

)

(13

)

(13

)

Common stock dividends

(8

)

Purchase of property and equipment (1)

(35

)

(40

)

(37

)

Reimbursements of property and equipment purchases

1

10

9

Income taxes paid, net of refunds (2)

(3

)

(20

)

(11

)

Free Cash Flow

$

59

$

300

$

108

(1) Excludes approximately $18 million related to the Assembly Atlanta project in the fourth quarter of 2021.
(2) Excludes approximately $17 million of income tax payments related to the Meredith Divestiture and the Quincy Divestiture in the fourth quarter of 2021.

Reconciliation of Non-GAAP Terms on As Reported Basis, in millions:

Year Ended

December 31,

2021

2020

2019

Net income

$

90

$

410

$

179

Adjustments to reconcile from net income to

Free Cash Flow:

Depreciation

104

96

80

Amortization of intangible assets

117

105

115

Non-cash stock-based compensation

14

16

16

Non-cash 401(k) expense, excluding corporate portion

8

6

5

Loss (gain) on disposal of assets, net

42

(29

)

(54

)

Miscellaneous expense (income), net

8

5

(4

)

Interest expense

205

191

227

Loss on early extinguishment of debt

12

Income tax expense

78

134

76

Amortization of program broadcast rights

38

38

39

Payments for program broadcast rights

(38

)

(39

)

(43

)

Corporate and administrative expenses before

depreciation, amortization of intangible assets and

non-cash stock-based compensation

147

54

93

Broadcast Cash Flow

813

999

729

Corporate and administrative expenses before

depreciation, amortization of intangible assets and

non-cash stock-based compensation

(147

)

(54

)

(93

)

Broadcast Cash Flow Less Cash Corporate Expenses

666

945

636

Contributions to pension plans

(4

)

(3

)

(3

)

Interest expense

(205

)

(191

)

(227

)

Amortization of deferred financing costs

11

11

11

Preferred stock dividends

(52

)

(52

)

(52

)

Common stock dividends

(31

)

Purchase of property and equipment (1)

(98

)

(110

)

(110

)

Reimbursements of property and equipment purchases

11

29

41

Income taxes paid, net of refunds (2)

(60

)

(70

)

(23

)

Free Cash Flow

$

238

$

559

$

273

(1) Excludes approximately $109 million related to the Assembly Atlanta project in 2021.
(2) Excludes approximately $89 million of income tax payments related to the Meredith Divestiture and the Quincy Divestiture in 2021.

Reconciliation of Non-GAAP Terms on a Combined Historical Basis, in millions:


Three Months Ended

December 31,

2021

2020

2019

Net income

$

57

$

364

$

110

Adjustments to reconcile from net income to

Free Cash Flow:

Depreciation

32

34

28

Amortization of intangible assets

37

29

33

Non-cash stock based compensation

4

5

6

Non-cash 401(k) expense, excluding corporate portion

7

6

5

(Gain) loss on disposal of assets, net

(2

)

(5

)

2

Miscellaneous expense, net

1

1

Interest expense

78

78

78

Loss from early extinguishment of debt

12

Income tax expense

9

66

30

Amortization of program broadcast rights

14

15

14

Payments for program broadcast rights

(14

)

(14

)

(15

)

Corporate and administrative expenses before

depreciation, amortization of intangible assets and

non-cash stock-based compensation

81

15

17

Broadcast Transaction Related Expenses

3

7

Broadcast other adjustments

4

18

21

Broadcast Cash Flow

311

624

336

Corporate and administrative expenses before

depreciation, amortization of intangible assets and

non-cash stock-based compensation

(81

)

(15

)

(17

)

Broadcast Cash Flow Less Cash Corporate Expenses

230

609

319

Adjustments for unrestricted subsidiaries

3

Corporate Transaction Related Expenses

52

1

Operating Cash Flow as Defined in Senior Credit Facility

285

609

320

Interest expense

(78

)

(78

)

(78

)

Amortization of deferred financing costs

3

3

3

Preferred dividends

(13

)

(13

)

(13

)

Common stock dividends

(8

)

Purchase of property and equipment (1)

(37

)

(46

)

(51

)

Reimbursement of purchases of property and equipment

1

11

12

Income taxes paid, net of refunds (2)

(14

)

(63

)

(25

)

Free Cash Flow

$

139

$

423

$

168

(1) Excludes approximately $18 million related to the Assembly Atlanta project in the fourth quarter of 2021.
(2) Excludes approximately $17 million of income tax payments related to the Meredith Divestiture and the Quincy Divestiture in the fourth quarter of 2021.

Reconciliation of Non-GAAP Terms on a Combined Historical Basis, in millions:

Year Ended

December 31,

2021

2020

2019

Net income

$

265

$

635

$

310

Adjustments to reconcile from net income to

Free Cash Flow:

Depreciation

128

128

111

Amortization of intangible assets

123

114

127

Non-cash stock-based compensation

16

18

17

Non-cash 401(k) expense, excluding corporate portion

8

6

5

Gain on disposal of assets, net

(10

)

(32

)

(41

)

Miscellaneous expense (income), net

8

27

(5

)

Interest expense

311

311

311

Loss from early extinguishment of debt

12

Income tax expense

46

117

65

Amortization of program broadcast rights

55

58

60

Payments for program broadcast rights

(56

)

(59

)

(64

)

Corporate and administrative expenses excluding

depreciation, amortization of intangible assets and

non-cash stock-based compensation

147

54

93

Broadcast Transaction Related Expenses

3

45

Broadcast other adjustments

61

70

87

Broadcast Cash Flow

1,105

1,459

1,121

Corporate and administrative expenses excluding

depreciation, amortization of intangible assets and

non-cash stock-based compensation

(147

)

(54

)

(93

)

Broadcast Cash Flow Less Cash Corporate Expenses

958

1,405

1,028

Contributions to pension plans

(4

)

(3

)

(3

)

Adjustments for unrestricted subsidiaries

4

Corporate Transaction Related Expenses

71

1

35

Operating Cash Flow as Defined in Senior Credit Facility

1,029

1,403

1,060

Interest expense

(311

)

(311

)

(311

)

Amortization of deferred financing costs

12

12

12

Preferred dividends

(52

)

(52

)

(52

)

Common stock dividends

(31

)

Purchase of property and equipment (1)

(107

)

(127

)

(154

)

Reimbursement of purchases of property and equipment

13

36

55

Income taxes paid, net of refunds (2)

(110

)

(152

)

(77

)

Free Cash Flow

$

443

$

809

$

533

(1) Excludes approximately $109 million related to the Assembly Atlanta project in 2021.
(2) Excludes approximately $89 million of income tax payments related to the Meredith Divestiture and the Quincy Divestiture in 2021.

Reconciliation of Net Income on As Reported Basis to Adjusted EBITDA and the Effect of Transaction Related Expenses and Certain Non-cash Expenses, in millions except for per share information:

Three Months Ended

Year Ended

December 31,

December 31,

2021

2020

2021

2020

Net income

$

29

$

224

$

90

$

410

Adjustments to reconcile from net income to

Adjusted EBITDA:

Depreciation

28

27

104

96

Amortization of intangible assets

36

27

117

105

Non-cash stock-based compensation

4

4

14

16

(Gain) loss on disposal of assets, net

(4

)

(6

)

42

(29

)

Miscellaneous expense, net

1

8

5

Interest expense

62

48

205

191

Loss on early extinguishment of debt

12

12

Income tax expense

13

67

78

134

Total

169

403

658

940

Add: Transaction Related Expenses

55

1

81

1

Adjusted EBITDA

$

224

$

404

$

739

$

941

Net income attributable to common stockholders

$

16

$

211

$

38

$

358

Add: Transaction Related Expenses and non-cash

stock-based compensation

59

5

95

17

Less: Income tax expense related to Transaction Related

Expenses and non-cash stock-based compensation

(15

)

(1

)

(24

)

(4

)

Net income attributable to common stockholders – excluding Transaction Related Expenses and non-cash stock-based compensation

$

60

$

215

$

109

$

371

Net income attributable to common stockholders per common share, diluted – excluding Transaction Related Expenses and non-cash stock-based compensation

$

0.63

$

2.26

$

1.15

$

3.82

Diluted weighted-average shares outstanding

95

95

95

97


Reconciliation of Total Leverage Ratio, Net of All Cash, in millions except for ratio:

Eight Quarters Ended

December 31, 2021

Net income

$

500

Adjustments to reconcile from net income to operating cash flow as

defined in our Senior Credit Agreement:

Depreciation

200

Amortization of intangible assets

222

Non-cash stock-based compensation

30

Non-cash 401(k) expense, excluding corporate portion

15

Loss on disposal of assets, net

13

Interest expense

396

Loss on early extinguishment of debt

12

Income tax expense

212

Amortization of program broadcast rights

75

Payments for program broadcast rights

(77)

Pension gain

(3)

Contributions to pension plan

(7)

Adjustments for unrestricted subsidiaries

3

Adjustments for stations acquired or divested, financings and expected

synergies during the eight quarter period

759

Transaction Related Expenses

82

Operating Cash Flow, as defined in our Senior Credit Agreement

$

2,432

Operating Cash Flow, as defined in our Senior Credit Agreement,

divided by two

$

1,216

December 31, 2021

Adjusted Total Indebtedness:

Total outstanding principal, including current portion

$

6,835

Letters of Credit Outstanding

3

Cash

(189)

Adjusted Total Indebtedness, Net of All Cash

$

6,649

Total Leverage Ratio, Net of All Cash

5.47