Release – ACCO Brands Corporation Announces Appointment of Joe Burton to Board of Directors


ACCO Brands Corporation Announces Appointment of Joe Burton to Board of Directors

Research, News, and Market Data on ACCO Brands

08/15/2022

LAKE ZURICH, Ill.–(BUSINESS WIRE)– ACCO Brands Corporation (NYSE: ACCO) today announced that Joe Burton has been appointed to its Board of Directors.

In his current role as Chief Executive Officer for Telesign Corp., Mr. Burton leads an organization that services global enterprises by connecting, protecting and defending their digital identities. Prior to his current role, he served as President, Chief Executive Officer, and a member of the Board of Poly (formerly Plantronics), a company that provides premium audio, video and conferencing products for businesses and consumers. Previously, Mr. Burton held various executive management, engineering leadership, strategy and architecture-level positions at Polycom, Cisco Systems, Inc. and Active Voice Corporation.

Boris Elisman, Chairman and Chief Executive Officer, ACCO Brands, commented, “We are excited to have Joe join our Board of Directors. Technology is becoming a more significant part of our product portfolio. Joe’s extensive expertise in technology and product development, as well as success driving digital transformation, growth acceleration and corporate/go-to-market strategies, will help guide us in our transformation journey to transition to a global consumer and brand-driven products company.”

About
ACCO Brands

ACCO Brands, the Home of Great Brands Built by Great People, designs, manufactures and markets consumer and end-user products that help people work, learn, play and thrive. Our widely recognized brands include AT-A-GLANCE®, Five Star®, Kensington®, Leitz®, Mead®, PowerA®, Swingline®, Tilibra® and many others. More information about ACCO Brands Corporation (NYSE: ACCO) can be found at www.accobrands.com.

Christopher McGinnis
Investor Relations
(847) 796-4320

Julie McEwan
Media Relations
(937) 974-8162

Source: ACCO Brands Corporation


The More Impactful Fed Moves May Not Make Headline News


Image Credit: Stuart Richards (Flickr)


Is Quantitative Tightening Impacting the Economy on the QT?

The Fed has begun to reduce the trillions it has added to its balance
sheet
. With each dollar it added to the economy over the past two years, there was a new dollar available to provide capital for growth and investment. Or a new dollar to help hold borrowing costs down. Quantitative
tightening
(QT) is out of the spotlight relative to overnight bank lending rates. Yet, QT could have a much greater economic impact on all markets, from real estate to stocks, and more directly fixed income.

There is less understanding of QT. The Federal Reserve’s effort to shrink its balance sheet after buying trillions in bonds is somewhat complicated and less visible. But, although QT is on the quieter side of what is shaping tomorrow’s economy, investors need to know how shrinking the balance sheet, the other tightening, impacts investments.

The Fed stopped its bond purchases in May. That is to say, they stopped buying bonds that injected money into the system. This is referred to as quantitative easing (QE).

In June, after a period of tapering its purchases, the central bank began QT> Then it announced it would partially unwind roughly $4.5 trillion that had previously been purchased. The Fed officially said that it would start by letting up to $30 billion in US treasuries and $17.5 billion in mortgage-backed securities (MBS) mature out of its holdings (balance sheet). During the previous months, it would have reinvested the maturing amount and even added to the purchases.  The announcement was, beginning in September, it’s shrinking the balance sheet could increase to $60 billion maturing bonds not rolled in treasuries and 35 billion not reinvested in MBS securities. Fed Chairman Jerome Powell shared a plan lasting 2½ years, which implies the Fed’s $9 trillion balance sheet could shrink by as much as $2.5 trillion. Roughly half of what was added to support the economy during the pandemic.


Lack of Awareness

The financial news likes to keep it simple. And quantitative tightening isn’t simple, so its impact isn’t reported to the extent that an overnight increase, which is easier to understand, is presented. With QT, there is no prior hype asking “what is the Fed going to do?” and there is little certainty to what they have done. It just happens, no fanfare, no commentary.

Historically, this kind of tightening has been attempted only once before, and it was derailed. The transparent Fed is ridiculed and criticized when it removes economic stimulus. So there may not be a strong overall belief that the Fed will actually remove the trillions of extra money now floating around and creating economic opportunity by inflating asset prices.   Also, overnight rate increases are much easier for economists to model and news for mass public consumption to report on.

So, the news of QT is underreported and ignored. What is being reported is a strong doubt that the Fed is following through on its balance-sheet tightening plan, particularly with MBS. For those that have looked at the Federal Reserve’s balance sheet, the doubt is not without cause.

Barron’s spoke with a senior trader on the Fed’s open markets desk. This is what the well-respected investment publication was told. The Fed is conducting QT as it has said it would. The trader said people are confused because it looks like the Fed’s MBS holdings aren’t decreasing and even may be increasing.

The trader told Barrons that the saw-toothed pattern in the Fed’s MBS holdings is the result of accounting issues. First, there is a gap between when MBS purchases settle and when holders of MBS receive payments. Second, the Fed has a three-month window for settling MBS purchases. The Fed is the largest single investor in the MBS market, the Fed has the option of delaying settlements if it thinks that will create a better functioning market.

In effect, this means MBS purchased by the Fed, as it does when it reinvests pay downs, could just be showing up. QE ended, but if there are pay downs in excess of the Feds goal of runoff, the excess is reinvested. The settlement dates differ and cause the appearance of a balance sheet that may have grown. This isn’t the case, and investors need to know that longer-term interest rates are being tightened.

The Fed senior trader warned something is apt to break, not unlike what happened the last time the Fed tried QT, and chaos in the repo market prompted an early end to the return to “normalcy.” But he was more optimistic as he said the Treasury may be more supportive in smoothing the process of reducing liquidity while not disrupting markets.


Take Away

If quantitative easing (QE) mattered, then quantitative tightening should too. It isn’t reported on as prominently as direct interest rate hikes, but the impact is the direct inverse to what allowed so much economic growth. So, the savvy investor will pay attention, which may give them an edge. For the Fed to bring inflation back to 2%, the Federal Reserve would need to shrink its balance sheet by the almost $4 to $5 trillion it increased it a short time ago. This could increase longer-term interest rates by far more than the announced increases in short-term rates.

Paul Hoffman

Managing Editor, Channelchek

Suggested Content


Powell’s Economic Soft Landing Requires More Room to Change his Mind


Bond Market Understanding is Again Critical for Stock Investors


What is the Fed’s Balance Sheet


What is Quantitative Tightening


Sources

https://www.federalreserve.gov/monetarypolicy/bst_recenttrends.htm

https://www.barrons.com/articles/intel-chip-stocks-to-buy-now-51660333062

https://en.wikipedia.org/wiki/Quantitative_tightening

Stay up to date. Follow us:


Release – Lineage to Present at H.C. Wainwright & Co. 2nd Annual Virtual Ophthalmology Conference


Lineage to Present at H.C. Wainwright & Co. 2nd Annual Virtual Ophthalmology Conference

Research, News, and Market Data on Lineage Cell Therapeutics

CARLSBAD, Calif.–(
)–Lineage Cell
Therapeutics, Inc.
 (NYSE American and TASE: LCTX), a clinical-stage biotechnology company developing allogeneic cell therapies for unmet medical needs, announced today Brian M. Culley, Lineage’s Chief Executive Officer, will present at the H.C. Wainwright
2nd Annual Ophthalmology Virtual Conference
, in a fireside chat hosted by Joseph Pantginis, Ph.D., Director of Research; Managing Director, Equity Research, H. C. Wainwright & Co. LLC. The fireside chat will be available to investors on demand, starting on August 17th, 2022 at 7am ET.

Interested parties can register to view on-demand replay on the Events and
Presentations
 section of Lineage’s website. Additional videos are available on the Media page of the Lineage website.

About Lineage Cell Therapeutics, Inc.

Lineage Cell Therapeutics is a clinical-stage biotechnology company developing novel cell therapies for unmet medical needs. Lineage’s programs are based on its robust proprietary cell-based therapy platform and associated in-house development and manufacturing capabilities. With this platform Lineage develops and manufactures specialized, terminally differentiated human cells from its pluripotent and progenitor cell starting materials. These differentiated cells are developed to either replace or support cells that are dysfunctional or absent due to degenerative disease or traumatic injury or administered as a means of helping the body mount an effective immune response to cancer. Lineage’s clinical programs are in markets with billion dollar opportunities and include five allogeneic (“off-the-shelf”) product candidates: (i) OpRegen, a retinal pigment epithelial cell therapy in development for the treatment of geographic atrophy secondary to age-related macular degeneration, is being developed under a worldwide collaboration with Roche and Genentech, a member of the Roche Group; (ii) OPC1, an oligodendrocyte progenitor cell therapy in Phase 1/2a development for the treatment of acute spinal cord injuries; (iii) VAC2, a dendritic cell therapy produced from Lineage’s VAC technology platform for immuno-oncology and infectious disease, currently in Phase 1 clinical development for the treatment of non-small cell lung cancer; (iv) ANP1, an auditory neuronal progenitor cell therapy for the potential treatment of auditory neuropathy; and (v) PNC1, a photoreceptor neural cell therapy for the treatment of vision loss due to photoreceptor dysfunction or damage. For more information, please visit www.lineagecell.com or follow the company on Twitter @LineageCell.

Contacts

Lineage Cell Therapeutics, Inc. IR
Ioana C. Hone
(
ir@lineagecell.com)
(442) 287-8963

Russo Partners – Media Relations
Nic Johnson or David Schull
Nic.johnson@russopartnersllc.com
David.schull@russopartnersllc.com
(212) 845-4242


Direct Digital Holdings (DRCT) – A “Colossal” Quarter

Friday, August 12, 2022

Direct Digital Holdings (DRCT)
A “Colossal” Quarter

Michael Kupinski, Director of Research, Noble Capital Markets, Inc.

Patrick McCann, Research Associate, Noble Capital Markets, Inc.

Refer to the full report for the price target, fundamental analysis, and rating.

Q2 exceeded even our expectations. The company reported Q2 revenue of $21.3 million, 33% above our forecast of $16 million. Adj. EBITDA of $3.6 million topped our estimate of $2.6 million by an impressive 37%. We believe that our estimates were the highest on the Street.

Sell-side growth was “Colossal”. The strong quarter was fueled by better-than-expected growth from Colossus SSP, which constitutes the company’s Sell-side segment. Segment revenue of $11.9 million exceeded our forecast by nearly 76%, marking a 477% increase from the prior year period’s $2.1 million.

This Company Sponsored Research is provided by Noble Capital Markets, Inc., a FINRA and S.E.C. registered broker-dealer (B/D).

*Analyst certification and important disclosures included in the full report. NOTE: investment decisions should not be based upon the content of this research summary. Proper due diligence is required before making any investment decision. 

Release – Alvopetro Announces Record Funds Flow from Operations for the Second Quarter of 2022 & Q2 Results Webcast


Alvopetro Announces Record Funds Flow from Operations for the Second Quarter of 2022 & Q2 Results Webcast

Research, News, and Market Data on Alvopetro Energy

Aug 11, 2022

CALGARY, AB, Aug. 11, 2022 /CNW/ – Alvopetro Energy Ltd. (TSXV: ALV) (OTCQX: ALVOF) announces operating and financial results for the second quarter of 2022 including record funds flow from operations of $12.4 million. We will host a live webcast to discuss Q2 2022 results on Friday August 12, 2022 beginning at 8:00 am Mountain time.

All references herein to $ refer to United States dollars, unless otherwise stated and all tabular amounts are in thousands of United States dollars, except as otherwise noted.

Financial and Operating Highlights – Second Quarter of 2022

  • Daily sales averaged 2,359 boepd in Q2 2022, consistent with the Q2 2021 average of 2,361 boepd and a 6% reduction from the Q1 2022 average of 2,501 boepd as a result of a planned five-day shut-down of our gas processing facility to complete necessary work in advance of the facility expansion.
  • On February 1, 2022, our contracted natural gas price under our long-term gas sales agreement increased 48% to Brazilian real (“BRL”)1.94/m3. With all natural gas sales in Q2 2022 at this higher price and an appreciation of the BRL relative to the USD compared to Q2 2021, our average realized natural gas price increased to $11.90/Mcf compared to the Q2 2021 average price of $6.06/Mcf and the Q1 2022 average price of $10.03/Mcf. Higher commodity prices resulted in a 93% increase in our natural gas, condensate and oil revenue compared to Q2 2021.
  • With higher realized sales prices, our operating netback increased to $63.96 per boe in Q2 2022, an improvement of 103% from Q2 2021 and 19% from Q1 2022.
  • We generated cash flows from operating activities of $13.0 million ($0.38 per basic share and $0.35 per diluted share) and funds flows from operations of $12.4 million ($0.37 per basic share and $0.34 per diluted share), increases of $7.3 million and $7.0 million, respectively compared to Q2 2021.
  • We reported net income of $6.6 million, an increase of $2.8 million compared to Q2 2021.
  • Capital expenditures totaled $6.3 million, focused on drilling costs for our 182-C1 and 183-B1 wells, long lead purchases, final costs for our Murucututu field production facility installation on other development costs on our Murucututu project.
  • We repaid an additional $2.5 million of our credit facility, bringing the balance outstanding to $2.5 million. As at June 30, 2022, we had a net working capital surplus of $11.6 million, including $13.7 million in cash and cash equivalents. The Company’s working capital net of our credit facility balance improved to $9.1 million, compared to $7.3 million as of March 31, 2022.
  • Effective August 1, 2022 our natural gas price has been set at BRL1.94/m3 or $11.28/Mcf (based on our average heat content to date of 107% and the July 31, 2022 BRL/USD foreign exchange rate of 5.19). The adjusted price is based on the ceiling price in the contract, which was adjusted to $10.22/MMBtu effective August 1, 2022. While the ceiling price increased by 6% from the February 1, 2022 ceiling price, due to the appreciation of the BRL relative to the USD in the first half of 2022 compared to the latter half of 2021, the BRL denominated contractual price remained consistent. This price will be effective for all natural gas sales from August 1, 2022 to January 31, 2023.

The following table provides a summary of Alvopetro’s financial and operating results for three and six months ended June 30, 2022 and June 30, 2021. The consolidated financial statements with the Management’s Discussion and Analysis (“MD&A) are available on our website at www.alvopetro.com and will be available on the System for Electronic Document Analysis and Retrieval (SEDAR) website at www.sedar.com.

As at and Three Months EndedJune 30,

As at and Six Months EndedJune 30,

2022

2021

Change (%)

2022

2021

Change (%)

Financial

($000s, except where noted)

Natural gas, oil and condensate sales

15,787

8,182

93

29,759

15,121

97

Net income – restated(1)

6,631

3,784

75

17,746

2,837

526

      Per share – basic restated ($)(1)(2)

0.20

0.11

82

0.52

0.09

478

      Per share – diluted restated ($)(1)(2)

0.18

0.11

64

0.49

0.08

513

Cash flow from operating activities

12,997

5,665

129

21,330

9,969

114

      Per share – basic ($)(2)

0.38

0.17

124

0.63

0.30

110

      Per share – diluted ($)(2)

0.35

0.16

119

0.59

0.29

103

Funds flow from operations (3)

12,434

5,471

127

23,338

10,227

128

      Per share – basic ($)(2)

0.37

0.16

131

0.69

0.31

123

      Per share – diluted ($)(2)

0.34

0.16

113

0.64

0.30

113

Dividends declared

2,728

5,444

Per share(2)

0.08

0.16

Capital expenditures

6,338

918

590

10,138

1,782

469

Cash and cash equivalents

13,672

4,249

222

13,672

4,249

222

Net working capital surplus (3)

11,641

4,499

159

11,641

4,499

159

Working capital, net of debt (net debt)(3)

9,096

(3,046)

9,096

(3,046)

Weighted average shares outstanding

      Basic (000s)(2)

33,973

33,265

2

33,941

33,250

2

      Diluted (000s)(2)

36,637

34,339

7

36,426

34,075

7

Operations

Natural gas, NGLs and crude oil sales:

      Natural gas (Mcfpd)

13,546

13,512

13,940

12,991

7

      NGLs – condensate (bopd)

97

105

(8)

98

101

(3)

      Oil (bopd)

5

5

8

2

300

      Total (boepd)

2,359

2,361

2,429

2,269

7

Average realized prices(3):

      Natural gas ($/Mcf)

11.90

6.06

96

10.94

5.88

86

      NGL – condensate ($/bbl)

121.93

74.47

64

114.11

69.65

64

      Oil ($/bbl)

94.47

59.63

58

83.90

59.63

41

      Company total ($/boe)

73.54

38.08

93

67.68

36.82

84

Operating netback ($/boe)(3)

      Realized sales price

73.54

38.08

93

67.68

36.82

84

      Royalties

(5.35)

(2.82)

90

(4.84)

(3.05)

59

      Production expenses

(4.23)

(3.68)

15

(4.00)

(3.66)

9

      Operating netback

63.96

31.58

103

58.84

30.11

95

Operating netback margin(3)

87 %

83 %

5

87 %

82 %

6

Notes:

(1)

The 2021 comparative periods in the table above have been restated. See “Restatement of the 2021 Comparative Period” section within the MD&A and Note 14 of the unaudited interim condensed consolidated financial statements for the three and six months ended June 30, 2022 for further details.

(2)

Per share amounts are based on weighted average shares outstanding other than dividends per share, which is based on the number of common shares outstanding at each dividend record date. The weighted average number of diluted common shares outstanding in the computation of funds flow from operations and cash flows from operating activities per share is the same as for net income per share.

(3)

See “Non-GAAP and
Other Financial Measures
” section within this news release.


Second Quarter 2022 Results Webcast

Alvopetro will host a live webcast to discuss Q2 2022 financial results at 8:00 am Mountain time on August 12, 2022. Details for joining the event are as follows:

Date: August 12, 2022Time: 8:00 AM Mountain/10:00 AM Eastern
Linkhttps://us06web.zoom.us/j/89887067576Dial-in
Numbers
https://us06web.zoom.us/u/kSVhrrkB0Webinar
ID: 
898 8706 7576

The webcast will include a question-and-answer period. Online participants will be able to ask questions through the Zoom portal. Dial-in participants can email questions directly to socialmedia@alvopetro.com.

Corporate Presentation

Alvopetro’s updated corporate presentation is available on our website at: http://www.alvopetro.com/corporate-presentation

Social Media

Follow Alvopetro on our social media channels at the following links:

Twitter – https://twitter.com/AlvopetroEnergy Instagram – 
https://www.instagram.com/alvopetro/ LinkedIn – 
https://www.linkedin.com/company/alvopetro-energy-ltd

Alvopetro Energy Ltd.’s vision is to become a
leading independent upstream and midstream operator in 
Brazil. Our
strategy is to unlock the on-shore natural gas potential in the state of Bahia
in 
Brazil,
building off the development of our Caburé natural gas field and our strategic
midstream infrastructure.

Neither the TSX Venture Exchange nor its Regulation Services
Provider (as that term is defined in the policies of the TSX Venture Exchange)
accepts responsibility for the adequacy or accuracy of this news release.

All amounts contained in this new release are in United States dollars,
unless otherwise stated and all tabular amounts are in thousands of 
United States dollars,
except as otherwise noted.

Abbreviations:

boepd

=

barrels of oil equivalent (“boe”) per day

bopd

=

barrels of oil and/or natural gas liquids (condensate) per day

BRL

=

Brazilian Real

m3

=

cubic metre

Mcf

=

thousand cubic feet

Mcfpd

=

thousand cubic feet per day

MMcf

=

million cubic feet

MMcfpd

=

million cubic feet per day

NGLs

=

natural gas liquids

Q1 2022

=

three months ended March 31, 2022

Q2 2021

=

three months ended June 30, 2021

Q2 2022

=

three months ended June 30, 2022


Non-GAAP and Other Financial Measures

This news release contains references to various non-GAAP financial measures, non-GAAP ratios, capital management measures and supplementary financial measures as such terms are defined in National Instrument 52-112 Non-GAAP and Other Financial Measures Disclosure. Such measures are not recognized measures under GAAP and do not have a standardized meaning prescribed by IFRS and might not be comparable to similar financial measures disclosed by other issuers. While these measures may be common in the oil and gas industry, the Company’s use of these terms may not be comparable to similarly defined measures presented by other companies. The non-GAAP and other financial measures referred to in this report should not be considered an alternative to, or more meaningful than measures prescribed by IFRS and they are not meant to enhance the Company’s reported financial performance or position. These are complementary measures that are used by management in assessing the Company’s financial performance, efficiency and liquidity and they may be used by investors or other users of this document for the same purpose. Below is a description of the non-GAAP financial measures, non-GAAP ratios, capital management measures and supplementary financial measures used in this news release. For more information with respect to financial measures which have not been defined by GAAP, including reconciliations to the closest comparable GAAP measure, see the “Non-GAAP
Measures and Other Financial Measures
” section of the Company’s MD&A which may be accessed through the SEDAR website at www.sedar.com.

Non-GAAP Financial Measures

Operating netback

Operating netback is calculated as natural gas, oil and condensate revenues less royalties and production expenses. This calculation is provided in the “Operating Netback” section of the Company’s MD&A using our IFRS measures. The Company’s MD&A may be accessed through the SEDAR website at www.sedar.com. Operating netback is a common metric used in the oil and gas industry used to demonstrate profitability from operations.

Non-GAAP Financial Ratios

Operating netback per boe

Operating netback is calculated on a per unit basis, which is per barrel of oil equivalent (“boe”). It is a common non-GAAP measure used in the oil and gas industry and management believes this measurement assists in evaluating the operating performance of the Company. It is a measure of the economic quality of the Company’s producing assets and is useful for evaluating variable costs as it provides a reliable measure regardless of fluctuations in production. Alvopetro calculated operating netback per boe as operating netback divided by total sales volumes (barrels of oil equivalent). This calculation is provided in the “Operating Netback” section of the Company’s MD&A using our IFRS measures. The Company’s MD&A may be accessed through the SEDAR website at www.sedar.com. Operating netback is a common metric used in the oil and gas industry used to demonstrate profitability from operations on a per unit basis (boe).

Operating netback margin

Operating netback margin is calculated as operating netback per boe divided by the realized sales price per boe. Operating netback margin is a measure of the profitability per boe relative to natural gas, oil and condensate sales revenues per boe and is calculated as follows:

Three Months EndedJune 30,

Six Months EndedJune 30,

2022

2021

2022

2021

Operating netback – $ per boe

63.96

31.58

58.84

30.11

Average realized price – $ per boe

73.54

38.08

67.68

36.82

Operating netback margin

87 %

83 %

87 %

82 %


Funds Flow from Operations Per Share

Funds flow from operations per share is a non-GAAP ratio that includes all cash generated from operating activities and is calculated before changes in non-cash working capital, divided by the weighted the weighted average shares outstanding for the respective period. For the periods reported in this news release the cash flows from operating activities per share and funds flow from operations per share is as follows:

Three Months EndedJune 30,

Six Months EndedJune 30,

$ per share

2022

2021

2022

2021

Per basic share:

Cash flows from operating activities

0.38

0.17

0.63

0.30

Funds flow from operations

0.37

0.16

0.69

0.31

Per diluted share:

Cash flows from operating activities

0.35

0.16

0.58

0.29

Funds flow from operations

0.34

0.16

0.64

0.30


Capital Management Measures

Funds Flow from Operations 

Funds flow from operations is a non-GAAP capital management measure that includes all cash generated from operating activities and is calculated before changes in non-cash working capital. The most comparable GAAP measure to funds flow from operations is cash flows from operating activities. Management considers funds flow from operations important as it helps evaluate financial performance and demonstrates the Company’s ability to generate sufficient cash to fund future growth opportunities. Funds flow from operations should not be considered an alternative to, or more meaningful than, cash flows from operating activities however management finds that the impact of working capital items on the cash flows reduces the comparability of the metric from period to period. A reconciliation of funds flow from operations to cash flows from operating activities is as follows:

Three Months EndedJune 30,

Six Months EndedJune 30,

2022

2021

2022

2021

Cash flows from operating activities

12,997

5,665

21,330

9,969

Add back changes in non-cash working capital

(563)

(194)

2,008

258

Funds flow from operations

12,434

5,471

23,338

10,227


Net Working Capital

Net working capital is computed as current assets less current liabilities. Net working capital is a measure of liquidity, is used to evaluate financial resources, and is calculated as follows: 

As at June 30,

2022

2021

Total current assets

21,461

8,413

Total current liabilities

(9,820)

(3,914)

Net working capital surplus

11,641

4,499


Working Capital Net of Debt (Net Debt)

Working capital net of debt is computed as net working capital surplus decreased by the carrying amount of the Credit Facility. Working capital net of debt is used by management to assess the Company’s overall financial position. As of June 30, 2022, Alvopetro’s net working capital surplus exceeds the balance outstanding on the Credit Facility.

As at June 30,

2022

2021

Net working capital surplus

11,641

4,499

Credit Facility, balance outstanding

(2,545)

(7,545)

Working capital, net of debt (net debt)

9,096

(3,046)


Supplementary Financial Measures

Average realized natural gas price – $/Mcf” is comprised of natural gas sales as determined in accordance with IFRS, divided by the Company’s natural gas sales volumes.

Average realized NGL – condensate price – $/bbl” is comprised of condensate sales as determined in accordance with IFRS, divided by the Company’s NGL sales volumes from condensate.

Average realized oil price – $/bbl” is comprised of oil sales as determined in accordance with IFRS, divided by the Company’s oil sales volumes.

Average realized price – $/boe” is comprised of natural gas, condensate and oil sales as determined in accordance with IFRS, divided by the Company’s total natural gas, condensate and oil sales volumes (barrels of oil equivalent).

Royalties per boe” is comprised of royalties, as determined in accordance with IFRS, divided by the total natural gas, condensate and oil sales volumes (barrels of oil equivalent).

Production expenses per boe” is comprised of production expenses, as determined in accordance with IFRS, divided by the total natural gas, condensate and oil sales volumes (barrels of oil equivalent).

BOE Disclosure

The term barrels of oil equivalent (“boe”) may be misleading, particularly if used in isolation. A boe conversion ratio of six thousand cubic feet per barrel (6 Mcf/bbl) of natural gas to barrels of oil equivalence is based on an energy equivalency conversion method primarily applicable at the burner tip and does not represent a value equivalency at the wellhead. All boe conversions in this MD&A are derived from converting gas to oil in the ratio mix of six thousand cubic feet of gas to one barrel of oil.

Forward-Looking Statements and Cautionary Language

This news release contains forward-looking information within the meaning of applicable securities laws. The use of any of the words “will”, “expect”, “intend” and other similar words or expressions are intended to identify forward-looking information. Forward?looking statements involve significant risks and uncertainties, should not be read as guarantees of future performance or results, and will not necessarily be accurate indications of whether or not such results will be achieved. A number of factors could cause actual results to vary significantly from the expectations discussed in the forward-looking statements. These forward-looking statements reflect current assumptions and expectations regarding future events. Accordingly, when relying on forward-looking statements to make decisions, Alvopetro cautions readers not to place undue reliance on these statements, as forward-looking statements involve significant risks and uncertainties. More particularly and without limitation, this news release contains forward-looking information concerning the plans relating to the Company’s operational activities, the expected natural gas price, gas sales and gas deliveries under Alvopetro’s long-term gas sales agreement, exploration and development prospects of Alvopetro, the expected timing of certain of Alvopetro’s testing and operational activities, future results from operations, and the Company’s plans for dividends in the future. The forward?looking statements are based on certain key expectations and assumptions made by Alvopetro, including but not limited to equipment availability, the timing of testing of the 182-C1 and the 183-B1 wells and the results from such testing, the timing of regulatory licenses and approvals, the success of future drilling, completion, testing, recompletion and development activities, the outlook for commodity markets and ability to access capital markets, the impact of the COVID-19 pandemic and other significant worldwide events, the performance of producing wells and reservoirs, well development and operating performance, foreign exchange rates, general economic and business conditions, weather and access to drilling locations, the availability and cost of labour and services, environmental regulation, including regulation relating to hydraulic fracturing and stimulation, the ability to monetize hydrocarbons discovered, the regulatory and legal environment and other risks associated with oil and gas operations. The reader is cautioned that assumptions used in the preparation of such information, although considered reasonable at the time of preparation, may prove to be incorrect. Actual results achieved during the forecast period will vary from the information provided herein as a result of numerous known and unknown risks and uncertainties and other factors. In addition, the declaration, timing, amount and payment of future dividends remain at the discretion of the Board of Directors. Although Alvopetro believes that the expectations and assumptions on which such forward-looking information is based are reasonable, undue reliance should not be placed on the forward-looking information because Alvopetro can give no assurance that it will prove to be correct. Readers are cautioned that the foregoing list of factors is not exhaustive. Additional information on factors that could affect the operations or financial results of Alvopetro are included in our restated annual information form which may be accessed on Alvopetro’s SEDAR profile at www.sedar.com. The forward-looking information contained in this news release is made as of the date hereof and Alvopetro undertakes no obligation to update publicly or revise any forward-looking information, whether as a result of new information, future events or otherwise, unless so required by applicable securities laws.

SOURCE Alvopetro Energy Ltd.



Harte Hanks (HHS) – A New, Profitable Baseline

Friday, August 12, 2022

Harte Hanks (HHS)
A New, Profitable Baseline

Harte Hanks (NASDAQ: HHS) is a leading global customer experience company whose mission is to partner with clients to provide them with CX strategy, data-driven analytics and actionable insights combined with seamless program execution to better understand, attract, and engage their customers. Using its unparalleled resources and award-winning talent in the areas of Customer Care, Fulfillment and Logistics, and Marketing Services, Harte Hanks has a proven track record of driving results for some of the world’s premier brands including Bank of America, GlaxoSmithKline, Unilever, Pfizer, HBOMax, Volvo, Ford, FedEx, Midea, Sony, and IBM among others. Headquartered in Chelmsford, Massachusetts , Harte Hanks has over 2,500 employees in offices across the Americas, Europe and Asia Pacific .

Michael Kupinski, Director of Research, Noble Capital Markets, Inc.

Patrick McCann, Research Associate, Noble Capital Markets, Inc.

Refer to the full report for the price target, fundamental analysis, and rating.

Solid Q2 results. Against difficult earlier comps, the company reported a solid quarter in line with expectations. The weakness in its Customer Care segment due to year earlier Covid related business was largely offset by 24% revenue growth in its Fulfillment & Logistics segment. Adj. EBITDA of $5.2 million was better than our $4.9 million estimate. 

Favorable contract wins. The company has won several contract awards that provides a more constructive view of its second half. The contract wins favorably affect both its Customer Care and Fulfillment & Logistics segments. …

This Company Sponsored Research is provided by Noble Capital Markets, Inc., a FINRA and S.E.C. registered broker-dealer (B/D).

*Analyst certification and important disclosures included in the full report. NOTE: investment decisions should not be based upon the content of this research summary. Proper due diligence is required before making any investment decision. 

Onconova Therapeutics (ONTX) – All Trials Continue Toward Data Milestones

Friday, August 12, 2022

Onconova Therapeutics (ONTX)
All Trials Continue Toward Data Milestones

Onconova Therapeutics is a clinical-stage biopharmaceutical company focused on discovering and developing novel products for patients with cancer. The Company has proprietary targeted anti-cancer agents designed to disrupt specific cellular pathways that are important for cancer cell proliferation. Onconova’s novel, proprietary multi-kinase inhibitor narazaciclib (formerly ON 123300) is being evaluated in two Phase 1 dose-escalation and expansion studies. These trials are currently underway in the United States and China. Onconova’s product candidate rigosertib is being studied in an investigator-sponsored study program, including in a dose-escalation and expansion Phase 1/2a investigator-sponsored study with oral rigosertib in combination with nivolumab for patients with KRAS+ non-small cell lung cancer.

Robert LeBoyer, Vice President, Research Analyst, Life Sciences , Noble Capital Markets, Inc.

Refer to the full report for the price target, fundamental analysis, and rating.

2Q22 Onconova Reported Trial Progress. 2Q22 loss of $4.0 million or $(0.19) per share, compared with our estimated loss of $3.7 million or $(0.18) per share.  Several clinical trials for both narazaciclib and rigosertib are continuing as expected.  The company ended the quarter with $46.5 million in cash and cash equivalents.

Both Narazaciclib Phase 1/2 Trials Continue To Enroll Patients.  The two trials testing narazaciclib at different treatment schedules continue to treat patients.  The trial in China continues in its fifth cohort while the US trial recently begun dosing its fifth cohort.  Neither trial has reached its maximum tolerated dose and none of the toxicities associated with other CDK4/6 drugs have been reported.  We expect announcement of the dosing level selected for Phase 2 around 4Q22….

This Company Sponsored Research is provided by Noble Capital Markets, Inc., a FINRA and S.E.C. registered broker-dealer (B/D).

*Analyst certification and important disclosures included in the full report. NOTE: investment decisions should not be based upon the content of this research summary. Proper due diligence is required before making any investment decision. 

Is Index Fund Popularity Going to Cool-Off?


Image Credit: Laura Pontiggia (Flickr)


Has the Bear Market Left a Permanent Mark on Indexed Investments?

As much as 25% of the S&P 500 index is comprised of only five stocks. Most active investors can guess them easily enough: Apple (AAPL), Microsoft (MSFT), Amazon.com (AMZN), Tesla (TSLA), and Alphabet (GOOG). As of the end of the second quarter (2022), 7.1% of the S&P 500 index was allocated to Apple alone. Funds that mimic indexes have done extraordinary up until now as the trend has been toward index investing. In the first quarter of this year alone, which includes IRA season, these funds took in $8.5 trillion in retail investments. According to Morningstar, this is more than all active management strategies combined. They have been the go-to investment idea for financial advisors and the way this generation has learned to think about investing.


What Might Change?

The persistent sell-off in the markets earlier this year, and the surprise geopolitical events, may cause investors to question if these funds are properly diversified. Even an allocation of 60% stocks and 40% bonds would place an investor’s exposure, using an S&P 500 fund, to nearly 5% of AAPL. Worse yet, the top five, comprising 25%, often trade in lock-step, both up and down.

They are, after all, the big guys. They certainly have the power to grow further but also much further to fall than most. Will recovering from the bear market, with lessons learned, cause the popularity of these funds to lessen? The funds were viewed as ideal diversifiers when they first gained popularity, but their own success, that is, the amount of money that poured into this good idea, has given them weaknesses. An unsettling weakness is much higher average valuations among holdings than stocks just outside of any large index.


History Until Now

The history of Index funds’ popularity is easy to understand. For financial advisors, they found it provided low-cost diversification for their clients. They got this by placing assets in an indexed ETF; as a bonus, they avoided what were then large transaction fees with individual stocks. 

For most individual investors, transaction fees are no longer a barrier to personally managing accounts; the costs simply aren’t as high.  For individual self-directed investors, buy-and-hold and diversification have been drilled into their heads. So these indexed funds easily accomplish this set-it and forget-it (buy and hold) position. But, the level of diversification isn’t what it once was, and investors forgo the nimbleness of taking individual stocks out of their portfolio or more heavily weighting better risk/reward alternatives. 

For the fund managers themselves, especially those benchmarked off an index, no one can tell you you’re performance is horrible if it is in line with the index. It’s an easy job; just own the index in the same ratio the index weights the underlying stocks. With today’s computers, it is almost a back-office clerical function.


Lifecycle of Investment Products

But, like many products, they may have run their course, something better could replace them, or they more likely start to slide under the weight of their own success.

Index funds, especially those that mimic the large-cap Nasdaq100 or S&P 500, are in theory diversified as to names, but they are also capitalization weighted, which means even new money flows unevenly into the larger, more popular stocks. Over time, the combination of index fund popularity together with index construction favoring the more popular stocks has meant that more has flowed into fewer and fewer stocks. Therefore, capitalization-weighted equity indexing adds to the momentum of stocks that may not be worthy.

Much of this money might not otherwise be in these companies if not for the popularity of index funds and the self-perpetuating, dare I say bubble, that is the result of this setup.

According to an article in Barron’s this month, “The purveyors of indexes, being human, tend to make the concentration in a few expensive stocks even worse.” Barron’s wrote. The article then explains that the committee that oversees the S&P 500 has changed the make-up often, “and in the process tended to add stocks with price/earnings ratios more than twice that of those deleted.”


Are Investors Ready to Transition?

With more new money, in unfathomable amounts, reaching these funds each quarter and then being dispersed into the underlying stocks, weaker stocks fall even farther and strong stocks rise more than they may otherwise have risen. This undermines the efficient market theory as stocks that have sunk low enough to be worthwhile for many investors are not considered. The efficient markets theory is supposed to take into account all available information. Over the years, investors have set their portfolios on “in the market” or “out of the market,” with the market being one of the major indexes.

Could it be that as the market turns around and heads up, value hunters in individual stocks will lead, and indexes and index funds will not have as high relative performance?

Index funds, now that they have grown to the size they have, have developed other contradictions. Aside from ignoring the principle that the price paid represents a key determinant of long-term return, indexing ignores the flexibility to reward. Companies in an index that find themselves in trouble will keep receiving new money as investors add funds to their indexed accounts. This is without regard to how undeserving some companies in the fund are or whether they even will be in business in a year. In the meantime, companies not in the index find inclusion gets further out of reach.


Will Stock-Pickers Replace Index Funds?

In an ideal world, there is a selection of suitable products that all have similar results. For commuting, some take the bus to work, others drive, and still, others Zoom in. No one method of commuting is ideal for everyone. Those that wish to not worry about what many individual stocks are doing but instead concentrate on “the market” will keep adding money to these indexed products. Others that realize that they may be full of relatively expensive stocks will gravitate to old-fashioned stock selection – this time without all the commissions. And there will be those that keep their money in low-interest savings accounts that knowingly lose buying power to inflation.

The next “Apple stock” surely has more potential for growth than today’s top five stocks. Currently, the company may be just a hand full of people working out their idea from a handful of remote locations. Finding that company in the initial public offering stage (IPO) or after it has gone public is the dream of most active investors. It can’t be found in an indexed fund.

There is no functioning crystal ball, but there are resources, including no-paywall  Channelchek to help investors quickly review data on over 6000 small and microcap companies. And access the same research professionals consult with before making decisions. In addition, Channelchek has helpful videos and articles sent to your inbox daily to alert you to new perspectives and actionable opportunities.

Sign-up
here.

Paul Hoffman

Managing Editor, Channelchek

Suggested Content


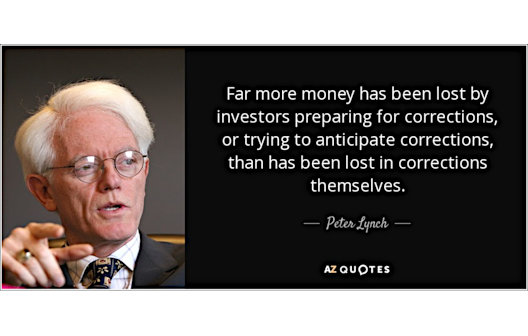
Peter Lynch Echoes Michael Burry’s Warning About Index Investments


Can Stock Market Index Enthusiasm Cause Costly Bubbles?


In Nine Years, Nearly All Boomers Will Have Retired, Is This Good for Stock Pickers?


Together, Self-Directed Investors own More Equities than Institutional – Will they Seize Control?


Sources

https://www.morningstar.com/articles/1087146/us-value-funds-beat-growth-in-the-first-quarter

https://www.barrons.com/articles/the-bear-market-could-finally-break-index-funds-51660287600?mod=hp_LEADSUPP_1

Stay up to date. Follow us:


Michael Burry Uses Twitter to Offer More Proof of His Theory


Image(s): Wikimedia.org


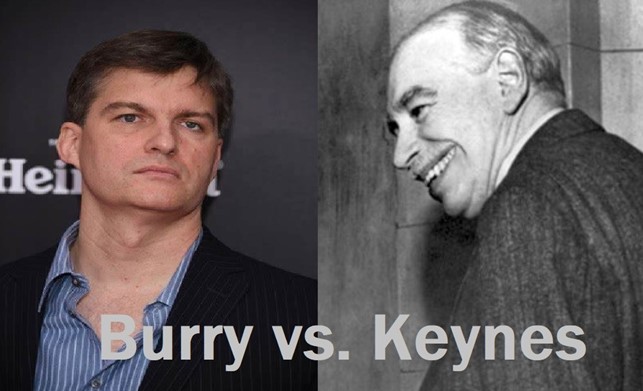
Does Michael Burry Have a Problem with John Maynard Keynes?

There is no doubt that Dr. Michael J. Burry is familiar with Keynesian economics theory. Under the theory, the government should help control aggregate demand by infusing money into a weakening economy to create added demand or withdraw currency to reduce demand. But there is a caveat to this basic tenet of Keynes’ theory, and it seems Michael Burry, famous hedge fund manager at Scion Asset Management, has little patience for it.

Followers, both fans and haters, pay close attention to the tweets the Scion Asset Management founder often uses to share his thoughts. Burry’s tweets are usually deleted by him shortly after he sends to keep BOT benefactors down. So his Twitter account isn’t always the best place to see his thinking that is more than a few hours old.


What is Michael Burry is Saying

Burry’s recent tweets have indicated he believes retailers could cut prices to rid themselves of inventories caused by seasonal delivery inventory mismatches. Also, dwindling savings and soaring debt could spark a recession. He just offered more proof of his theory.

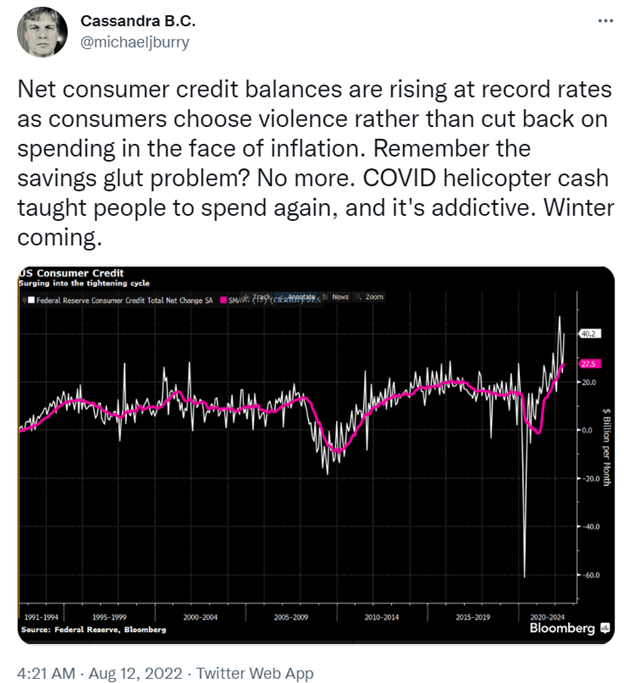
At about 4 am this morning (presumed Pacific time), Burry posted a Bloomberg chart on U.S. consumer credit use. The graph reaches back to 1991 and carries into the recent monetary policy tightening. Along with the chart, Burry tweeted, “Net consumer credit balances are rising at record rates as consumers choose violence rather than cut back on spending in the face of inflation. Remember the savings problem? No more. COVID helicopter cash taught people to spend again, and it’s addictive. Winter coming.


Source: @michaeljburry (Twitter)

When speaking of economic cycles, “winter” is often referred to as the downside of the cycle; there is death and dormancy among businesses in the winter. It’s miserable, but it leads to the spring part of the cycle with new growth.  Translating further, if the consumers continue to buy, despite having an unsustainable ability to continue at the previous pace, a more violent winter may fall upon the economy. 

The chart attached to the tweet shows the net change of consumer debt each month as recorded by the Federal Reserve. The historical average, including negative periods, is $27.5 billion.  The current monthly pace is $27.5 billion.

Burry noted in May that American consumers, faced with rising food, fuel, and housing costs, were pulling from their incomes, racking up credit-card debt, and poised to virtually exhaust their savings by the end of 2022.


What Keynesian Theory Says

Keynesian economic theory says the government should help free markets when they are faltering by injecting cash. The cash will then spur aggregate demand for goods and services. And the government should also pull money from the system to reduce demand in an overheated situation. Having a smoothing hand, in addition to the free market’s invisible hand, could lead to a more balanced outcome and a more even keel.

The theory also recognizes that if additional money is put into consumers’ hands today that it works its way into the economy quickly. The U.S. experienced this a couple of years ago with stimulus checks that began stimulating right after being announced – even before distribution. However, if money is removed from the system, spending continues at the same pace for a while as consumer spending habits don’t back off the consumption gas pedal as quickly.

Most consumers are no longer receiving benefits doled out through the pandemic and are now confronted with rampant inflation. Yet, despite worsening cash flow and higher prices, they are consuming at the same level, making up the difference by pulling from savings and increasing debt. This is right in line with what John Maynard Keynes would expect. At least at the beginning.

Keynes would also expect a turn to more conservative spending eventually, currently, consumer tapering on spending is just beginning. And based on his theory, it will be followed by a reduction in consumption.


Is Burry at Odds with Keynes?

The short answer is what Burry has been bringing to investors’ attention is right in line with what Keynes, in 1936,  said could be expected. Apparently, human nature related to consumption hasn’t evolved.

I am sure Dr. Burry understands that reactions when it comes to cutting back aren’t immediate. But what may frustrate him is that the markets (not the consumer) always take so long to spot what he is seeing. He has a habit of getting into trades much earlier than others. His expectations, more often than most, play out as he expects, with one exception. The exception is timing. Even in his famous “big short” of the mortgage market, he was a couple of years ahead on his credit default swap play. One can presume that he felt a good deal of pain as housing continued on its path for much longer than expected. 


Practical Use

The central bank has to be out ahead of the economy when the pace is heating up because taking the proverbial “punch bowl” away doesn’t cause immediate sobriety. Burry predicted consumer spending would drop as a result of tightening and believes retailers will cut prices to lessen overstocking and badly timed inventories. This would help derail inflation and put pressure on retail and other earnings by Christmas. The tweeted chart of consumer debt above shows the “party” is still raging as the government-supplied punch bowl has been removed, but people are tapering by using their limited stash. When that stash taps out, there will be an abrupt end.

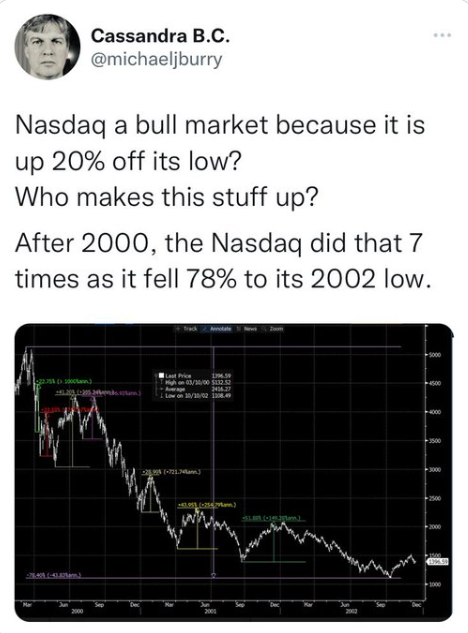
Earlier this week he tweeted about the turnaround in the stock market, specifically Nasdaq. He warned that the big-tech heavy index may be 20% off its low, but history indicates that this doesn’t mean that it can’t fall dramatically as it did seven times after 2000 when the dot-com bubble burst.


Source: @BurryArchive (Twitter)

Frustration is a common theme of his tweets. Some of the frustration is a lack of patience for things like the nuances of Keynesian economics and the overall behavioral patterns of investors across many asset classes.

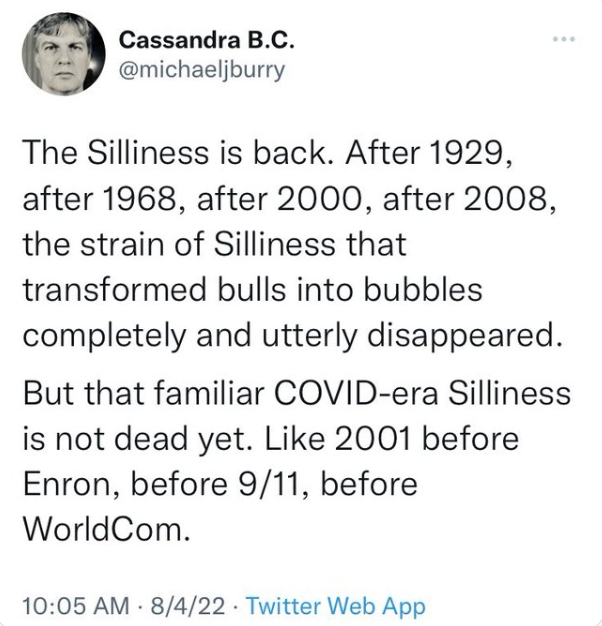
Burry He also has asserted the pain for investors might not end until they swear off owning tech stocks, cryptocurrencies, and non-fungible tokens (NFTs). Referring to the latest w/streetbets “meme-stock” additions AMTD (HKD) (which rose 21,000%) and Magic Empire (MEGL) (which rose 2,000%) he recently complained that market “silliness” is back after the two IPOs skyrocketed.


Source: @BurryArchive (Twitter)


Take Away

An investor can be consistently right about the future direction of individual stocks or the markets. If they perceive what is going to happen to be timed much sooner than the other players, they will miss other opportunities, or more frustrating, lose patience with the position and get out of it before it becomes profitable.

In the book about Michale Burry’s housing crisis position, it took a long time for what he was certain to happen, to become reality. He lost a lot of investors in his funds while waiting for what he believed to be inevitable, played out. Classic economic theory tells us that we should expect delays in cause and effect. As investors, we need to remind ourselves if we are long-term and willing to ride out the ups and downs to stick to the plan. Or if we are more active, we may try to take advantage of shorter moves that may be against our overall thoughts on the long-term direction.

Follow Channelchek’s Twitter account and let us know under this article your overall thoughts on the market, and favorite small-cap stocks. 

Paul Hoffman

Managing Editor, Channelchek

Suggested Content


Michael Burry is Predicting More Red


Is Michael Burry Frustrated that the Market Hasn’t Yet Crashed?


Are Consumer Price Increases Negatively Correlated to Stock Market Price Levels?


Cathie Wood’s Expectations for Inflation, Recession, Markets, China, and Jobs


Sources

https://twitter.com/BurryArchive/status/1557518533172477952/photo/1

https://twitter.com/BurryArchive/status/1557430160512524288

https://twitter.com/michaeljburry

W.
Carl Biven (1989). Who Killed John Maynard Keynes? Conflicts in The Evolution
of Economic Policy

Stay up to date. Follow us:


Kelly Services (KELYA) – Calling All Workers

Friday, August 12, 2022

Kelly Services (KELYA)
Calling All Workers

Kelly (Nasdaq: KELYA, KELYB) connects talented people to companies in need of their skills in areas including Science, Engineering, Education, Office, Contact Center, Light Industrial, and more. We’re always thinking about what’s next in the evolving world of work, and we help people ditch the script on old ways of thinking and embrace the value of all workstyles in the workplace. We directly employ nearly 350,000 people around the world and connect thousands more with work through our global network of talent suppliers and partners in our outsourcing and consulting practice. Revenue in 2021 was $4.9 billion. Visit kellyservices.com and let us help with what’s next for you.

Joe Gomes, Senior Research Analyst, Noble Capital Markets, Inc.

Joshua Zoepfel, Research Associate, Noble Capital Markets, Inc.

Refer to the full report for the price target, fundamental analysis, and rating.

2Q22. Revenue of $1.267.3 billion was up 0.7% year-over-year (2.7% in constant currency). Consensus was $1.28 billion and we were at $1.29 billion. Kelly reported operating earnings of $8.2 million ($22.3 million adjusted) compared to $13.7 million a year ago. We were at $23 million. GAAP EPS was $0.06 compared to $0.60. Adjusted EPS for the second quarter was $0.45 versus $0.49 last year. We had projected adjusted EPS of $0.49.

Demand for Talent. Demand for talent remains high, even in the face of economic uncertainty. We would highlight a 33.2% y-o-y increase in permanent placement fees, typically a more sensitive barometer of demand. The Company continues to explore a multitude of ways to supply the demanded talent to its clients.

This Company Sponsored Research is provided by Noble Capital Markets, Inc., a FINRA and S.E.C. registered broker-dealer (B/D).

*Analyst certification and important disclosures included in the full report. NOTE: investment decisions should not be based upon the content of this research summary. Proper due diligence is required before making any investment decision. 

InPlay Oil (IPOOF) – Another solid quarter with results generally in line with expectations

Friday, August 12, 2022

InPlay Oil (IPOOF)
Another solid quarter with results generally in line with expectations

InPlay Oil is a junior oil and gas exploration and production company with operations in Alberta focused on light oil production. The company operates long-lived, low-decline properties with drilling development and enhanced oil recovery potential as well as undeveloped lands with exploration possibilities. The common shares of InPlay trade on the Toronto Stock Exchange under the symbol IPO and the OTCQX Exchange under the symbol IPOOF.

Michael Heim, CFA, Senior Research Analyst, Noble Capital Markets, Inc.

Refer to the full report for the price target, fundamental analysis, and rating.

InPlay reported sold 2022-2Q results. Production (9,063 boe/d) was a bit below our expectations due to difficulties trucking out oil due to wet weather (55 boe/d reduction). On the other hand, oil and natural gas pricing was above expectations at C$116.74 (versus our C$105 estimate) and C$7.61 per mcf. (versus our C$6.90 per mcf. estimate). Notably, lifting and operating costs were a modest $12.28/boe down from first quarter LOE of $12.96. The net effect was adjusted fund flow (C$40.9m vs. C$38.7m) and net income (C$29.0m/$0.32 vs. C$27.8m/$0.32) in line with expectations.

Accelerated drilling program is showing signs of success. InPlay drilled five wells during the quarter. Drill time has been reduced to 10-11 days. InPlay did not indicate the cost to drill the wells, but we assume original drilling cost of C$2.5 million may be coming down. The company anticipates drilling three wells in the third quarter despite delays due to wet weather. …

This Company Sponsored Research is provided by Noble Capital Markets, Inc., a FINRA and S.E.C. registered broker-dealer (B/D).

*Analyst certification and important disclosures included in the full report. NOTE: investment decisions should not be based upon the content of this research summary. Proper due diligence is required before making any investment decision. 

Release – Ocugen CEO to Present at H.C. Wainwright 2nd Annual Ophthalmology Virtual Conference


Ocugen CEO to Present at H.C. Wainwright 2nd Annual Ophthalmology Virtual Conference

Research, News, and Market Data on Ocugen

August 12, 2022

MALVERN, Pa., Aug. 12, 2022 (GLOBE NEWSWIRE) — Ocugen, Inc. (“Ocugen” or the “Company”) (NASDAQ: OCGN), a biotechnology company focused on discovering, developing, and commercializing novel gene therapies, biologicals, and vaccines, announced that Dr. Shankar Musunuri, Chairman, Chief Executive Officer and Co-Founder of Ocugen, will deliver a virtual presentation at the 
H.C. Wainwright 2nd Annual Ophthalmology Virtual
Conference
 on August 17.

A video webcast of the presentation will be available on demand beginning at 7:00 a.m. ET on August 17, 2022 for those registered for the event and will be available on the events page of the Ocugen 
investor site. The webcast replay will be archived for 90 days following the event.

About Ocugen, Inc.
Ocugen, Inc. is a biotechnology company focused on discovering, developing, and commercializing novel gene and cell therapies and vaccines that improve health and offer hope for patients across the globe. We are making an impact on patient’s lives through courageous innovation—forging new scientific paths that harness our unique intellectual and human capital. Our breakthrough modifier gene therapy platform has the potential to treat multiple retinal diseases with a single product, and we are advancing research in infectious diseases to support public health and orthopedic diseases to address unmet medical needs. Discover more at www.ocugen.com and follow us on Twitter and LinkedIn.

Cautionary Note on Forward-Looking Statements
This press release contains forward-looking statements within the meaning of
The Private Securities Litigation Reform Act of 1995, which are subject to
risks and uncertainties. We may, in some cases, use terms such as “predicts,”
“believes,” “potential,” “proposed,” “continue,” “estimates,” “anticipates,”
“expects,” “plans,” “intends,” “may,” “could,” “might,” “will,” “should,” or
other words that convey uncertainty of future events or outcomes to identify
these forward-looking statements. Such statements are subject to numerous
important factors, risks, and uncertainties that may cause actual events or
results to differ materially from our current expectations. These and other
risks and uncertainties are more fully described in our periodic filings with
the Securities and Exchange Commission (SEC), including the risk factors
described in the section entitled “Risk Factors” in the quarterly and annual
reports that we file with the SEC. Any forward-looking statements that we make
in this press release speak only as of the date of this press release. Except
as required by law, we assume no obligation to update forward-looking
statements contained in this press release whether as a result of new
information, future events, or otherwise, after the date of this press release.

Contact:
Tiffany Hamilton
Head of Communications
IR@ocugen.com


One Stop Systems (OSS) – Another Record Revenue Quarter

Friday, August 12, 2022

One Stop Systems (OSS)
Another Record Revenue Quarter

One Stop Systems, Inc. (OSS) designs and manufactures innovative AI Transportable edge computing modules and systems, including ruggedized servers, compute accelerators, expansion systems, flash storage arrays, and Ion Accelerator™ SAN, NAS, and data recording software for AI workflows. These products are used for AI data set capture, training, and large-scale inference in the defense, oil and gas, mining, autonomous vehicles, and rugged entertainment applications. OSS utilizes the power of PCI Express, the latest GPU accelerators and NVMe storage to build award-winning systems, including many industry firsts, for industrial OEMs and government customers. The company enables AI on the Fly® by bringing AI datacenter performance to ‘the edge,’ especially on mobile platforms, and by addressing the entire AI workflow, from high-speed data acquisition to deep learning, training, and inference. OSS products are available directly or through global distributors. For more information, go to www.onestopsystems.com.

Joe Gomes, Senior Research Analyst, Noble Capital Markets, Inc.

Joshua Zoepfel, Research Associate, Noble Capital Markets, Inc.

Refer to the full report for the price target, fundamental analysis, and rating.

2Q22 Results. One Stop Systems reported another record revenue quarter for 2Q22. Revenue of $18.3 million was up 23% y-o-y and above management’s $17.3 million guide. We had forecast $17.3 million. GAAP EPS of $0.02 per share versus $0.09 last year. Adjusted EPS of $0.04 per share versus $0.04 per share in 2Q21. We had forecast $0.03 and $0.05 respectively.

Disguise, Bressner Driving Results. Once again, OSS’s media and entertainment client, Disguise had a record revenue quarter for OSS, up 135% to $6.4 million, with strong virtual and large gathering revenues. Bressner revenue increased 31% y-o-y to $7.6 million, a record, driven by increased market share….

This Company Sponsored Research is provided by Noble Capital Markets, Inc., a FINRA and S.E.C. registered broker-dealer (B/D).

*Analyst certification and important disclosures included in the full report. NOTE: investment decisions should not be based upon the content of this research summary. Proper due diligence is required before making any investment decision.