The Lucky Stars Seem to Have Aligned for Online Gambling Companies
Public companies involved in sports betting may find their shareholders are the real winners. Between the increased number of states that have legalized sports betting over recent years, the enhanced betting opportunities, and the nature of the Superbowl win, luck seems to have weighed heavily on the side of these businesses. It will take time for the actual numbers to be reported. Just last year FanDuel became the first sportsbook to be profitable, it will report again in March. DraftKings, BetMGM, and Caesars, have yet to turn a profit in sports betting.
Superbowl Win Favors Companies
Close to 60% of bets were for the Philadelphia Eagles to be the outright winner of the game, according to FanDuel. FanDuel is the largest online sportsbook operator in the U.S. The less-expected 38-35 win for the Kansas City Chiefs over the Philadelphia Eagles at the Super Bowl will mean less wagered money will have to be distributed to customers. The team that was considered the underdog, having come out ahead, should add revenue to the bottom line of gambling companies.
The reason, of course, is companies like DraftKings and FanDuel will not have to pay out on many of the most popular bets, including widespread predictions for a 37-34 victory for the Eagles after online speculation over a ‘leaked script’ for the game.
Other Popular Bets
Before Sunday’s kick-off, Twitter and other social media conversations referred to the “leaked script.” An image was being shared that showed the Eagles winning 37-34. The image had millions of impressions on Twitter across all the shares.
Various Twitter Posts Highlighted this Image Pre-Game
Bettors could also wager on who may come out as the most valuable player. The Chiefs tight end Travis Kelce was the most selected based on bets for this honor, according to FanDuel. Instead, the MVP award was won by Chiefs quarterback Patrick Mahomes.
During a heavy betting period, there was an issue with Caesars Entertainment subsidiary William Hill US. This issue was affecting users in Nevada by preventing them from logging in on Sunday. Frustrated users took to social media outlets to complain of their difficulties during the game. The company tweeted that it was still in the process of settling all Super Bowl wagers after the game on Sunday.
Take Away
Online sports gambling is experiencing dramatic growth. Each year more states allow the practice within their borders. At the same time, technology allows betting on slices of the game, even on in-play situations never before available. With both FanDuel and DraftKings advertising to the large Superbowl audience, the practice of gambling online on sports is becoming more and more understood and common place. The 2023 Superbowl may have helped the bottom line of these companies. That will be seen when the numbers for this quarter are released. Investors are paying attention as it would seem that there is plenty of room for further growth.
Will the Inflation Numbers on Valentine’s Cause the Market to See Red?
As earnings season fades investors that like to get a glimpse into the portfolios of successful money managers will look for the 13-f filings of some of the most followed investors as they are made available. Tuesday and Wednesday should bring Michael Burry’s and Warren Buffet’s filing. The CPI report on Tuesday is expected to show a continuation of inflation tapering. The Jobs report on Thursdays has been missing consensus, it has the potential to either calm or rattle the markets.
Monday 2/13
With no consequential economic releases, market direction may take its tone from traders positioning ahead of Tuesday’s CPI report.
Tuesday 2/14
8:30 AM ET, January’s headline CPI rate is expected to increase month to month by 0.5% after a .1% decline experienced in December, and year-over-year at 6.2% versus 6.5% the prior 12 months. Ex-food and energy (core rate) is expected to show unchanged at a 5.5% annual rate versus 5.7% the prior 12 months.
In previous years Michael Burry has made a public filing of Scion Asset Managements 13-f holdings on Valentine’s Day. Warren Buffet of Berkshire Hathaway will make available his changed positions. This filing is also likely on Tuesday or perhaps Wednesday.
Wednesday 2/15
9:15 AM ET, Industrial Production, which includes data for Manufacturing and Capacity Utilization has been contracting. January’s consensus estimates are for monthly gains of 0.5% for production and 0.4% for manufacturing and would be a welcome sign for those fearing a recession. The positive direction would be welcome after December’s monthly decline of 0.7% overall and 1.3% for manufacturing. Capacity utilization is expected to remain at a non-inflationary 78.8%.
10:00 AM ET, Business Inventories data for December are expected to rise 0.3% following a 0.4% expansion in November. Intentional inventory growth can be a sign of business optimism surrounding future sales. If unintended inventory accumulation occurs, then production will probably be throttled back as inventories are worked down. This is why Business Inventories a leading economic indicator.
10:00 AM ET, The Housing Market Index fell each month in 2022. The weak streak ended in January, as it rose 4 points to 35. February’s consensus is a further but smaller 1-point improvement to 36. The Housing Index is a monthly composite that tracks home builder assessments of present and future sales along with buyer traffic
10:00 AM ET, Atlanta Fed Business Inflation Expectations survey provides a monthly measure of year-ahead inflation expectations and inflation uncertainty from the perspective of firms. The survey also provides a monthly gauge of firms’ current sales, profit margins, and unit cost changes. The year over year estimate is for 3%.
Thursday 2/16
8:30 AM ET, Jobless Claims, including Initial Claims and Continuing Claims, have been a big focus of the market as unemployment is running at a historically low pace. The consensus is for growth in Jobless levels to 199,000 versus 196,000 the prior week. Overall low claims would seem to be good news for the economy. The problem now is that it is worrisome for a Fed that views current inflationary pressures, including wage pressures unacceptably high.
Friday 2/17
8:30 AM ET, The Index of Leading Indicators has been in steep decline; it is expected to fall further, but less steeply, by 0.3 percent in January versus a fall of 0.8% in December.
What Else
Investors with interest in telecommunications company Comtech (CMTL) and located in South Florida, may be able to attend one of four special presentations by management on Monday or Tuesday. Get information here to see if this is suited for you.
Monday, February 20th, is a holiday, and the US markets will be closed.
Central Banks Gobbled Up More Gold Last Year Than In Any Year Since 1967
The price of gold stopped just short of hitting $1,960 an ounce last Thursday, its highest level since April 2022, before plunging below $1,900 on Friday following a stronger-than-expected U.S. jobs report, indicating that the current rate hike cycle may be far from over.
I don’t believe that this takes away from the fact that gold posted its best start to the year since 2015. The yellow metal rose 5.72% in January, compared to 8.39% in the same month eight years ago.
This article was republished with permission from Frank Talk, a CEO Blog by Frank Holmes of U.S. Global Investors (GROW). Find more of Frank’s articles here – Originally published February 8, 2023.
I also maintain my bullishness for gold and gold mining stocks in 2023. Gold was one of the very few bright spots in a dismal 2022, ending the year essentially flat, and I expect its performance to remain strong in the year ahead.
Record Retail Demand In 2022
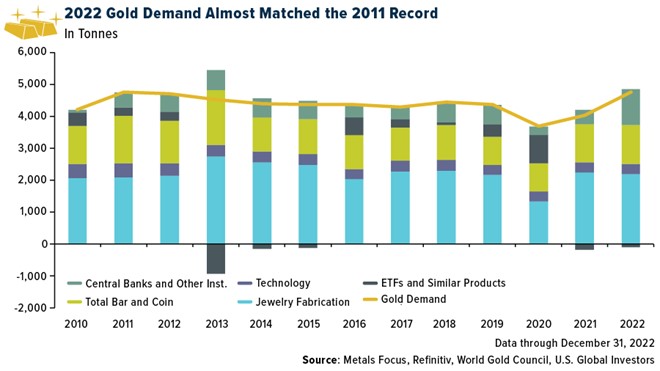
The big headline in the World Gold Council’s (WGC) 2022 review is that total global demand expanded 18% year-over-year, reaching its highest level since 2011.
Central banks were responsible for much of the growth, adding a massive 1,136 metric tons, the largest annual amount since 1967. China began accumulating again in 2022 for the first time in three years, continuing its goal of diversifying away from the dollar.
Meanwhile, retail demand for bars and coins in the U.S. and Europe hit a new annual record last year in response to stubbornly high inflation and the war in Ukraine. Western investors gobbled up 427 tons (approximately 15 million ounces), the most since 2011.
Investors To Shift From Physical Bullion To Gold-Backed ETFs In 2023?
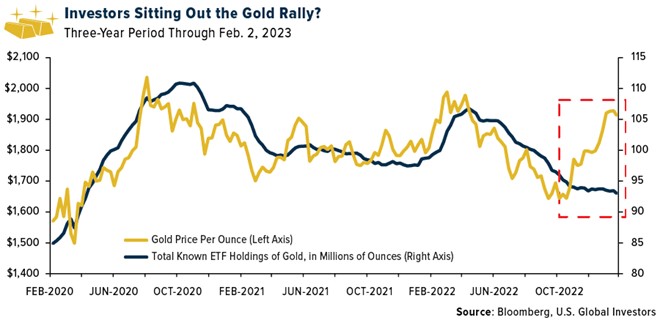
Where I see the opportunity is with gold-backed ETFs and gold mining stocks, both of which didn’t see the same level of demand as the bullion market last year. Investors withdrew some 110 tons from physical gold ETFs, the second straight year of declines, though at a slower pace compared to 2021. Even when the gold price began to climb in November, investors didn’t seem to respond as they have in past rallies.
The WGC suggests that demand for ETFs that hold physical gold will “take the baton” from bars and coins this year. That remains to be seen, but I always recommend that investors diversify, with 5% of their portfolio in bullion, gold jewelry and gold-backed ETFs.
Another 5% can be allocated to high-quality gold mining stocks, mutual funds and ETFs. We prefer companies that have demonstrated strong momentum in revenue, free cash flow and high-growth margins on a per-share basis.
$1 Trillion Investment In The Energy Transition, On Par With Fossil Fuels
If I had to select another metal to watch this year (and beyond), it would be copper. The red metal, we believe, will be one of the greatest beneficiaries of the global low-carbon energy transition that’s taking place. As we seek to electrify everything, from power generation to transportation, copper is the one material that’s used every step of the way.
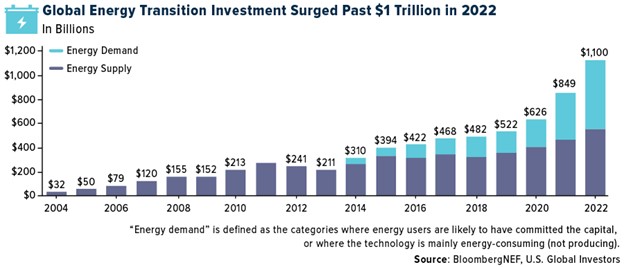
What’s more, investment in the transition is accelerating. Last year, more than $1 trillion was plowed into new technologies such as renewable energy, energy storage, carbon capture and storage, electrified transport and more.
Not only is this a new annual record amount, but, for the first time ever, it matches what we invested in fossil fuels, according to Bloomberg New Energy Finance (NEF).
China was the top investor, responsible for $546 billion, or nearly half of the total amount. The U.S. was a distant second at $141 billion, though the Inflation Reduction Act (IRA), signed into law in August 2022, has yet to be fully deployed.
Copper’s Supply-Demand Imbalance
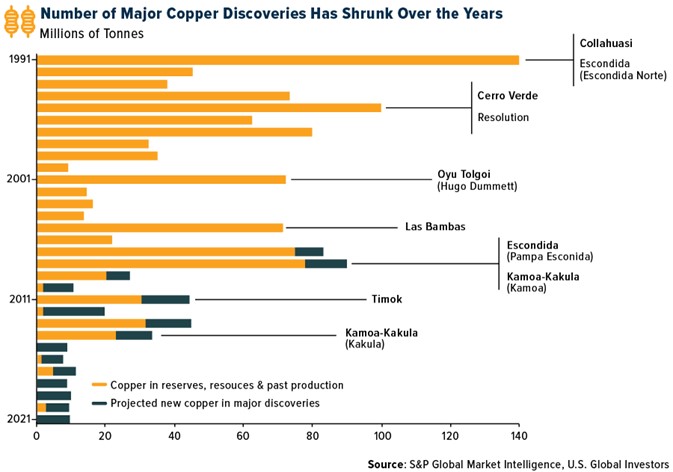
At the same time that copper demand is growing due to the energy transition, the global supply pipeline is thinning due to shrinking exploration budgets and a dramatic slowdown in the number of new deposits.
Take a look at the chart above, courtesy of S&P Global. Copper exploration budgets have not managed to generate a meaningful increase in major new discoveries. According to S&P Global, most of the copper that’s produced every year comes from assets that were discovered in the 1990s.
It may be a good time to consider getting exposure with a high-quality copper miner such as Ivanhoe Mines or a broad-based commodities fund that gives you access to copper exploration and production.
There’s a lot of money being made through the business of professional sports leagues. The NBA, MLB, NHL, all have very profitable business models, and although the businesses are all similar, the NFL leads the other U.S. based leagues in generating revenue. The once tax-exempt entity has a dual business structure with multiple layers of income that continues to expand. Below we cover the multiple ways the NFL, and the months-long drive of more than 30 teams to the Superbowl, ring the register.
In 2015, the National Football League forfeited its tax-exempt status with the IRS. The league had benefitted from the unique status beginning in 1942. The decision was based in part on mounting criticism over its rapidly growing earnings streams.
These streams largely come from the 32 teams that make up the NFL, thirty-one of the ball clubs are privately owned, while just one, the Green Bay Packers, continues to operate under a non-profit public corporation status. The clubs all form a trade association through which funds are directed back to the NFL board, some find their way distributed back to the teams.
This form of entertainment rakes in money on many fronts. In-person attendance, TV viewers, different forms of wagering, and advertising dollars all feed into overall league revenue after costs such as salaries that can $50 million annually.
Tickets to the Super Bowl 2023 event between the Kansas City Chiefs and the Philadelphia Eagles are averaging about $10,000. The higher end seats are in the $40,000 range, about the same as a Tesla Model S.
Tax Exemption of Teams
The team with tax-exempt status is exempt from paying all or some of federal income taxes. This status had been maintained by all NFL teams from 1945 through 2015.
The NFL voluntarily opted to give up its tax-exempt status in 2015 and began paying taxes. Some contend this change avoids further negative public outcry. It seems the economic benefits were not as significant as the public relations disadvantages.
Business Structure
The league separates its income streams into local and national categories. On the national side, the NFL negotiates national merchandise, licensing, and television contracts. The 32 teams receive equal shares of this money, regardless of individual team performance.
Local income is generated through concession sales, ticket sales, and corporate sponsors. This doesn’t nearly cover the cost of fielding a professional football team. Using the Green Bay Packers as a benchmark, the team had expenses totaling $410 million in its fiscal year 2021. Most of this number was attributable to player salaries, with the remainder used for stadium maintenance, advertising, and team and administration expenses.
How Teams Make Money
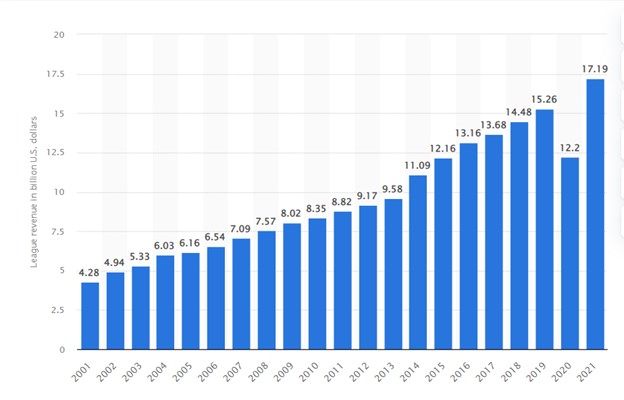
The majority of any NFL team’s revenue comes from TV arrangements. Ticket revenues, licensing, merchandising agreements, and endorsement deals are additional income sources.
Revenue of All National Football League Teams from 2001 to 2021 (in billion U.S. dollars)
Televised Rights and Deals – The Super Bowl is among the most watched television events in America each year. The regular games broadcast on Sundays, Mondays, and Thursdays throughout the regular season will consistently have the best TV ratings. This is why media corporations pay an above average amount for the right to broadcast them.
The traditional television industry now competes with other video-based programming, all pulling the attention of those seeking entertainment. The NFL audience and draw are not in decline. NFL teams still generate massive local and even international revenue through TV contracts. The individual clubs receive significant amounts from television providers thanks to multibillion-dollar contracts, and there are even more television viewers and broadcasts of games than other programs on set.
Image Credit: Karen (Flickr)
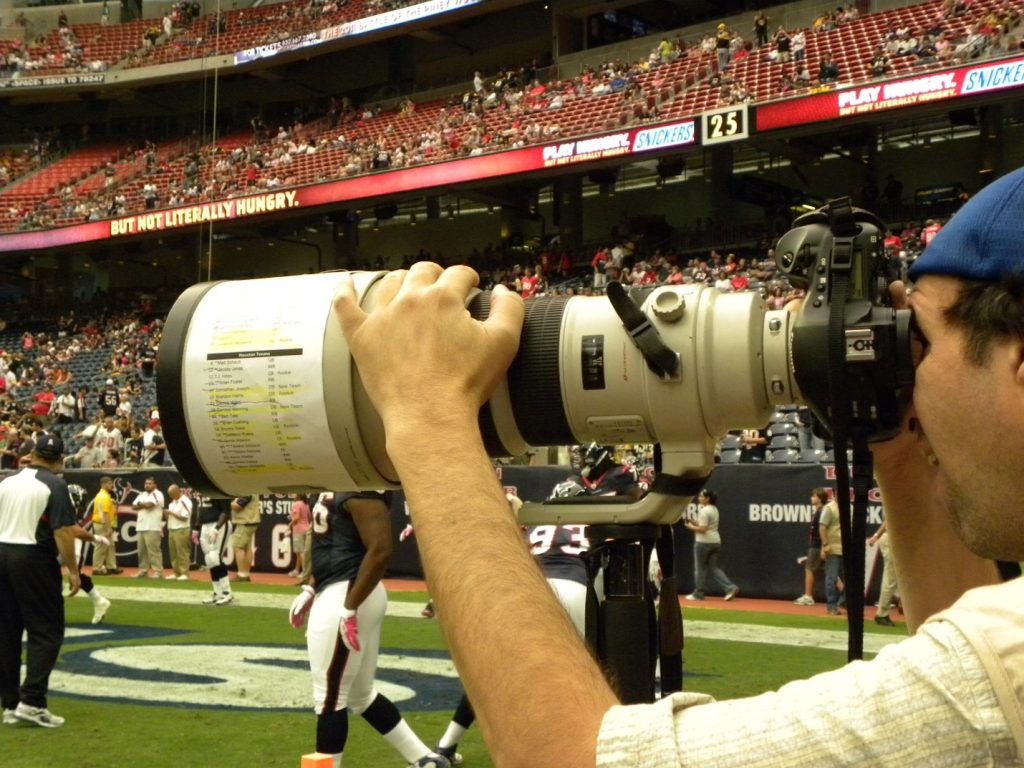
Tickets and Vendor Rental – Far below the rapidly increasing money from TV deals, ticket sales are a large source of income for individual teams. NFL games often sell out, with an estimated average ticket price of $151 and a stadium capacity of roughly 70,000. It’s a nice add-on to broadcast viewership.
NFL teams can also use their stadiums to hold non-football activities, like concerts within local restrictions.
The cash flow on the rental of space to vendors to sell food and drinks at games are also significant in a stadium with 70,000 fans as a captive audience.
Image Credit: RaymondClarkeImages (Flickr)
Official Sponsorships – Corporate sponsors pay NFL teams to put their logos on products, TV transitions, player jerseys, etc. The franchise rights to NFL grounds naming of stadiums are extremely desirable among corporate advertisers.
The naming right to So-Fi Stadium in LA, home of the Los Angeles Rams, is in the neighborhood of $30 million annually, and similar rights to Allegiant Stadium in Las Vegas is estimated at between $20 and $25 million annually.
Gambling Franchises – Some NFL teams take advantage of this method by opening betting platforms in their stadiums, collaborating with well-known casinos, creating online sports betting websites, and other strategies. This is an area of rapid expansion as sports betting becomes legalized across the US and technology provides opportunities for betting on fragments of the game in addition to the more traditional methods. Incremental income from these growing arrangements has expanded income opportunities among teams.
Image Credit: Karen (Flickr)
Costs
Overall, like any business, the NFL will undoubtedly explore all the opportunities for meaningful income that present itself. Of course the overall income is best measured net of expenditures that include marketing, cost of athletes and other entertainers, management, upkeep, and renovations.
Take Away
One of the most financially successful professional sports leagues in the US and across the globe is the NFL. Most of the teams’ revenues are generated from broadcasting and licensing deals. The growth in revenue, with the exception of one year during the pandemic curbs, has been accelerating. Technology has brought new methods to gamble on sports, along with some friendly gaming legislation across the nation. This is additive to the bottom line.
It appears that the trend, which has survived some public relations setbacks, isn’t going to continue as Americans tend to spend many hours during the winter months immersed in the sport of football.
Managing Money Is as Important as Making It: The Sad Case of Athletes Going Broke
Lacking a solid team is a recipe for organizational failure, and those intending to excel in business—or any other sector—must invest in management. Considering that many professional athletes encounter bankruptcy shortly after retiring, they are a demographic that could greatly benefit from quality financial management teams. Elite athletes earn millions of dollars during a short time, but few succeed at multiplying their earnings to create wealth. An investigation by the Global Financial Literacy Center found that 16 percent of National Football League (NFL) players declare bankruptcy within twelve years of retirement. Quite startling is that some athletes report bankruptcy as early as two years after retirement.
The results of the study also showed that NFL stars were just as likely to experience bankruptcy as other NFL players. Bankruptcy figures are equally daunting for basketball players. Research reveals that National Basketball Association (NBA) players who file for bankruptcy do so within 7.3 years after retirement, and 6.1 percent of all NBA players go bankrupt within fifteen years of exiting their profession. The emotional trauma of bankruptcy can lead to distress. Research indicates that 78 percent of NFL players experience financial distress two years after retirement.
Inept management of finances is the easiest strategy for losing wealth. Professional athletes can avert financial calamities by investing in a better management team. There is a stark difference between managing a junior athlete and managing a superstar who earns millions of dollars yearly. A professional who manages a junior athlete could be an excellent manager for a player at that stage, but the transition to elite status requires people with greater expertise.
In business, a manager should possess the relevant skills. They don’t have to be your friend. Elite athletes need elite managers to help them navigate stratospheric wealth. If a manager doesn’t have expertise in managing successful athletes or businesses, then he is unfit to manage an elite athlete. Athletes who succeed at expanding their empires are reluctant to rely on the services of amateurs.
Magic Johnson credits his success to investing in capable people rather than to the “wisdom” of family members and old friends. Pablo S. Torre paints Johnson as a serious businessman in a piece highlighting the failures of professional athletes:
Johnson started out by admitting he knew nothing about business and sought counsel from . . . men such as Hollywood agent Michael Ovitzand and Peter Guber. Now, Johnson says, he gets calls from star players “every day” . . . and cuts them short if they propose relying on family and friends.
Johnson’s strategy is even more relevant in light of the recent financial scandal involving the disappearance of over twelve million dollars held by sprinting legend Usain Bolt in Jamaican investment firm Stock and Securities Limited (SSL). Venting to reporters, Bolt’s attorney Linton Gordon argues that the Financial Services Commission (FSC) should be held liable for the mishap because the agency lapsed in providing proper oversight:
They should bear responsibility to some extent, if not entirely, because all along they kept quiet and did not alert the public, including Mr. Bolt, to the fact that the company was not operating in a way compliant with the law. It’s 10 years now they say they have been red flagging this company. Had he known that he would have withdrawn his money and he would not have lodged anymore.
Blaming the regulator is easy, but the debacle reveals deficits in Bolt’s management team. Usain Bolt did not need to know that SSL was deemed unsound years ago because his management team should have furnished him with that information. Some years ago, I was at an event where fellow investors argued that SSL was irredeemable. Bolt’s managers were out of the loop. Moreover, Jamaica is known for institutional weakness and fraud, so it’s a bit weird that a man of Bolt’s stature would have so much money stored in a Jamaican institution to begin with.
Some say that the FSC must be accountable for the misappropriation of Bolt’s money, but the FSC penned a report that Bolt’s managers would have seen if they were doing research. Moreover, in a country where agencies are frequently compromised by politics, there is a possibility that the FSC did not suspend the operations of SSL because it was constrained by rogue actors. Bolt’s managers should have shown some insight by recommending that the superstar limit his Jamaican investments and by soliciting the services of leading wealth management firms like UBS Wealth Management or Baird.
The case study of Usain Bolt demonstrates that even athletes with good managers should never hesitate to upgrade when their employees are not equipped for bigger challenges. Money is hard to make, but with a bad manager, it’s easy to lose. Therefore, athletes interested in keeping their money must invest in the right team or face the consequences.
About the Author:
Lipton Matthews is a researcher, business analyst, and contributor to Merion West, The Federalist, American Thinker, Intellectual Takeout, mises.org, and Imaginative Conservative. He may be contacted at lo_matthews@yahoo.com
Is the Mismatch in Workers and Open Jobs Proving to Be Transitory?
Inflation has been the most bearish word for the stock and bond markets over the past year or more. Shortly after many of the supply chain issues cleared up, and the cargo ships were no longer stacked up outside of major ports, attracting scarce workers with higher pay became a growing cause of inflationary pressure. At the end of November 2022, Federal Reserve Chair Jerome Powell stated that “job openings exceed available workers by about 4 million.” That number has now grown to 4.7 million after the continued strengthening of the market for qualified labor.
This mismatch, depicted in the Fed Data below, between available positions and workers to fill them, developed a more inflationary trend. The graph depicts the mismatch of labor supply and demand and the extent that it has worsened.
When the civilian labor force is greater than employment plus job openings, the economy has an immediate capacity to fill open positions. Currently, the employment level plus job openings are at 170.5 million, while the total labor force is at 165.8 million. Thus the 4.7 million quoted earlier. There are a whopping 4.7 million more jobs available compared to people available to fill them.
The civilian labor force, the amount of people working or looking for a job, is shown below in red; the current employment level plus the number of job openings is shown in blue.
The pandemic has been emphasized as a cause of this not-very-transitory labor shortage, but the trends in labor demand and labor supply in the graph above indicate that demand was already outpacing supply as the US entered 2018. This was two years before the novel coronavirus hit US shores. Back then the mismatch was about one million workers fewer than jobs available before the economic disruption.
As the US began to move toward business-as-usual, news and market analysts offered many explanations for the labor shortage. These included childcare problems, health concerns, minimum wage pushback, and even a wave of new retirees.
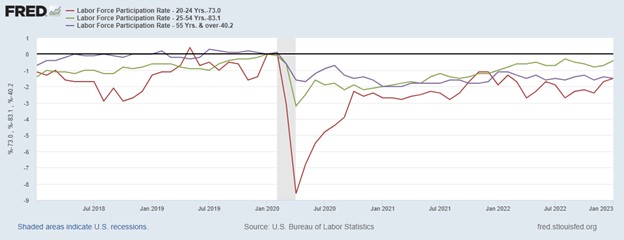
The visual below shows the change experienced in the labor force participation rate (LFPR) for specific age groups: 20 to 24 years old, 25 to 54 years old, and 55+ years old. By subtracting the most recent LFPR from that of January 2020 we get the percentage-point change in labor force participation relative to the month just before the pandemic began impacting businesses.
When the pandemic hit, the sharpest decline in the LFPR was for workers between the ages of 20 and 24. Their LFPR decreased from 73% to 64.4% in 4 months before increasing again. However, at the end of 2022, the LFPR for 20- to 24-year-olds still hadn’t fully recovered and remained 1.7 percentage points below its January 2020 value.
This overall pattern is similar but less extreme for the other age groups. Although no age group fully recovered by the end of 2022, the 25-54 group was closest, at 0.7 percentage points below its January 2002 level. There’s been speculation older workers retired early (and permanently) during the pandemic, and the 55+ group remained 1.4 percentage points below its January 2020 level as of December 2022, with no sign of further recovery.
The mechanisms that cause inflation are widely understood. If there is a shortage of goods because of the supply chain, sellers can ask more for the product. If the cost of producing goods or providing services increase, perhaps because of the cost of labor, the seller may try to pass those higher costs along. On the demand-pull side, if there is an abundance of currency, this increases demand for goods and services and is also inflationary.
While the Fed has been waging a fight against rising prices by removing liquidity and ratcheting up the cost of money (interest rates), the number of open jobs compared to the number of workers available to fill them has widened.
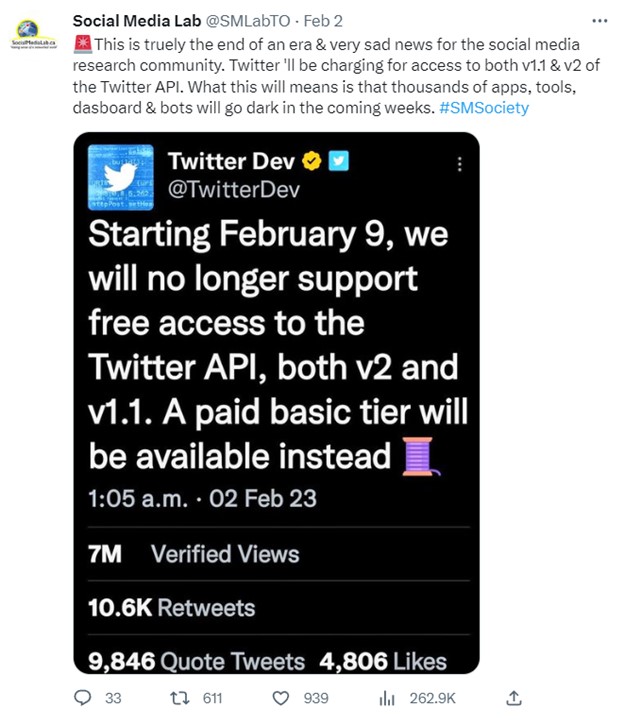
Twitter’s New Data Fees Leave Scientists Scrambling for Funding – or Cutting Research
Twitter is ending free access to its application programming interface, or API. An API serves as a software “middleman” allowing two applications to talk to each other. An API is an accessible way to collect and share data within and across organizations. For example, researchers at universities unaffiliated with Twitter can collect tweets and other data from Twitter through their API.
Starting Feb. 9, 2023, those wanting access to Twitter’s API will have to pay. The company is looking for ways to increase revenue to reverse its financial slide, and Elon Musk claimed that the API has been abused by scammers. This cost is likely to hinder the research community that relies on the Twitter API as a data source.
The Twitter API launched in 2006, allowing those outside of Twitter access to tweets and corresponding metadata, information about each tweet such as who sent it and when and how many people liked and retweeted it. Tweets and metadata can be used to understand topics of conversation and how those conversations are “liked” and shared on the platform and by whom.
This article was republished with permission from The Conversation, a news site dedicated to sharing ideas from academic experts. It represents the research-based findings and thoughts of, Jon-Patrick Allem, Assistant Professor of Research in Population and Public Health Sciences, University of Southern California.
As a scientist and director of a research lab focused on collecting and analyzing posts from social media platforms, I have relied on the Twitter API to collect tweets pertinent to public health for over a decade. My team has collected more than 80 million observations over the past decade, publishing dozens of papers on topics from adolescents’ use of e-cigarettes to misinformation about COVID-19.
Twitter has announced that it will allow bots that it deems provide beneficial content to continue unpaid access to the API, and that the company will offer a “paid basic tier,” but it’s unclear whether those will be helpful to researchers.
Blocking Out and Narrowing Down
Twitter is a social media platform that hosts interesting conversations across a variety of topics. As a result of free access to the Twitter API, researchers have followed these conversations to try to better understand public attitudes and behaviors. I’ve treated Twitter as a massive focus group where observations – tweets – can be collected in near real time at relatively low cost.
The Twitter API has allowed me and other researchers to study topics of importance to society. Fees are likely to narrow the field of researchers who can conduct this work, and narrow the scope of some projects that can continue. The Coalition for Independent Technology Research issued a statement calling on Twitter to maintain free access to its API for researchers. Charging for access to the API “will disrupt critical projects from thousands of journalists, academics and civil society actors worldwide who study some of the most important issues impacting our societies today,” the coalition wrote.
@SMLabTO (Twitter)
The financial burden will not affect all academics equally. Some scientists are positioned to cover research costs as they arise in the course of a study, even unexpected or unanticipated costs. In particular, scientists at large research-heavy institutions with grant budgets in the millions of dollars are likely to be able to cover this kind of charge.
However, many researchers will be unable to cover the as yet unspecified costs of the paid service because they work on fixed or limited budgets. For example, doctoral students who rely on the Twitter API for data for their dissertations may not have additional funding to cover this charge. Charging for access to the Twitter API will ultimately reduce the number of participants working to understand the world around us.
The terms of Twitter’s paid service will require me and other researchers to narrow the scope of our work, as pricing limits will make it too expensive to continue to collect as much data as we would like. As the amount of data requested goes up, the cost goes up.
We will be forced to forgo data collection on some topic areas. For example, we collect a lot of tobacco-related conversations, and people talk about tobacco by referencing the behavior – smoking or vaping – and also by referencing a product, like JUUL or Puff Bar. I add as many terms as I can think of to cast a wide net. If I’m going to be charged per word, it will force me to rethink how wide a net I cast. This will ultimately reduce our understanding of issues important to society.
Difficult Adjustments
Costs aside, many academic institutions are likely to have a difficult time adapting to these changes. For example, most universities are slow-moving bureaucracies with a lot of red tape. To enter into a financial relationship or complete a small purchase may take weeks or months. In the face of the impending Twitter API change, this will likely delay data collection and potential knowledge.
Unfortunately, everyone relying on the Twitter API for data was given little more than a week’s notice of the impending change. This short period has researchers scrambling as we try to prepare our data infrastructures for the changes ahead and make decisions about which topics to continue studying and which topics to abandon.
If the research community fails to properly prepare, scientists are likely to face gaps in data collection that will reduce the quality of our research. And in the end that means a loss of knowledge for the world.
Further Evidence of his Future Outlook is Provided By “The Big Short” Michael Burry
It has been three-plus years since Michael Burry first warned that index funds’ popularity is creating distorted valuations of stocks included in the larger indexes. The reason for his warning is fund managers need to own the companies in the index. This creates buying pressure on stocks that might not otherwise be as strong of a buy candidate. In other words, investments are not being purchased on their own merit and, therefore could be thought of as overvalued. He called this the “passive investment bubble,” and he is still warning investors about a stock market investment bubble.
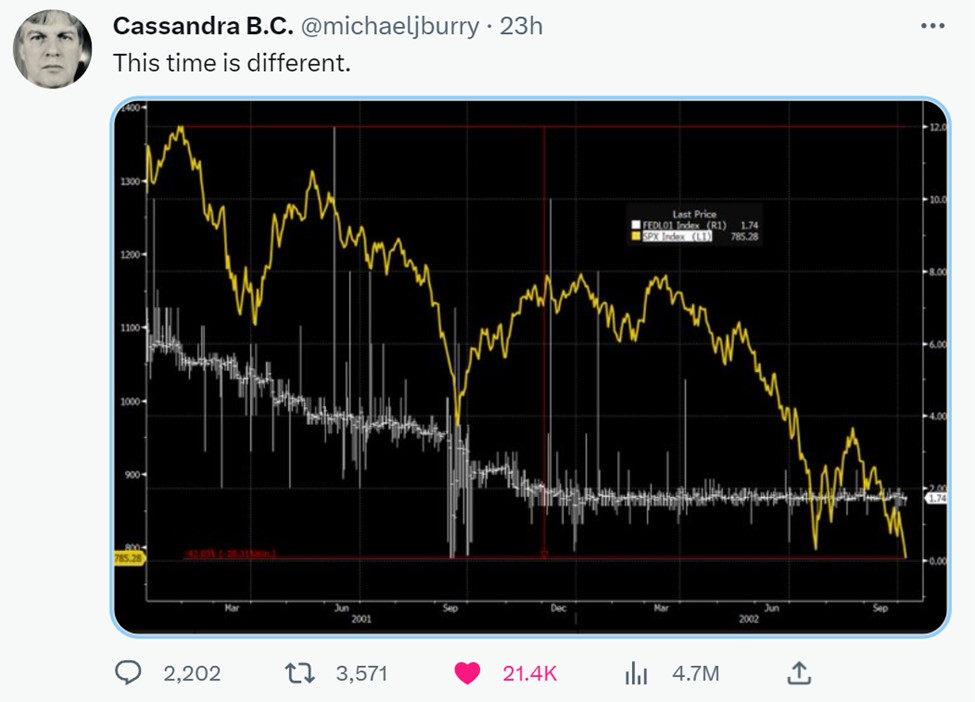
“Difference between now and 2000 is the passive investing bubble that inflated steadily over the last decade,” he tweeted late last year. “All theaters are overcrowded, and the only way anyone can get out is by trampling each other. And still, the door is only so big,” Burry said in October 2022. While his SEC filings show he is not opposed to owning individual stocks with a unique opportunity, he’s expecting a market collapse that dwarfs the dot-com crash because there’s so much money parked in index funds.
This week Burry provided a backup argument to his thesis in the form of a chart. The Bloomberg produced chart showed the S&P’s 40% plunge between February 2001 and October 2002. The S&P data was plotted alongside the sharp decline in the Fed Funds overnight benchmark interest rate. Burry’s latest tweet suggests a feeling of deja-vu that includes the stock market’s surge in early 2001, when rates were 6%. There seems to be concern that market participants are looking for enough weakness for the Fed to drop rates. The chart, and his written message is one to be careful what you wish for.
His tweet read, “This time is different.” This apparent sarcasm could be read, if you want lower rates, it may come at a cost.
Image: @michaeljburry (Twitter)
Burry seems to expect enough economic weakness that the Fed will again ratchet down rates in a hurry. The poor economic scenario would likely cause the S&P 500 to tumble.
Take Away
Higher rates encourage traditional savings, which then becomes money not used to stimulate the economy. It also slows growth by making borrowing more expensive. This dampens demand and increases the risk of a bad recession. Burry, a widely followed hedge fund manager has been warning of the broader market taking a huge hit.
Burry has noted that blistering but brief rallies are common during market downturns.
Do the Most Current Economic Measurements Suggest a Trend Toward Recession or Growth?
How is the US Economy Doing?
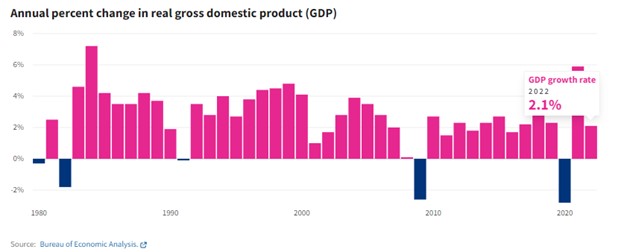
US GDP increased 2.1% in 2022 after increasing 5.9% in 2021.
Year-over-year inflation, the rate at which consumer prices increase, was 6.5% in December 2022.
The Federal Reserve raised interest rates seven times in 2022 and again on February 1, 2023 to curb inflation, increasing the target rate from near zero to 4.5-4.75%.
When accounting for inflation, workers’ average hourly earnings were down 1.7% in December 2022 compared to a year prior.
The ratio of unemployed people to job openings remained at or near record lows throughout 2022.
The unemployment rate was 4.0% at the beginning of 2022 and ended the year at 3.5%.
The labor force participation rate remains almost one percentage point below February 2020.
From January to November 2022, the US imported $889.9 billion more in goods and services than it exported. This is 7% higher than the trade deficit in 2021 for the same months.
US GDP increased 2.1% in 2022 after increasing 5.9% in 2021
Gross domestic product (GDP) fell in the first half of 2022 but grew in the second half. GDP reached $25.5 trillion in 2022.
US GDP
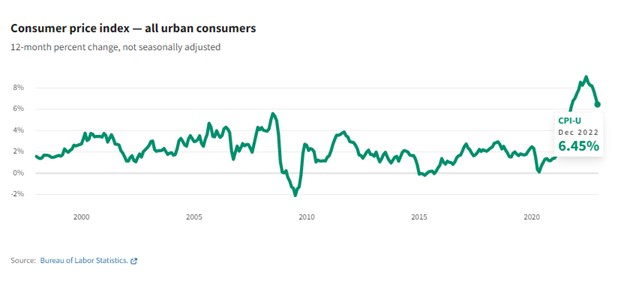
Year-over-year inflation, the rate at which consumer prices increase, was 6.5% in December 2022
That’s down from June 2022’s rate of 9.1%, the largest 12-month increase in 40 years. Inflation grew at the beginning of the year partly due to rising food and energy prices, while housing costs contributed throughout 2022.
CPI-U
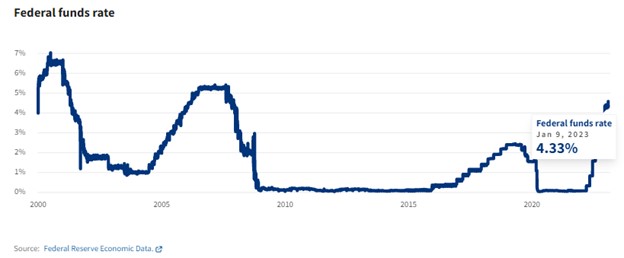
The Federal Reserve raised interest rates seven times in 2022 and again on February 1, 2023 to curb inflation, increasing the target rate from near zero to 4.5-4.75%
Rate increases make it more expensive for banks to borrow from each other. Banks pass these costs on to consumers through increased interest rates. Read more about how the Federal Reserve tries to control inflation here.
Fed Funds Rate
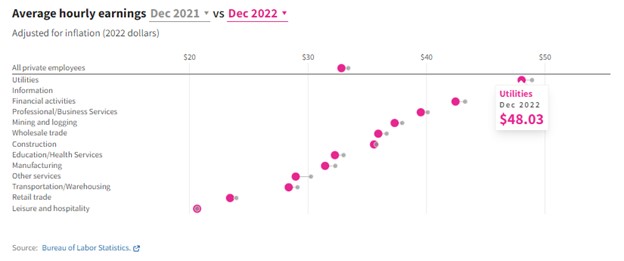
When accounting for inflation, workers’ average hourly earnings were down 1.7% in December 2022 compared to a year prior
Inflation-adjusted average hourly earnings fell in all industries except information and leisure and hospitality, where earnings were flat.
Hourly Earnings
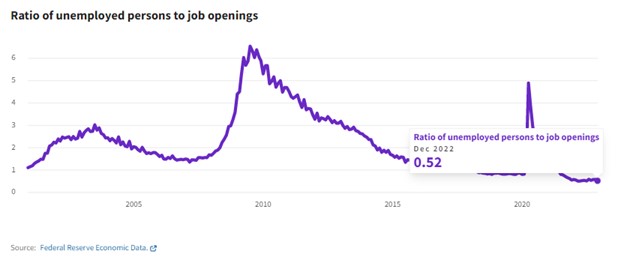
The ratio of unemployed people to job openings remained at or near record lows throughout 2022
In a typical month from March 2018 and February 2020, there were between 0.8 and 0.9 unemployed people per job opening. But after more than quadrupling in April 2020 at the onset of the pandemic, the ratio fell and settled from December 2021 to December 2022 to between 0.5 and 0.6 unemployed people per job opening, the lowest since data first became available in 2000.
Unemploymed Ratio
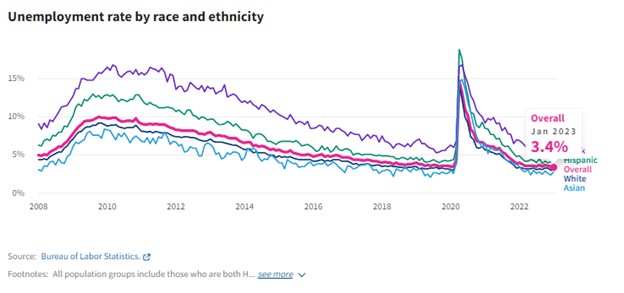
The unemployment rate was 4.0% at the beginning of 2022 and ended the year at 3.5%
It decreased most for Black and Asian people, 1.2 and 1.1 percentage points, respectively. Black people still have unemployment rates higher than the rest of the nation.
Categorized Unemployment Rate
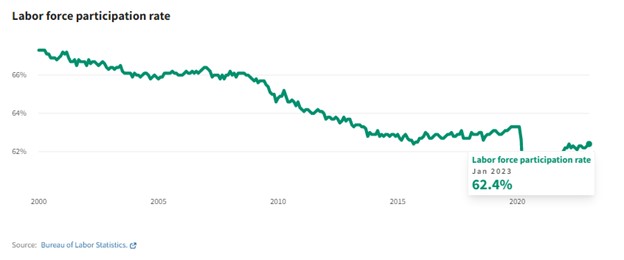
The labor force participation rate remains almost one percentage point below February 2020
An additional 2.5 million workers would need to be in the labor force for the participation rate to reach its pre-pandemic level.
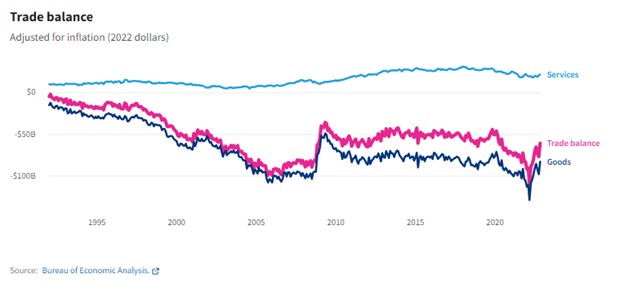
From January to November 2022, the US imported $889.9 billion more in goods and services than it exported. This is 7% higher than the trade deficit in 2021 for the same months
During this time, the goods trade deficit reached $1.1 trillion. Complete 2022 data is expected on February 7, 2023.
Trade Balance
This content was republished from USAFacts. USAFacts is a not-for-profit, nonpartisan civic initiative making government data easy for all Americans to access and understand. It provides accessible analysis on US spending and outcomes in order to ground public debates in facts.
Recent Investment Trends Include Small-Cap Artificial Intelligence Stocks
C3 AI, sometimes written C3.ai, is an artificial intelligence platform that provides services for companies to build large-scale AI applications. Its stock had the fifth highest traded shares among Fidelity’s retail investors on Monday (February 6). This included a record-breaking $31.4 million worth of shares traded among the broker’s individual self-directed traders. According to Reuters, “Retail investors are piling up on small-cap firms that employ artificial intelligence amid intensifying competition between tech titans.” The article points to Google and Microsoft as examples of companies that expect AI to be the next meaningful driver of growth.
Investors, for their part, are looking to get ahead of any acquisition spree that deep-pocketed companies may embark on, which could include buying the advanced technology by acquiring small-cap tech firms.
Focus Heightened by ChatGPT
The spotlight ChatGPT finds itself in, three months after its launch, is indicicative of the interest in this technology amongst investors and users. With applications as numerous than one can think up, the technology could outdate many services provided by tech companies like Alphabet (GOOGL), or Microsoft (MSFT) – big tech has catching up to do. This seems to have created a race by cash rich companies to not be disrupted and left behind.
Investor’s recent focus on small companies in this space prefer those that are concentrated in AI technology. One main reason is that small-cap or microcap firms in this space are likely to have AI as a more concentrated part of their business. The bet being that whether the small company continues to grow independently, or is acquired by a larger firm looking to instantly be par with current technology, doesn’t much matter, it is a win for the investor if either occurs.
And it is a win, C3 AI stock rallied 46% last week, and climbed another 6.5% on Monday. It is now up 146% year to date.
Other Companies Involved
SoundHound AI, provides a voice AI platform services, and Thailand-based security firm Guardforce AI have more than doubled so far this year, while analytics firm BigBear.AI has increased ninefold.
US-listed shares of Baidu Inc climbed after the Chinese search engine indicated it would complete an internal test of a ChatGPT-style project called “Ernie Bot” next month.
Shares of Microsoft, which supports ChatGPT parent OpenAI, had been ratcheting up over the past month. The company is expected to make an announcement on their AI gained 1.5% in premarket trading ahead of the AI plans this week.
Google-owner Alphabet Inc said this week it would launch Bard, a chatbot service for developers, alongside its search engine.
Take Away
Change in technology that leads to improvements in daily lives has always been a focus of investors betting on which companies will outlast the others with “the next big thing.” These companies start out as small growth companies as Apple (AAPL) did in 1976. Then, a number of paths lay ahead. They either grow on their own like the Jobs/Wozniak computer maker did, get acquired for an early payday for investors and other stakeholders, or they can be outcompeted leaving investors with a non-performing asset.
Channelchek is a platform that specializes in bringing data and research on small-cap companies, including many varieties of new technology, to the investors that insist on being informed before they place a trade. Discover more on the industries of tomorrow by signing up for notifications in your inbox from Channelchek by registering here.
A Journey from Work to Home is about More than Just Getting There – the Psychological Benefits of Commuting that Remote Work Doesn’t Provide
For most American workers who commute, the trip to and from the office takes nearly one full hour a day – 26 minutes each way on average, with 7.7% of workers spending two hours or more on the road.
Many people think of commuting as a chore and a waste of time. However, during the remote work surge resulting from the COVID-19 pandemic, several journalists curiously noted that people were – could it be? – missing their commutes. One woman told The Washington Post that even though she was working from home, she regularly sat in her car in the driveway at the end of the workday in an attempt to carve out some personal time and mark the transition from work to nonwork roles.
This article was republished with permission from The Conversation, a news site dedicated to sharing ideas from academic experts. It represents the research-based findings and thoughts of Matthew Piszczek, Assistant Professor of Management, Wayne State University, Kristie McAlpine, Assistant Professor of Management, Rutgers University.
As management scholars who study the interface between peoples’ work and personal lives, we sought to understand what it was that people missed when their commutes suddenly disappeared.
In our recently published conceptual study, we argue that commutes are a source of “liminal space” – a time free of both home and work roles that provides an opportunity to recover from work and mentally switch gears to home.
During the shift to remote work, many people lost this built-in support for these important daily processes. Without the ability to mentally shift gears, people experience role blurring, which can lead to stress. Without mentally disengaging from work, people can experience burnout.
We believe the loss of this space helps explain why many people missed their commutes.
One of the more surprising discoveries during the pandemic has been that many people who switched to remote work actually missed their commutes. Gerald Streiter (Flickr)
Commutes and Liminal Space
In our study, we wanted to learn whether the commute provides that time and space, and what the effects are when it becomes unavailable.
We reviewed research on commuting, role transitions and work recovery to develop a model of a typical American worker’s commute liminal space. We focused our research on two cognitive processes: psychological detachment from the work role – mentally disengaging from the demands of work – and psychological recovery from work – rebuilding stores of mental energy used up during work.
Based on our review, we developed a model which shows that the liminal space created in the commute created opportunities for detachment and recovery.
However, we also found that day-to-day variations may affect whether this liminal space is accessible for detachment and recovery. For instance, train commuters must devote attention to selecting their route, monitoring arrivals or departures and ensuring they get off at the right stop, whereas car commuters must devote consistent attention to driving.
We found that, on the one hand, more attention to the act of commuting means less attention that could otherwise be put toward relaxing recovery activities like listening to music and podcasts. On the other hand, longer commutes might give people more time to detach and recover.
In an unpublished follow-up study we conducted ourselves, we examined a week of commutes of 80 university employees to test our conceptual model. The employees completed morning and evening surveys asking about the characteristics of their commutes, whether they “shut off” from work and relaxed during the commute and whether they felt emotionally exhausted when they got home.
Most of the workers in this study reported using the commute’s liminal space to both mentally transition from work to home roles and to start psychologically recovering from the demands of the workday. Our study also confirms that day-to-day variations in commutes predict the ability to do so.
We found that on days with longer-than-average commutes, people reported higher levels of psychological detachment from work and were more relaxed during the commute. However, on days when commutes were more stressful than usual, they reported less psychological detachment from work and less relaxation during the commute.
Creating Liminal Space
Our findings suggest that remote workers may benefit from creating their own form of commute to provide liminal space for recovery and transition – such as a 15-minute walk to mark the beginning and end of the workday.
Our preliminary findings align with related research suggesting that those who have returned to the workplace might benefit from seeking to use their commute to relax as much as possible.
To help enhance work detachment and relaxation during the commute, commuters could try to avoid ruminating about the workday and instead focus on personally fulfilling uses of the commute time, such as listening to music or podcasts, or calling a friend. Other forms of commuting such as public transit or carpooling may also provide opportunities to socialize.
Our data shows that commute stress detracts from detachment and relaxation during the commute more than a shorter or longer commute. So some people may find it worth their time to take the “scenic route” home in order to avoid tense driving situations.
Company Stock Repurchases Have Reached Record Levels
Stock buybacks often boom when borrowing costs are down. However, interest rates are currently as high as they have been in a while, yet buybacks are still surging. The rampant pace also flies in the face of new corporate taxes on the practice. US companies grabbing their own shares is one part of why the market has started the year very strong. The S&P 500 was up for a third week in a row to end January and kick off February. The pace shows no sign of slowing and may even pick up as earnings season and the related blackout periods are lifted. What’s involved in stock buybacks, and what has been the impact now, so early in 2023.
How is a Stock Buyback Executed?
Last week Meta Platforms (META) followed a few logistics companies, oil businesses, and even aerospace contractors by announcing an increase in management’s authorization to purchase its own shares. There are simple but important rules Meta and the others will have to abide by to conduct these purchases. The rules are to provide orderly markets, they fall under the Securities and Exchange Commission’s “Safe Harbor” for Issuer Repurchase, SEC 10b-18 protections.
The head trader at Noble Capital Markets, David Lean is a veteran equity trader whose desk has been involved in many stock repurchases. He explained the critical areas a broker has to follow. They are, Manner of Purchase, Timing, Price, and Volume.
“The company must purchase shares through a single broker or dealer during a single day,” Mr. Lean said, explaining that one day a company may choose a broker like Noble and provide instructions and criteria, it then is the only broker allowed to trade on behalf of the buyback plans that day. Another day a different single broker or dealer may be selected for the trading day.
As far as timing, the SEC has laid out the following guidelines: A company with an average trading volume less than $1 million per day or a public float value below $150 million is unable to trade within the last 30 minutes of trading. Companies with higher average-trading-volume and public float value can trade up until the last 10 minutes.
David Lean explained the trading price restrictions on behalf of the company, “The company must repurchase at a price that does not exceed the highest independent bid or the last transaction price quoted.” While a stock repurchase does put upward pressure on share prices, the act of repurchasing shares should not be allowed to bid up the price directly.
The rules on volume also help prevent the repurchase from being overly disruptive. “The company cannot purchase more than 25% of the average daily volume as measured over the previous four weeks,” according to Lean. He was also was quick to point out that there is an exclusion whereby “The company may make one ‘block’ purchase per week and not be subject to the 25% volume limitation, provided the ‘block’ purchase is the only Rule 10b-18 purchase made on that day.”
The SEC provides these “Safe Harbor” rules as a guide for all parties involved to understand the boundaries of acceptance in the eyes of the SEC.
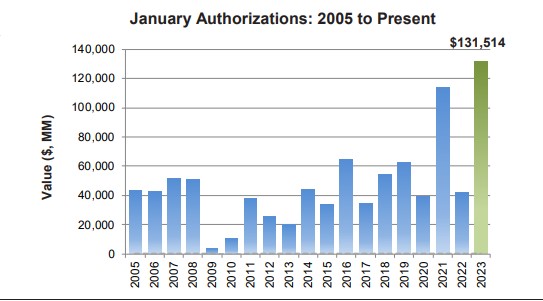
During the first month of 2023, announced corporate buybacks more than tripled to $132 billion from a year ago. Then, February kicked off with META immediately adding another $40 billion to the annual tally. According to data compiled by Birinyi Associates, January broke, by 15%, the previous record for a January set in 2021.
There has been no slowdown. According to Bloomberg, Morgan Stanley’s desk that executes buybacks saw orders increase 5%. This feeds into the market strength that thus far has characterized 2023, along increased buying interest from retail accounts, and quant funds.
This increase in stock buybacks in 2023 coes at the same tome a new tax levy on repurchases comes into play by the Inflation Reduction Act of 2022. According to the IRS the new code imposes a 1% excise tax on the aggregate fair market value of stock repurchased by certain corporations during the taxable year. The 1% levy is not deductible. The new tax indicates that the government doesn’t encourage companies repurchasing their own stock. In fact in the case of Chevron (CVX), they had been criticized by the White House for using their cash in this way rather than to try to increase output.
Take Away
Each company has its own reason to repurchase its own stock. However, in each case it could represent confidence in the future. There are rules put in place by the SEC that help provide orderly trading in the names, but the announcements themselves tend to create upward spikes in the names.
A new tax on the practice that came into effect on January 1 is going to cost the companies buying their shares 1%. This has not prevented the record levels of stock buybacks in January.
The Fed Chair’s Comments May be the Most Critical Market Event of the Week
It’s a quiet week for economic data. If the market takes a direction this week, it may have to take its lead from something other than statistics that indicate economic strength or weakness. This could be a Fed governor speaking, or a central bank outside of the US altering its hawkish stance.
Monday 2/6
With no consequential economic releases, market direction may take its tone from earnings reports from a wide swath of industries.
Tuesday 2/7
11:00 AM ET, New York Federal Reserve inflation expectations.
3:00 PM ET, Consumer Credit, or more definitively, the installment credit outstanding by consumers is expected to have increased by $25 billion in December versus November’s $27.9 billion increase. There is such a long delay reporting this number that it seldom has a market impact.
Fed Chair Jerome Powell will be speaking at the Economic Club of Washington.
Wednesday 2/8
10:00 AM ET, Wholesale Inventories revision for December is in line with the first estimate of 1%. Wholesale sales and inventory data can provide investors a chance to look below the surface of the consumer economy. Activity at the wholesale level can then be a precursor of consumer trends.
Thursday 2/9
8:30 AM ET, Jobless Claims, including Initial Claims and Continuing Claims, have been a big focus of the market as unemployment is running at a historically low pace. The consensus is for growth in Jobless levels to 190,000 versus 183,000 the prior week. Overall low claims would seem to be good news for the economy. The problem now is that it is except that it is worrisome for a Fed that views current inflationary pressures, including wage pressures unacceptably high.
Friday 2/10
• 10:00 AM ET, The University of Michigan’s Consumer Survey Center questions households each month on their assessment of current conditions and expectations of future conditions. Consumer sentiment is not expected to show much improvement, at a consensus 65.0 in the first reading for February versus 64.9 in January.
What Else
The FOMC meeting that ended on February 1 was the last before Chair Powell delivers the semiannual monetary policy testimony in late February or early March (not yet set). Any remarks by Fed officials in the February 6 week should be viewed in that context. Powell and associates will not want to confuse any upcoming message given at the semiannual Monetary Policy Report to Congress. Whatever is said is likely to foreshadow what will be in the report when he speaks before the Senate Banking Committee and the House Financial Services Committee.