

Monday, July 24, 2022
Michael Kupinski, Director of Research, Noble Capital Markets, Inc.
Jacob Mutchler, Research Associate, Noble Capital Markets, Inc.
Refer to the bottom of the report for important disclosures
Overview: Is The Recession Here? Economic activity is slowing, taking pressure off of inflation. But, the Fed seems intent on pushing interest rates higher, likely through the balance of this year. As such, recent economic forecasts anticipate GDP to contract over the next few quarters. This does not paint a favorable picture for advertising in the very near term. But, given the increased likelihood of a recession, has timeliness in media stocks improved?
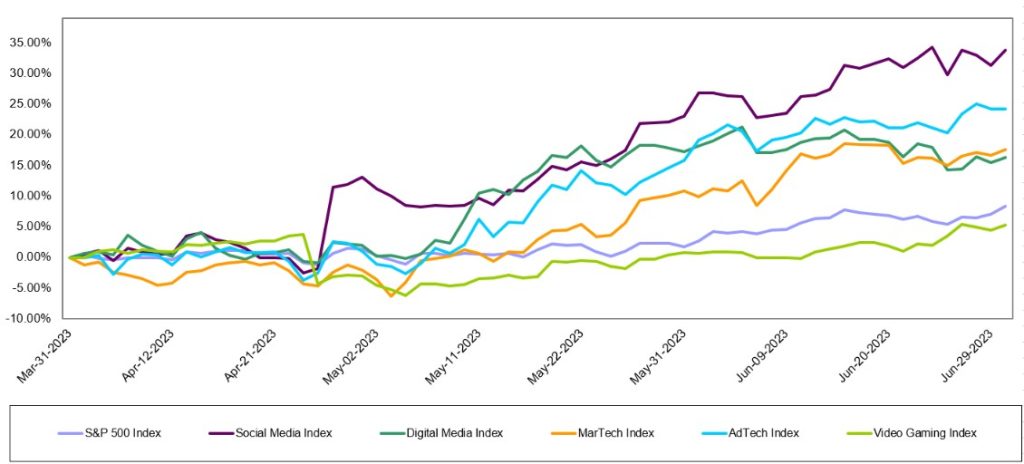
Digital Media & Technology: A broad based recovery? For the second quarter in a row, the best performing index was Noble’s Social Media Index, which increased by 34% in 2Q 2023, followed by Noble’s Ad Tech Index (+24%), MarTech Index (+18%), Digital Media Index (+16%), and Video Gaming Index (+5%). The largest stocks carried the performance in each of the indices. Can the stocks hold on to recent gains?
Broadcast Television: Are ad trends really improving? Recent reports indicate that television advertising is showing some improvement. While it is likely that Auto and Political advertising are bright spots, we remain skeptical that core advertising pacings are improving in the third quarter given the weak economic outlook. Nonetheless, the TV stocks appear to be cheap and we highlight a few of our key favorites.
Broadcast Radio: The pall over radio. Soft advertising trends heading into an economic downturn does not bode well for companies, like Audacy, that are in the midst of a financial restructuring. We believe that high debt leverage is the pall over the stocks. It is likely that many radio companies will go through a round of cost cutting to shore up cash flow in the midst of an economic downturn.
Publishing: Cash flow gurus. We do not believe that the Publishing industry will be spared from the weak advertising environment. The industry has a playbook for cutting costs, however, and has a history of maintaining cash flow through difficult times.
Overview
The Recession Is Here
Figure #1 YoY Real GDP Growth illustrates that the economy grew post pandemic through the first quarter 2023, reflecting a rebounding economy, fueled by government spending. But, economic activity is slowing, taking pressure off of inflation. Nonetheless, the Fed seems intent on pushing interest rates higher, likely through the balance of this year. Most economists anticipate that the Fed will raise interest rates by 25 basis points two times in the second half of this year. Not only will the interest rate increases be a headwind for the economy, but government spending, a key driver to the economy this year, is likely to wane. Recent economic forecasts anticipate GDP to contract over the next few quarters, a classic definition of an economic recession. The Conference Board of Economic Forecasts anticipate that the US economy will contract -1.2% in Q3 2023, -1.9% in Q4 2023, and -1.1% in Q1 2024.
This does not paint a favorable picture for advertising in the very near term. Advertising is highly correlated to personal disposable income, particularly discretionary income. If consumers have discretionary income, companies advertise for them to spend. As Figure #2 YoY Real Disposable Income Growth highlights, disposable income has declined over the past 18 months. Not surprisingly, economically sensitive National advertising has been down nearly 4 quarters and at high double digit rates. Given the significant declines, as much as 25% in each quarter for the past year, National advertising trends should moderate, given that the comps get easier. As such, even with an economic downturn becoming more visible, it is possible that National advertising declines may moderate.
National advertisers tend to spend when there is light toward the end of an economic recession, when consumer personal disposable income shows signs that it will improve and consumers have the propensity to spend. In our view, that light at the end of the tunnel is still pretty dim given the economic forecast that anticipates a decline in GDP through the Q1 2024. While the visibility of an improvement in National advertising seems to have improved as we enter an economic downturn, especially given the easing comps and the benefit from Political advertising (expected to begin in Q3 2023), we think that it is too early to be optimistic. The length and severity of an economic downturn is not yet visible.
What does this mean for the stock market and for media stocks? Figure #3 Federal Funds Rate Vs. S&P 500 performance illustrates the recent increases in Fed Funds rates had little effect on the general stock market as measured by the S&P 500 Index. Unfortunately, late cycle and economically sensitive media companies declined or under performed the stock market. In spite of Fed Fund rate increases over the past year, the S&P 500 Index increased 18% in the last 12 months. The anticipation of an economic recession, however, weighed on media stocks. The stock performance of the various media sectors that we follow are discussed in this report, but have generally under performed the market. The exception to the poor performance were the Internet and Digital Media stocks, which had a broad based recovery. Is it possible that early cycle media stocks will outperform the general market in the near term? In our view, yes. But, this may mean that the general market may decline as media stocks decline less. Historically, it has been the case to buy media stocks in the midst of a recession as media stocks strongly outperform the general market in a economic recovery. But given the likely disappointment in revenue in the coming quarters, it is likely that media stocks will be volatile as investors weigh the near term revenue and earnings disappointments to the prospect of a revenue rebound in an improved economic scenario. This would suggest that if one would try to time the stocks, investors may want to wait a quarter or two, buy on the improved momentum. This may mean that one might miss the large gains. As such, for long term investors, we believe that we are nearer to the bottom and that the downside appears relatively limited, valuations appear compelling. But, given the anticipate volatility in the near term, media investors should look for opportunistic purchases and accumulate positions in our favorite media names highlighted in this report.
Figure #1 YoY Real GDP Growth
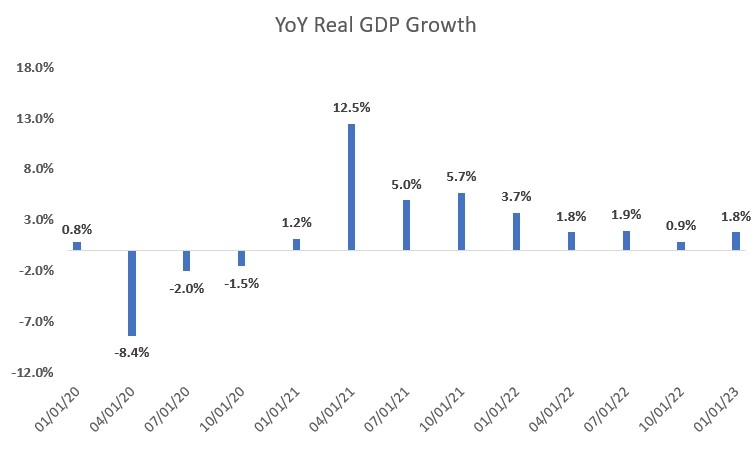
Source: Federal Reserve Bank of St. Louis
Figure #2 YoY Real Disposable Income Growth
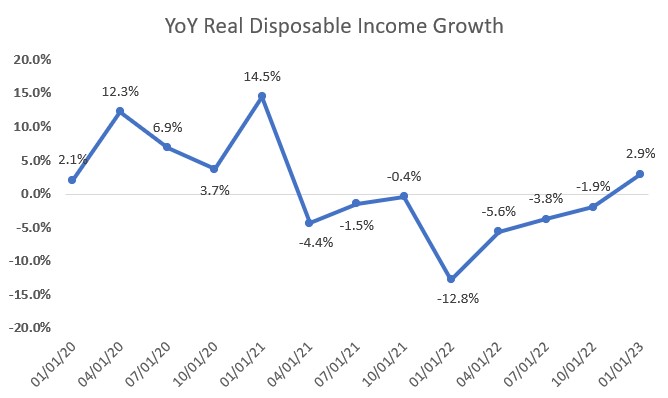
Source: Federal Reserve Bank of St. Louis
Figure #3 Federal Funds Rate Vs. S&P 500 performance
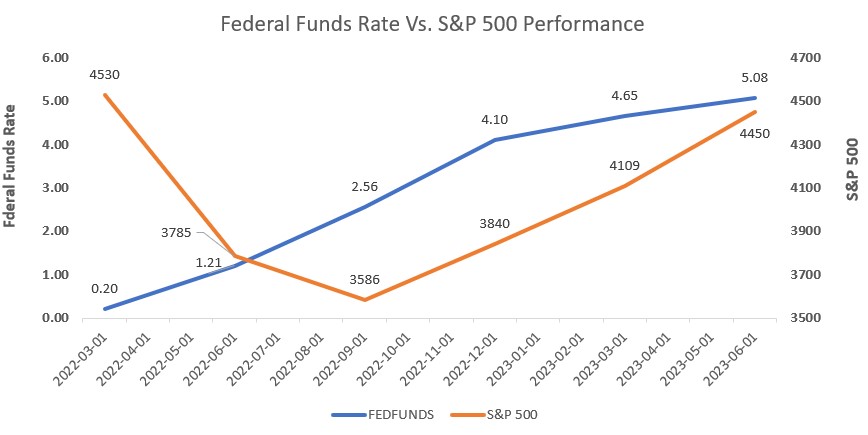
Source: Federal Reserve Bank of St. Louis & Yahoo Finance
Digital Media & Technology
A Broad-Based Recovery in Shares
The Internet and Digital Media sectors rebounded nicely over the last 12 months (LTM). As Figure #4 LTM Internet & Digital Technology Performance illustrates, the Video Gaming index was the only sector that underperformed the S&P 500 over the last year. The S&P 500 Index was up 17.6% over the LTM, outperforming the Video gaming index’s increase of 9.7% and in line with Noble’s Digital Media Index increase of 18%. The MarTech Index and AdTech Index both performed strongly, increasing 35.8% and 39.8%, respectively. The Social Media index had the strongest performance of the indices, increasing an impressive 80.2% over the LTM.
Figure #4 LTM Internet & Digital Technology Performance
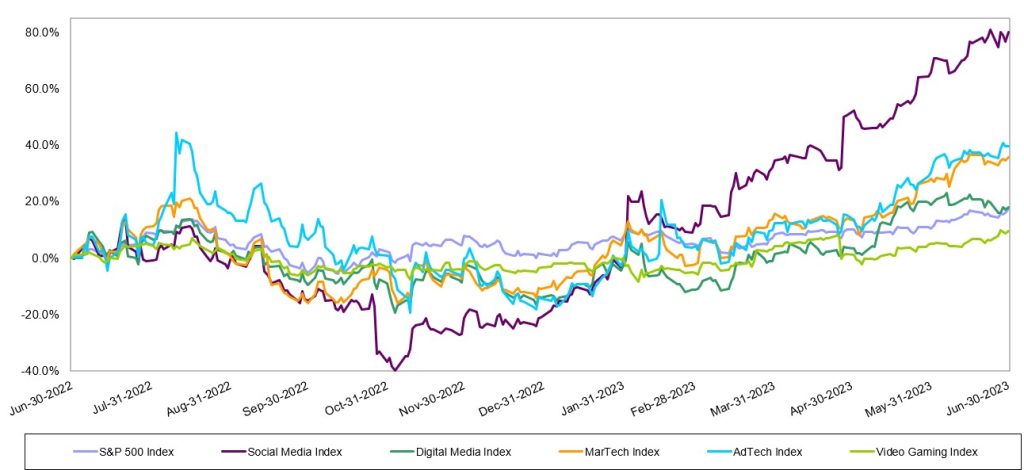
Source: Capital IQ
Despite macroeconomic headwinds that include higher interest rates, a regional banking crisis, elevated inflation and a war in Europe, the S&P 500 powered higher for the third quarter in a row. The S&P 500 Index continued its streak of steady increases, with an 8% increase in the Index in 2Q 2023, which followed a 7% increase in 1Q 2023 and a 7% increase in 4Q 2022. The broad index is up a healthy 24% since the end of the third quarter of 2022. The S&P 500 bottomed on October 12, 2022, and is up 26% from that date through mid-July.
The S&P 500’s performance was driven primarily by its largest constituents. As a market weighted index, the largest stocks have an outsized impact on its performance, and that was certainly the case in 2Q. Eight of the largest stocks in the S&P 500 Index were up in 2Q 2023 by 2x-3x or more than the Index’s 8% gain. Stocks that powered the Index higher included Nvidia (NVDA, +52%), Meta Platforms (a.k.a Facebook, META, +35%), Netflix (NFLX, +28%), Amazon (AMZN, +26%), Tesla (TSLA, +26%), Microsoft (MSFT, +18%), Apple (AAPL, +18%) and Google (GOOGL, +15%).
Noble’s Internet and Digital Media Indices, which are also market cap weighted, also powered higher thanks to the biggest constituents in their respective Indices. Each of these Indices posted double digital percent increases, with only the exception being Noble’s Video Gaming Index (+5%), which slightly underperformed the broader market/S&P Index. For the second quarter in a row, the best performing index was Noble’s Social Media Index, which increased by 34% in 2Q 2023, followed by Noble’s Ad Tech Index (+24%), MarTech Index (+18%), Digital Media Index (+16%), and Video Gaming Index (+5%).
Meta Powers the Social Media Index Higher
We attribute the strength of the Social Media Index to its largest constituent, Meta Platforms, whose shares increased by 35% in the second quarter. We noted last quarter that Meta appeared to be returning to its roots and focusing on profitability, rather than its nascent and riskier web3 initiatives. That return to its core strengths has been greatly rewarded by investors. Shares of Meta were up 225% from its 52-week low of $88.09 per share in early November through the end of June. Shares are up another 8% since the start of the third quarter with the launch of Threads, Meta’s answer to Twitter. Over 100 million people signed up for Threads within the first five days of its rollout. Meta has not yet begun to monetize this opportunity, but it will clearly add to its growth in coming quarters.
Ad Tech Stocks Embark on a Broad-Based Recovery Following a Difficult 2022
Noble’s AdTech Index increased by 24% in 2Q 2023, and this performance was very broad based, with 15 of the 24 stocks in the sector up, and a dozen of the stocks up by double digits. Ad Tech stocks that performed best during the quarter include Applovin (APP, +63%), Magnite (MGNI, +47%), Tremor International (TRMR, +37%), Pubmatic (PUBM, +32%), Double Verify (DV, +29%), The Trade Desk (+27%), and Integral Ad Science (IAS, +26%). Ad Tech stocks were the worst performing sector in our universe in 2022, with the index down 63% for the year in 2022. The strong performance in 2Q 2023 in many respects reflects a bounce back off multi-year lows for several stocks. Year-to-date, one standout in particular is Integral Ad Science, whose shares were up 104% in the first half of 2023.The company continues to expand its product suite, scale its social media offerings (i.e., for TikTok) and is well positioned to continue to benefit from the shift from linear TV to connected TV (CTV). The company is benefiting from new partnerships with YouTube and Netflix and shares likely benefited during the quarter from anticipation of the company’s mid-June analyst day presentation.
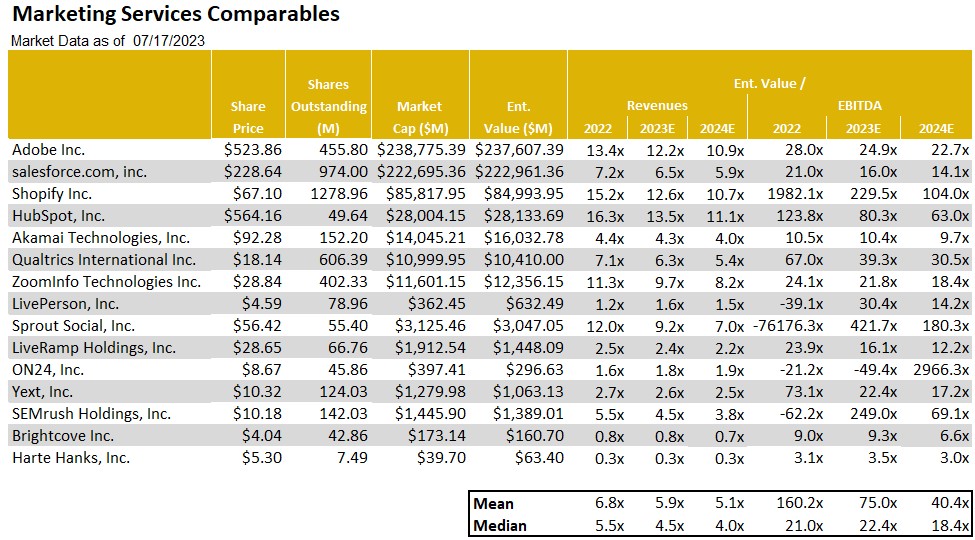
Noble’s MarTech Index was up 18%, with performance within the group also broad based. The Digital Media & Technology indices market-cap weighted performances in 2Q are illustrated in Figure #5 2Q Internet & Digital Technology Performance. Thirteen of the 20 stocks in the Index were up in the quarter. MarTech stocks that performed best during the quarter include Cardlytics (CDLX, +86%), Shopify (SHOP, +35%), Live Ramp (RAMP, +30%), Adobe (ADBE, +27%), and Hubspot (NUBS, +24%). One of the poor performers in the group was one of our closely followed stocks, Harte Hanks, which declined 42% in the latest quarter. The stock gave back nearly all of its 54% gains in the prior year. The weakness was due to a disappointing quarterly revenue outlook as the company indicated that it is seeing economic headwinds and more difficult second half comparables. Notably, the company has significant levers to maintain much of its favorable cash flow outlook and is well positioned for growth as those headwinds diminish. We believe that downside risk in the HHS shares appear limited and view the shares as among our favorite rebound plays. Overall, MarTech stocks were victims of their own success: the group traded at double digit revenue multiples in 2021, but the sector’s revenue multiples were more than halved in 2022. The group currently trades at 5.9x 2023E revenues, up from 4.1x 2023E revenues at the end of the first quarter, and 3.5x 2023E revenues at the start of the year. Current trading multiples are illustrated in Figure #7 MarTech Comparables.
Finally, the Digital Media Index was up 16% in 2Q 2023, and here again, the performance was broad based with 8 of the 12 stocks in the Index posting gains. Digital Media stocks that performed best during the quarter include Fubo TV (FUBO, +72%), Travelzoo (TZOO, +31%), Netflix (NFLX, +28%), Interactive Corp (IAC, +22%), and Spotify (SPOT, +20%). Year-to-date, the two best performing Digital Media stocks are Spotfiy (+103% YTD), which has shifted its priority to running a profitable company and took additional steps in 2Q to achieve it, for instance, by consolidating and streamlining several of its podcast company acquisitions from recent years. The second best performing Digital Media stock through the first half of the year was Travelzoo (TZOO), whose shares were up 77% in the first half of the year. The company continues to benefit from pent up demand that helped a surge in travel as the pandemic ebbed. Lodging and domestic travel demand rebounded first, but Travelzoo appears to be benefiting from cruises and international travel, where pent up demand took longer to recover. Management indicated that travel related advertising may increase as economic headwinds adversely affect hotel and air travel occupancy, forcing these travel businesses to offer discounts. We rate the TZOO shares as Outperform.
Figure #5 2Q Internet & Digital Technology Performance
Source: Capital IQ
Figure #6 AdTech Comparables
Source: Company filings & Eikon
Figure #7 MarTech Comparables
Source: Noble estimates & Eikon
Traditional Media
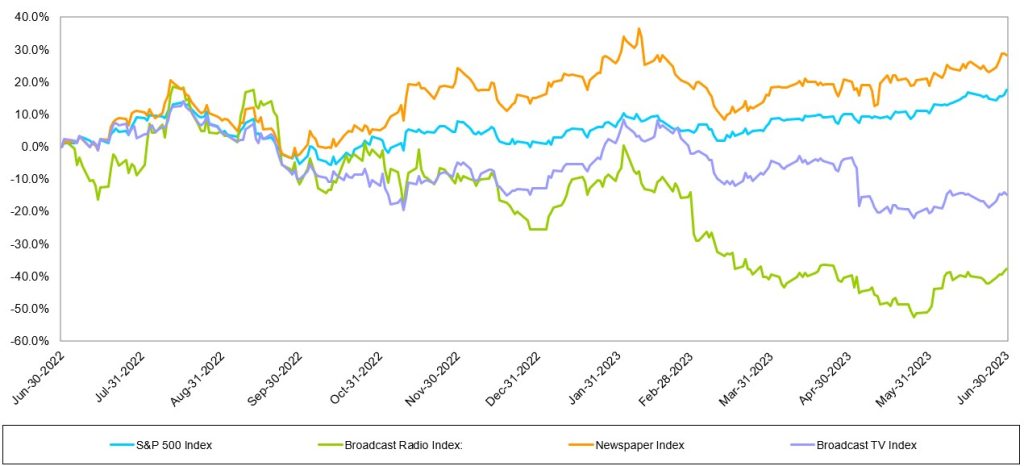
Traditional media stocks largely underperformed the general market over the LTM, the Radio sector was the hardest hit. As Figure #8 LTM Traditional Media Performance illustrates, the Noble Radio Index decreased 37.7% over the LTM, compared with the general market increasing 17.6%, as measured by the S&P 500 over the same period. The Television Index was down 14.8% and the Publishing index outperformed the general market, increasing 28.4% over the LTM. Notably, there were company stock performance disparities within each sector, highlighted later in this report. Given the indices are market cap weighted, larger market capitalized companies skewed the indices’ performance.
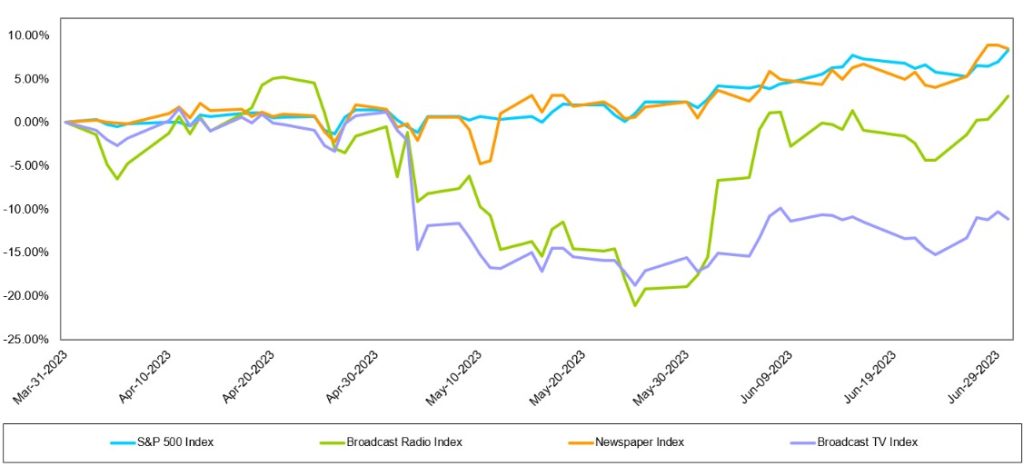
The traditional media industry is still finding its footing in the difficult economic environment, given the indices performance in Q2. While the Newspaper and Radio indices performed better in Q2 than Q1, the TV Index did not. The general market, as measured by the S&P 500, increased 8.3% over the last quarter and outperformed all but one traditional media sector. The Newspaper Index, which increased 8.5% over the same period narrowly outperformed the general market. The TV Index was the hardest hit traditional media sector and decreased -11.1%. While the Radio index underperformed the market in Q2, it improved upon a difficult Q1 and increased 3.1%, as illustrated in Figure #9 Q2 Traditional media performance.
Figure #8 LTM Traditional Media Performance
Source: Capital IQ
Figure #9 Q2 Traditional Stock Performance
Source: Capital IQ
Broadcast Television
Are ad trends really improving?
The TV Index underperformed the general market in the second quarter. While none of the stocks in the TV Index increased in the second quarter, many performed better than the market cap weighted return of -11.1%. Fox Corporation (FOXA; down 0.1%), E.W Scripps (SSP; down 2.8%), Nexstar (NXST; down 3.5%) and Gray Television (GTN; down 9.6%) were among the best performing stocks in the hard-hit TV index. The stocks hit the hardest in Q2 were Sinclair Broadcast Group (SBGI; down 19.5%) and Entravision (EVC; down 27.4%). Given the recent turmoil in TV stock performances we view the depressed prices as a potential opportunity given the prospect of an advertising recovery over the next few quarters.
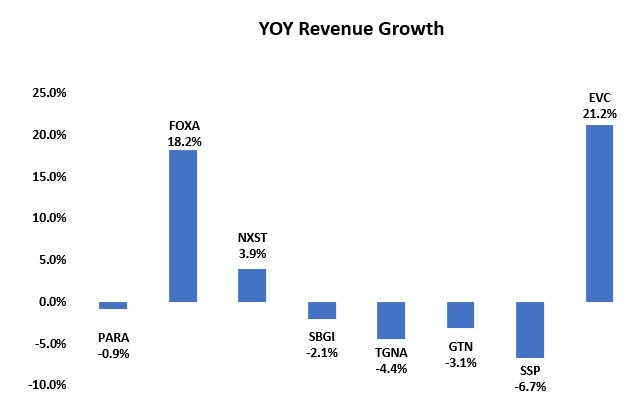
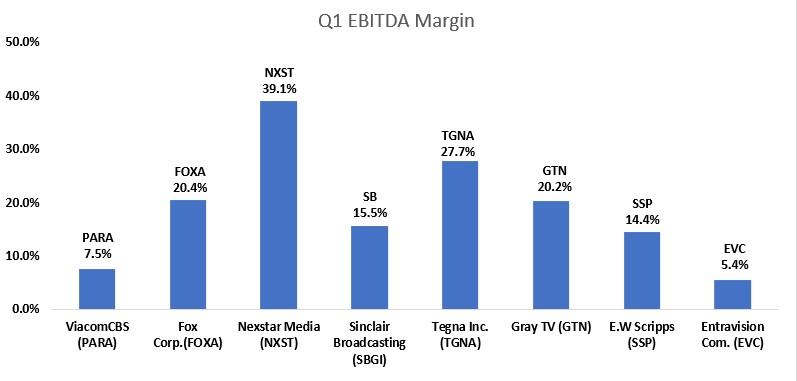
While there have been some recent reports indicating that television advertising is improving, possibly related to increased political advertising and Auto advertising in the third quarter, we remain skeptical that the improvement is sustainable given the prospect of a weakening economy. Nonetheless, the TV stocks appear cheap. One of our favorites in the index is Entravision (EVC) which is among the industry leaders in revenue growth as illustrated in Figure #10 TV Q1 YoY Revenue Growth. While the EVC shares had a poor performance in Q2, down 27.4%, the shares had increased 26% in Q1. Entravision’s revenue growth is the product of a robust digital business that comprises approximately 80% of total revenue. We believe that the recent under performance is related to Meta’s (Facebook’s) announcement that it plans to implement efficiencies, implying that it may take margin away from some of its advertising agencies, like Entravision, which represents Facebook in Latin America. In our view, Entravision is in a strong position to push back on that prospect given its favorable business relationship with the company. Given the influx of lower margin digital revenues, Entravision’s EBITDA margin is much lower than industry peers, illustrated in Figure #11 TV Industry Q1 EBITDA Margin. But, importantly, the company has one of the better revenue and cash flow growth profiles.
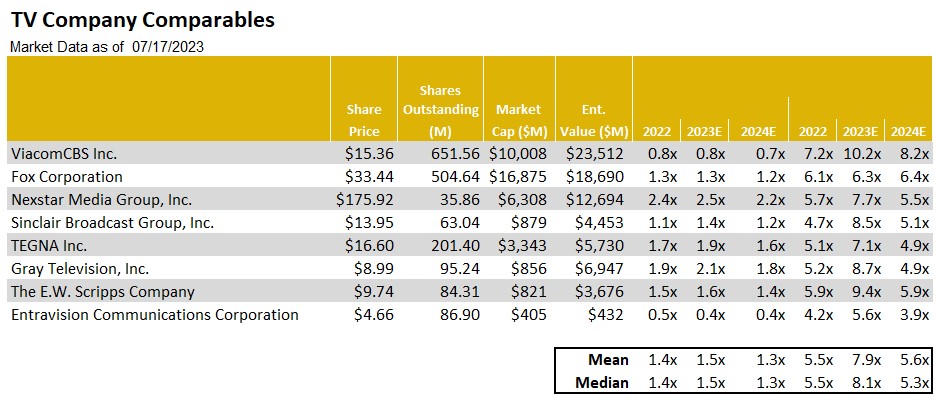
Figure #12 TV Company Comparablesillustrates the trading levels of the companies in the index. Some of our favorites Entravision (EVC) and E.W Scripps (SSP) trade at multiples well below the industry peer group highs. While E.W Scripps had modest year over year revenue decline, we believe it will benefit from favorable Retransmission revenue, strong Political advertising and improved margins in 2024. Given the SSP shares low float, the shares tend to underperform when industry is out of favor and outperform when the industry is back in favor. As for Entravision, we view the company’s digital transformation favorably and, notably, the shares are trading at a modest 3.9 times Enterprise Value to our 2024 Adj. EBITDA estimate. In our view, there appearas to be limited downside risk. The EVC shares and SSP shares, in our view, both offer a favorable risk reward relationship.
Figure #10 TV Q1 YoY Revenue Growth
Source: Company filings
Figure #11 TV Industry Q1 EBITDA Margin
Source: Company filings & Eikon
Figure #12 TV Company Comparables
Source: Noble Estimates & Eikon
Broadcast Radio
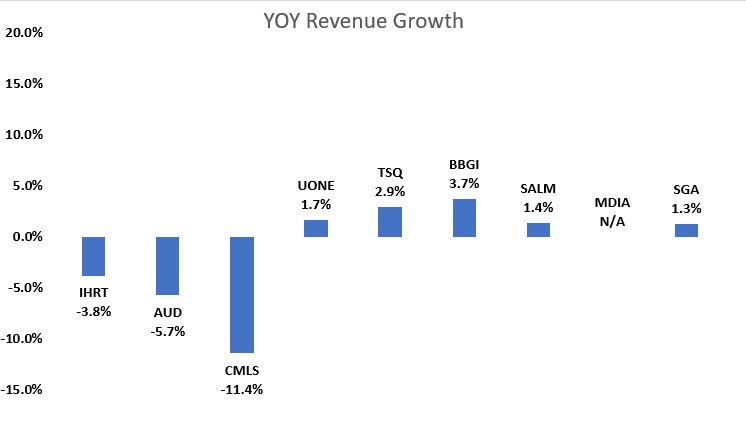
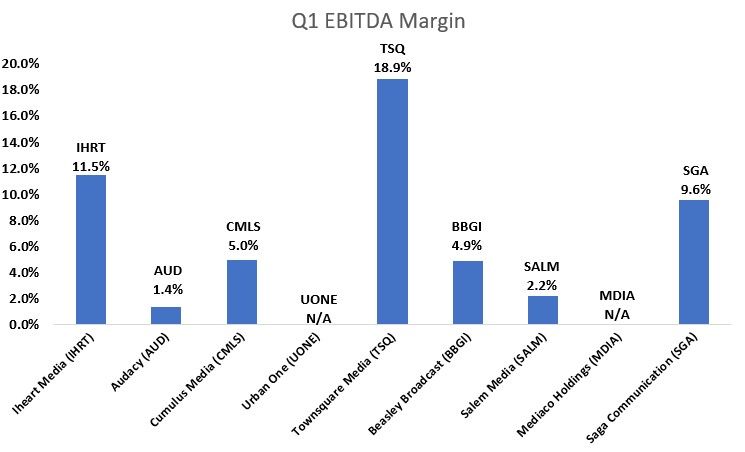
While the Radio Index underperformed the S&P 500 in Q2, it was an improvement from a difficult Q1. Notably, there were a few strong performances in the market cap weighted index. Beasley Broadcast Group (BBGI, up 24.4%) , Cumulus Media (CMLS, up 11.1%) and Townsquare (TSQ, up 48.9%) all strongly outperformed the S&P 500 in Q2. The largest stocks in the group did not perform well in the quarter skewing the index lower, Audacy (AUD, up 2.6%) and iHeart Media (IHRT, down 6.7%). The second quarter stock performances were a mixed bag and largely did not reflect the first quarter operating results. As Figure #13 Radio Q1 YoY Revenue Growth illustrates, most companies had modest revenue growth. The larger Radio companies that rely more on National advertising had the greatest declines of YoY revenue. With CMLS being the exception, the larger Radio companies underperformed relative to Radio companies with a stronger digital and highly localized presence. Figure #14 Radio Industry Q1 EBITDA Margin Margins illustrate that the margins for the industry remain relatively healthy.
Some of our favorite Radio stocks have strong digital businesses and highly localized footprints, which provides some shelter from weakness in national advertising. Those stocks included Townsquare, Beasley Broadcast Group, Salem Media (SALM; down 12.1%) and Saga Communications (SGA, down 3.9%). While the shares of Saga Communications (SGA) were down 3.9%, the performance did not reflect its favorable first quarter operating results. Importantly, Saga grew revenues a modest 1.3% and had an above average Q1 EBITDA margin of 9.6%. Saga has a highly localized footprint, as approximately 90% of revenues come from local sources. Furthermore, the company has been placing more importance on growing a profitable digital business in recent years. While Saga’s Digital business is early in its development, management is focused on growing digital revenues from 7.5% of total revenue in Q1 to 20% of total revenue over the next couple years. Additionally, we believe the company is likely to maintain a strong cash position given the economic uncertainty.
We view Townsquare Media (TSQ), Salem Media (SALM), Beasley Broadcast (BBGI) and Saga Communications (SGA) as among our favorites in the industry given the diverse revenue streams and localized footprints. While these companies are not immune to the economic headwinds, we believe that its Digital businesses and local footprints should offer some ballast to its more sensitive Radio business. Beasley’s recent digital revenue growth has been robust, digital revenue was 17% of total revenue in Q1 and is expected to reach 20% to 30% of total revenue for full year 2023. In the case of Salem, 30% of its revenues are from reliable block programming.
We believe that Radio advertising pacings likely will be problematic in the second half given the economic headwinds. Unlike Television, the industry does not benefit as much from Political advertising. As such, we expect that advertising pacings likely will be lower in Q3 than the Q2 results. It is likely that many radio companies, especially those with higher debt leverage, will implement cost cutting measures. With many of the radio companies already relatively lean from the Pandemic, it is likely that such measures will be difficult.
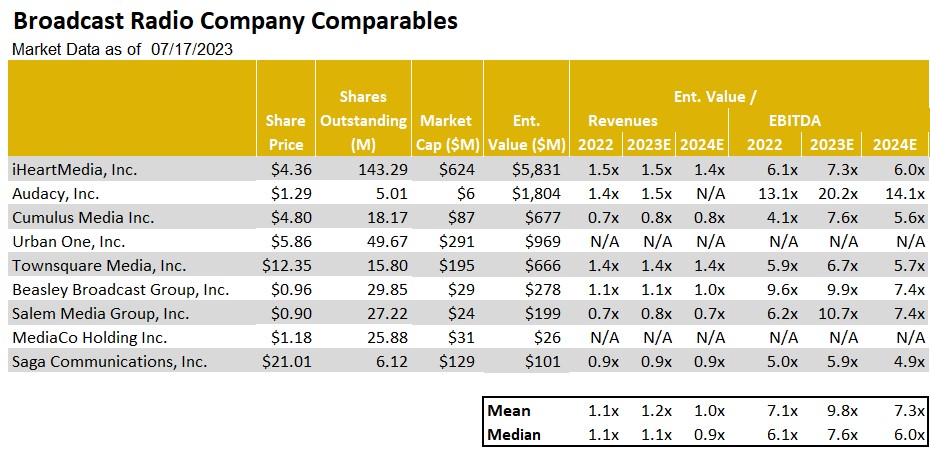
As Figure #15 Radio Company Comparables illustrates, the shares of Townsquare and Saga are among the cheapest in the industry, trading below peer group averages. Notably, Townsquare implemented a hefty dividend in Q1, providing the unique opportunity to get a return of capital while waiting for a turn toward more favorable fundamentals. As such, the shares of TSQ tops our list of favorites. We also view the shares of Saga as among our favorites. The company is early in its transition toward digital and has a lot of headroom for enhanced revenue growth.
Figure #13 Radio Q1 YoY Revenue Growth
Source: Company filings
Figure #14 Radio Industry Q1 EBITDA Margin
Source: Company filings & Eikon
Figure #15 Radio Company Comparables
Source: Noble estimates & Eikon
Publishing
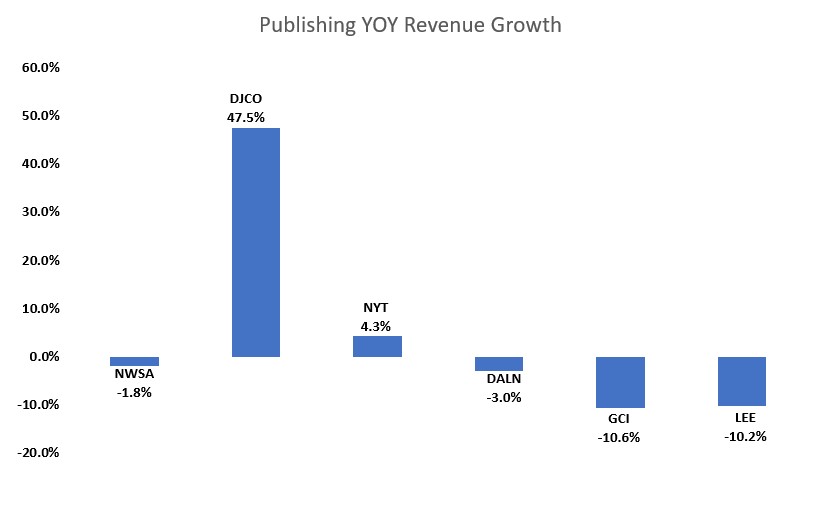
The Publishing industry is no exception to the advertising weakness that is impacting the broader Media landscape. As such, revenues are likely to continue to decline, despite an already weak performance in the first quarter of the year. Figure #16 Publishing Q1 YoY Revenue Growth illustrates the predominantly negative trends in the industry in the most recently reported quarter. The advertising challenges are hitting the traditional Print side of the publishing business hardest. For example, Lee Enterprises (LEE), one of our favorites in the industry, reported a 10% Print advertising revenue decline for the quarter ended March 31st, while Digital advertising grew a modest 2%. The company’s adj. EBITDA generation fell 15% compared with a more moderate 2% drop in total company revenues.
Not surprisingly, the dampened industry revenue resulted in lower industry cash flow generation with EBITDA margins averaging in the 10% range, as illustrated in Figure #17 Publishing Industry Q1 EBITDA Margins. Yet despite the constraints on cash flow generation on Lee and the other Publishers, we believe the companies have the ability to cut costs to help offset the pressure on cash flow generation. In particular, companies could cut costs in their Print manufacturing and distribution operations, reducing overhead in the same business segments where revenues are expected to lag. Publishing companies have a playbook on cutting legacy print costs and have the ability to maintain cash flow. However, cost cuts can take time to go into full effect, which could result in poor cash flow performance over the next quarter or so.
In spite of the nearer term economic headwinds impacting the operating performance of the industry, we believe that the industry is near an inflection point towards revenue growth. This dynamic is related to the degree of the recovery in its digital media businesses, a key driver to the industry’s overall revenue performance. While there are secular challenges to the industry’s print business, digital revenues account for an increasing portion of total revenues. For companies like Lee Enterprises, digital accounts for over 38% of total revenues in the most recent quarter. In our view, publishing companies will be a player in the advertising recovery as economic prospects improve. Furthermore, we believe that stock valuations are compelling.
Figure #18 Publishing Company Comparables illustrates the Publishing companies trading levels. Notably, the New York Times (NYT) trades well above the levels of the rest of its peers. In comparison, Lee and Gannett appear to be compelling. However, both Lee and Gannett are highly levered. Yet, in our view, Lee’s debt profile has several favorable characteristics, such as a fixed 9% annual rate, no fixed principal payments, no performance covenants and a 25 year maturity. Given that the LEE shares trade near 5.3 times enterprise value to our 2024 adj. EBITDA forecast, we believe the shares offer limited downside risk. With a favorable Digital transformation of the business well underway, we believe the LEE shares could close the valuation gap with some of its higher trading peers. As such, the LEE shares represent one of our favorites in the industry, especially as the economic downturn bottoms out and the prospect for a recovery begins to come to the forefront. As such, the LEE shares are among our favorite recovery plays.
Figure #16 Publishing Q1 YoY Revenue Growth
Source: Company filings & Eikon
Figure #17 Publishing Industry Q1 EBITDA Margins
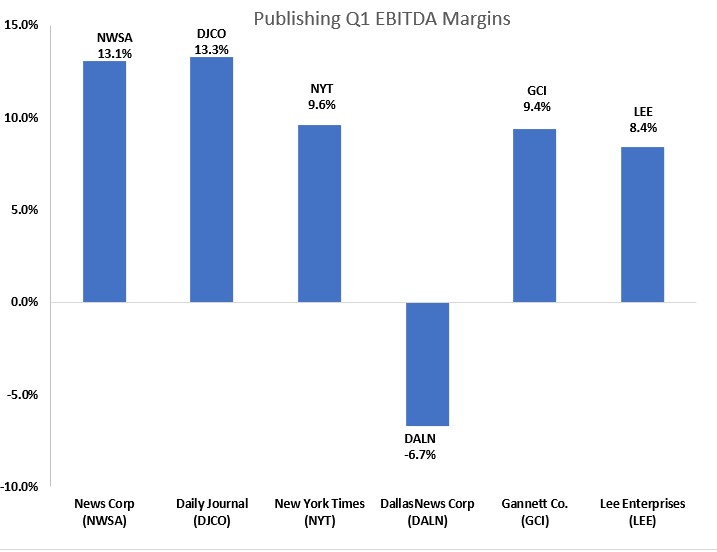
Source: Company filings & Eikon
Figure # 18 Publishing Company Comparables
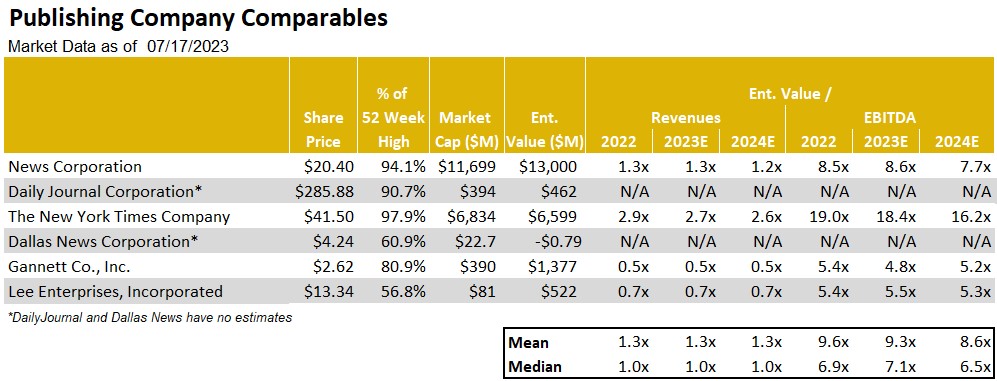
Source: Noble estimates & Eikon
The following companies are highlighted in this report. Click on the links for additional information and disclosures.
Travelzoo
Saga Communications
GENERAL DISCLAIMERS
All statements or opinions contained herein that include the words “we”, “us”, or “our” are solely the responsibility of Noble Capital Markets, Inc.(“Noble”) and do not necessarily reflect statements or opinions expressed by any person or party affiliated with the company mentioned in this report. Any opinions expressed herein are subject to change without notice. All information provided herein is based on public and non-public information believed to be accurate and reliable, but is not necessarily complete and cannot be guaranteed. No judgment is hereby expressed or should be implied as to the suitability of any security described herein for any specific investor or any specific investment portfolio. The decision to undertake any investment regarding the security mentioned herein should be made by each reader of this publication based on its own appraisal of the implications and risks of such decision.
This publication is intended for information purposes only and shall not constitute an offer to buy/sell or the solicitation of an offer to buy/sell any security mentioned in this report, nor shall there be any sale of the security herein in any state or domicile in which said offer, solicitation or sale would be unlawful prior to registration or qualification under the securities laws of any such state or domicile. This publication and all information, comments, statements or opinions contained or expressed herein are applicable only as of the date of this publication and subject to change without prior notice. Past performance is not indicative of future results. Noble accepts no liability for loss arising from the use of the material in this report, except that this exclusion of liability does not apply to the extent that such liability arises under specific statutes or regulations applicable to Noble. This report is not to be relied upon as a substitute for the exercising of independent judgement. Noble may have published, and may in the future publish, other research reports that are inconsistent with, and reach different conclusions from, the information provided in this report. Noble is under no obligation to bring to the attention of any recipient of this report, any past or future reports. Investors should only consider this report as single factor in making an investment decision.
IMPORTANT DISCLOSURES
This publication is confidential for the information of the addressee only and may not be reproduced in whole or in part, copies circulated, or discussed to another party, without the written consent of Noble Capital Markets, Inc. (“Noble”). Noble seeks to update its research as appropriate, but may be unable to do so based upon various regulatory constraints. Research reports are not published at regular intervals; publication times and dates are based upon the analyst’s judgement. Noble professionals including traders, salespeople and investment bankers may provide written or oral market commentary, or discuss trading strategies to Noble clients and the Noble proprietary trading desk that reflect opinions that are contrary to the opinions expressed in this research report.
The majority of companies that Noble follows are emerging growth companies. Securities in these companies involve a higher degree of risk and more volatility than the securities of more established companies. The securities discussed in Noble research reports may not be suitable for some investors and as such, investors must take extra care and make their own determination of the appropriateness of an investment based upon risk tolerance, investment objectives and financial status.
Company Specific Disclosures
The following disclosures relate to relationships between Noble and the company (the “Company”) covered by the Noble Research Division and referred to in this research report.
Noble is not a market maker in any of the companies mentioned in this report. Noble intends to seek compensation for investment banking services and non-investment banking services (securities and non-securities related) with any or all of the companies mentioned in this report within the next 3 months
ANALYST CREDENTIALS, PROFESSIONAL DESIGNATIONS, AND EXPERIENCE
Senior Equity Analyst focusing on Basic Materials & Mining. 20 years of experience in equity research. BA in Business Administration from Westminster College. MBA with a Finance concentration from the University of Missouri. MA in International Affairs from Washington University in St. Louis.
Named WSJ ‘Best on the Street’ Analyst and Forbes/StarMine’s “Best Brokerage Analyst.”
FINRA licenses 7, 24, 63, 87
WARNING
This report is intended to provide general securities advice, and does not purport to make any recommendation that any securities transaction is appropriate for any recipient particular investment objectives, financial situation or particular needs. Prior to making any investment decision, recipients should assess, or seek advice from their advisors, on whether any relevant part of this report is appropriate to their individual circumstances. If a recipient was referred to Noble Capital Markets, Inc. by an investment advisor, that advisor may receive a benefit in respect of
transactions effected on the recipients behalf, details of which will be available on request in regard to a transaction that involves a personalized securities recommendation. Additional risks associated with the security mentioned in this report that might impede achievement of the target can be found in its initial report issued by Noble Capital Markets, Inc.. This report may not be reproduced, distributed or published for any purpose unless authorized by Noble Capital Markets, Inc..
RESEARCH ANALYST CERTIFICATION
Independence Of View
All views expressed in this report accurately reflect my personal views about the subject securities or issuers.
Receipt of Compensation
No part of my compensation was, is, or will be directly or indirectly related to any specific recommendations or views expressed in the public
appearance and/or research report.
Ownership and Material Conflicts of Interest
Neither I nor anybody in my household has a financial interest in the securities of the subject company or any other company mentioned in this report.