
Are Higher Interest Rates Going to Be Devastatingly Expensive to the US Treasury?
The Federal Open Market Committee (FOMC) has raised the overnight Fed Funds target rate from near zero to around 5% in less than a year and a half. That multiple from its starting point is huge and, as designed, driven up other rates, both savings and lending. Given the pace that rates have gone up, the cost of refinancing or rolling existing debt for the federal and municipal governments, businesses, and households, has obviously experienced a large cost increase. When treasury debt matures, the US government decides whether to “roll over” their debt by issuing new securities at the current rate—or find other resources to repay borrowers. When rolling, far more is required to be borrowed just to stay even and cover interest rate costs. Below we use numbers from Federal Reserve branch to determine how much more it will cost.
The Federal Reserve Bank of St Louis (FRED), compiled data on the increased cost of US borrowing as a direct result of the Federal Reserve’s tighter monetary policy. The sheer magnitude of the amount borrowed, and the impact of interest rates make clear the US either will be increasing its borrowings, just to stay even with rollovers, or will need to cut back by spending. Cutting back spending removes economic stumulus. Below are the FRED numbers on how interest costs are expected to change.
US Government Debt Breakdown
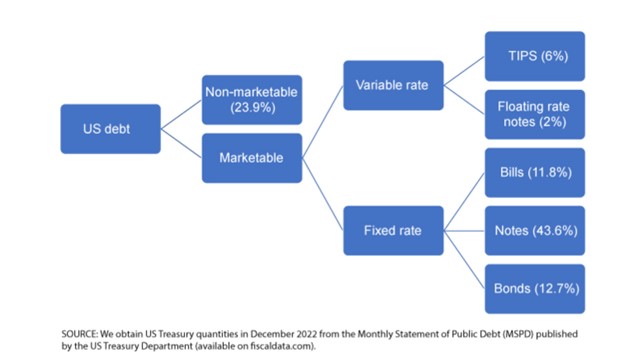
The total public debt, according to the US Treasury Department, is just over $31.4 trillion
Of the $31.4 trillion, about $7.5 trillion or 23.9% is nonmarketable debt—mainly consisting of the social security trust fund, military retirement funds, and the civil service retirement fund.
That leaves $23.9 trillion in marketable debt. $2.5 trillion is in variable-rate debt and increases when rates rise. The variable category is made up of Treasury inflation-indexed notes (TIPS) and floating-rate notes (FRNs). TIPS make up 6% of the overall US debt, have original maturities of 5, 10, or 30 years. FRNs make up only 2% of US debt, have maturity of 2 years, and interest payments are based on a fixed spread and a variable index rate calculated weekly.
Then there are $21.4 trillion in fixed-rate marketable securities. This final category contains bills, notes, and bonds, which make up 11.8%, 43.6%, and 12.7% of the US debt, respectively. The only differences in these instruments is that bills are discounted to yield the rate, while notes and bonds have semiannual interest rate payments. “notes” is the term used from 2-10 year maturities, bonds are from 10-20 years
Focusing only on the 68.1% fixed-rate of marketable U.S. debt, consisting of bills, notes, and bonds and for ease, using end of the year December 2022 to use specific securities and their roll dates, this is what the St. Louis Federal Reserve laid out.
The debt maturing each year has been broken down into different colors below by maturity. For example, the orange portion of the 2023 column represents two-year US Treasury debt maturing in the year 2023.
Notice about 30% of existing debt is maturing in 2023. And nearly 62% of existing US debt is coming due in the nine years after 2023. Finally, 18% of existing Treasury debt is very long dated and will not come due for at least 10 years. So 82% will reset at current rates within the next nine years.
Maturity Dispersion

Aside from quantity and maturity, the calculations aren’t complete without factoring in the yield of the current debt. Remember, the current interest rate levels are not the first time visiting 4% or higher.
FRED used data on quantities and prices from December 2022 and compared it with the interest expense the US government would pay on the same quantity of debt using the new, higher interest rates in April 2023. Here, FRED assumed that the US government will keep the same debt schedule as in 2022. In other words, for any debt maturing during 2023, the government will issue another security with the same quantity and maturity—but at the new interest rate. They define short-term debt as any security with maturity less than or equal to one year and long-term debt as any security with maturity greater than one year.
Maturing Interest Rate, New Interest Rate
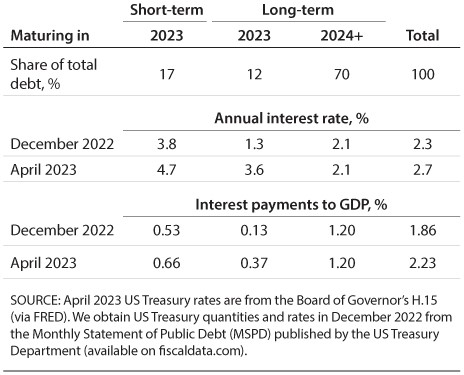
Short-term debt maturing in 2023 makes up about 17% of the outstanding. However, because this debt is short term, most of it had already been rolled over at higher interest rates in 2022. The December 2022 average rate on the short-term debt was already 3.8% and therefore increased only 0.9%—to 4.7%—in April. The long-term debt maturing in 2023 is almost 12% of debt, and the average rate increases from 1.3% to 3.6%, which is fairly large. Long-term debt maturing after 2024 will have the same interest rate, since the federal government is not rolling it over in 2023. Long-term debt makes up just over 70% of the existing debt.
To get some idea of the magnitude of $98 billion, the St. Louis Fed provided two examples: First, the Federal Reserve pays the Treasury Department revenue or remittances, which basically contain all remaining Fed revenue after operating expense. Fed remittances were $105 billion in 2021 and were negative $54 billion in 2022, in part due to the increases in interest rates. In 2021, this was an example of an inflow, or payment, to the government. Second, an example of an outflow, or expense incurred by the government, the US Department of Transportation spent $114 billion in 2022.
Bringing in the variable rate debt that we excluded earlier, the Congressional Budget Office (CBO) has forecasted for interest expense payments over GDP in the next 10 years. The CBO’s projections include variable-rate marketable securities—TIPS and FRNs—so they of course will of course be added to the fixed rate securities.
Take Away
What the US government spends, is generally stimulative. Money spent on interest would also seem to work its way into the system and be stimulative, but in the face of inflation, more goods or services is not necessarily attainable with the larger payments.
The US government had $21.4 trillion in outstanding US Treasury debt as of December 2022. Given large increases to interest rates over the past year, FRED estimated that it will cost the US government an additional $98 billion to pay interest on their debt in 2023.
The estimate is close to that made by the CBO as well. While the number seems large, relative to flows in and out of the US Treasury it is in line and not by comparison large.
The report from the Federal Reserve Branch concluded if long-term rates remain high, servicing the debt will become a larger and larger portion of the overall government expense.
Managing Editor, Channelchek