Why Elevated Unemployment isn’t Hurting Stocks
Trends in unemployment and the coinciding trend in stock market valuation have run counter to each other over the years. It is not a 100% negative correlation as stock market strength, and weakness tends to also follow other measures. These could include disposable income, consumer optimism, debt levels, and other factors. The other related measures don’t always track each other, so one factor normally takes precedence. Often, it’s whichever indicator the market decides to give more weight to in any time period — when they’re headed in different directions, the market obviously can’t move with them all. But, unemployment as a contra-indicator of overall market direction is very strong.
It was reported yesterday by the BLS that Jobless claims declined by 111,000 from the previous week to a seasonally adjusted 730,000. This is the lowest in over two months and the sharpest one-week decline since August. The direction seems positive, but prior to last March, unemployment benefits had never (notice no time period in “never”) topped 700,000. The percentage unemployed in April 2020 reached 14.7% which is the highest rate since the Great Depression.
How Important is the Rate of Unemployment?
Direction matters to the market more than any absolute number. Market participants want to know if something is getter better or worse than yesterday, not a year ago, or even 90 years ago.
The most recent relationship coincides with a weakened job market that has not grown since the 2020 election. Hiring has averaged only 29,000 a month from November through January. Numbers can be deceiving as well. Although the headline unemployment rate reported was 6.3% in January, a broader measure that incorporates those that may have become exasperated and discontinued their job search, borders on 10%. So the picture is improving but not good by many standards.
All told, 19 million people were receiving unemployment aid as of Feb. 6, up from 18.3 million the previous week. About three-quarters of those recipients are receiving checks from federal benefit programs, including programs that provide jobless aid beyond the 26 weeks provided for in most states.
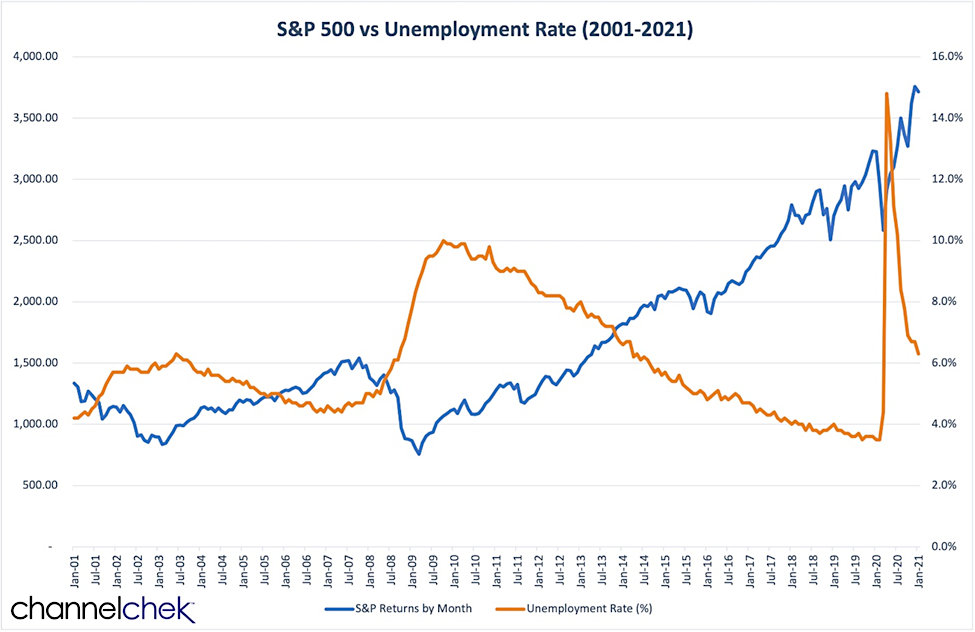
A Look at the S&P 500 Versus Unemployment over the past 20-years (Orange line is Unemployment
as reported by the BLS)

Last week’s drop in applications was concentrated in two states, California and Ohio, where they fell by a combined 96,000. Ohio officials had said earlier this month that a surge in new applications was driven in part by a jump in potentially fraudulent claims. That now appears to have faded. Other factors outside the norm that may have impacted the numbers are the winter storms and power grid problems in Texas during the week. It’s difficult to factor out that “noise” and there is always a certain level of noise including natural disasters, fraudulent claims, temporary industry shutdowns, etc.
It helps to see the way unemployment and the market (measured by the S&P 500) track in order to visualize if we have deviated from an established pattern. Obviously, a pattern that is easy to get your head around, when a lot of people are out of jobs and the economy isn’t very promising, stocks sink. And when the unemployment rate drops because payroll numbers have risen, stocks rise. Keep reading, so you know just how closely correlated the two are.
Look at that chart above; the two lines are almost perfect inverses to each other, until the coronavirus spike last Spring. They cross during large economic shifts such as the dot-com bubble around Y2k, again at the 2008-2009 financial crisis, ad in 2014 as the unemployment rate perked up to pre-recession lows, stocks climbed to new highs. Last year the two lines raced in opposite directions when the decision was made to reduce the number of people headed to a job every day. Since the economic shutdown, the unemployment rate has been reduced by more than half after reaching 14.7% last April. As for stocks, they have risen about 70%, from the late March 2020 bottom. The market improved some before the jobless rate fell; this is likely in anticipation of the improvement. A decrease in those unemployed was presumed to be easy to anticipate as a turn in the economy was presumed to be hinged on medical approvals in the works.
Take-Away
It is not irrational to understand why stocks are near their all-time highs while unemployment is near their numerical highs. As long as the unemployment rate continues to fall, history suggests stocks will continue to rise. The weekly employment numbers contain information worth paying attention to under any economic conditions.
Do you expect a year from now, the U.S. unemployment rate will be lower than today? Factor that into your stock market forecast. What actually happens remains to be seen. Over the past 20 years, the unemployment-stock market correlation has held a reliable inverse relationship. Is the market still ahead of itself in predicting further improvement in stocks? As always, we can only look at stats from the past, never the future.
Suggested Reading:
What Stocks do You Buy When the Dollar Goes Down?
How Did the Stock Market Perform Under Each President?
Managing Investment Portfolio Risk
Sources:
Unemployment Insurance Weekly Claims
Stay up to date. Follow us:
 |
 |
 |
 |
 |
 |
Stay up to date. Follow us:
 |
 |
 |
 |
 |
 |

