IRVING, Texas–(BUSINESS WIRE)– Salem Media Group, Inc. (NASDAQ: SALM), announced today that it has acquired George Gilder’s investment newsletters Gilder’s Technology Report, Gilder’s Technology Report PRO, Gilder’s Moonshots, Gilder’s Private Reserve and Gilder’s Guideposts.It also launched a new website for George Gilder, www.GilderReport.com.
Adding George Gilder and his team of experts (Richard Vigilante, Steve Waite and John Schroeter) to Eagle Financial Publications’ portfolio of investment newsletters and trading services adds more depth to an already powerful mix of products. Eagle currently publishes products and services written by investment experts Mark Skousen, Bob Carlson, Bryan Perry, Jim Woods and Jon Johnson. Eagle also has several financial and retirement websites: www.StockInvestor.com, www.DividendInvestor.com and www.SeniorResource.com.
Roger Michalski, Vice President and Publisher of Eagle, said, “I am thrilled and honored to add George Gilder and his servicesto our mix of products. I have followed George’s work for years and there is nobody better than him in identifying the technological trends that change the way we live… and how to profit from the companies leading the way.”
ABOUT GEORGE GILDER:
George Gilder is an established investor, writer and economist with an uncanny ability to foresee how new breakthroughs will play out, years in advance. He’s written over 20 books, many of them bestsellers, including titles such as Wealth and Poverty and Life After Google. George pioneered the formulation of supply-side economics when he served as Chairman of the Lehrman Institute’s Economic Roundtable, as Program Director for the Manhattan Institute, and as a frequent contributor to A.B. Laffer’s economic reports and the editorial page of the Wall Street Journal.
Throughout his career, he’s been profiled in People, Wired, Forbes, Fox News, the Wall Street Journal, The Economist, Harvard Business Review, the American Spectator, and more.
ABOUT SALEM MEDIA GROUP:
Salem Media Group is America’s leading multimedia company specializing in Christian and conservative content, with media properties comprising radio, digital media and book and newsletter publishing. Each day Salem serves a loyal and dedicated audience of listeners and readers numbering in the millions nationally. With its unique programming focus, Salem provides compelling content, fresh commentary and relevant information from some of the most respected figures across the Christian and conservative media landscape. Learn more about Salem Media Group, Inc. at www.salemmedia.com, Facebook and Twitter.
For more than 70 years, Vectrus has provided critical mission support for our customers’ toughest operational challenges. As a high-performing organization with exceptional talent, deep domain knowledge, a history of long-term customer relationships, and groundbreaking technical expertise, we deliver innovative, mission-matched solutions for our military and government customers worldwide. Whether it’s base operations support, supply chain and logistics, IT mission support, engineering and digital integration, security, or maintenance, repair and overhaul, our customers count on us for on-target solutions that increase efficiency, reduce costs, improve readiness, and strengthen national security. Vectrus is headquartered in Colorado Springs, Colo., and includes about 8,100 employees spanning 205 locations in 28 countries. In 2021, Vectrus generated sales of $1.8 billion. For more information, visit the company’s website at www.vectrus.com or connect with Vectrus on Facebook, Twitter, and LinkedIn.
Joe Gomes, Managing Director – Generalist Analyst, Noble Capital Markets, Inc.
Joshua Zoepfel, Research Associate, Noble Capital Markets, Inc.
Refer to the full report for the price target, fundamental analysis, and rating.
4Q22 Operating Results. In 4Q22, V2X grew revenue 20% on a pro forma basis to $978.2 million driven by new business wins, successful re-competes, and expansion of core programs. The Company reported a GAAP net loss of $10.6 million, or a loss of $0.35 per share, driven by costs related to the merger. On an adjusted basis, net income totaled $28.9 million, or EPS of $0.92. Adjusted EBITDA totaled $79.3 million for an 8.1% margin.
INDOPACOM Strong. Revenue in INDOPACOM grew sevenfold in the fourth quarter to $54 million from continued expansion and growth at Kwajalein and the Philippines. With an expanded presence in the region and increased funding to support the Pacific Deterrence Initiative, we expect revenues from INDOPACOM to continue to grow.
Equity Research is available at no cost to Registered users of Channelchek. Not a Member? Click ‘Join’ to join the Channelchek Community. There is no cost to register, and we never collect credit card information.
This Company Sponsored Research is provided by Noble Capital Markets, Inc., a FINRA and S.E.C. registered broker-dealer (B/D).
*Analyst certification and important disclosures included in the full report. NOTE: investment decisions should not be based upon the content of this research summary. Proper due diligence is required before making any investment decision.
Eagle Bulk Shipping Inc. (“Eagle”) is a US-based drybulk owner-operator focused on the Supramax/Ultramax mid-size asset class, which ranges from 50,000 and 65,000 deadweight tons in size; these vessels are equipped with onboard cranes allowing for the self-loading and unloading of cargoes, a feature which distinguishes them from the larger classes of drybulk vessels and provides for greatly enhanced flexibility and versatility- both with respect to cargo diversity and port accessibility. The Company transports a broad range of major and minor bulk cargoes around the world, including coal, grain, ore, pet coke, cement, and fertilizer. Eagle operates out of three offices, Stamford (headquarters), Singapore, and Hamburg, and performs all aspects of vessel management in-house including: commercial, operational, technical, and strategic.
Michael Heim, CFA, Senior Research Analyst, Noble Capital Markets, Inc.
Refer to the full report for the price target, fundamental analysis, and rating.
Revenues decline despite the addition of ships as shipping rates decline. Eagle reported an 18% quarterly decline in revenues. A ship addition in September increased Eagle’s operating days. Average TCE rate declined 25% quarterly. The decline in revenues would have been much sharper had it not been for an $11 million realized gain from derivatives.
Operating costs continue to rise. Operating costs have risen steadily in recent quarters. Management again cited increased costs associated with transporting and housing Ukrainian employees. Management believes operating costs per ship will decline in upcoming quarters. Cash breakeven per ship days reached a level above $12,000 in the most recent quarter, close to Eagle’s fixed TCE rate in the upcoming quarter.
Equity Research is available at no cost to Registered users of Channelchek. Not a Member? Click ‘Join’ to join the Channelchek Community. There is no cost to register, and we never collect credit card information.
This Research is provided by Noble Capital Markets, Inc., a FINRA and S.E.C. registered broker-dealer (B/D).
*Analyst certification and important disclosures included in the full report. NOTE: investment decisions should not be based upon the content of this research summary. Proper due diligence is required before making any investment decision.
Codere Online refers, collectively, to Codere Online Luxembourg, S.A. and its subsidiaries. Codere Online launched in 2014 as part of the renowned casino operator Codere Group. Codere Online offers online sports betting and online casino through its state-of-the art website and mobile application. Codere currently operates in its core markets of Spain, Italy, Mexico, Colombia, Panama and the City of Buenos Aires (Argentina). Codere Online’s online business is complemented by Codere Group’s physical presence throughout Latin America, forming the foundation of the leading omnichannel gaming and casino presence in the region.
Michael Kupinski, Director of Research, Noble Capital Markets, Inc.
Patrick McCann, Research Associate, Noble Capital Markets, Inc.
Refer to the full report for the price target, fundamental analysis, and rating.
Strong Q4, better than expected. The company reported year-over-year Q4 net gaming revenue growth of 70% to €37.7 million, illustrated in Figure #1 Q4 Results. The quarterly revenue growth marked an acceleration compared with Q3 revenue growth of 54%. Notably, full-year net gaming revenue of €123 million was better than guidance of €115 million to €120 million.
Our forecast. We are forecasting revenue growth in 2023 to be 48% to €123.0 million, with an adj. EBITDA loss of €25.5 million. In 2024, we are forecasting revenue of €166.0 million, representing 18% growth above our 2023 forecast. We expect the company to reach adj. EBITDA breakeven in mid-2024 and finish the year with positive adj. EBITDA of €1.5 million.
Equity Research is available at no cost to Registered users of Channelchek. Not a Member? Click ‘Join’ to join the Channelchek Community. There is no cost to register, and we never collect credit card information.
This Company Sponsored Research is provided by Noble Capital Markets, Inc., a FINRA and S.E.C. registered broker-dealer (B/D).
*Analyst certification and important disclosures included in the full report. NOTE: investment decisions should not be based upon the content of this research summary. Proper due diligence is required before making any investment decision.
Blackboxstocks, Inc. is a financial technology and social media hybrid platform offering real-time proprietary analytics and news for stock and options traders of all levels. Our web-based software employs “predictive technology” enhanced by artificial intelligence to find volatility and unusual market activity that may result in the rapid change in the price of a stock or option. Blackbox continuously scans the NASDAQ, New York Stock Exchange, CBOE, and all other options markets, analyzing over 10,000 stocks and up to 1,500,000 options contracts multiple times per second. We provide our users with a fully interactive social media platform that is integrated into our dashboard, enabling our users to exchange information and ideas quickly and efficiently through a common network. We recently introduced a live audio/video feature that allows our members to broadcast on their own channels to share trade strategies and market insight within the Blackbox community. Blackbox is a SaaS company with a growing base of users that spans 42 countries; current subscription fees are $99.97 per month or $959.00 annually. For more information, go to: www.blackboxstocks.com .
Joe Gomes, Managing Director – Generalist Analyst, Noble Capital Markets, Inc.
Joshua Zoepfel, Research Associate, Noble Capital Markets, Inc.
Refer to the full report for the price target, fundamental analysis, and rating.
New Partnership. On Friday, Blackboxstocks announced a partnership with Boosted.ai to enhance artificial intelligence within the Blackbox platform. The platform will be leveraging the partnership to provide actionable alerts for both day trading and long term investment strategies. The partnership will provide Blackboxstocks’ retail investors with sophisticated investment tools and strategies that were previously only available to institutional investors. We view the partnership as beneficial to the Blackbox platform for both new and existing users, along with being an additive to potential marketing to garner new users.
Who Is Boosted.ai? Boosted.ai helps institutional investors energize their equity portfolios with artificial intelligence. Through its point-and-click AI software – Boosted Insights – Boosted.ai assists asset managers in finding opportunities for their funds. Boosted Insights uses machine learning to empower fund managers to augment their investment process to source new ideas, manage risk, and create alpha.
Equity Research is available at no cost to Registered users of Channelchek. Not a Member? Click ‘Join’ to join the Channelchek Community. There is no cost to register, and we never collect credit card information.
This Company Sponsored Research is provided by Noble Capital Markets, Inc., a FINRA and S.E.C. registered broker-dealer (B/D).
*Analyst certification and important disclosures included in the full report. NOTE: investment decisions should not be based upon the content of this research summary. Proper due diligence is required before making any investment decision.
The PDAC Mining Conference has a New Discussion Item for 2023
As analysts, investors, financiers, manufacturers, and others with a high interest in natural resources converge on the Prospectors and Developers Association of Canada (PDAC) conference this week, some of the conversations will revolve around the risks of having investments that may later be divested under a new Canadian policy enacted late last year. The Policy is intended to protect strategic minerals, especially those deemed critical to a greener energy future. The conference, which is expected to have close to 30,000 attendees, comes just four months after the enactment, which falls under the Investment Canada Act (ICA).
Background
Late last year, the Canadian Minister of Innovation, Science and Industry, in conjunction with the Minister of Natural Resources, issued a new policy relating to the treatment of foreign state-owned enterprise (SOE) investment in Canada’s critical minerals sector under the ICA.
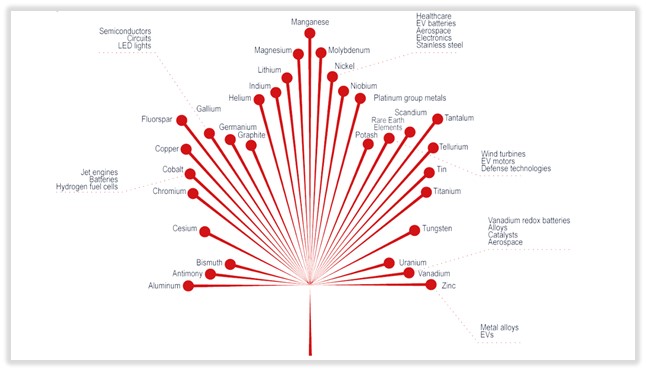
The Policy which is now in effect identifies 31 minerals that the Canadian government says are essential to Canada’s prosperity in the emerging low-carbon and technology sectors, or that contribute to Canada’s national defense and security. At the same time, it works to not undermine the Canadian Critical Minerals Strategy, designed to position the natural resource-rich country as the preferred global supplier of critical minerals.
The Policy applies to any direct or indirect investment of any size by a foreign SOE in a Canadian business involved in the “critical minerals” supply chain. Under the ICA, any investment that is a foreign SOE will be reviewed by the Investment Canada Act (ICA). The Policy states that the Minister is required to determine whether an investment is of “net benefit to Canada.” This is expected to be a high hurdle. What’s more, all foreign SOE investment in the critical minerals sector, regardless of size or value, will be subject to enhanced scrutiny under the national security review provisions.
Days after the Policy was issued, the Minister announced that the Canadian government ordered the divestiture of three separate investments in Canadian critical mineral companies involved in (among other things) lithium mining activities, both within and outside of Canada.
The Policy does not impact the ability for individuals or funds and companies not meeting the definition of SOE or directly influenced by an SOE. However, it may lower the number of potential financiers and investors for Canadian companies involved in procuring the 31 minerals shown in the graphic below. Dean McPherson, head of global mining at the Toronto Stock Exchange has been quoted saying, “No doubt the implications of a decision to restrict a major avenue of capital flow needs to be supplemented by capital that is similar in size and timely.”
As it relates to national security considerations, the Policy states that all investments by foreign SOEs (or foreign-influenced investors that involve a Canadian business or entity operating in a critical minerals sector in Canada will form the basis for a finding that the investment could be “injurious to national security”.
The changes are viewed as a defensive measure against China, which has invested $7 billion in Canada’s base metals sector in the past 20 years. Canadian officials last fall ordered Chinese companies to sell stakes in three Toronto-listed lithium companies, two of which are developing mines outside Canada.
Not all investors and analysts can make it to the PDAC Mineral Exploration and Mining Conference in Toronto. In order for our subscribers to stay in the loop, Noble Capital Markets will be attending PDAC conference meetings and then interviewing select executives. This will be captured on video for the exclusive benefit of Channelchek subscribers (no cost). Learn more about the Channelchek Takeaway Series at PDAC.
PDAC and Impact
The conference which takes place in Canada this week will be the first forum of its size where questions surrounding the Ministers policy under the ICA can be discussed, and parties of varied interests on all sides can discuss there expectations of how this will impact financing, partnerships, and investments among important global producers and consumers of raw materials.
However, the hurdle that Canada has put in place for some investors and investing could cause some less-than-welcome investors from gaining too much control over a company and the resources it produces. Whether it also weighs heavily on the value of company’s based out of Canada will be discussed at the conference and remains to be seen. At present, after four months, the demand for some of the many protected resources has only increased. This is a positive sign for investors.
Powell’s Testimony, then Beige Book Ought to Give More Information
While this will be a quiet week for economic data, and earnings season is now past its peak, the probabilities are high that it will be a week of dramatic volatility. The reason is that Federal Reserve Chairman Jerome Powell will spend two days answering questions from elected officials that are members of Congress. There are typically a lot of pointed questions from members of the House and Senate as well as grandstanding politicians that want their constituents to see them fighting. In 2023’s case, the Fed intentionally weakens the US economy. Links to watch the live broadcasts of both the Senate and the House Semiannual Monetary Policy Report to Congress are provided below.
Monday 3/6
10:00 AM ET, Factory orders are expected to have fallen 1.8 percent in January versus December’s 1.8 percent rise. Evidence of this turnaround can be seen in Durable Goods Orders for January, which had already been released and is one of two major components of this report. Durable Goods fell 4.5 percent in the month.
Tuesday 3/7
10:00 AM ET, Day one of Fed Chair Jerome Poll’s Semiannual Monetary Policy Report to Congress will be with the US Senate Committee on Banking, Housing, and Urban Affairs. A link to stream the intense exchange that usually occurs can be found here.
3:00 PM ET, Consumer Credit is expected to increase $26.4 billion in January versus a smaller-than-expected increase of $11.6 billion in December. This report has a long lag from the measuring period, this makes it paid attention to less than other reports. However it is of increasing importance now that investors are wondering how long consumers can continue at a high rate despite tighter money.
Wednesday 3/8
8:30 PM ET, International Trade is expected to show a deficit of $69.0 billion during January for total goods and services trade. This would compare with a $67.4 billion deficit in December. A stronger dollar makes US goods less attractive overseas, and goods and services billed in a currency that is weakening in relationship to the US dollar become more attractive domestically when paid for in stronger dollars.
10:00 AM ET, the Jolts or job openings report is expected to decline. It has been strong and rose to 11.0 million in December, however January’s expectation move down to 10.6 million.
2:00 PM ET, The Beige Book is a discussion of what is going on economically in each of the Federal Reserve districts. It is made available roughly two weeks before the FOMC meetings. This report on economic conditions is used for discussion at FOMC meetings which is back to beingthe single most influential events during the year impacting markets.
10:00 AM ET, Day two of Fed Chair Jerome Powell’s Semiannual Monetary Policy Report to Congress will be with the U.S. House Financial Services Committee. A link to stream the intense exchange that usually occurs can be found here.
Thursday 3/9
8:30 AM ET, Jobless claims are a weekly release, but they always have the ability to impact investor thinking. For the week that ended March 4 week they are expected to come in at 196,000 versus 190,000 during the prior week.
4:30 PM ET, The Fed’s balance sheet is a weekly report presenting a balance sheet for all Reserve Bank districts that lists factors supplying reserves into the banking system and factors absorbing reserves from the system. The report is officially named Factors Affecting Reserve Balances. The Fed has been reducing its balance sheet by letting a specific amount of securities owned mature without being reinvested. Investong by the Fed adds money to the marketplace which is stimulative.
Friday 3/10
8:30 AM ET, the consensus for the Employment Sitation is a 215,000 rise for nonfarm payroll growth in February. This compares to 517,000 in January which. January was the ninth straight month and eleventh of the last twelve that payroll growth exceeded consensus of economists.
What Else
As far as what is scheduled, nothing can impact the market greater than the Federal Reserve Chair testifying before Congress both Tuesday and Wednesday. It would be surprising if they all like what he has to say. Stocks continue to be very sensitive; the US 10-year Treasury Note has been a key to the stock markets tone recently.
Why Meta’s Embrace of a ‘Flat’ Management Structure May Not Lead to the Innovation and Efficiency Mark Zuckerberg Seeks
Big Tech, under pressure from dwindling profits and falling stock prices, is seeking some of that old startup magic.
Meta, the parent of Facebook, recently became the latest of the industry’s dominant players to lay off thousands of employees, particularly middle managers, in an effort to return to a flatter, more nimble organization – a structure more typical when a company is very young or very small.
Meta CEO Mark Zuckerberg joins Elon Musk and other business leaders in betting that eliminating layers of management will boost profits. But is flatter better? Will getting rid of managers improve organizational efficiency and the bottom line?
This article was republished with permission from The Conversation, a news site dedicated to sharing ideas from academic experts. It represents the research-based findings and thoughts ofAmber Stephenson, Associate Professor of Management and Director of Healthcare Management Programs, Clarkson University.
As someone who has studied and taught organization theory as well as leadership and organizational behavior for nearly a decade, I think it’s not that simple.
Resilient Bureaucracies
Since the 1800s, management scholars have sought to understand how organizational structure influences productivity. Most early scholars focused on bureaucratic models that promised managerial authority, rational decision-making and efficiency, impartiality and fairness toward employees.
These centralized bureaucratic structures still reign supreme today. Most of us have likely worked in such organizations, with a boss at the top and clearly defined layers of management below. Rigid, written rules and policies dictate how work is done.
Research shows that some hierarchy correlates with commercial success – even in startups – because adding just one level of management helps prevent directionless exploration of ideas and damaging conflicts among staff. Bureaucracies, in their pure form, are viewed as the most efficient way to organize complex companies; they are reliable and predictable.
While adept at solving routine problems, such as coordinating work and executing plans, hierarchies do less well adapting to rapid changes, such as increased competition, shifting consumer tastes or new government regulations.
Bureaucratic hierarchies can stifle the development of employees and limit entrepreneurial initiative. They are slow and inept at tackling complex problems beyond the routine.
Moreover, they are thought to be very costly. Management scholars Gary Hamel and Michele Zanini estimated in 2016 that waste, rigidity and resistance to change in bureaucratic structures cost the U.S. economy US$3 trillion in lost output a year. That is the equivalent of about 17% of all goods and services produced by the U.S. economy at the time of the study.
Even with the mounting criticisms, bureaucratic structures have shown resilience over time. “The formal managerial hierarchy in modern organizations is as persistent as are calls for its replacement,” Harvard scholars Michael Lee and Amy Edmondson wrote in 2017.
Fascinatingly Flat
Flat structures, on the other hand, aim to decentralize authority by reducing or eliminating hierarchy. The structure is harnessed to flexibility and agility rather than efficiency, which is why flat organizations adapt better to dynamic and changing environments.
Flat structures vary. Online retailer Zappos, for example, adopted one of the most extreme versions of the flat structure – known as holacracy – when it eliminated all managers in 2014. Computer game company Valve has a president but no formal managerial structure, leaving employees free to work on projects they choose.
Other companies, such as Gore Tex maker W. L. Gore & Associates and film-streaming service Netflix, have instituted structures that empower employees with wide-reaching autonomy but still allow for some degree of management.
In general, flat structures rely on constant communication, decentralized decision-making and the self-motivation of employees. As a result, flat structures are associated with innovation, creativity, speed, resilience and improved employee morale.
The promises of going flat are understandably enticing, but flat organizations are tricky to get right.
The list of companies succeeding with flat structures is noticeably short. Besides the companies mentioned above, the list typically includes social media marketing organization Buffer, online publisher Medium and tomato processing and packing company Morning Star Tomatoes.
Other organizations that attempted flatter structures have encountered conflicts between staff, ambiguity around job roles and the emergence of unofficial hierarchies – which undermines the whole point of going flat. They eventually reverted back to hierarchical structures.
“While people may lament the proliferation of red tape,” management scholars Pedro Monteiro and Paul Adler explain, “in the next breath, many complain that ‘there ought to be a rule.’”
Even Zappos, often cited as the case study for flat organizations, has slowly added back managers in recent years.
Right Tool
In many ways, flat organizations require even stronger management than hierarchical ones.
When managers are removed, the span of control for those remaining increases. Corporate leaders must delegate – and track – tasks across greater numbers of employees and constantly communicate with workers.
Careful planning is needed to determine how work is organized, information shared, conflicts resolved and employees compensated, hired and reviewed. It is not surprising that as companies grow, the complexity of bigger organizations poses barriers to flat models.
In the end, organizational structure is a tool. History shows that business and economic conditions determine which type of structure works for an organization at any given time.
All organizations navigate the trade-off between stability and flexibility. While a hospital system facing extensive regulations and patient safety protocols may require a stable and consistent hierarchy, an online game developer in a competitive environment may need an organizational structure that’s more nimble so it can adapt to changes quickly.
Business and economic conditions are changing for Big Tech, as digital advertising declines, new competitors surface and emerging technologies demand risky investments. Meta’s corporate flattening is one response.
As Zuckerberg noted when explaining recent changes, “Our management theme for 2023 is the ‘Year of Efficiency,’ and we’re focused on becoming a stronger and more nimble organization.”
But context matters. So does planning. All the evidence I’ve seen indicates that embracing flatness by cutting middle management will not, by itself, do much to make a company more efficient.
Reports Record Full Year Net Income of $248 million
March 02, 2023 16:45 ET
STAMFORD, Conn., March 02, 2023 (GLOBE NEWSWIRE) — Eagle Bulk Shipping Inc. (NYSE: EGLE) (“Eagle” or the “Company”), one of the world’s largest owner-operators within the midsize drybulk vessel segment, today reported financial results for the three months and year ended December 31, 2022.
Quarter Highlights:
Generated Revenues, net of $151.4 million
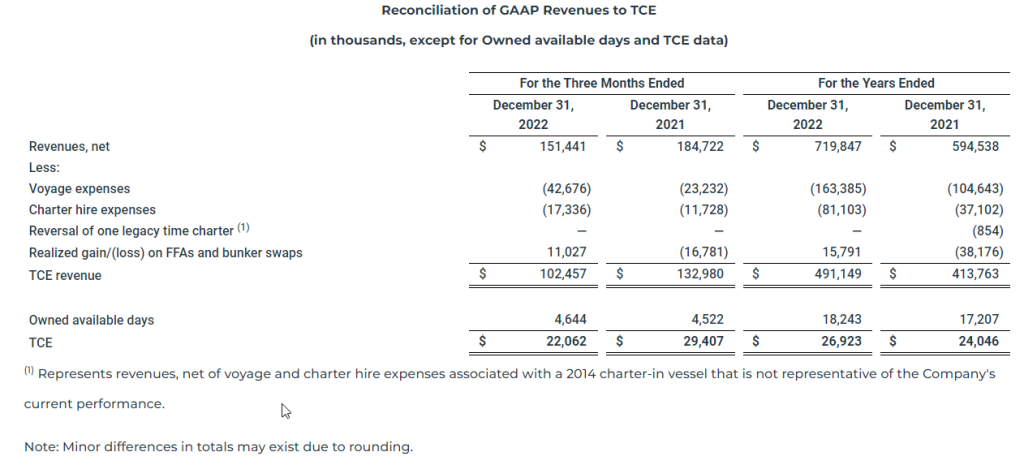
Achieved TCE(1) of $22,062/day based on TCE Revenues(1) of $102.5 million
Realized net income of $23.3 million, or $1.79 per basic share
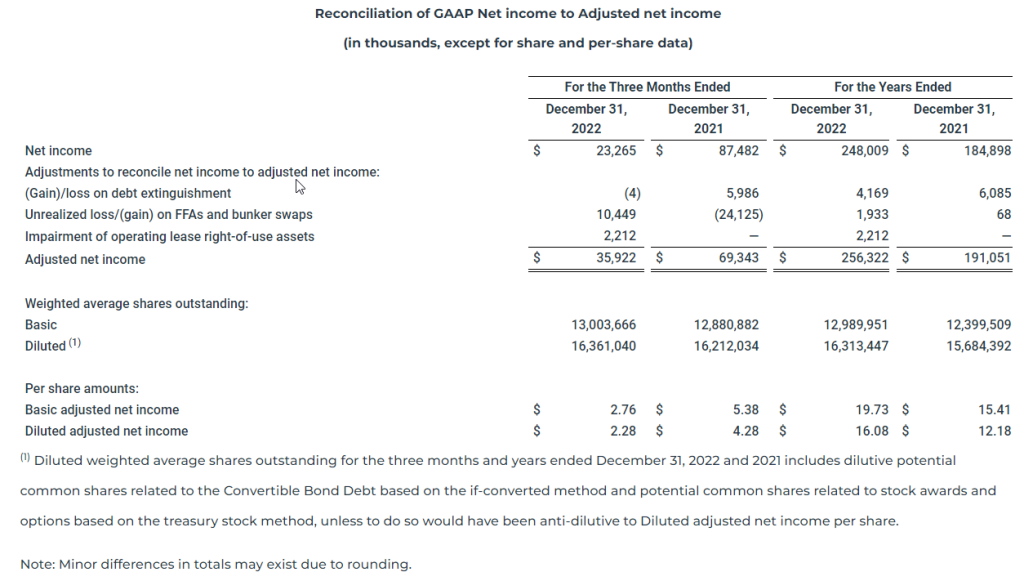
Adjusted net income(1) of $35.9 million, or $2.76 per basic share(1)
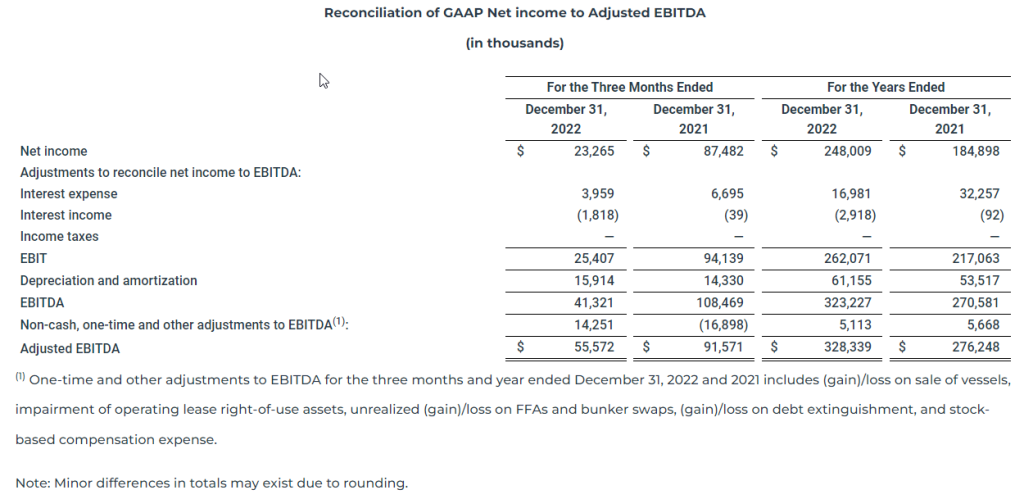
Generated EBITDA(1) of $41.3 million
Adjusted EBITDA(1) of $55.6 million
Executed an agreement to purchase a 2015-built, high specification Ultramax for $24.3 million
Vessel delivered to the Company in February 2023 and renamed the M/V Gibraltar Eagle
Declared a quarterly dividend of $0.60 per share for the fourth quarter of 2022
Dividend is payable on March 23, 2023 to shareholders of record at the close of business on March 15, 2023
Recent Developments:
Completed transfer of listing to the New York Stock Exchange (NYSE) on January 4, 2023
Appointed Kate Blankenship to the Board of Directors on January 18, 2023
Executed agreements to purchase two 2020-built high specification scrubber-fitted Ultramaxes for $30.1 million each
Vessels are expected to be delivered to the Company during the second quarter of 2023 and will be renamed the M/V Halifax Eagle and M/V Vancouver Eagle
Executed an agreement to sell the M/V Jaeger (2004-built Supramax) for $9.0 million
Transaction is expected to close in March 2023
Fixed 92% of available days for the first quarter of 2023 at an average TCE of $13,335
1These are non-GAAP financial measures. A reconciliation of GAAP to non-GAAP financial measures has been provided in the financial tables included in this press release. An explanation of these measures and how they are calculated are also included below under the heading “Supplemental Information – Non-GAAP Financial Measures.”
Eagle’s CEO Gary Vogel commented, “Despite a weaker rate environment, our Q4 results cemented a record annual profit of roughly $250 million for 2022. These results are reflective of the many actions we have taken over the past years, including our comprehensive vessel sale and purchase strategy encompassing 55 transactions, our segment-leading focus on scrubbers, our differentiated active management approach to trading ships, and our efforts to optimize the balance sheet.
Based on this and consistent with the company’s stated capital allocation strategy of distributing a minimum of 30% of net income, the company declared its sixth consecutive quarterly dividend since adoption of the policy, bringing total shareholder distributions to $10.65 per share, or $139 million.
In recent months, we continued to enhance and grow our fleet. We purchased three modern high specification Ultramaxes, two of which are scrubber-fitted, and sold the oldest vessel in our fleet. It is noteworthy that this sale represents the 22nd, and last, vessel to be sold as part of the initial fleet renewal program which we initiated six years ago.
As we enter 2023, we remain positive on market fundamentals given a historically low orderbook with a rapidly aging fleet, as well as a number of demand catalysts including China’s reopening post Covid restrictions,” continued Mr. Vogel. “While uncertainty in the macro-economic environment has brought volatility, both rates and forward curves have moved up substantially in recent days. Further, with our modern fleet of 55, predominately scrubber-fitted vessels, and a robust balance sheet with investment capacity, the company remains uniquely positioned to deliver value to our stakeholders.”
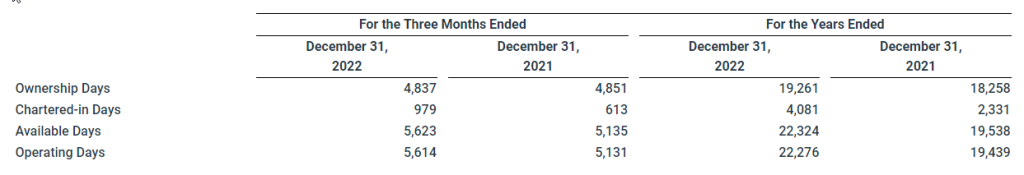
Fleet Operating Data
Fleet Development
Tokyo Eagle, a Japanese-built, scrubber-fitted Ultramax (61k DWT / 2015-built), acquired in the third quarter of 2022 for total consideration of $27.5 million, was delivered to the Company in the fourth quarter of 2022
Gibraltar Eagle, a Chinese-built Ultramax (64k DWT / 2015-built), acquired in the fourth quarter of 2022 for total consideration of $24.3 million, was delivered to the Company in the first quarter of 2023
Halifax Eagle, a Chinese-built, scrubber-fitted Ultramax (64k DWT / 2020-built), acquired in the first quarter of 2023 for total consideration of $30.1 million, is expected to be delivered to the Company in the second quarter of 2023
Vancouver Eagle, a Chinese-built, scrubber-fitted Ultramax (64k DWT / 2020-built), acquired in the first quarter of 2023 for total consideration of $30.1 million, is expected to be delivered to the Company in the second quarter of 2023
Jaeger, a Japanese-built Supramax (52k DWT / 2004-built), sold in the first quarter of 2023 for total consideration of $9.0 million, is expected to be delivered to the buyer in the first quarter of 2023
Pro forma owned fleet totals 55 vessels with an average age of 9.1 years
Results of Operations for the three months and years ended December 31, 2022 and 2021
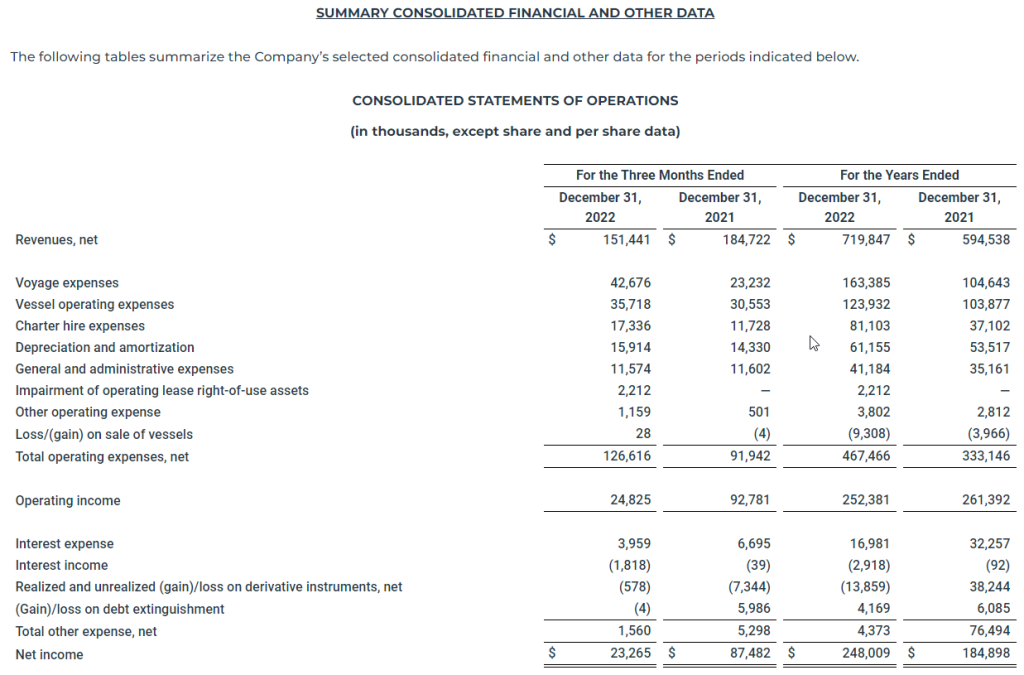
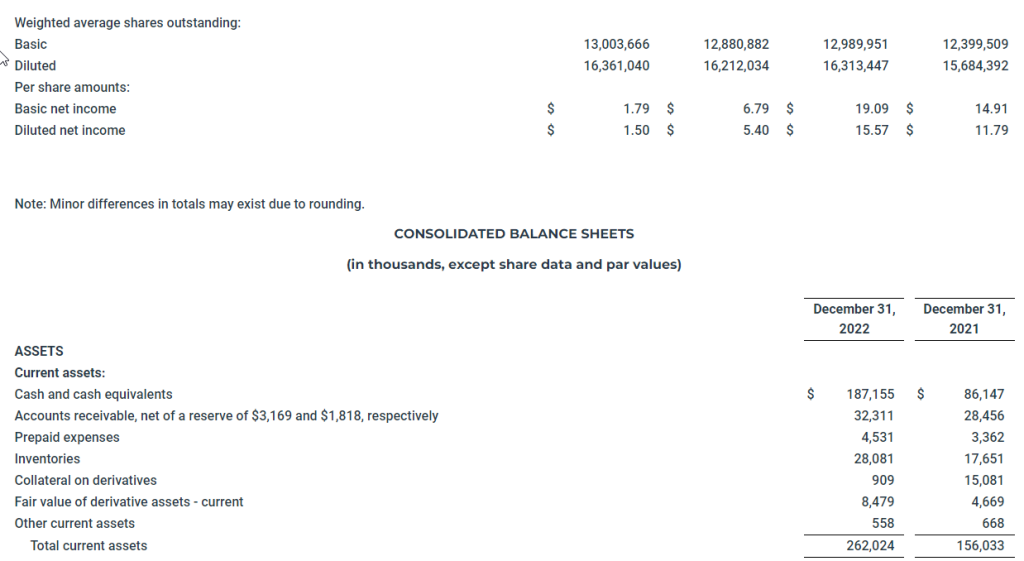
For the three months ended December 31, 2022, the Company reported net income of $23.3 million, or basic and diluted net income per share of $1.79 and $1.50, respectively. In the comparable quarter of 2021, the Company reported net income of $87.5 million, or basic and diluted net income per share of $6.79 and $5.40, respectively.
For the three months ended December 31, 2022, the Company reported adjusted net income of $35.9 million, which excludes unrealized losses on derivative instruments and impairment of operating lease right-of-use assets of $10.4 million and $2.2 million, respectively, or basic and diluted adjusted net income per share of $2.76 and $2.28, respectively. In the comparable quarter of 2021, the Company reported adjusted net income of $69.3 million, which excludes unrealized gains on derivative instruments and a loss on debt extinguishment of $24.1 million and $6.0 million, respectively, or basic and diluted adjusted net income per share of $5.38 and $4.28, respectively.
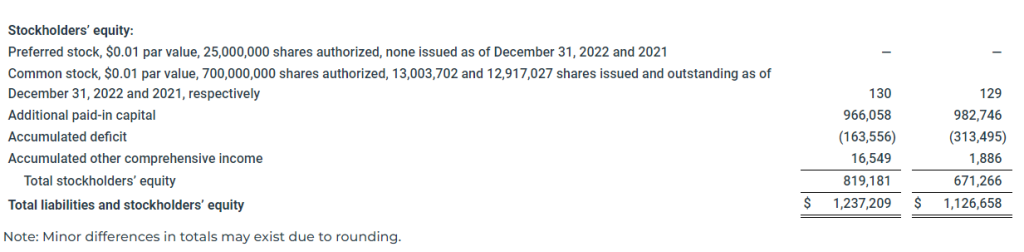
For the year ended December 31, 2022, the Company reported net income of $248.0 million, or basic and diluted net income per share of $19.09 and $15.57, respectively. For the year ended December 31, 2021, the Company reported net income of $184.9 million, or basic and diluted net income per share of $14.91 and $11.79, respectively.
For the year ended December 31, 2022, the Company reported adjusted net income of $256.3 million, which excludes a loss on debt extinguishment, impairment of operating lease right-of-use assets and unrealized losses on derivative instruments of $4.2 million, $2.2 million and $1.9 million, respectively, or basic and diluted adjusted net income per share of $19.73 and $16.08, respectively. For the year ended December 31, 2021, the Company reported adjusted net income of $191.1 million, which excludes a loss on debt extinguishment and unrealized losses on derivative instruments of $6.1 million and $0.1 million, respectively, or basic and diluted adjusted net income per share of $15.41 and $12.18, respectively.
Revenues, net
Revenues, net for the three months ended December 31, 2022 were $151.4 million, compared to $184.7 million for the comparable quarter in 2021. Revenues, net decreased $33.3 million primarily due to lower rates driven by declines in the underlying freight market, offset in part by an increase in operating days (5,614 for the three months ended December 31, 2022 compared to 5,131 for the three months ended December 31, 2021).
Revenues, net for the year ended December 31, 2022 were $719.8 million, compared to $594.5 million for the year ended December 31, 2021. Revenues, net increased $87.4 million due to an increase in total operating days (22,276 for the year ended December 31, 2022 compared to 19,439 for the year ended December 31, 2021) driven by increases in both owned days and chartered-in days and increased $37.9 million due to an increase in rates.
Voyage expenses
Voyage expenses for the three months ended December 31, 2022 were $42.7 million compared to $23.2 million for the comparable quarter in 2021. Voyage expenses increased primarily due to an increase in bunker consumption expense of $13.5 million due to an increase in bunker fuel prices, an increase in costs for contingent liabilities of $3.4 million driven by provisions for certain routine commercial claims and an increase in port expenses of $3.4 million primarily driven by an increase in fuel surcharges related to tugs along with cost inflation, partially offset by a decrease in broker commissions of $0.8 million driven by a decrease in related revenues.
Voyage expenses for the year ended December 31, 2022 were $163.4 million, compared to $104.6 million for the year ended December 31, 2021. Voyage expenses increased primarily due to an increase in bunker consumption expense of $43.9 million driven by an increase in bunker fuel prices, an increase in port expenses of $11.8 million driven by an increase in fuel surcharges related to tugs along with cost inflation and an increase in costs for contingent liabilities of $3.4 million driven by provisions for certain routine commercial claims.
Vessel operating expenses
Vessel operating expenses, which include non-recurring expenses related to vessel acquisitions and sales, for the three months ended December 31, 2022 were $35.7 million compared to $30.6 million for the comparable quarter in 2021. Vessel operating expenses increased primarily due to an increase in repair costs of $2.7 million driven by certain discretionary repairs and upgrades as well as unscheduled necessary repairs, an increase in the cost of lubes, stores and spares of $1.2 million driven by increased volumes and cost inflation and an increase in crew-related costs of $1.1 million driven by higher crew wages, increased crew changes and increased expenses related to COVID-19 and the conflict between Russia and Ukraine. Ownership days for the three months ended December 31, 2022 were 4,837, compared to 4,851 for the comparable quarter in 2021.
Average daily vessel operating expenses excluding one-time, non-recurring expenses related to vessel acquisitions and sales and termination charges relating to a change in crewing manager on some of our vessels for the three months ended December 31, 2022 was $6,996, compared to $6,028 for the comparable quarter in 2021.
Vessel operating expenses, which include non-recurring expenses related to vessel acquisitions and sales, for the year ended December 31, 2022 were $123.9 million, compared to $103.9 million for the year ended December 31, 2021, with the increase driven, in part, by an increase in ownership days (19,261 for the year ended December 31, 2022 compared to 18,258 for the year ended December 31, 2021).
The increase in vessel operating expenses was due to an increase in crew-related costs of $8.9 million driven by higher crew wages, increased crew changes and increased expenses related to COVID-19 and the conflict between Russia and Ukraine, an increase in repair costs of $5.6 million driven by certain discretionary repairs and upgrades as well as unscheduled necessary repairs and an increase in the cost of lubes, stores and spares of $5.0 million driven by increased volumes and cost inflation.
Average daily vessel operating expenses excluding one-time, non-recurring expenses related to vessel acquisitions and sales and termination charges relating to a change in crewing manager on some of our vessels for the year ended December 31, 2022 was $6,244, compared to $5,357 for the year ended December 31, 2021.
Charter hire expenses
Charter hire expenses for the three months ended December 31, 2022 were $17.3 million, compared to $11.7 million for the comparable quarter in 2021. Charter hire expenses increased $7.0 million due to an increase in chartered-in days (979 for the three months ended December 31, 2022 as compared to 613 for the comparable quarter in 2021) and was partially offset by a decrease of $1.4 million due to a decrease in charter hire rates primarily driven by declines in the underlying freight market.
Charter hire expenses for the year ended December 31, 2022 were $81.1 million, compared to $37.1 million for the year ended December 31, 2021. Charter hire expenses increased $27.9 million primarily due to an increase in chartered-in days (4,081 for the year ended December 31, 2022 as compared to 2,331 for the year ended December 31, 2021) and increased $16.1 million due to an increase in charter hire rates as well as the impact of exercised extension options on the Company’s long-term charter-in contracts.
Depreciation and amortization
Depreciation and amortization for the three months ended December 31, 2022 was $15.9 million, compared to $14.3 million for the comparable quarter in 2021. Total depreciation and amortization for the three months ended December 31, 2022 included $12.4 million of vessel and other fixed asset depreciation and $3.5 million of deferred drydocking cost amortization. Total depreciation and amortization for the three months ended December 31, 2021 included $11.9 million of vessel and other fixed asset depreciation and $2.4 million of deferred drydocking cost amortization. Depreciation and amortization increased $1.1 million due to the impact of drydocks completed during 2022 and increased $0.5 million due to an increase in the cost base of our owned fleet as well as ballast water treatment systems (“BWTS”) installed during 2022.
Depreciation and amortization for the year ended December 31, 2022 was $61.2 million, compared to $53.5 million for the year ended December 31, 2021. Total depreciation and amortization for the year ended December 31, 2022 included $47.9 million of vessel and other fixed asset depreciation and $13.2 million of deferred drydocking cost amortization. Total depreciation and amortization for the year ended December 31, 2021 included $44.9 million of vessel and other fixed asset depreciation and $8.7 million of deferred drydocking cost amortization. Depreciation and amortization increased $4.6 million primarily due to higher average drydocking expenditures and increased $3.1 million primarily due to the full year impact of vessels acquired during 2021.
General and administrative expenses
General and administrative expenses for each of the three months ended December 31, 2022 and 2021 were $11.6 million.
General and administrative expenses for the year ended December 31, 2022 were $41.2 million, compared to $35.2 million for the year ended December 31, 2021. General and administrative expenses increased $2.6 million due to higher stock-based compensation expense, increased $0.9 million due to an increase in compensation and benefits, increased $0.8 million due to higher professional fees and increased $0.8 million due to higher other corporate costs, including travel and office-related costs.
Other operating expense
Other operating expense for the three months ended December 31, 2022 was $1.2 million, compared to $0.5 million for the comparable quarter of 2021. Other operating expense for each of the three months ended December 31, 2022 and 2021 were primarily comprised of costs related to a 2021 U.S. government investigation into an allegation that one of our vessels may have improperly disposed of ballast water that entered the engine room bilges during a repair. The Company posted a surety bond as security for any potential fines, penalties or other associated costs.
Other operating expense for the year ended December 31, 2022 was $3.8 million, compared to $2.8 million for the year ended December 31, 2021. Other operating expense for the year ended December 31, 2022 was primarily comprised of $2.4 million of costs associated with a corporate transaction that did not materialize and $1.4 million of costs related to the aforementioned investigation. Other operating expense for the year ended December 31, 2021 was primarily comprised of costs related to the aforementioned investigation.
Interest expense
Interest expense for the three months ended December 31, 2022 was $4.0 million, compared to $6.7 million for the comparable quarter of 2021. Interest expense decreased $1.1 million due to lower amortization of debt discounts and deferred financing costs primarily as a result of the Company’s adoption of ASU 2020-06, decreased $1.0 million due to lower outstanding principal balances and decreased $0.6 million due to lower effective interest rates. The decrease in outstanding principal balances and effective interest rates were as a result of the refinancing of the Company’s debt in the fourth quarter of 2021.
Interest expense for the year ended December 31, 2022 was $17.0 million, compared to $32.3 million for the year ended December 31, 2021. Interest expense decreased $5.4 million due to lower effective interest rates and decreased $5.3 million due to lower outstanding principal balances, each as a result of the refinancing of the Company’s debt in the fourth quarter of 2021 and decreased $5.0 million due to lower amortization of debt discounts and deferred financing costs primarily as a result of the Company’s adoption of ASU 2020-06.
Realized and unrealized (gain)/loss on derivative instruments, net
For the three months ended December 31, 2022, the Company recorded a net realized and unrealized gain on derivatives of $0.6 million, compared to a net realized and unrealized gain on derivatives of $7.3 million for the comparable quarter in 2021. Net realized and unrealized gains decreased primarily due to $10.8 million of unrealized losses on FFAs for the three months ended December 31, 2022 compared to $24.9 million in unrealized gains on FFAs for the three months ended December 31, 2021, partially offset by $11.4 million of realized gains on FFAs for the three months ended December 31, 2022 compared to $17.6 million of realized losses on FFAs for the three months ended December 31, 2021, collectively driven by changes in market freight rates and the timing of positions taken.
For the year ended December 31, 2022, the Company recorded a net realized and unrealized gain on derivatives of $13.9 million, compared to a net realized and unrealized loss on derivatives of $38.2 million for the year ended December 31, 2021. The change was primarily due to $11.4 million of realized gains on FFAs for the year ended December 31, 2022 compared to $41.1 million of realized losses on FFAs for the year ended December 31, 2021 driven by changes in market freight rates and the timing of positions taken.
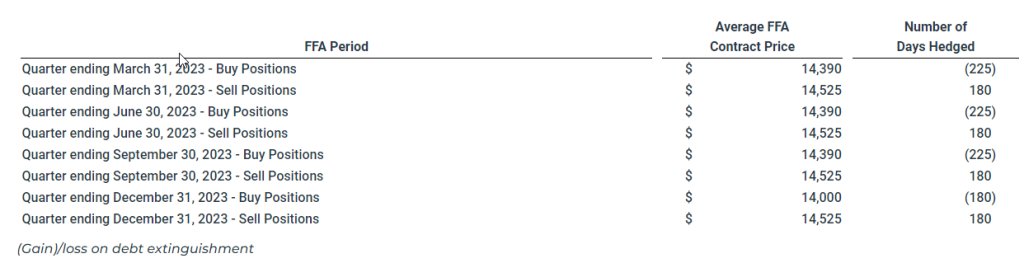
A summary of outstanding FFAs as of December 31, 2022 is as follows:
For the years ended December 31, 2022 and December 31, 2021, the Company recorded a loss on debt extinguishment of $4.2 million and $6.1 million, respectively. During the year ended December 31, 2022, the Company repurchased $10.0 million in aggregate principal amount of Convertible Bond Debt (as defined herein) for $14.2 million in cash and cancelled the repurchased debt. During the three months and year ended December 31, 2021, the Company repaid the then outstanding Norwegian Bond Debt (as defined herein) and accrued interest and discharged the debt in full from the proceeds of the Global Ultraco Debt Facility (as defined herein) and cash on hand. As a result, the loss on debt extinguishment comprised $1.6 million of unamortized debt discount and debt issuance costs, as well as $4.4 million of call premium.
Liquidity and Capital Resources
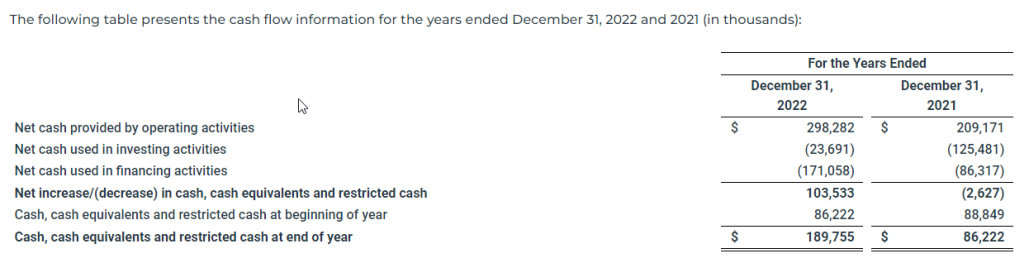
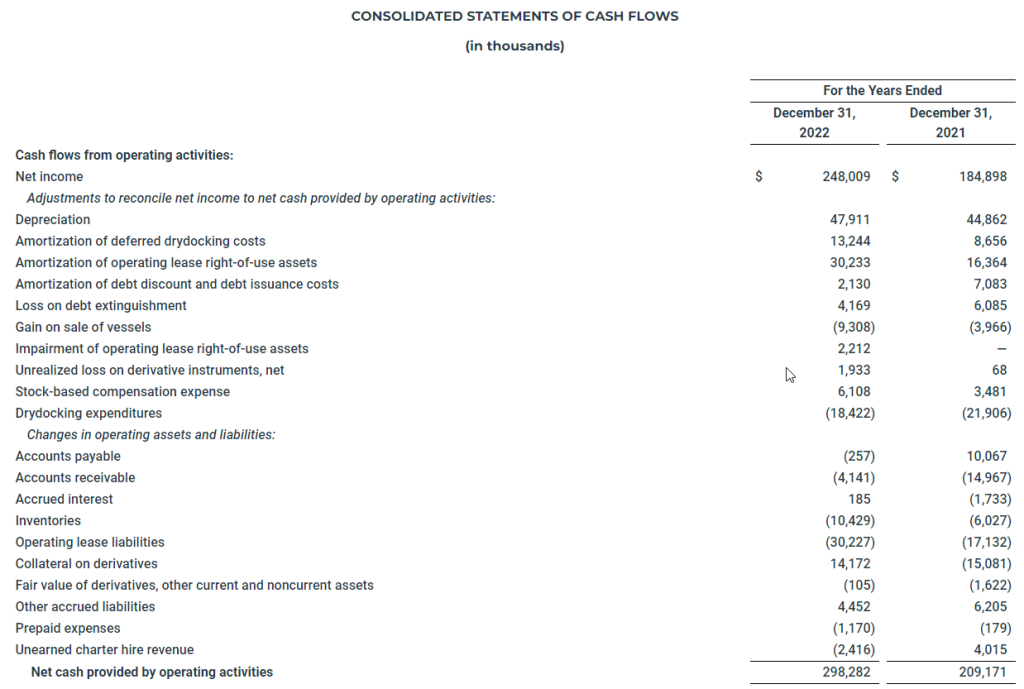
The following table presents the cash flow information for the years ended December 31, 2022 and 2021 (in thousands):
The increase in net cash provided by operating activities was primarily driven by a $63.1 million increase in net income due to higher freight rates as well as a $29.3 million net decrease in collateral on derivatives, primarily due to a decrease in the number and size of outstanding positions.
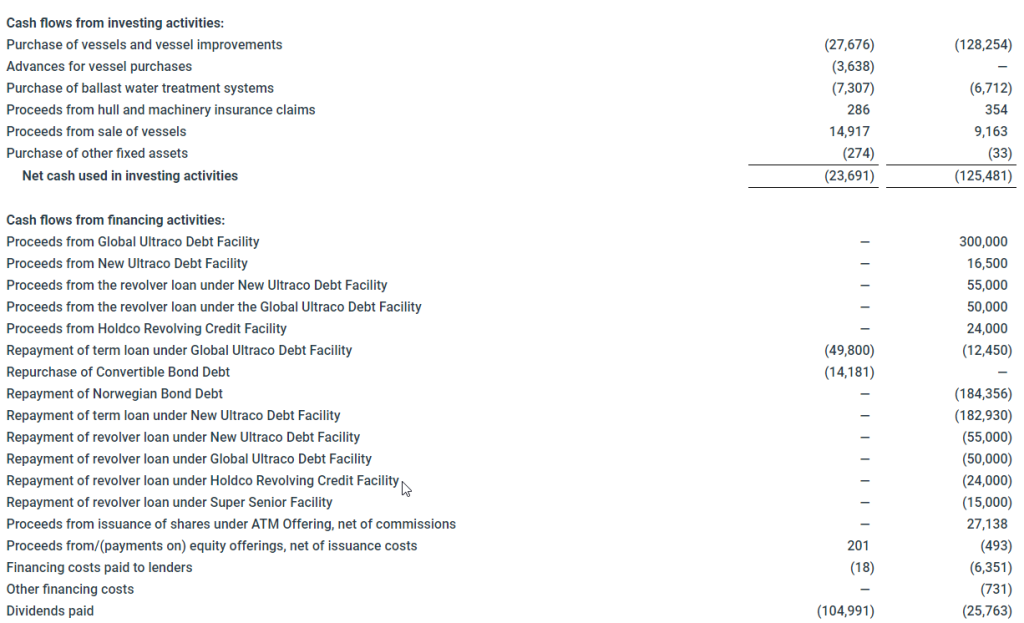
Net cash used in investing activities for the year ended December 31, 2022 was $23.7 million, compared to $125.5 million for the year ended December 31, 2021. During the year ended December 31, 2022, the Company paid $27.7 million to purchase one vessel and other vessel improvements, paid $7.3 million for the purchase of BWTS and paid $3.6 million as an advance on the purchase of one vessel. This use of cash was partially offset by $14.9 million in proceeds from the sale of one vessel and $0.3 million in proceeds received on hull and machinery claims. During the year ended December 31, 2021, the Company paid $128.3 million to purchase nine vessels and other vessel improvements and paid $6.7 million for the purchase of BWTS. This use of cash was partially offset by $9.2 million in proceeds from the sale of one vessel and $0.4 million of insurance proceeds received on hull and machinery claims.
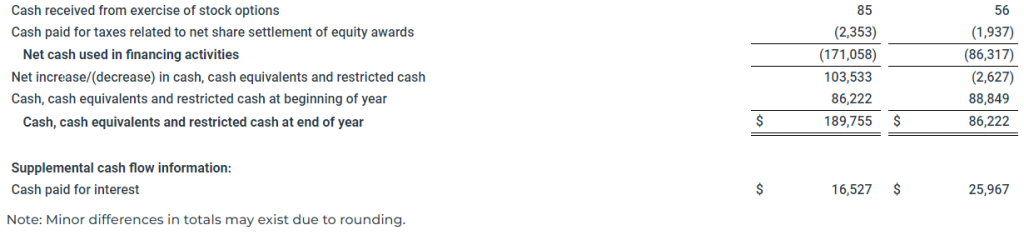
Net cash used in financing activities for the year ended December 31, 2022 was $171.1 million, compared to $86.3 million for the year ended December 31, 2021. During the year ended December 31, 2022, the Company (i) paid $105.0 million in dividends, (ii) repaid $49.8 million of term loan under the Global Ultraco Debt Facility, (iii) paid $14.2 million to repurchase $10.0 million in aggregate principal amount of Convertible Bond Debt and (iv) paid $2.4 million for taxes related to net share settlement of equity awards. During the year ended December 31, 2021, the Company repaid (i) $184.4 million of the Norwegian Bond Debt, (ii) $182.9 million of term loan under the New Ultraco Debt Facility (as defined herein), (iii) $55.0 million of revolver loan under the New Ultraco Debt Facility, (iv) $50.0 million of revolver loan under the Global Ultraco Debt Facility, (v) $24.0 million of the Holdco Revolving Credit Facility (as defined herein), (vi) $15.0 million of revolver loan under the Super Senior Facility and (vii) $12.5 million of term loan under the Global Ultraco Debt Facility. In addition, the Company paid (i) $25.8 million in dividends, (ii) $6.4 million in financing costs to lenders, (iii) $1.9 million for taxes related to net share settlement of equity awards, (iv) $0.7 million in other financing costs, and (v) $0.5 million of issuance costs related to equity offerings. These uses of cash were partially offset by (i) $300.0 million in proceeds from the term loan under the Global Ultraco Debt Facility, (ii) $55.0 million in proceeds from the revolver loan under the New Ultraco Debt Facility, (iii) $50.0 million in proceeds from the revolver loan under the Global Ultraco Debt Facility, (iv) $27.1 million in net proceeds from the ATM Offering (as defined herein), (v) $24.0 million in proceeds from the Holdco Revolving Credit Facility and (vi) $16.5 million in proceeds from the New Ultraco Debt Facility.
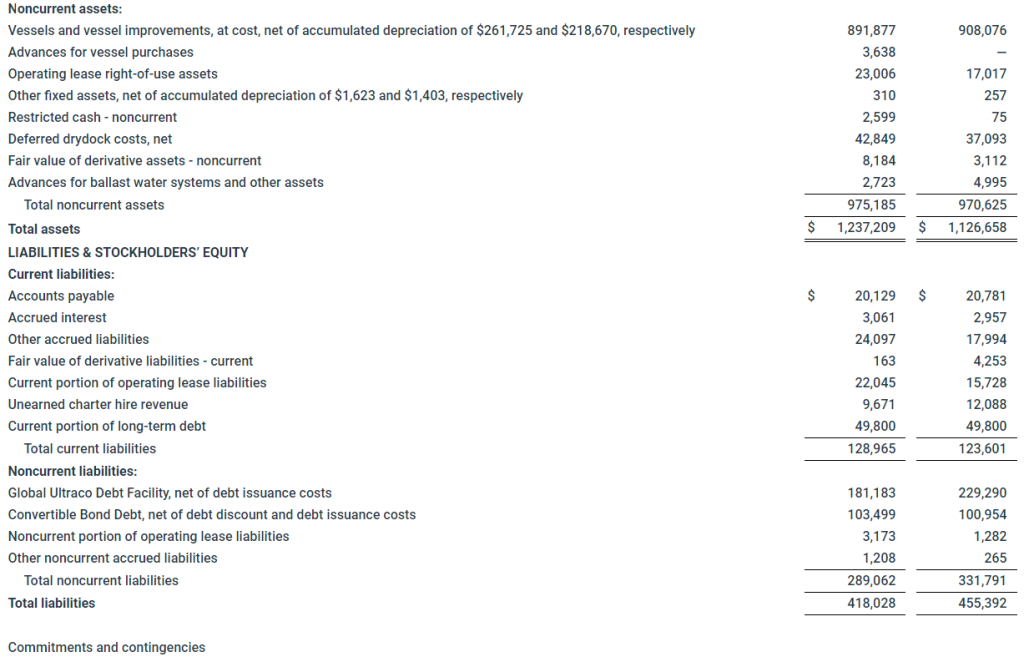
As of December 31, 2022, our cash and cash equivalents including noncurrent restricted cash was $189.8 million compared to $86.2 million as of December 31, 2021.
As of December 31, 2022, the Company’s debt, excluding $7.4 million of debt discount and debt issuance costs, was $341.9 million, the current portion of which was $49.8 million, and was comprised of $237.8 million outstanding under the Global Ultraco Debt Facility and $104.1 million of Convertible Bond Debt. In addition, as of December 31, 2022, the undrawn revolving facility under the Global Ultraco Debt Facility was $100.0 million.
Capital Expenditures and Drydocking
Our capital expenditures relate to the purchase of vessels and capital improvements to our vessels, which are required and/or expected to enhance the efficiency and/or safety of our vessels.
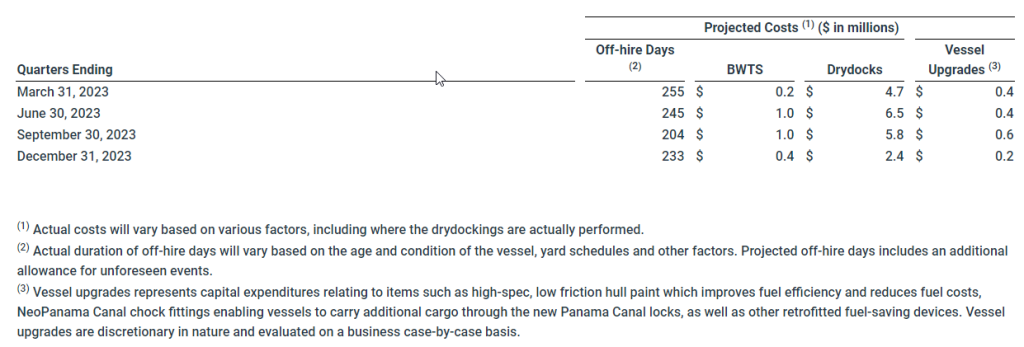
In addition to acquisitions that we may undertake in future periods, the Company’s other major capital expenditures include funding the Company’s program of regularly scheduled drydocking and vessel improvements necessary to comply with international shipping standards and environmental laws and regulations. Although the Company has some flexibility regarding the timing of its drydockings, the costs are relatively predictable. In accordance with statutory requirements, management anticipates that vessels are to be drydocked every five years for vessels less than 15 years and every two and a half years for vessels older than 15 years. Funding of drydocking costs is anticipated to be satisfied with cash from operations. Generally, drydocking requires us to reposition vessels from a discharge port to shipyard facilities, which will reduce our available days and operating days during that period.
The following table represents certain information about the estimated costs for anticipated vessel drydockings, BWTS and vessel upgrades in the next four quarters, along with the anticipated off-hire days:
Supplemental Information – Non-GAAP Financial Measures
This release includes various financial measures that are non-GAAP financial measures as defined under the rules of the Securities and Exchange Commission (“SEC”). We believe these measures provide important supplemental information to investors to use in evaluating ongoing operating results. We use these measures, together with accounting principles generally accepted in the United States (“GAAP” or “U.S. GAAP”) measures, for internal managerial purposes and as a means to evaluate period-to-period comparisons. However, we do not, and you should not, rely on non-GAAP financial measures alone as measures of our performance. We believe that non-GAAP financial measures reflect an additional way of viewing aspects of our operations, that when taken together with GAAP results and the reconciliations to corresponding GAAP financial measures that we also provide and provide a more complete understanding of factors and trends affecting our business. We strongly encourage you to review all of our financial statements and publicly-filed reports in their entirety and to not solely rely on any single non-GAAP financial measure.
Because non-GAAP financial measures are not standardized, it may not be possible to compare these financial measures with other companies’ non-GAAP financial measures, even if they have similar names.
Non-GAAP Financial Measures
(1) Adjusted net income and Basic and Diluted Adjusted net income per share
Adjusted net income and Basic and Diluted Adjusted net income per share represents Net income and Basic and Diluted net income per share, respectively, as adjusted to exclude unrealized gains and losses on FFAs and bunker swaps, gains and losses on debt extinguishment, and impairment of operating lease right-of-use assets. The Company utilizes derivative instruments such as FFAs and bunker swaps to partially hedge against its underlying long physical position in ships (as represented by owned and third-party chartered-in vessels). As the Company does not apply hedge accounting to these derivative instruments, unrealized mark-to-market gains and losses on forward hedge positions impact current quarter results, causing timing mismatches in the Consolidated Statements of Operations. Additionally, we believe that gains and losses on debt extinguishment and impairment of operating lease right-of-use assets are not representative of our normal business operations. We believe that Adjusted net income and Adjusted net income per share are more useful to analysts and investors in comparing the results of operations and operational trends between periods and relative to other peer companies in our industry. Our Adjusted net income should not be considered an alternative to net income/(loss), operating income/(loss), cash flows provided by/(used in) operating activities or any other measure of financial performance or liquidity presented in accordance with U.S. GAAP. As noted above, our Adjusted net income and Adjusted net income per share may not be comparable to similarly titled measures of another company because all companies may not calculate Adjusted net income in the same manner.
The following table presents the reconciliation of our Net income to Adjusted net income:
EBITDA and Adjusted EBITDA
We define EBITDA as Net income under GAAP adjusted for interest, income taxes and depreciation and amortization.
Adjusted EBITDA is a non-GAAP financial measure that is used as a supplemental financial measure by our management and by external users of our financial statements, such as investors, commercial banks and others, to assess our operating performance as compared to that of other peer companies in our industry, without regard to financing methods, capital structure or historical costs basis. Our Adjusted EBITDA should not be considered an alternative to net income/(loss), operating income/(loss), cash flows provided by/(used in) operating activities or any other measure of financial performance or liquidity presented in accordance with U.S. GAAP. Our Adjusted EBITDA may not be comparable to similarly titled measures of another company because all companies may not calculate Adjusted EBITDA in the same manner. Adjusted EBITDA represents EBITDA adjusted to exclude certain non-cash, one-time and other items that the Company believes are not indicative of the ongoing performance of its core operations such as vessel impairment, gain/(loss) on sale of vessels, impairment of operating lease right-of-use assets, unrealized (gain)/loss on FFAs and bunker swaps, (gain)/loss on debt extinguishment and stock-based compensation expense. The following table presents a reconciliation of our Net income to EBITDA and Adjusted EBITDA:
TCE revenue and TCE
Time charter equivalent revenue (“TCE revenue”) and time charter equivalent (“TCE”) are non-GAAP financial measures that are commonly used in the shipping industry primarily to compare daily earnings generated by vessels on time charters with daily earnings generated by vessels on voyage charters, because charter hire rates for vessels on voyage charters are generally not expressed in per-day amounts while charter hire rates for vessels on time charters generally are expressed in such amounts. The Company defines TCE revenue as revenues, net less voyage expenses and charter hire expenses, adjusted for realized gains and losses on FFAs and bunker swaps and defines TCE as TCE revenue divided by the number of owned available days. Owned available days is the number of our ownership days less the aggregate number of days that our vessels are off-hire due to vessel familiarization upon acquisition, repairs, vessel upgrades or special surveys. The shipping industry uses available days to measure the number of days in a period during which vessels should be capable of generating revenues. TCE provides additional meaningful information in conjunction with Revenues, net, the most directly comparable GAAP measure, because it assists Company management in making decisions regarding the deployment and use of its vessels and in evaluating their performance. Our TCE revenue and TCE should not be considered alternatives to net income/(loss), operating income/(loss), cash flows provided by/(used in) operating activities or any other measure of financial performance or liquidity presented in accordance with U.S. GAAP. Our TCE revenue and TCE may not be comparable to similarly titled measures of another company because all companies may not calculate TCE revenue and TCE in the same manner.
The following table presents the reconciliation of our Revenues, net to TCE:
Glossary of Terms:
Ownership days: We define ownership days as the aggregate number of days in a period during which each vessel in our fleet has been owned by us. Ownership days are an indicator of the size of our fleet over a period and affect both the amount of revenues and the amount of expenses that we record during a period.
Chartered-in days: We define chartered-in days as the aggregate number of days in a period during which we charter-in vessels under operating leases. Periodically, the Company charters in vessels on a single trip basis.
Available days: We define available days as the number of our ownership days and chartered-in days less the aggregate number of days that our vessels are off-hire due to vessel familiarization upon acquisition, repairs, vessel upgrades or special surveys. The shipping industry uses available days to measure the number of days in a period during which vessels should be capable of generating revenues.
Operating days: We define operating days as the number of available days in a period less the aggregate number of days that our vessels are off-hire due to any reason, including unforeseen circumstances. The shipping industry uses operating days to measure the aggregate number of days in a period during which vessels actually generate revenues.
Definitions of Capitalized Terms
ATM Offering: ATM Offering refers to an at market issuance sales agreement entered into in March 2021 by the Company with B. Riley Securities, Inc., BTIG, LLC and Fearnley Securities, Inc., as sales agents, to sell shares of common stock, par value $0.01 per share, of the Company with aggregate gross sales proceeds of up to $50.0 million, from time to time through an “at-the-market” offering program.
Convertible Bond Debt: Convertible Bond Debt refers to 5.0% Convertible Senior Notes due 2024 issued by the Company on July 29, 2019 that will mature on August 1, 2024.
Global Ultraco Debt Facility: Global Ultraco Debt Facility refers to the senior secured credit facility entered into by Eagle Bulk Ultraco LLC (“Eagle Ultraco”), a wholly-owned subsidiary of the Company, along with certain of its vessel-owning subsidiaries as guarantors, with the lenders party thereto (the “Lenders”), Credit Agricole Corporate and Investment Bank (“Credit Agricole”), Skandinaviska Enskilda Banken AB (PUBL), Danish Ship Finance A/S, Nordea Bank ABP, Filial I Norge, DNB Markets Inc., Deutsche Bank AG, and ING Bank N.V., London Branch. The Global Ultraco Debt Facility provides for an aggregate principal amount of $400.0 million, which consists of (i) a term loan facility in an aggregate principal amount of $300.0 million and (ii) a revolving credit facility in an aggregate principal amount of $100.0 million. The Global Ultraco Debt Facility is secured by 49 of the Company’s vessels. As of December 31, 2022, $100.0 million of the revolving credit facility remains undrawn.
Holdco Revolving Credit Facility: Holdco Revolving Credit Facility refers to the senior secured revolving credit facility for $35.0 million, by and among Eagle Bulk Holdco LLC (“Holdco”), a wholly-owned subsidiary of the Company, as borrower, the Company and certain wholly-owned vessel-owning subsidiaries of Holdco, as joint and several guarantors, the banks and financial institutions named therein as lenders and Credit Agricole, as lender, facility agent, security trustee and mandated lead arranger with Nordea Bank ABP, New York Branch. The Holdco Revolving Credit Facility was refinanced on October 1, 2021.
New Ultraco Debt Facility: New Ultraco Debt Facility refers to the senior secured credit facility for $208.4 million entered into by Ultraco Shipping LLC, a wholly-owned subsidiary of the Company, as the borrower (the “New Ultraco Debt Facility”), with the Company and certain of its indirectly vessel-owning subsidiaries, as guarantors (the “Guarantors”), the lenders party thereto, the swap banks party thereto, ABN AMRO Capital USA LLC (“ABN AMRO”), Credit Agricole, Skandinaviska Enskilda Banken AB (PUBL) and DNB Markets Inc., as mandated lead arrangers and bookrunners, and Credit Agricole Corporate and Investment Bank, as arranger, security trustee and facility agent. The New Ultraco Debt Facility was refinanced on October 1, 2021.
Norwegian Bond Debt: Norwegian Bond Debt refers to the Senior Secured Bonds issued by Eagle Bulk Shipco LLC, a wholly-owned subsidiary of the Company (“Shipco”), as borrower, certain wholly-owned vessel-owning subsidiaries of Shipco, as guarantors (“Shipco Vessels”), on November 28, 2017 for $200.0 million, pursuant to those certain Bond Terms, dated as of November 22, 2017, by and between Shipco, as issuer, and Nordic Trustee AS, a company existing under the laws of Norway (the “Bond Trustee”). The bonds outstanding under the Norwegian Bond Debt were repaid in full on October 18, 2021 after the expiry of the requisite notice period.
Super Senior Facility: Super Senior Facility refers to the credit facility for $15.0 million, by and among Shipco as borrower, and ABN AMRO, as original lender, mandated lead arranger and agent. During the third quarter of 2021, the Company cancelled the Super Senior Revolving Facility. There were no outstanding amounts under the facility.
Conference Call Information
As previously announced, members of Eagle’s senior management team will host a teleconference and webcast at 8:00 a.m. ET on Friday, March 3, 2023, to discuss the fourth quarter and full year results.
A live webcast of the call will be available on the Investor Relations page of the Company’s website at ir.eagleships.com. To access the call by phone, please register at https://register.vevent.com/register/BI4a067891a1ca404996653fa93931816e and you will be provided with dial-in details. A replay of the webcast will be available on the Investor Relations page of the Company’s website.
About Eagle Bulk Shipping Inc.
The Company is a U.S.-based, fully integrated shipowner-operator, providing global transportation solutions to a diverse group of customers including miners, producers, traders and end users. Headquartered in Stamford, Connecticut, with offices in Singapore and Copenhagen, Eagle focuses exclusively on the versatile midsize drybulk vessel segment and owns one of the largest fleets of Supramax/Ultramax vessels in the world. The Company performs all management services in-house (strategic, commercial, operational, technical, and administrative) and employs an active management approach to fleet trading with the objective of optimizing revenue performance and maximizing earnings on a risk-managed basis. For further information, please visit our website: www.eagleships.com.
Website Information
We intend to use our website, www.eagleships.com, as a means of disclosing material non-public information and for complying with our disclosure obligations under Regulation FD. Such disclosures will be included in our website’s Investor Relations section. Accordingly, investors should monitor the Investor Relations portion of our website, in addition to following our press releases, filings with the SEC, public conference calls, and webcasts. To subscribe to our e-mail alert service, please click the “Investor Alerts” link in the Investor Relations section of our website and submit your email address. The information contained in, or that may be accessed through, our website is not incorporated by reference into or a part of this document or any other report or document we file with or furnish to the SEC, and any references to our website are intended to be inactive textual references only.
Disclaimer: Forward-Looking Statements
Matters discussed in this release may constitute forward-looking statements that may be deemed to be “forward-looking statements” within the meaning of Section 27A of the Securities Act of 1933, as amended, Section 21E of the Securities Exchange Act of 1934, as amended, and the Private Securities Litigation Reform Act of 1995, and are intended to be covered by the safe harbor provided for under these sections. These statements may include words such as “believe,” “estimate,” “project,” “intend,” “expect,” “plan,” “anticipate,” and similar expressions in connection with any discussion of the timing or nature of future operating or financial performance or other events. Forward-looking statements in this release reflect management’s current expectations and observations with respect to future events and financial performance. Where we express an expectation or belief as to future events or results, including future plans with respect to financial performance, the payment of dividends and/or repurchase of shares, such expectation or belief is expressed in good faith and believed to have a reasonable basis. However, our forward-looking statements are subject to risks, uncertainties, and other factors, which could cause actual results to differ materially from future results expressed, projected, or implied by those forward-looking statements.
Where we express an expectation or belief as to future events or results, such expectation or belief is expressed in good faith and believed to have a reasonable basis. However, our forward-looking statements are subject to risks, uncertainties, and other factors, which could cause actual results to differ materially from future results expressed, projected or implied by those forward-looking statements. The principal factors that affect our financial position, results of operations and cash flows include market freight rates, which fluctuate based on various economic and market conditions, periods of charter hire, vessel operating expenses and voyage costs, which are incurred primarily in U.S. dollars, depreciation expenses, which are a function of the purchase price of our vessels and our vessels’ estimated useful lives and scrap value, general and administrative expenses, and financing costs related to our indebtedness. The accuracy of the Company’s assumptions, expectations, beliefs and projections depends on events or conditions that change over time and are thus susceptible to change based on actual experience, new developments and known and unknown risks. The Company gives no assurance that the forward-looking statements will prove to be correct and does not undertake any duty to update them. Our actual results may differ materially from those anticipated in these forward-looking statements as a result of certain factors which could include the following: (i) volatility of freight rates driven by changes in demand for seaborne transportation of drybulk commodities and in supply of drybulk shipping capacity; (ii) changes in drybulk carrier capacity driven by levels of newbuilding orders, scrapping rates or fleet utilization; (iii) changes in rules and regulations applicable to the drybulk industry, including, without limitation, regulations of the International Maritime Organization and the European Union (the “EU”), requirements of the Environmental Protection Agency and other governmental and quasi-governmental agencies; (iv) changes in U.S. and EU economic sanctions and trade embargo laws and regulations as well as equivalent economic sanctions laws of other relevant jurisdictions; (v) actions taken by regulatory authorities including, without limitation, the U.S. Treasury Department’s Office of Foreign Assets Control (“OFAC”); (vi) changes in the typical seasonal variations in drybulk freight rates; (vii) changes in national and international economic and political conditions including, without limitation, the current conflict between Russia and Ukraine, the current economic and political environment in China and the environment in historically high-risk geographic areas such as the South China Sea, the Indian Ocean, the Gulf of Guinea and the Gulf of Aden; (viii) changes in the condition of the Company’s vessels or applicable maintenance or regulatory standards (which may affect, among other things, our anticipated drydocking costs); (ix) the duration and impact of the novel coronavirus (“COVID-19”) pandemic and measures implemented by governments of various countries in response to the COVID-19 pandemic; (xi) volatility of the cost of fuel; (xii) volatility of costs of labor and materials needed to operate our business due to inflation; (xiii) any legal proceedings which we may be involved from time to time; and (xiv) other factors listed from time to time in our filings with the Securities and Exchange Commission (the “SEC”).
We have based these statements on assumptions and analyses formed by applying our experience and perception of historical trends, current conditions, expected future developments and other factors we believe are appropriate in the circumstances. The Company’s future results may be impacted by adverse economic conditions, such as inflation, deflation, or lack of liquidity in the capital markets, that may negatively affect it or parties with whom it does business. Should one or more of the foregoing risks or uncertainties materialize in a way that negatively impacts the Company, or should the Company’s underlying assumptions prove incorrect, the Company’s actual results may vary materially from those anticipated in its forward-looking statements, and its business, financial condition and results of operations could be materially and adversely affected.
Risks and uncertainties are further described in reports filed by Eagle Bulk Shipping Inc. with the SEC.
CONTACT
Frank De Costanzo Chief Financial Officer Eagle Bulk Shipping Inc. Tel. +1 203-276-8100 Email: investor@eagleships.com
HOUSTON, March 02, 2023 (GLOBE NEWSWIRE) — Orion Group Holdings, Inc. (NYSE: ORN) (“Company”), a leading specialty construction company, today announced that Austin J. Shanfelter will transition from Executive Chairman to Chairman of the Board of Directors, effective March 2, 2023.
Mr. Shanfelter has served on Orion Group’s Board of Directors since 2007 and was named Chairman in January 2021. From April to September 2022, he assumed the roles of Interim Chief Executive Officer and Interim Chief Financial Officer until Travis Boone, Chief Executive Officer and Scott Thanisch, Chief Financial Officer were appointed in September 2022. Since then, Mr. Shanfelter served as Executive Chairman to ensure a smooth leadership transition. His transition back to Chairman of the Board marks the completion of this successful transition period.
“Orion has been a trusted provider of mission-critical specialty construction services for nearly thirty years,” said Austin J. Shanfelter, Chairman of the Board. “As we look forward to our next chapter, our Board has complete confidence that Travis Boone and Scott Thanisch are the right leadership team with the right experience to unlock the value of our assets by leveraging our distinctive capabilities and long-term customer relationships. Orion Group Holdings is well positioned to benefit from the greater public attention and funding that is now being focused on our country’s critical infrastructure needs. In my sixteen years as a director of our Company, we have never had a more talented and experienced management team and a more engaged board, who are singularly focused on positioning Orion to create sustainable value for all our stakeholders.”
Travis Boone, Chief Executive Officer of Orion Group Holdings said, “I want to thank Austin for his invaluable leadership as Executive Chair during this transition. Since becoming CEO, I have received the full support of a very dedicated and far-sighted Board and I look forward to their continued guidance as we execute our strategic plan to drive sustainable growth and profitability over time.”
Concurrent with Mr. Shanfelter becoming independent Chairman of the Board, Richard L. Daerr, Jr. stepped down as Lead Independent Director to remain as an independent board member. Orion Group Holding’s Board now consists of eight members, seven of whom are independent.
About Orion Group Holdings, Inc.
Orion Group Holdings, Inc., a leading specialty construction company serving the infrastructure, industrial and building sectors, provides services both on and off the water in the continental United States, Alaska, Canada and the Caribbean Basin through its marine segment and its concrete segment. The Company’s marine segment provides construction and dredging services relating to marine transportation facility construction, marine pipeline construction, marine environmental structures, dredging of waterways, channels and ports, environmental dredging, design, and specialty services. Its concrete segment provides turnkey concrete construction services including place and finish, site prep, layout, forming, and rebar placement for large commercial, structural and other associated business areas. The Company is headquartered in Houston, Texas with regional offices throughout its operating areas. Orion Group Holdings, Inc. – Specialty Construction Company (oriongroupholdingsinc.com)
Investor and Media Relations Contacts: Financial Profiles, Inc. Margaret Boyce 310-622-8247 Jack Drapacz 310-622-8230 orn@finprofiles.com
Mark Reichman, Senior Research Analyst, Natural Resources, Noble Capital Markets, Inc.
Refer to the full report for the price target, fundamental analysis, and rating.
Well-funded drilling program. Exploration and drilling at the company’s 100%-owned Kingsway gold project is targeting the Appleton Fault over a 12-kilometer strike length. With approximately C$17 million in cash and over 66,000 meters of the company’s planned 100,000-meter drill program completed, Labrador Gold has ample financial resources to fund the rest of the drill program. Assays are pending for samples from approximately 3,000 meters of core.
Favorable drill results. Recent drilling results included Hole K-22-213 from Big Vein Southwest that intersected 1.38 grams of gold per tonne over 4.15 meters from 464 meters. Hole K-22-214 from Big Vein intersected 1.19 grams of gold per tonne over 41.8 meters from 397 meters that included 2.32 grams of gold per tonne over 18.6 meters, including 61.15 grams of gold per tonne over 0.3 meters that contained visible gold.
Equity Research is available at no cost to Registered users of Channelchek. Not a Member? Click ‘Join’ to join the Channelchek Community. There is no cost to register, and we never collect credit card information.
This Company Sponsored Research is provided by Noble Capital Markets, Inc., a FINRA and S.E.C. registered broker-dealer (B/D).
*Analyst certification and important disclosures included in the full report. NOTE: investment decisions should not be based upon the content of this research summary. Proper due diligence is required before making any investment decision.
Lee Enterprises, Incorporated provides local news, information, and advertising primarily in midsize markets in the United States. It publishes 49 daily newspapers, as well as offers 300 weekly newspapers and specialty publications in 23 states. The company also provides online advertising and services; and online infrastructure and online publishing services for approximately 1,500 daily and weekly newspapers and shoppers. In addition, it offers commercial printing services. The company has a strategic alliance with Yahoo!, Inc. to provide its classified employment advertising customer base the opportunity to post job listings and other employment products on Yahoo!�s HotJobs national platform. Lee Enterprises, Incorporated was founded in 1890 and is based in Davenport, Iowa.
Michael Kupinski, Director of Research, Noble Capital Markets, Inc.
Jacob Mutchler, Research Associate, Noble Capital Markets, Inc.
Refer to the full report for the price target, fundamental analysis, and rating.
Slow start to the year. The company reported fiscal Q1 revenue of $185 million and adj. EBITDA of $17.6 million, below expectations, illustrated in Figure #1 Q1 Results. The slow start to the fiscal year was the result of a print revenue decline 18% to $120 million. Digital increased a strong 17% to $65 million, and now accounts for a record 35% of total company revenue.
Right-sizing its business. Given a weak print advertising environment, management announced that it implemented additional cost reductions, expected to result in $40 million of savings in FY 23, and $60 million in annualized savings going forward. Additionally, there is approximately $30 million in noncore assets that it will seek to monetize in FY 23.
Equity Research is available at no cost to Registered users of Channelchek. Not a Member? Click ‘Join’ to join the Channelchek Community. There is no cost to register, and we never collect credit card information.
This Company Sponsored Research is provided by Noble Capital Markets, Inc., a FINRA and S.E.C. registered broker-dealer (B/D).
*Analyst certification and important disclosures included in the full report. NOTE: investment decisions should not be based upon the content of this research summary. Proper due diligence is required before making any investment decision.
Endeavour Silver is a mid-tier precious metals mining company that operates two high-grade, underground, silver-gold mines in Mexico. Endeavour is currently advancing the Terronera mine project towards a development decision, pending financing and final permits and exploring its portfolio of exploration and development projects in Mexico, Chile and the United States to facilitate its goal to become a premier senior silver producer. Our philosophy of corporate social integrity creates value for all stakeholders.
Mark Reichman, Senior Research Analyst, Natural Resources, Noble Capital Markets, Inc.
Refer to the full report for the price target, fundamental analysis, and rating.
Fourth quarter and full year 2022 results. Endeavour reported fourth quarter and full year 2022 adjusted earnings per share of $0.04 and $0.04 per share, respectively, compared to fourth quarter and full year 2021 adjusted EPS of $(0.00) and $(0.05). We had forecast fourth quarter and full year EPS of $0.07 per share and $0.10, respectively. Fourth quarter and full year adjusted EBITDA were $23.4 million and $56.5 million, respectively. While revenue was largely in line with our estimates, costs were higher. At year-end, Endeavour held 530,250 ounces of silver and 1,707 ounces of gold in bullion inventory.
Updating estimates. We now forecast 2023 EBITDA and EPS of $59.0 million and $0.09 compared to our previous estimates of $59.2 million and $0.11, respectively. Our estimates are based on silver and gold production of 6.1 million ounces of silver and 38,402 ounces of silver.
Equity Research is available at no cost to Registered users of Channelchek. Not a Member? Click ‘Join’ to join the Channelchek Community. There is no cost to register, and we never collect credit card information.
This Research is provided by Noble Capital Markets, Inc., a FINRA and S.E.C. registered broker-dealer (B/D).
*Analyst certification and important disclosures included in the full report. NOTE: investment decisions should not be based upon the content of this research summary. Proper due diligence is required before making any investment decision.