Release – PsyBio Therapeutics Strengthens IP Portfolio through Filing of Data to Support Previously Submitted Provisional Biosynthetic Production Patent Application


PsyBio Therapeutics Strengthens IP Portfolio through Filing of Data to Support Previously Submitted Provisional Biosynthetic Production Patent Application

Research, News, and Market Data on PsyBio

Biosynthetic Production covers
Methylated Tryptamine Derivatives including DMT and 5-MeO-DMT

OXFORD, Ohio and DENVER, Aug. 11, 2022 /CNW/ – PsyBio Therapeutics Corp. (TSXV: PSYB), (OTCQB: PSYBF) (“PsyBio” or the “Company“), an intellectual property driven biotechnology company focused upon discovery and development of novel, psycho-targeted therapeutics to potentially improve mental and neurological health, today is announcing the filing of data to support the conversion of a previously submitted provisional patent covering the biosynthetic production of methylated tryptamine derivatives including 
N,N-dimethyltryptamine (“DMT“) and 5-methoxy-N,N-dimethyltryptamine (”
5-MeO-DMT“) as well as other related products.

“We are proud of the strength of our intellectual property portfolio, safeguarding our advancement of biosynthetic production of psycho-targeted molecules. This most recent filing of data extends our coverage to include DMT and 5-MeO-DMT,” stated Michael Spigarelli, MD, PhD, MBA, PsyBio’s Chief Medical Officer. “While these methylated tryptamine derivatives are well known, this filing covers numerous novel compounds that we expect will allow us to proceed with clinical development and build on our work to potentially improve mental and neurological healthcare for patients.”

The patent information submitted includes data concerning host strains, production methodology, and processes of production that support and allow PsyBio’s novel methodology to be successful.

“PsyBio continues to demonstrate its leadership in the biosynthetic development field through our continued commitment to strengthen our intellectual property portfolio, while also promoting scientific and methodologic advancements in the field,” stated Evan Levine, PsyBio’s Chief Executive Officer. “Intellectual property protection is paramount for our Company and our shareholders.”

About PsyBio Therapeutics Corp.

PsyBio Therapeutics is an intellectual property driven biotechnology company developing new, bespoke, psycho-targeted therapeutics to potentially improve mental and neurological health. The team has extensive experience in drug discovery based on synthetic biology and metabolic engineering as well as clinical and regulatory expertise progressing drugs through human studies and regulatory protocols. Research and development is currently ongoing for naturally occurring psychoactive tryptamines originally discovered in different varieties of hallucinogenic mushrooms, other tryptamines and phenethylamines and combinations thereof.  The Company utilizes a bio-medicinal chemistry approach to therapeutic development, in which psychoactive compounds can be utilized as a template upon which to develop precursors and analogs, both naturally and non-naturally occurring.

Cautionary Note Regarding
Forward-Looking Statements

This press release contains statements that constitute “forward-looking information” (”
forward-looking information“) within the meaning of applicable Canadian securities legislation. All statements, other than statements of historical fact, are forward-looking information and are based on expectations, estimates and projections as at the date of this news release. Any statement that discusses predictions, expectations, beliefs, plans, projections, objectives, assumptions, future events or performance (often but not always using phrases such as “expects”, or “does not expect”, “is expected”, “anticipates” or “does not anticipate”, “plans”, “budget”, “scheduled”, “forecasts”, “estimates”, “believes” or “intends” or variations of such words and phrases or stating that certain actions, events or results “may” or “could”, “would”, “might” or “will” be taken to occur or be achieved) are not statements of historical fact and may be forward-looking information. Forward looking-statements in this press release include statements regarding: the ability of PsyBio to proceed with clinical development and to build on efforts to potentially improve mental and neurological healthcare for patients; the ability of PsyBio to develop novel formulations to potentially treat neurologic and psychologic conditions and other disorders; the success of PsyBio’s novel methodology; the ability of PsyBio to build and protect its intellectual property portfolio of novel drug candidates; the ability of PsyBio to launch clinical trials; the ability to achieve cost competitive synthesis with reduced environmental impact over current production methods; and the ability of PsyBio to move target candidates into scaled commercial manufacturing and regulatory application.

In disclosing the forward-looking information contained in this press release, the Company has made certain assumptions, including that: the filing will extend intellectual property protection coverage to include DMT and 5-MeO-DMT; the patent information submitted will support and allow PsyBio’s novel methodology to be successful; PsyBio will be successful in protecting its intellectual property; PsyBio will be successful in discovering new valuable target molecules; PsyBio will file one or more investigational new drug applications with the United States Food and Drug Administration (“FDA“); PsyBio will be successful in obtaining all necessary approvals for clinical trials; PsyBio will be successful in launching clinical trials; the results of preclinical safety and efficacy testing will be favourable; PsyBio’s technology will be safe and effective; a confirmed signal will be identified in PsyBio’s selected indications; and that drug development involves long lead times, is very expensive and involves many variables of uncertainty. Although the Company believes that the expectations reflected in such forward-looking information are reasonable, it can give no assurance that the expectations of any forward-looking information will prove to be correct. Known and unknown risks, uncertainties, and other factors which may cause the actual results and future events to differ materially from those expressed or implied by such forward-looking information. Such factors include, but are not limited to: compliance with extensive government regulations; domestic and foreign laws and regulations adversely affecting PsyBio’s business and results of operations; decreases in the prevailing process for psilocybin and nutraceutical products in the markets in which PsyBio operates; the impact of COVID-19; and general business, economic, competitive, political and social uncertainties. Accordingly, readers should not place undue reliance on the forward-looking information contained in this press release. Except as required by law, the Company disclaims any intention and assumes no obligation to update or revise any forward-looking information to reflect actual results, whether as a result of new information, future events, changes in assumptions, changes in factors affecting such forward-looking information or otherwise.

PsyBio makes no medical, treatment or health benefit claims about PsyBio’s proposed products. The FDA or other similar regulatory authorities have not evaluated claims regarding psilocybin and other next generation psychoactive compounds. The efficacy of such products has not been confirmed by FDA-approved research. There is no assurance that the use of psilocybin and other psychoactive compounds can diagnose, treat, cure, or prevent any disease or condition. Vigorous scientific research and clinical trials are needed. PsyBio has not conducted clinical trials for the use of its intellectual property. Any references to quality, consistency, efficacy and safety of potential products do not imply that PsyBio verified such in clinical trials or that PsyBio will complete such trials. If PsyBio cannot obtain the approvals or research necessary to commercialize its business, it may have a material adverse effect on the PsyBio’s performance and operations.

The TSX Venture Exchange (the
TSXV“) has neither approved nor disapproved the contents of
this news release. Neither the TSXV nor its Regulation Services Provider (as
that term is defined in the policies of the TSXV) accepts responsibility for
the adequacy or accuracy of this release.

SOURCE PsyBio Therapeutics Corp.

View original content to download multimedia: 
http://www.newswire.ca/en/releases/archive/August2022/11/c9503.html


The More Impactful Fed Moves May Not Make Headline News


Image Credit: Stuart Richards (Flickr)


Is Quantitative Tightening Impacting the Economy on the QT?

The Fed has begun to reduce the trillions it has added to its balance
sheet
. With each dollar it added to the economy over the past two years, there was a new dollar available to provide capital for growth and investment. Or a new dollar to help hold borrowing costs down. Quantitative
tightening
(QT) is out of the spotlight relative to overnight bank lending rates. Yet, QT could have a much greater economic impact on all markets, from real estate to stocks, and more directly fixed income.

There is less understanding of QT. The Federal Reserve’s effort to shrink its balance sheet after buying trillions in bonds is somewhat complicated and less visible. But, although QT is on the quieter side of what is shaping tomorrow’s economy, investors need to know how shrinking the balance sheet, the other tightening, impacts investments.

The Fed stopped its bond purchases in May. That is to say, they stopped buying bonds that injected money into the system. This is referred to as quantitative easing (QE).

In June, after a period of tapering its purchases, the central bank began QT> Then it announced it would partially unwind roughly $4.5 trillion that had previously been purchased. The Fed officially said that it would start by letting up to $30 billion in US treasuries and $17.5 billion in mortgage-backed securities (MBS) mature out of its holdings (balance sheet). During the previous months, it would have reinvested the maturing amount and even added to the purchases.  The announcement was, beginning in September, it’s shrinking the balance sheet could increase to $60 billion maturing bonds not rolled in treasuries and 35 billion not reinvested in MBS securities. Fed Chairman Jerome Powell shared a plan lasting 2½ years, which implies the Fed’s $9 trillion balance sheet could shrink by as much as $2.5 trillion. Roughly half of what was added to support the economy during the pandemic.


Lack of Awareness

The financial news likes to keep it simple. And quantitative tightening isn’t simple, so its impact isn’t reported to the extent that an overnight increase, which is easier to understand, is presented. With QT, there is no prior hype asking “what is the Fed going to do?” and there is little certainty to what they have done. It just happens, no fanfare, no commentary.

Historically, this kind of tightening has been attempted only once before, and it was derailed. The transparent Fed is ridiculed and criticized when it removes economic stimulus. So there may not be a strong overall belief that the Fed will actually remove the trillions of extra money now floating around and creating economic opportunity by inflating asset prices.   Also, overnight rate increases are much easier for economists to model and news for mass public consumption to report on.

So, the news of QT is underreported and ignored. What is being reported is a strong doubt that the Fed is following through on its balance-sheet tightening plan, particularly with MBS. For those that have looked at the Federal Reserve’s balance sheet, the doubt is not without cause.

Barron’s spoke with a senior trader on the Fed’s open markets desk. This is what the well-respected investment publication was told. The Fed is conducting QT as it has said it would. The trader said people are confused because it looks like the Fed’s MBS holdings aren’t decreasing and even may be increasing.

The trader told Barrons that the saw-toothed pattern in the Fed’s MBS holdings is the result of accounting issues. First, there is a gap between when MBS purchases settle and when holders of MBS receive payments. Second, the Fed has a three-month window for settling MBS purchases. The Fed is the largest single investor in the MBS market, the Fed has the option of delaying settlements if it thinks that will create a better functioning market.

In effect, this means MBS purchased by the Fed, as it does when it reinvests pay downs, could just be showing up. QE ended, but if there are pay downs in excess of the Feds goal of runoff, the excess is reinvested. The settlement dates differ and cause the appearance of a balance sheet that may have grown. This isn’t the case, and investors need to know that longer-term interest rates are being tightened.

The Fed senior trader warned something is apt to break, not unlike what happened the last time the Fed tried QT, and chaos in the repo market prompted an early end to the return to “normalcy.” But he was more optimistic as he said the Treasury may be more supportive in smoothing the process of reducing liquidity while not disrupting markets.


Take Away

If quantitative easing (QE) mattered, then quantitative tightening should too. It isn’t reported on as prominently as direct interest rate hikes, but the impact is the direct inverse to what allowed so much economic growth. So, the savvy investor will pay attention, which may give them an edge. For the Fed to bring inflation back to 2%, the Federal Reserve would need to shrink its balance sheet by the almost $4 to $5 trillion it increased it a short time ago. This could increase longer-term interest rates by far more than the announced increases in short-term rates.

Paul Hoffman

Managing Editor, Channelchek

Suggested Content


Powell’s Economic Soft Landing Requires More Room to Change his Mind


Bond Market Understanding is Again Critical for Stock Investors


What is the Fed’s Balance Sheet


What is Quantitative Tightening


Sources

https://www.federalreserve.gov/monetarypolicy/bst_recenttrends.htm

https://www.barrons.com/articles/intel-chip-stocks-to-buy-now-51660333062

https://en.wikipedia.org/wiki/Quantitative_tightening

Stay up to date. Follow us:


Release – ACCO Brands Corporation Announces Appointment of Joe Burton to Board of Directors


ACCO Brands Corporation Announces Appointment of Joe Burton to Board of Directors

Research, News, and Market Data on ACCO Brands

08/15/2022

LAKE ZURICH, Ill.–(BUSINESS WIRE)– ACCO Brands Corporation (NYSE: ACCO) today announced that Joe Burton has been appointed to its Board of Directors.

In his current role as Chief Executive Officer for Telesign Corp., Mr. Burton leads an organization that services global enterprises by connecting, protecting and defending their digital identities. Prior to his current role, he served as President, Chief Executive Officer, and a member of the Board of Poly (formerly Plantronics), a company that provides premium audio, video and conferencing products for businesses and consumers. Previously, Mr. Burton held various executive management, engineering leadership, strategy and architecture-level positions at Polycom, Cisco Systems, Inc. and Active Voice Corporation.

Boris Elisman, Chairman and Chief Executive Officer, ACCO Brands, commented, “We are excited to have Joe join our Board of Directors. Technology is becoming a more significant part of our product portfolio. Joe’s extensive expertise in technology and product development, as well as success driving digital transformation, growth acceleration and corporate/go-to-market strategies, will help guide us in our transformation journey to transition to a global consumer and brand-driven products company.”

About
ACCO Brands

ACCO Brands, the Home of Great Brands Built by Great People, designs, manufactures and markets consumer and end-user products that help people work, learn, play and thrive. Our widely recognized brands include AT-A-GLANCE®, Five Star®, Kensington®, Leitz®, Mead®, PowerA®, Swingline®, Tilibra® and many others. More information about ACCO Brands Corporation (NYSE: ACCO) can be found at www.accobrands.com.

Christopher McGinnis
Investor Relations
(847) 796-4320

Julie McEwan
Media Relations
(937) 974-8162

Source: ACCO Brands Corporation


Release – Lineage to Present at H.C. Wainwright & Co. 2nd Annual Virtual Ophthalmology Conference


Lineage to Present at H.C. Wainwright & Co. 2nd Annual Virtual Ophthalmology Conference

Research, News, and Market Data on Lineage Cell Therapeutics

CARLSBAD, Calif.–(
)–Lineage Cell
Therapeutics, Inc.
 (NYSE American and TASE: LCTX), a clinical-stage biotechnology company developing allogeneic cell therapies for unmet medical needs, announced today Brian M. Culley, Lineage’s Chief Executive Officer, will present at the H.C. Wainwright
2nd Annual Ophthalmology Virtual Conference
, in a fireside chat hosted by Joseph Pantginis, Ph.D., Director of Research; Managing Director, Equity Research, H. C. Wainwright & Co. LLC. The fireside chat will be available to investors on demand, starting on August 17th, 2022 at 7am ET.

Interested parties can register to view on-demand replay on the Events and
Presentations
 section of Lineage’s website. Additional videos are available on the Media page of the Lineage website.

About Lineage Cell Therapeutics, Inc.

Lineage Cell Therapeutics is a clinical-stage biotechnology company developing novel cell therapies for unmet medical needs. Lineage’s programs are based on its robust proprietary cell-based therapy platform and associated in-house development and manufacturing capabilities. With this platform Lineage develops and manufactures specialized, terminally differentiated human cells from its pluripotent and progenitor cell starting materials. These differentiated cells are developed to either replace or support cells that are dysfunctional or absent due to degenerative disease or traumatic injury or administered as a means of helping the body mount an effective immune response to cancer. Lineage’s clinical programs are in markets with billion dollar opportunities and include five allogeneic (“off-the-shelf”) product candidates: (i) OpRegen, a retinal pigment epithelial cell therapy in development for the treatment of geographic atrophy secondary to age-related macular degeneration, is being developed under a worldwide collaboration with Roche and Genentech, a member of the Roche Group; (ii) OPC1, an oligodendrocyte progenitor cell therapy in Phase 1/2a development for the treatment of acute spinal cord injuries; (iii) VAC2, a dendritic cell therapy produced from Lineage’s VAC technology platform for immuno-oncology and infectious disease, currently in Phase 1 clinical development for the treatment of non-small cell lung cancer; (iv) ANP1, an auditory neuronal progenitor cell therapy for the potential treatment of auditory neuropathy; and (v) PNC1, a photoreceptor neural cell therapy for the treatment of vision loss due to photoreceptor dysfunction or damage. For more information, please visit www.lineagecell.com or follow the company on Twitter @LineageCell.

Contacts

Lineage Cell Therapeutics, Inc. IR
Ioana C. Hone
(
ir@lineagecell.com)
(442) 287-8963

Russo Partners – Media Relations
Nic Johnson or David Schull
Nic.johnson@russopartnersllc.com
David.schull@russopartnersllc.com
(212) 845-4242


Release – Ayala Pharmaceuticals Reports Second Quarter 2022 Financial Results and Provides Corporate Update


Ayala Pharmaceuticals Reports Second Quarter 2022 Financial Results and Provides Corporate Update

Research, News, and Market Data on Ayala Pharmaceuticals

August 15, 2022

Interim data from Part A of the RINGSIDE study
demonstrated substantial initial anti-tumor activity for AL102 as a single
agent and supports continued development

More advanced and comprehensive data set from RINGSIDE to be
presented at ESMO

REHOVOT, Israel and WILMINGTON, Del., Aug. 15, 2022 (GLOBE NEWSWIRE) — Ayala Pharmaceuticals, Inc. (Nasdaq: AYLA), a clinical-stage oncology company focused on developing and commercializing small molecule therapeutics for patients suffering from rare and aggressive cancers, primarily in genetically defined patient populations, today announced second-quarter 2022 financial results and provided a corporate update.

“We continue to make considerable progress across our pipeline, and we were particularly excited to announce interim results from the ongoing Phase 2/3 RINGSIDE trial evaluating AL102 in desmoid tumors. Although early, the results showed substantial initial anti-tumor activity and a favorable side effect profile,” said Roni Mamluk, Ph.D., Chief Executive Officer of Ayala. “Based on these positive results, our efforts are focused on finalizing the Part A of the study shortly followed by immediate initiation of Part B. For AL101, we were pleased with the latest interim results from the ACCURACY trial presented at ASCO, which demonstrated anti-tumor monotherapy activity and evidence of improved progression-free survival (PFS) in patients with recurrent/metastatic ACC.”

Second-quarter 2022
and Recent Business Highlights

  • In July, announced positive interim data
    from Part A of the Phase 2/3 RINGSIDE study of AL102 in desmoid
    tumors: 
    Data showed tumor shrinkage in substantially all patients who were evaluable at 16 weeks. AL102 was well tolerated at all three dosing regimens with no dose-limiting toxicities and no Grade 4/5 adverse events. The results from Part A will be used to determine the dose of AL102 to be evaluated in Part B of RINGSIDE, the randomized portion of the study, which Ayala is on track to initiate in 3Q 2022. More advanced and comprehensive data from RINGSIDE is expected to be presented at ESMO.
  • Data on AL101 in adenoid cystic carcinoma
    (ACC) presented at ASCO 2022 Annual Meeting: 
    In a poster at ASCO, the company provided an update from the 4mg and 6 mg AL101 cohorts in the ACCURACY study of AL101, a selective gamma-secretase inhibitor, in subjects with recurrent/metastatic (R/M) adenoid cystic carcinoma (ACC) harboring Notch activating mutations. An overall disease control rate of 66.7% was observed. The median PFS in each of the 4mg and 6mg dose cohorts was 3.7 months and 6.7 months among the patients who had a partial response.

Upcoming Milestones

  • More
    advanced data from the RINGSIDE trial in desmoid tumors:
     Ayala expects to present a more comprehensive data set from Part A of the RINGSIDE trial of AL102 at ESMO.
  • Initiation
    of Part B of the RINGSIDE trial
    : Part B will be a double-blind placebo-controlled study enrolling up to 156 patients with progressive disease, randomized between AL102 or placebo. The primary endpoint will be PFS with secondary endpoints including objective response rates, duration of response, and patient-reported quality of life measures.
  • Initiate
    Phase 2 clinical trial evaluating AL102 in T-cell acute lymphoblastic
    leukemia (T-ALL): 
    Ayala plans to begin an investigator-initiated Phase 2 clinical trial evaluating AL102 in R/R T-ALL around year-end.

Second-Quarter 2022 Financial Results

Cash Position: Cash and cash equivalents were $20.1 million as of June 30, 2022.

Collaboration Revenue: Collaboration revenue was $38 thousand for the second quarter of 2022, as compared to $761 thousand for the corresponding quarter in 2021.

R&D Expenses: Research and development expenses were $5.6 million for the second quarter of 2022, compared to $8.1 million for the corresponding quarter in 2021. The decrease is mainly due to the winding down of the ACCURACY study.

G&A Expenses: General and administrative expenses were $2.3 million for the second quarter of 2022, compared to $2.5 million for the second quarter of 2021.

Net Loss: Net loss was $8.2 million for the second quarter of 2022, resulting in basic and diluted net loss per share of $0.54. This compares with a net loss of $10.8 million for the second quarter of 2021 or basic and diluted net loss per share of $0.75 for that quarter.

For further details on the company’s financial results, refer to form Quarterly Report on Form 10-Q for the three months ended June 30, 2022, filed with the SEC on August 15, 2022.

About Ayala Pharmaceuticals

Ayala Pharmaceuticals, Inc. is a clinical-stage oncology company focused on developing and commercializing small molecule therapeutics for patients suffering from rare tumors and aggressive cancers. Ayala’s approach is focused on predicating, identifying and addressing tumorigenic drivers of cancer through a combination of its bioinformatics platform and next-generation sequencing to deliver targeted therapies to underserved patient populations. The company has two product candidates under development, AL101 and AL102, targeting the aberrant activation of the Notch pathway with gamma secretase inhibitors to treat a variety of tumors including desmoid tumors, adenoid cystic carcinoma and T-cell acute lymphoblastic leukemia (T-ALL). AL101, has received Fast Track Designation and Orphan Drug Designation from the U.S. FDA and is currently in a Phase 2 clinical trial for patients with ACC (ACCURACY) bearing Notch activating mutations. AL102 is currently in a Pivotal Phase 2/3 clinical trials for patients with desmoid tumors (RINGSIDE). For more information, visit www.ayalapharma.com.

Contacts:

Investors:
Joyce Allaire
LifeSci Advisors LLC
+1-617-435-6602

jallaire@lifesciadvisors.com 

Ayala Pharmaceuticals:
+1-857-444-0553

info@ayalapharma.com 

Forward-Looking Statements

This press release contains forward-looking statements within the meaning of the Private Securities Litigation Reform Act of 1995. All statements contained in this press release that do not relate to matters of historical fact should be considered forward-looking statements, including statements relating to our development of AL101 and AL102, the promise and potential impact of our preclinical or clinical trial data, the timing of and plans to initiate additional clinical trials of AL101 and AL102, the timing and results of any clinical trials or readouts, our participation at scientific or medical conferences, the sufficiency of cash to fund operations, and the anticipated impact of COVID-19, on our business. These forward-looking statements are based on management’s current expectations. The words ”may,” “will,” “should,” “expect,” “plan,” “anticipate,” “could,” “intend,” “target,” “project,” “estimate,” “believe,” “predict,” “potential” or “continue” or the negative of these terms or other similar expressions are intended to identify forward-looking statements, although not all forward-looking statements contain these identifying words.

These statements are neither promises nor guarantees, but involve known and unknown risks, uncertainties and other important factors that may cause our actual results, performance or achievements to be materially different from any future results, performance or achievements expressed or implied by the forward-looking statements, including, but not limited to, the following: we have incurred significant losses since inception and anticipate that we will continue to incur losses for the foreseeable future. We are not currently profitable, and we may never achieve or sustain profitability; we will require additional capital to fund our operations, and if we fail to obtain necessary financing, we may not be able to complete the development and commercialization of AL101 and AL102; we have identified conditions and events that raise substantial doubt about our ability to continue as a going concern; we have a limited operating history and no history of commercializing pharmaceutical products, which may make it difficult to evaluate the prospects for our future viability; we are heavily dependent on the success of AL101 and AL102, our most advanced product candidates, which are still under clinical development, and if either AL101 or AL102 does not receive regulatory approval or is not successfully commercialized, our business may be harmed; due to our limited resources and access to capital, we must prioritize development of certain programs and product candidates; these decisions may prove to be wrong and may adversely affect our business; the outbreak of COVID-19, may adversely affect our business, including our clinical trials; our ability to use our net operating loss carry forwards to offset future taxable income may be subject to certain limitations; our product candidates are designed for patients with genetically defined cancers, which is a rapidly evolving area of science, and the approach we are taking to discover and develop product candidates is novel and may never lead to marketable products; we were not involved in the early development of our lead product candidates; therefore, we are dependent on third parties having accurately generated, collected and interpreted data from certain preclinical studies and clinical trials for our product candidates; enrollment and retention of patients in clinical trials is an expensive and time-consuming process and could be made more difficult or rendered impossible by multiple factors outside our control; if we do not achieve our projected development and commercialization goals in the timeframes we announce and expect, the commercialization of our product candidates may be delayed and our business will be harmed; our product candidates may cause serious adverse events or undesirable side effects, which may delay or prevent marketing approval, or, if approved, require them to be taken off the market, require them to include safety warnings or otherwise limit their sales; the market opportunities for AL101 and AL102, if approved, may be smaller than we anticipate; we may not be successful in developing, or collaborating with others to develop, diagnostic tests to identify patients with Notch-activating mutations; we have never obtained marketing approval for a product candidate and we may be unable to obtain, or may be delayed in obtaining, marketing approval for any of our product candidates; even if we obtain FDA approval for our product candidates in the United States, we may never obtain approval for or commercialize them in any other jurisdiction, which would limit our ability to realize their full market potential; we have been granted Orphan Drug Designation for AL101 for the treatment of ACC and may seek Orphan Drug Designation for other indications or product candidates, and we may be unable to maintain the benefits associated with Orphan Drug Designation, including the potential for market exclusivity, and may not receive Orphan Drug Designation for other indications or for our other product candidates; although we have received Fast Track designation for AL101, and may seek Fast Track designation for our other product candidates, such designations may not actually lead to a faster development timeline, regulatory review or approval process; we face significant competition from other biotechnology and pharmaceutical companies and our operating results will suffer if we fail to compete effectively; we are dependent on a small number of suppliers for some of the materials used to manufacture our product candidates, and on one company for the manufacture of the active pharmaceutical ingredient for each of our product candidates; any future collaborations will be, important to our business. If we are unable to maintain our existing collaboration or enter into new collaborations, or if these collaborations are not successful, our business could be adversely affected; enacted and future healthcare legislation may increase the difficulty and cost for us to obtain marketing approval of and commercialize our product candidates, if approved, and may affect the prices we may set; if we are unable to obtain, maintain, protect and enforce patent and other intellectual property protection for our technology and products or if the scope of the patent or other intellectual property protection obtained is not sufficiently broad, our competitors could develop and commercialize products and technology similar or identical to ours, and we may not be able to compete effectively in our markets; we may engage in acquisitions or in-licensing transactions that could disrupt our business, cause dilution to our stockholders or reduce our financial resources; and risks related to our operations in Israel could materially adversely impact our business, financial condition and results of operations.

These and other important factors discussed under the caption “Risk Factors” in our Quarterly Report on Form 10-Q for the three months ended June 30, 2022 filed with the U.S. Securities and Exchange Commission (SEC) on August 15, 2022 and our other filings with the SEC, could cause actual results to differ materially from those indicated by the forward-looking statements made in this press release. Any such forward-looking statements represent management’s estimates as of the date of this press release. New risk factors and uncertainties may emerge from time to time, and it is not possible to predict all risk factors and uncertainties. While we may elect to update such forward-looking statements at some point in the future, except as required by law, we disclaim any obligation to do so, even if subsequent events cause our views to change. Although we believe the expectations reflected in such forward-looking statements are reasonable, we can give no assurance that such expectations will prove to be correct. These forward-looking statements should not be relied upon as representing our views as of any date subsequent to the date of this press release.


AYALA PHARMACEUTICALS, INC.
CONDENSED CONSOLIDATED BALANCE SHEETS
(In thousands, except share and per share amounts)


June 30,


December 31,


2022


2021


(Unaudited)


CURRENT ASSETS:


Cash and Cash Equivalents


$

20,059


$

36,982


Short-term Restricted Bank Deposits


111


122


Trade Receivables


262


Prepaid Expenses and other Current Assets


2,322


2,636


Total Current Assets


22,754


39,740


LONG-TERM ASSETS:


Other Assets


$

231


$

267


Property and Equipment, Net


1,039


1,120


Total Long-Term Assets


1,270


1,387


Total Assets


$

24,024


$

41,127


LIABILITIES
AND STOCKHOLDERS’ EQUITY:


CURRENT LIABILITIES:


Trade Payables


$

3,254


$

3,214


Other Accounts Payables


2,993


3,258


Total Current Liabilities


6,247


6,472


LONG TERM LIABILITIES:


Long-term Rent Liability


414


497


Total Long-Term Liabilities


$

414


$

497


STOCKHOLDERS’
STOCKHOLDERS’ EQUITY:


Common Stock of $0.01 par value per share; 200,000,000 shares authorized at 


December 31, 2021 and June 30, 2022; 14,503,743 and 14,080,383 shares issued
at June 30, 2022 and December 31, 2021, respectively; 13,984,662 and
13,956,035 shares outstanding at June 30, 2022 and December 31, 2021,
respectively


$

139


$

139


Additional Paid-in Capital


146,602


145,160


Accumulated Deficit


(129,378

)


(111,141

)

Total Stockholders’ Equity


17,363


34,158


Total Liabilities and Stockholders’ Equity


$

24,024


$

41,127


AYALA
PHARMACEUTICALS, INC.

CONDENSED CONSOLIDATED STATEMENTS OF
OPERATIONS

(Unaudited)
(In thousands, except share & per share
amounts)


For
the Three Months Ended

June 30,


For
the Six Months Ended

June 30,


2022


2021


2022


2021


Revenues from licensing agreement and others


$

38


$

761


$

496


$

1,735


Cost of services


(38

)


(761

)


(406

)


(1,735

)

Gross profit


90


Operating expenses:


Research and development


5,580


8,121


13,083


15,046


General and administrative


2,260


2,536


4,701


4,839


Operating loss


(7,840

)


(10,657

)


(17,694

)


(19,885

)

Financial Income (Loss), net


(156

)


(22

)


(140

)


(114

)

Loss before income tax


(7,996

)


(10,679

)


(17,834

)


(19,999

)

Taxes on income


(214

)


(162

)


(403

)


(410

)

Net loss


(8,210

)


(10,841

)


(18,237

)


(20,409

)

Net Loss per share attributable to common stockholders, basic and diluted


$

(0.54

)


$

(0.75

)


$

(1.19

)


$

(1.46

)

Weighted average common shares outstanding, basic and diluted


15,312,766


14,417,423


15,306,823


13,954,676


Baudax Bio (BXRX) – Baudax Bio reports 2Q 2022; Headwinds Persist

Friday, August 12, 2022

Baudax Bio (BXRX)
Baudax Bio reports 2Q 2022; Headwinds Persist

Baudax Bio is a pharmaceutical company focused on innovative products for acute care settings. ANJESO is the first and only 24-hour, intravenous (IV) COX-2 preferential non-steroidal anti-inflammatory (NSAID) for the management of moderate to severe pain. In addition to ANJESO, Baudax Bio has a pipeline of other innovative pharmaceutical assets including two novel neuromuscular blocking agents (NMBs) and a proprietary chemical reversal agent specific to these NMBs. For more information, please visit www.baudaxbio.com.

Gregory Aurand, Senior Research Analyst, Healthcare Services & Medical Devices, Noble Capital Markets, Inc.

Refer to the full report for the price target, fundamental analysis, and rating.

Baudax Bio, Inc. reported 2Q 2022 results yesterday.  While there was a revenue shortfall ($.3 million vs $.77 million expected), overall operating expenses of $7.8 million were below our estimate of $10.4 million due to lower severance costs primarily accrued in 1Q, and lower COGS and SG&A in 2Q, offset a bit by higher contingent consideration to Alkermes and a slight bump up in R&D from trial initiations. GAAP loss per share in 2Q was $(1.05) vs our expected $(1.27).

Feeling the impact of Covid.  Revenues came in light as Covid-related problems, including staffing shortages, continue to restrict usage at hospitals and ASCs, although 2Q hospital usage increased 12% as compared to 1Q 2022 and 2Q revenues increased 49% compared to the year ago period. Vials sold increased 67%. That said, in certain cases, procedure volumes are running as much as 50% below normal periods and are expected to not fully resolve until next year, at the earliest. An expected ramp in ANJESO is expected to be muted well into 2023….

This Company Sponsored Research is provided by Noble Capital Markets, Inc., a FINRA and S.E.C. registered broker-dealer (B/D).

*Analyst certification and important disclosures included in the full report. NOTE: investment decisions should not be based upon the content of this research summary. Proper due diligence is required before making any investment decision. 

Release – Ocugen CEO to Present at H.C. Wainwright 2nd Annual Ophthalmology Virtual Conference


Ocugen CEO to Present at H.C. Wainwright 2nd Annual Ophthalmology Virtual Conference

Research, News, and Market Data on Ocugen

August 12, 2022

MALVERN, Pa., Aug. 12, 2022 (GLOBE NEWSWIRE) — Ocugen, Inc. (“Ocugen” or the “Company”) (NASDAQ: OCGN), a biotechnology company focused on discovering, developing, and commercializing novel gene therapies, biologicals, and vaccines, announced that Dr. Shankar Musunuri, Chairman, Chief Executive Officer and Co-Founder of Ocugen, will deliver a virtual presentation at the 
H.C. Wainwright 2nd Annual Ophthalmology Virtual
Conference
 on August 17.

A video webcast of the presentation will be available on demand beginning at 7:00 a.m. ET on August 17, 2022 for those registered for the event and will be available on the events page of the Ocugen 
investor site. The webcast replay will be archived for 90 days following the event.

About Ocugen, Inc.
Ocugen, Inc. is a biotechnology company focused on discovering, developing, and commercializing novel gene and cell therapies and vaccines that improve health and offer hope for patients across the globe. We are making an impact on patient’s lives through courageous innovation—forging new scientific paths that harness our unique intellectual and human capital. Our breakthrough modifier gene therapy platform has the potential to treat multiple retinal diseases with a single product, and we are advancing research in infectious diseases to support public health and orthopedic diseases to address unmet medical needs. Discover more at www.ocugen.com and follow us on Twitter and LinkedIn.

Cautionary Note on Forward-Looking Statements
This press release contains forward-looking statements within the meaning of
The Private Securities Litigation Reform Act of 1995, which are subject to
risks and uncertainties. We may, in some cases, use terms such as “predicts,”
“believes,” “potential,” “proposed,” “continue,” “estimates,” “anticipates,”
“expects,” “plans,” “intends,” “may,” “could,” “might,” “will,” “should,” or
other words that convey uncertainty of future events or outcomes to identify
these forward-looking statements. Such statements are subject to numerous
important factors, risks, and uncertainties that may cause actual events or
results to differ materially from our current expectations. These and other
risks and uncertainties are more fully described in our periodic filings with
the Securities and Exchange Commission (SEC), including the risk factors
described in the section entitled “Risk Factors” in the quarterly and annual
reports that we file with the SEC. Any forward-looking statements that we make
in this press release speak only as of the date of this press release. Except
as required by law, we assume no obligation to update forward-looking
statements contained in this press release whether as a result of new
information, future events, or otherwise, after the date of this press release.

Contact:
Tiffany Hamilton
Head of Communications
IR@ocugen.com


Social Security Recipients Expect to Receive Tens of Billions More in 2023


Image Credit: Chris Bowman (Flickr)


Social Security and Pension Cost of Living Increases Next Year Will be Largest Since 1981

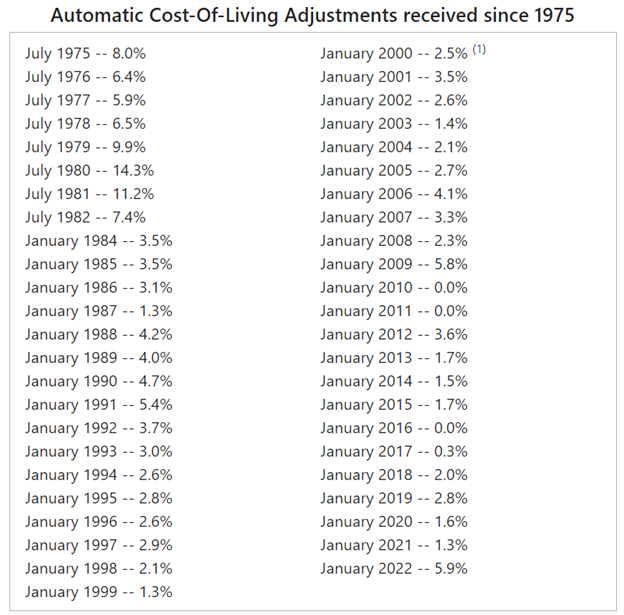
A 9.6% COLA increase in wages in 2023? That’s what retirees can expect from Social Security if the inflation rate doesn’t recede in August and September. This would be the highest cost-of-living increase in more than four decades. The increases are based on the percentage increase in the Consumer Price Index for Urban Wage Earners and Clerical Workers (CPI-W) measured from the third quarter of the last year to the current third quarter. COLA is to ensure that the purchasing power of Social Security and Supplemental Security Income (SSI) benefits is not eroded by inflation.


Here’s How 2022-2023 COLA Works

The CPI-W is determined by the Bureau of Labor Statistics (BLS), which is part of the Department of Labor (DOL). It is the legal measure used by the Social Security Administration to calculate COLAs.

Social Security checks get an inflation adjustment each year based on the index. In determining the cost of living adjustment, the Social Security Administration (SSA) compares the average figures for July, August, and September to the index’s average level over the same annualized monthly average a year earlier.

The July CPI-W data, released Wednesday (August 10), rose 9.1% during the past 12 months. That is slightly higher than the more talked about “headline inflation” number, which is CPI-U or the Consumer Price Index for All Urban Consumers. CPI-U YoY rose 8.5% year-to-date.

If inflation remains at the current level, on average, over August and September, the approximately 70 million retirees and disabled people who receive Social Security benefits will experience payment increases of 9.6% beginning January 2023. With a COLA of 9.6%, the average monthly Social Security check for retired workers would rise by about $160 in 2023, to $1,829 in January from $1,669 this year.


Source: SSA.gov


Compared to 2022

Last October, when the COLA for 2022 was announced, federal retirees received a 5.9% increase in Social Security payments. The Civil Service Retirement System (CSRS) annuities that use the same COLA calculation have been benefitting the same. The Federal Employees Retirement System (FERS) annuities received a 4.9% increase starting in January 2022. At that time, this was the largest COLA increase in 40 years. The 2023 increase is almost certain to surpass 5.9%.

The actual 2023 COLA will be calculated in mid-October. At that time, the average for July, August, and September will have all become official; from there, the actual COLA calculation is easy. In 2022 this led to a combined pay raise of over $68 billion for those receiving Social Security.

The Bureau of Labor Statistics is scheduled to release the August CPI-W on September 13 and September data on October 13. The SSA will issue the official COLA announcement for the following year soon after.

Next year’s COLA increase is likely to speed up the calculated date of insolvency for the Social Security trust fund. The current expectation by the Committee for a Responsible Federal Budget, which predicts insolvency, is 2034. This is a year earlier than it had been previously forecast.

Paul Hoffman

Managing Editor, Channelchek

Suggested Content


With Inflation Pushing Up the COLA on Social Security, Investing Where Seniors Spend Could Pay Off!


What a $75.6 Billion COLA Could Mean to Investors


Are Consumer Price Increases Negatively Correlated to Stock Market Price Levels?


Why Cathie Wood Thinks We Will Emerge from A Recession More Quickly than Others


Sources

https://www.ssa.gov/cola/

https://www.bls.gov/news.release/pdf/cpi.pdf

https://www.bls.gov/schedule/news_release/cpi.htm

https://www.crfb.org/issue-area/social-security

Stay up to date. Follow us:


Kelly Services (KELYA) – Calling All Workers

Friday, August 12, 2022

Kelly Services (KELYA)
Calling All Workers

Kelly (Nasdaq: KELYA, KELYB) connects talented people to companies in need of their skills in areas including Science, Engineering, Education, Office, Contact Center, Light Industrial, and more. We’re always thinking about what’s next in the evolving world of work, and we help people ditch the script on old ways of thinking and embrace the value of all workstyles in the workplace. We directly employ nearly 350,000 people around the world and connect thousands more with work through our global network of talent suppliers and partners in our outsourcing and consulting practice. Revenue in 2021 was $4.9 billion. Visit kellyservices.com and let us help with what’s next for you.

Joe Gomes, Senior Research Analyst, Noble Capital Markets, Inc.

Joshua Zoepfel, Research Associate, Noble Capital Markets, Inc.

Refer to the full report for the price target, fundamental analysis, and rating.

2Q22. Revenue of $1.267.3 billion was up 0.7% year-over-year (2.7% in constant currency). Consensus was $1.28 billion and we were at $1.29 billion. Kelly reported operating earnings of $8.2 million ($22.3 million adjusted) compared to $13.7 million a year ago. We were at $23 million. GAAP EPS was $0.06 compared to $0.60. Adjusted EPS for the second quarter was $0.45 versus $0.49 last year. We had projected adjusted EPS of $0.49.

Demand for Talent. Demand for talent remains high, even in the face of economic uncertainty. We would highlight a 33.2% y-o-y increase in permanent placement fees, typically a more sensitive barometer of demand. The Company continues to explore a multitude of ways to supply the demanded talent to its clients.

This Company Sponsored Research is provided by Noble Capital Markets, Inc., a FINRA and S.E.C. registered broker-dealer (B/D).

*Analyst certification and important disclosures included in the full report. NOTE: investment decisions should not be based upon the content of this research summary. Proper due diligence is required before making any investment decision. 

Onconova Therapeutics (ONTX) – All Trials Continue Toward Data Milestones

Friday, August 12, 2022

Onconova Therapeutics (ONTX)
All Trials Continue Toward Data Milestones

Onconova Therapeutics is a clinical-stage biopharmaceutical company focused on discovering and developing novel products for patients with cancer. The Company has proprietary targeted anti-cancer agents designed to disrupt specific cellular pathways that are important for cancer cell proliferation. Onconova’s novel, proprietary multi-kinase inhibitor narazaciclib (formerly ON 123300) is being evaluated in two Phase 1 dose-escalation and expansion studies. These trials are currently underway in the United States and China. Onconova’s product candidate rigosertib is being studied in an investigator-sponsored study program, including in a dose-escalation and expansion Phase 1/2a investigator-sponsored study with oral rigosertib in combination with nivolumab for patients with KRAS+ non-small cell lung cancer.

Robert LeBoyer, Vice President, Research Analyst, Life Sciences , Noble Capital Markets, Inc.

Refer to the full report for the price target, fundamental analysis, and rating.

2Q22 Onconova Reported Trial Progress. 2Q22 loss of $4.0 million or $(0.19) per share, compared with our estimated loss of $3.7 million or $(0.18) per share.  Several clinical trials for both narazaciclib and rigosertib are continuing as expected.  The company ended the quarter with $46.5 million in cash and cash equivalents.

Both Narazaciclib Phase 1/2 Trials Continue To Enroll Patients.  The two trials testing narazaciclib at different treatment schedules continue to treat patients.  The trial in China continues in its fifth cohort while the US trial recently begun dosing its fifth cohort.  Neither trial has reached its maximum tolerated dose and none of the toxicities associated with other CDK4/6 drugs have been reported.  We expect announcement of the dosing level selected for Phase 2 around 4Q22….

This Company Sponsored Research is provided by Noble Capital Markets, Inc., a FINRA and S.E.C. registered broker-dealer (B/D).

*Analyst certification and important disclosures included in the full report. NOTE: investment decisions should not be based upon the content of this research summary. Proper due diligence is required before making any investment decision. 

Release – Axcella Reports Second Quarter Financial Results and Provides Business Update


Axcella Reports Second Quarter Financial Results and Provides Business Update

Research, News, and Market Data on Axcella Therapeutics

August 12, 2022 at 7:30 AM EDT

  • Announced Statistically Significant Clinical
    Improvement in Fatigue in the Phase 2A Long COVID Trial Topline data
  • NASH Trial interim Data
    Expected in Late Q3 2022
  • Company to Host Conference Call
    at 8:30 a.m. ET today

CAMBRIDGE, Mass.–(BUSINESS WIRE)–Aug. 12, 2022– Axcella Therapeutics (Nasdaq: AXLA), a clinical-stage biotechnology company pioneering a new approach to treat complex diseases using multi-targeted endogenous metabolic modulator (EMM) compositions, today announced financial results for the second quarter ended 
June 30, 2022 and provided a business update.

“Axcella has been a leader in clinical development in Long COVID. We continued this leadership through the second quarter as we advanced the development of our two clinical programs for AXA1125. Our Phase 2A trial of Long COVID in collaboration with 
Oxford University
 is now complete. The results were extremely encouraging and showed that administration of AXA1125 to patients significantly reduced mental and physical fatigue,” said  Bill Hinshaw , President and Chief Executive Officer of Axcella. “Since reporting our data last week, we have received extremely positive feedback from our community of physicians and patients regarding their excitement about the further development of this therapeutic and its potential to benefit patients once it reaches the clinic. In addition, we continue to participate in investors meetings to get the story of the company out to the wider investment community.”

Financial Results

Cash Position: As of 
June 30, 2022, cash, cash equivalents, and marketable securities totaled 
$44.4 million
, compared to 
$55.0 million
 as of 
December 31, 2021. In 
March 2022, the Company received approximately 
$25.0 million
 in gross proceeds from a registered direct offering of common stock. Axcella expects that its current cash balance will be sufficient to meet its operating needs into the first quarter of 2023, provided that, if the Company is unable to satisfy the cash covenants contained in its loan and security agreement with SLR Investment Corp., and SLR Investment Corp. seeks immediate repayment of the loan in full, the Company believes that its cash and cash equivalents will be sufficient to fund its operations into the fourth quarter of 2022.

R&D Expenses: Research and development expenses for the quarter and six months ended 
June 30, 2022 were 
$16.9 million
 and 
$30.4 million
, respectively. Research and development expenses for the same periods ended 
June 30, 2021 were 
$10.3 million
 and 
$20.5 million
, respectively. These increases are the result of the Company’s EMMPACT and Long COVID Phase 2 clinical trials, as well as closure costs for its EMMPOWER Phase 2 clinical trial.

G&A Expenses: General and administrative expenses for the quarter and six months ended 
June 30, 2022 were 
$3.8 million
 and 
$8.5 million
, respectively. General and administrative expenses for the same periods ended 
June 30, 2021 were 
$4.9 million
 and 
$9.2 million
. These decreases are primarily the result of lower non-cash stock-based compensation expenses.

Net Loss: Net loss for the quarter and six months ended 
June 30, 2022 was 
$21.3 million
, or 
$0.40 per basic and diluted share, and 
$40.3 million
, or 
$0.86 per basic and diluted share, respectively. This compares with a net loss of 
$15.9 million
, or 
$0.42 per basic and diluted share, and 
$31.1 million
, or 
$0.83 per basic and diluted share, for the quarter and six months ended 
June 30, 2021.

Internet Posting of
Information

Axcella uses the “Investors and News” section of its website, www.axcellatx.com, as a means of disclosing material nonpublic information, to communicate with investors and the public, and for complying with its disclosure obligations under Regulation FD. Such disclosures include, but may not be limited to, investor presentations and FAQs, 
Securities and Exchange Commission filings, press releases, and public conference calls and webcasts. The information that we post on our website could be deemed to be material information. As a result, we encourage investors, the media and others interested to review the information that we post there on a regular basis. The contents of our website shall not be deemed incorporated by reference in any filing under the Securities Act of 1933, as amended.

About Axcella
Therapeutics (Nasdaq: AXLA)

Axcella is a clinical-stage biotechnology company pioneering a new approach to treat complex diseases using compositions of endogenous metabolic modulators (EMMs). The company’s product candidates are comprised of EMMs and derivatives that are engineered in distinct combinations and ratios to restore cellular homeostasis in multiple key biological pathways and improve cellular energetic efficiency. Axcella’s pipeline includes lead therapeutic candidates in Phase 2 development for the treatment of Long COVID, and non-alcoholic steatohepatitis (NASH). The company’s unique model allows for the evaluation of its EMM compositions through non-IND clinical studies or IND clinical trials. For more information, please visit www.axcellatx.com.

Forward-Looking
Statements

This press release contains forward-looking statements within the meaning of the Private Securities Litigation Reform Act of 1995, as amended, including, without limitation, statements regarding the timing of the company’s clinical trial data readouts, its expected cash runway and the potential impact of the company’s recent clinical trial data readouts on market interest and acceptance of the company’s product candidates and investment interest in the company’s securities. The words “may,” “will,” “could,” “would,” “should,” “expect,” “plan,” “anticipate,” “intend,” “believe,” “estimate,” “predict,” “project,” “potential,” “continue,” “target” and similar expressions are intended to identify forward-looking statements, although not all forward-looking statements contain these identifying words. Any forward-looking statements in this press release are based on management’s current expectations and beliefs and are subject to a number of risks, uncertainties and important factors that may cause actual events or results to differ materially from those expressed or implied by any forward-looking statements contained in this press release, including, without limitation, those related to the potential impact of COVID-19 on the company’s ability to conduct and complete its ongoing or planned clinical studies and clinical trials in a timely manner or at all due to patient or principal investigator recruitment or availability challenges, clinical trial site shutdowns or other interruptions and potential limitations on the quality, completeness and interpretability of data the company is able to collect in its clinical trials of AXA1125, other potential impacts of COVID-19 on the company’s business and financial results, including with respect to its ability to raise additional capital and operational disruptions or delays, changes in law, regulations, or interpretations and enforcement of regulatory guidance, whether data readouts support the company’s clinical trial plans and timing, clinical trial design and target indications for AXA1125, the clinical development and safety profile of AXA1125 and its therapeutic potential, whether and when, if at all, the company’s product candidates will receive approval from the FDA or other comparable regulatory authorities, potential competition from other biopharma companies in the company’s target indications, and other risks identified in the company’s 
SEC filings, including Axcella’s Annual Report on Form 10-K, Quarterly Report on Form 10-Q and subsequent filings with the 
SEC. The company cautions you not to place undue reliance on any forward-looking statements, which speak only as of the date they are made. Axcella disclaims any obligation to publicly update or revise any such statements to reflect any change in expectations or in events, conditions or circumstances on which any such statements may be based, or that may affect the likelihood that actual results will differ from those set forth in the forward-looking statements. Any forward-looking statements contained in this press release represent the company’s views only as of the date hereof and should not be relied upon as representing its views as of any subsequent date. The company explicitly disclaims any obligation to update any forward-looking statements.

Ashley Robinson arr@lifesciadvisors.com
(617) 430-7577

Source: Axcella Therapeutics


Release – Alvopetro Announces Record Funds Flow from Operations for the Second Quarter of 2022 & Q2 Results Webcast


Alvopetro Announces Record Funds Flow from Operations for the Second Quarter of 2022 & Q2 Results Webcast

Research, News, and Market Data on Alvopetro Energy

Aug 11, 2022

CALGARY, AB, Aug. 11, 2022 /CNW/ – Alvopetro Energy Ltd. (TSXV: ALV) (OTCQX: ALVOF) announces operating and financial results for the second quarter of 2022 including record funds flow from operations of $12.4 million. We will host a live webcast to discuss Q2 2022 results on Friday August 12, 2022 beginning at 8:00 am Mountain time.

All references herein to $ refer to United States dollars, unless otherwise stated and all tabular amounts are in thousands of United States dollars, except as otherwise noted.

Financial and Operating Highlights – Second Quarter of 2022

  • Daily sales averaged 2,359 boepd in Q2 2022, consistent with the Q2 2021 average of 2,361 boepd and a 6% reduction from the Q1 2022 average of 2,501 boepd as a result of a planned five-day shut-down of our gas processing facility to complete necessary work in advance of the facility expansion.
  • On February 1, 2022, our contracted natural gas price under our long-term gas sales agreement increased 48% to Brazilian real (“BRL”)1.94/m3. With all natural gas sales in Q2 2022 at this higher price and an appreciation of the BRL relative to the USD compared to Q2 2021, our average realized natural gas price increased to $11.90/Mcf compared to the Q2 2021 average price of $6.06/Mcf and the Q1 2022 average price of $10.03/Mcf. Higher commodity prices resulted in a 93% increase in our natural gas, condensate and oil revenue compared to Q2 2021.
  • With higher realized sales prices, our operating netback increased to $63.96 per boe in Q2 2022, an improvement of 103% from Q2 2021 and 19% from Q1 2022.
  • We generated cash flows from operating activities of $13.0 million ($0.38 per basic share and $0.35 per diluted share) and funds flows from operations of $12.4 million ($0.37 per basic share and $0.34 per diluted share), increases of $7.3 million and $7.0 million, respectively compared to Q2 2021.
  • We reported net income of $6.6 million, an increase of $2.8 million compared to Q2 2021.
  • Capital expenditures totaled $6.3 million, focused on drilling costs for our 182-C1 and 183-B1 wells, long lead purchases, final costs for our Murucututu field production facility installation on other development costs on our Murucututu project.
  • We repaid an additional $2.5 million of our credit facility, bringing the balance outstanding to $2.5 million. As at June 30, 2022, we had a net working capital surplus of $11.6 million, including $13.7 million in cash and cash equivalents. The Company’s working capital net of our credit facility balance improved to $9.1 million, compared to $7.3 million as of March 31, 2022.
  • Effective August 1, 2022 our natural gas price has been set at BRL1.94/m3 or $11.28/Mcf (based on our average heat content to date of 107% and the July 31, 2022 BRL/USD foreign exchange rate of 5.19). The adjusted price is based on the ceiling price in the contract, which was adjusted to $10.22/MMBtu effective August 1, 2022. While the ceiling price increased by 6% from the February 1, 2022 ceiling price, due to the appreciation of the BRL relative to the USD in the first half of 2022 compared to the latter half of 2021, the BRL denominated contractual price remained consistent. This price will be effective for all natural gas sales from August 1, 2022 to January 31, 2023.

The following table provides a summary of Alvopetro’s financial and operating results for three and six months ended June 30, 2022 and June 30, 2021. The consolidated financial statements with the Management’s Discussion and Analysis (“MD&A) are available on our website at www.alvopetro.com and will be available on the System for Electronic Document Analysis and Retrieval (SEDAR) website at www.sedar.com.

As at and Three Months EndedJune 30,

As at and Six Months EndedJune 30,

2022

2021

Change (%)

2022

2021

Change (%)

Financial

($000s, except where noted)

Natural gas, oil and condensate sales

15,787

8,182

93

29,759

15,121

97

Net income – restated(1)

6,631

3,784

75

17,746

2,837

526

      Per share – basic restated ($)(1)(2)

0.20

0.11

82

0.52

0.09

478

      Per share – diluted restated ($)(1)(2)

0.18

0.11

64

0.49

0.08

513

Cash flow from operating activities

12,997

5,665

129

21,330

9,969

114

      Per share – basic ($)(2)

0.38

0.17

124

0.63

0.30

110

      Per share – diluted ($)(2)

0.35

0.16

119

0.59

0.29

103

Funds flow from operations (3)

12,434

5,471

127

23,338

10,227

128

      Per share – basic ($)(2)

0.37

0.16

131

0.69

0.31

123

      Per share – diluted ($)(2)

0.34

0.16

113

0.64

0.30

113

Dividends declared

2,728

5,444

Per share(2)

0.08

0.16

Capital expenditures

6,338

918

590

10,138

1,782

469

Cash and cash equivalents

13,672

4,249

222

13,672

4,249

222

Net working capital surplus (3)

11,641

4,499

159

11,641

4,499

159

Working capital, net of debt (net debt)(3)

9,096

(3,046)

9,096

(3,046)

Weighted average shares outstanding

      Basic (000s)(2)

33,973

33,265

2

33,941

33,250

2

      Diluted (000s)(2)

36,637

34,339

7

36,426

34,075

7

Operations

Natural gas, NGLs and crude oil sales:

      Natural gas (Mcfpd)

13,546

13,512

13,940

12,991

7

      NGLs – condensate (bopd)

97

105

(8)

98

101

(3)

      Oil (bopd)

5

5

8

2

300

      Total (boepd)

2,359

2,361

2,429

2,269

7

Average realized prices(3):

      Natural gas ($/Mcf)

11.90

6.06

96

10.94

5.88

86

      NGL – condensate ($/bbl)

121.93

74.47

64

114.11

69.65

64

      Oil ($/bbl)

94.47

59.63

58

83.90

59.63

41

      Company total ($/boe)

73.54

38.08

93

67.68

36.82

84

Operating netback ($/boe)(3)

      Realized sales price

73.54

38.08

93

67.68

36.82

84

      Royalties

(5.35)

(2.82)

90

(4.84)

(3.05)

59

      Production expenses

(4.23)

(3.68)

15

(4.00)

(3.66)

9

      Operating netback

63.96

31.58

103

58.84

30.11

95

Operating netback margin(3)

87 %

83 %

5

87 %

82 %

6

Notes:

(1)

The 2021 comparative periods in the table above have been restated. See “Restatement of the 2021 Comparative Period” section within the MD&A and Note 14 of the unaudited interim condensed consolidated financial statements for the three and six months ended June 30, 2022 for further details.

(2)

Per share amounts are based on weighted average shares outstanding other than dividends per share, which is based on the number of common shares outstanding at each dividend record date. The weighted average number of diluted common shares outstanding in the computation of funds flow from operations and cash flows from operating activities per share is the same as for net income per share.

(3)

See “Non-GAAP and
Other Financial Measures
” section within this news release.


Second Quarter 2022 Results Webcast

Alvopetro will host a live webcast to discuss Q2 2022 financial results at 8:00 am Mountain time on August 12, 2022. Details for joining the event are as follows:

Date: August 12, 2022Time: 8:00 AM Mountain/10:00 AM Eastern
Linkhttps://us06web.zoom.us/j/89887067576Dial-in
Numbers
https://us06web.zoom.us/u/kSVhrrkB0Webinar
ID: 
898 8706 7576

The webcast will include a question-and-answer period. Online participants will be able to ask questions through the Zoom portal. Dial-in participants can email questions directly to socialmedia@alvopetro.com.

Corporate Presentation

Alvopetro’s updated corporate presentation is available on our website at: http://www.alvopetro.com/corporate-presentation

Social Media

Follow Alvopetro on our social media channels at the following links:

Twitter – https://twitter.com/AlvopetroEnergy Instagram – 
https://www.instagram.com/alvopetro/ LinkedIn – 
https://www.linkedin.com/company/alvopetro-energy-ltd

Alvopetro Energy Ltd.’s vision is to become a
leading independent upstream and midstream operator in 
Brazil. Our
strategy is to unlock the on-shore natural gas potential in the state of Bahia
in 
Brazil,
building off the development of our Caburé natural gas field and our strategic
midstream infrastructure.

Neither the TSX Venture Exchange nor its Regulation Services
Provider (as that term is defined in the policies of the TSX Venture Exchange)
accepts responsibility for the adequacy or accuracy of this news release.

All amounts contained in this new release are in United States dollars,
unless otherwise stated and all tabular amounts are in thousands of 
United States dollars,
except as otherwise noted.

Abbreviations:

boepd

=

barrels of oil equivalent (“boe”) per day

bopd

=

barrels of oil and/or natural gas liquids (condensate) per day

BRL

=

Brazilian Real

m3

=

cubic metre

Mcf

=

thousand cubic feet

Mcfpd

=

thousand cubic feet per day

MMcf

=

million cubic feet

MMcfpd

=

million cubic feet per day

NGLs

=

natural gas liquids

Q1 2022

=

three months ended March 31, 2022

Q2 2021

=

three months ended June 30, 2021

Q2 2022

=

three months ended June 30, 2022


Non-GAAP and Other Financial Measures

This news release contains references to various non-GAAP financial measures, non-GAAP ratios, capital management measures and supplementary financial measures as such terms are defined in National Instrument 52-112 Non-GAAP and Other Financial Measures Disclosure. Such measures are not recognized measures under GAAP and do not have a standardized meaning prescribed by IFRS and might not be comparable to similar financial measures disclosed by other issuers. While these measures may be common in the oil and gas industry, the Company’s use of these terms may not be comparable to similarly defined measures presented by other companies. The non-GAAP and other financial measures referred to in this report should not be considered an alternative to, or more meaningful than measures prescribed by IFRS and they are not meant to enhance the Company’s reported financial performance or position. These are complementary measures that are used by management in assessing the Company’s financial performance, efficiency and liquidity and they may be used by investors or other users of this document for the same purpose. Below is a description of the non-GAAP financial measures, non-GAAP ratios, capital management measures and supplementary financial measures used in this news release. For more information with respect to financial measures which have not been defined by GAAP, including reconciliations to the closest comparable GAAP measure, see the “Non-GAAP
Measures and Other Financial Measures
” section of the Company’s MD&A which may be accessed through the SEDAR website at www.sedar.com.

Non-GAAP Financial Measures

Operating netback

Operating netback is calculated as natural gas, oil and condensate revenues less royalties and production expenses. This calculation is provided in the “Operating Netback” section of the Company’s MD&A using our IFRS measures. The Company’s MD&A may be accessed through the SEDAR website at www.sedar.com. Operating netback is a common metric used in the oil and gas industry used to demonstrate profitability from operations.

Non-GAAP Financial Ratios

Operating netback per boe

Operating netback is calculated on a per unit basis, which is per barrel of oil equivalent (“boe”). It is a common non-GAAP measure used in the oil and gas industry and management believes this measurement assists in evaluating the operating performance of the Company. It is a measure of the economic quality of the Company’s producing assets and is useful for evaluating variable costs as it provides a reliable measure regardless of fluctuations in production. Alvopetro calculated operating netback per boe as operating netback divided by total sales volumes (barrels of oil equivalent). This calculation is provided in the “Operating Netback” section of the Company’s MD&A using our IFRS measures. The Company’s MD&A may be accessed through the SEDAR website at www.sedar.com. Operating netback is a common metric used in the oil and gas industry used to demonstrate profitability from operations on a per unit basis (boe).

Operating netback margin

Operating netback margin is calculated as operating netback per boe divided by the realized sales price per boe. Operating netback margin is a measure of the profitability per boe relative to natural gas, oil and condensate sales revenues per boe and is calculated as follows:

Three Months EndedJune 30,

Six Months EndedJune 30,

2022

2021

2022

2021

Operating netback – $ per boe

63.96

31.58

58.84

30.11

Average realized price – $ per boe

73.54

38.08

67.68

36.82

Operating netback margin

87 %

83 %

87 %

82 %


Funds Flow from Operations Per Share

Funds flow from operations per share is a non-GAAP ratio that includes all cash generated from operating activities and is calculated before changes in non-cash working capital, divided by the weighted the weighted average shares outstanding for the respective period. For the periods reported in this news release the cash flows from operating activities per share and funds flow from operations per share is as follows:

Three Months EndedJune 30,

Six Months EndedJune 30,

$ per share

2022

2021

2022

2021

Per basic share:

Cash flows from operating activities

0.38

0.17

0.63

0.30

Funds flow from operations

0.37

0.16

0.69

0.31

Per diluted share:

Cash flows from operating activities

0.35

0.16

0.58

0.29

Funds flow from operations

0.34

0.16

0.64

0.30


Capital Management Measures

Funds Flow from Operations 

Funds flow from operations is a non-GAAP capital management measure that includes all cash generated from operating activities and is calculated before changes in non-cash working capital. The most comparable GAAP measure to funds flow from operations is cash flows from operating activities. Management considers funds flow from operations important as it helps evaluate financial performance and demonstrates the Company’s ability to generate sufficient cash to fund future growth opportunities. Funds flow from operations should not be considered an alternative to, or more meaningful than, cash flows from operating activities however management finds that the impact of working capital items on the cash flows reduces the comparability of the metric from period to period. A reconciliation of funds flow from operations to cash flows from operating activities is as follows:

Three Months EndedJune 30,

Six Months EndedJune 30,

2022

2021

2022

2021

Cash flows from operating activities

12,997

5,665

21,330

9,969

Add back changes in non-cash working capital

(563)

(194)

2,008

258

Funds flow from operations

12,434

5,471

23,338

10,227


Net Working Capital

Net working capital is computed as current assets less current liabilities. Net working capital is a measure of liquidity, is used to evaluate financial resources, and is calculated as follows: 

As at June 30,

2022

2021

Total current assets

21,461

8,413

Total current liabilities

(9,820)

(3,914)

Net working capital surplus

11,641

4,499


Working Capital Net of Debt (Net Debt)

Working capital net of debt is computed as net working capital surplus decreased by the carrying amount of the Credit Facility. Working capital net of debt is used by management to assess the Company’s overall financial position. As of June 30, 2022, Alvopetro’s net working capital surplus exceeds the balance outstanding on the Credit Facility.

As at June 30,

2022

2021

Net working capital surplus

11,641

4,499

Credit Facility, balance outstanding

(2,545)

(7,545)

Working capital, net of debt (net debt)

9,096

(3,046)


Supplementary Financial Measures

Average realized natural gas price – $/Mcf” is comprised of natural gas sales as determined in accordance with IFRS, divided by the Company’s natural gas sales volumes.

Average realized NGL – condensate price – $/bbl” is comprised of condensate sales as determined in accordance with IFRS, divided by the Company’s NGL sales volumes from condensate.

Average realized oil price – $/bbl” is comprised of oil sales as determined in accordance with IFRS, divided by the Company’s oil sales volumes.

Average realized price – $/boe” is comprised of natural gas, condensate and oil sales as determined in accordance with IFRS, divided by the Company’s total natural gas, condensate and oil sales volumes (barrels of oil equivalent).

Royalties per boe” is comprised of royalties, as determined in accordance with IFRS, divided by the total natural gas, condensate and oil sales volumes (barrels of oil equivalent).

Production expenses per boe” is comprised of production expenses, as determined in accordance with IFRS, divided by the total natural gas, condensate and oil sales volumes (barrels of oil equivalent).

BOE Disclosure

The term barrels of oil equivalent (“boe”) may be misleading, particularly if used in isolation. A boe conversion ratio of six thousand cubic feet per barrel (6 Mcf/bbl) of natural gas to barrels of oil equivalence is based on an energy equivalency conversion method primarily applicable at the burner tip and does not represent a value equivalency at the wellhead. All boe conversions in this MD&A are derived from converting gas to oil in the ratio mix of six thousand cubic feet of gas to one barrel of oil.

Forward-Looking Statements and Cautionary Language

This news release contains forward-looking information within the meaning of applicable securities laws. The use of any of the words “will”, “expect”, “intend” and other similar words or expressions are intended to identify forward-looking information. Forward?looking statements involve significant risks and uncertainties, should not be read as guarantees of future performance or results, and will not necessarily be accurate indications of whether or not such results will be achieved. A number of factors could cause actual results to vary significantly from the expectations discussed in the forward-looking statements. These forward-looking statements reflect current assumptions and expectations regarding future events. Accordingly, when relying on forward-looking statements to make decisions, Alvopetro cautions readers not to place undue reliance on these statements, as forward-looking statements involve significant risks and uncertainties. More particularly and without limitation, this news release contains forward-looking information concerning the plans relating to the Company’s operational activities, the expected natural gas price, gas sales and gas deliveries under Alvopetro’s long-term gas sales agreement, exploration and development prospects of Alvopetro, the expected timing of certain of Alvopetro’s testing and operational activities, future results from operations, and the Company’s plans for dividends in the future. The forward?looking statements are based on certain key expectations and assumptions made by Alvopetro, including but not limited to equipment availability, the timing of testing of the 182-C1 and the 183-B1 wells and the results from such testing, the timing of regulatory licenses and approvals, the success of future drilling, completion, testing, recompletion and development activities, the outlook for commodity markets and ability to access capital markets, the impact of the COVID-19 pandemic and other significant worldwide events, the performance of producing wells and reservoirs, well development and operating performance, foreign exchange rates, general economic and business conditions, weather and access to drilling locations, the availability and cost of labour and services, environmental regulation, including regulation relating to hydraulic fracturing and stimulation, the ability to monetize hydrocarbons discovered, the regulatory and legal environment and other risks associated with oil and gas operations. The reader is cautioned that assumptions used in the preparation of such information, although considered reasonable at the time of preparation, may prove to be incorrect. Actual results achieved during the forecast period will vary from the information provided herein as a result of numerous known and unknown risks and uncertainties and other factors. In addition, the declaration, timing, amount and payment of future dividends remain at the discretion of the Board of Directors. Although Alvopetro believes that the expectations and assumptions on which such forward-looking information is based are reasonable, undue reliance should not be placed on the forward-looking information because Alvopetro can give no assurance that it will prove to be correct. Readers are cautioned that the foregoing list of factors is not exhaustive. Additional information on factors that could affect the operations or financial results of Alvopetro are included in our restated annual information form which may be accessed on Alvopetro’s SEDAR profile at www.sedar.com. The forward-looking information contained in this news release is made as of the date hereof and Alvopetro undertakes no obligation to update publicly or revise any forward-looking information, whether as a result of new information, future events or otherwise, unless so required by applicable securities laws.

SOURCE Alvopetro Energy Ltd.


Is Index Fund Popularity Going to Cool-Off?


Image Credit: Laura Pontiggia (Flickr)


Has the Bear Market Left a Permanent Mark on Indexed Investments?

As much as 25% of the S&P 500 index is comprised of only five stocks. Most active investors can guess them easily enough: Apple (AAPL), Microsoft (MSFT), Amazon.com (AMZN), Tesla (TSLA), and Alphabet (GOOG). As of the end of the second quarter (2022), 7.1% of the S&P 500 index was allocated to Apple alone. Funds that mimic indexes have done extraordinary up until now as the trend has been toward index investing. In the first quarter of this year alone, which includes IRA season, these funds took in $8.5 trillion in retail investments. According to Morningstar, this is more than all active management strategies combined. They have been the go-to investment idea for financial advisors and the way this generation has learned to think about investing.


What Might Change?

The persistent sell-off in the markets earlier this year, and the surprise geopolitical events, may cause investors to question if these funds are properly diversified. Even an allocation of 60% stocks and 40% bonds would place an investor’s exposure, using an S&P 500 fund, to nearly 5% of AAPL. Worse yet, the top five, comprising 25%, often trade in lock-step, both up and down.

They are, after all, the big guys. They certainly have the power to grow further but also much further to fall than most. Will recovering from the bear market, with lessons learned, cause the popularity of these funds to lessen? The funds were viewed as ideal diversifiers when they first gained popularity, but their own success, that is, the amount of money that poured into this good idea, has given them weaknesses. An unsettling weakness is much higher average valuations among holdings than stocks just outside of any large index.


History Until Now

The history of Index funds’ popularity is easy to understand. For financial advisors, they found it provided low-cost diversification for their clients. They got this by placing assets in an indexed ETF; as a bonus, they avoided what were then large transaction fees with individual stocks. 

For most individual investors, transaction fees are no longer a barrier to personally managing accounts; the costs simply aren’t as high.  For individual self-directed investors, buy-and-hold and diversification have been drilled into their heads. So these indexed funds easily accomplish this set-it and forget-it (buy and hold) position. But, the level of diversification isn’t what it once was, and investors forgo the nimbleness of taking individual stocks out of their portfolio or more heavily weighting better risk/reward alternatives. 

For the fund managers themselves, especially those benchmarked off an index, no one can tell you you’re performance is horrible if it is in line with the index. It’s an easy job; just own the index in the same ratio the index weights the underlying stocks. With today’s computers, it is almost a back-office clerical function.


Lifecycle of Investment Products

But, like many products, they may have run their course, something better could replace them, or they more likely start to slide under the weight of their own success.

Index funds, especially those that mimic the large-cap Nasdaq100 or S&P 500, are in theory diversified as to names, but they are also capitalization weighted, which means even new money flows unevenly into the larger, more popular stocks. Over time, the combination of index fund popularity together with index construction favoring the more popular stocks has meant that more has flowed into fewer and fewer stocks. Therefore, capitalization-weighted equity indexing adds to the momentum of stocks that may not be worthy.

Much of this money might not otherwise be in these companies if not for the popularity of index funds and the self-perpetuating, dare I say bubble, that is the result of this setup.

According to an article in Barron’s this month, “The purveyors of indexes, being human, tend to make the concentration in a few expensive stocks even worse.” Barron’s wrote. The article then explains that the committee that oversees the S&P 500 has changed the make-up often, “and in the process tended to add stocks with price/earnings ratios more than twice that of those deleted.”


Are Investors Ready to Transition?

With more new money, in unfathomable amounts, reaching these funds each quarter and then being dispersed into the underlying stocks, weaker stocks fall even farther and strong stocks rise more than they may otherwise have risen. This undermines the efficient market theory as stocks that have sunk low enough to be worthwhile for many investors are not considered. The efficient markets theory is supposed to take into account all available information. Over the years, investors have set their portfolios on “in the market” or “out of the market,” with the market being one of the major indexes.

Could it be that as the market turns around and heads up, value hunters in individual stocks will lead, and indexes and index funds will not have as high relative performance?

Index funds, now that they have grown to the size they have, have developed other contradictions. Aside from ignoring the principle that the price paid represents a key determinant of long-term return, indexing ignores the flexibility to reward. Companies in an index that find themselves in trouble will keep receiving new money as investors add funds to their indexed accounts. This is without regard to how undeserving some companies in the fund are or whether they even will be in business in a year. In the meantime, companies not in the index find inclusion gets further out of reach.


Will Stock-Pickers Replace Index Funds?

In an ideal world, there is a selection of suitable products that all have similar results. For commuting, some take the bus to work, others drive, and still, others Zoom in. No one method of commuting is ideal for everyone. Those that wish to not worry about what many individual stocks are doing but instead concentrate on “the market” will keep adding money to these indexed products. Others that realize that they may be full of relatively expensive stocks will gravitate to old-fashioned stock selection – this time without all the commissions. And there will be those that keep their money in low-interest savings accounts that knowingly lose buying power to inflation.

The next “Apple stock” surely has more potential for growth than today’s top five stocks. Currently, the company may be just a hand full of people working out their idea from a handful of remote locations. Finding that company in the initial public offering stage (IPO) or after it has gone public is the dream of most active investors. It can’t be found in an indexed fund.

There is no functioning crystal ball, but there are resources, including no-paywall  Channelchek to help investors quickly review data on over 6000 small and microcap companies. And access the same research professionals consult with before making decisions. In addition, Channelchek has helpful videos and articles sent to your inbox daily to alert you to new perspectives and actionable opportunities.

Sign-up
here.

Paul Hoffman

Managing Editor, Channelchek

Suggested Content


Peter Lynch Echoes Michael Burry’s Warning About Index Investments


Can Stock Market Index Enthusiasm Cause Costly Bubbles?


In Nine Years, Nearly All Boomers Will Have Retired, Is This Good for Stock Pickers?


Together, Self-Directed Investors own More Equities than Institutional – Will they Seize Control?


Sources

https://www.morningstar.com/articles/1087146/us-value-funds-beat-growth-in-the-first-quarter

https://www.barrons.com/articles/the-bear-market-could-finally-break-index-funds-51660287600?mod=hp_LEADSUPP_1

Stay up to date. Follow us: