Crypto Token Instituting its Own Quantitative Tightening is Top Gainer


Image Credit: iamhenry (Flickr)


Shiba Inu Successfully Demonstrates How Token Burn Works

While the Federal Reserve promises to intensify its quantitative tightening (QT) in September by permanently removing more $US dollars from the economy, Shiba Inu holders are working on something similar with the cryptocurrency.  Token burning, or destroying a percentage of a specific token in circulation, should positively impact the value. This has been working well for SHIB.

When introduced in 2020, Shiba Inu was first characterized as a meme scheme or a satire of Dogecoin (DOGE). It has become the 12th largest token and is taking steps to shore up its worth as a currency. One step it’s taking, which has had a positive impact, is reducing tokens in circulation.


What is Token Burning?

“Burning” a token is the act of permanently removing it from any kind of exchange on the blockchain. It effectively destroys it, causing fewer tokens of the crypto to be available for use. This is done by anyone that sends tokens to a frozen private address, referred to as a burn address. A true burn address or null address is one from which the coins cannot be recovered. The definition demands that to be a burn address, there is no private key. Since a private key is needed to access the coins at an address, there is no access; the coins are no longer able to circulate  fewer tokens of the particular crypto are available.


What’s the Purpose?

Scarcity increases the value of an asset. This simply adjusts one side of the supply-demand dynamics of worth.

The higher the demand for a given asset, generally the higher its value. And similarly, the lower the supply, the higher its value. So, where the supply of a given coin or token is fixed (Bitcoin is a prime example of this, with the underlying smart contract ensuring on 21 million BTC can ever be generated) there is means to impact value by destroying some of the supply.

Basically, it’s used as an attempt to increase token value and/or create stability.  


Has it Helped Shiba Inu?

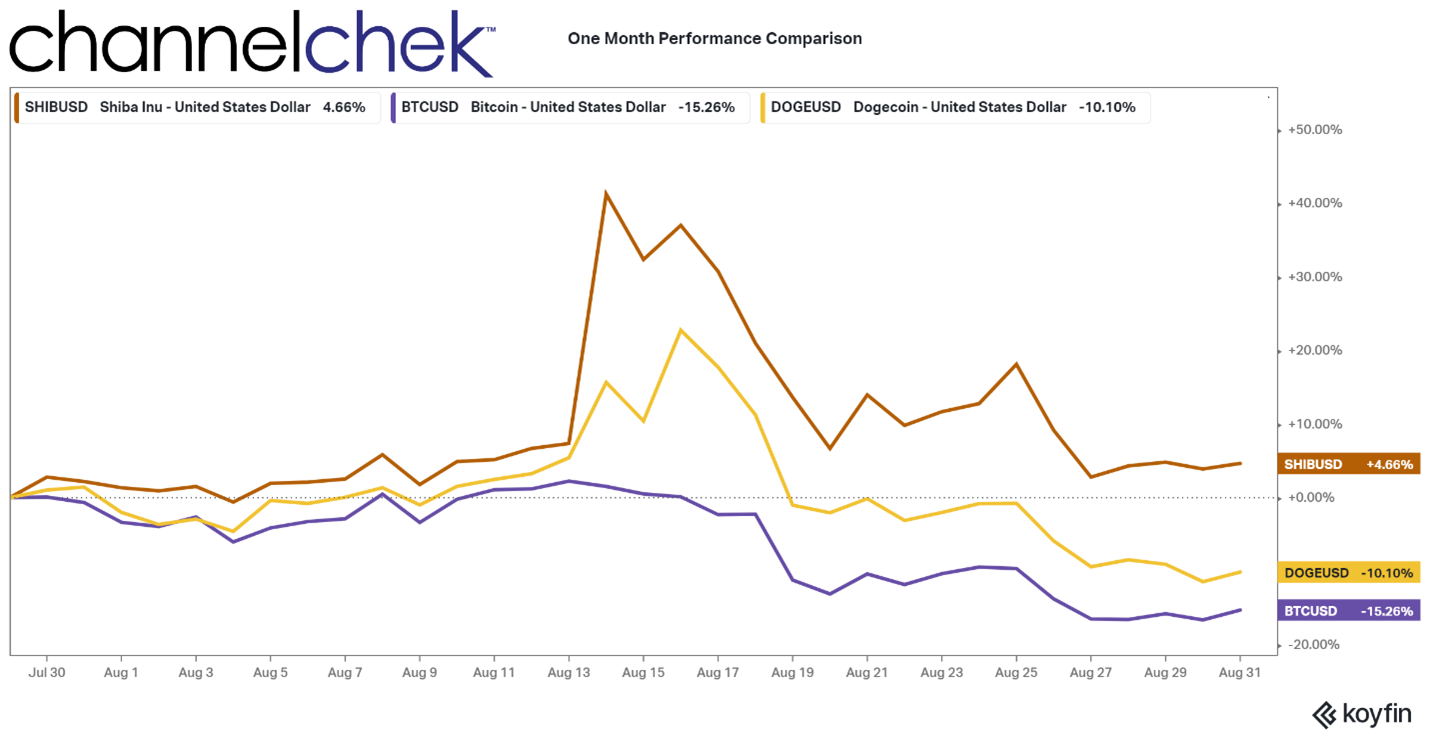
Crypto’s experienced an across the board boost in mid-August, but Shiba-Inu has outperformed all of the top 20 coins. SHIB, the 12th-largest cryptocurrency, has $8.01 billion in circulation and currently trades at around $0.00001235. The coin continues to have gained the most value on the month as others have since faltered.

SHIB’s upwards price action is considered the result of a spike in the token’s burn rate. Other factors include the launch of Shibarium (a layer-2 blockchain to be launched by Shiba Inu).

Nearly 110 million SHIB tokens have been burned over the past day (August 30), and 40% of the total SHIB supply has been burned to date, using data from Shibburn.


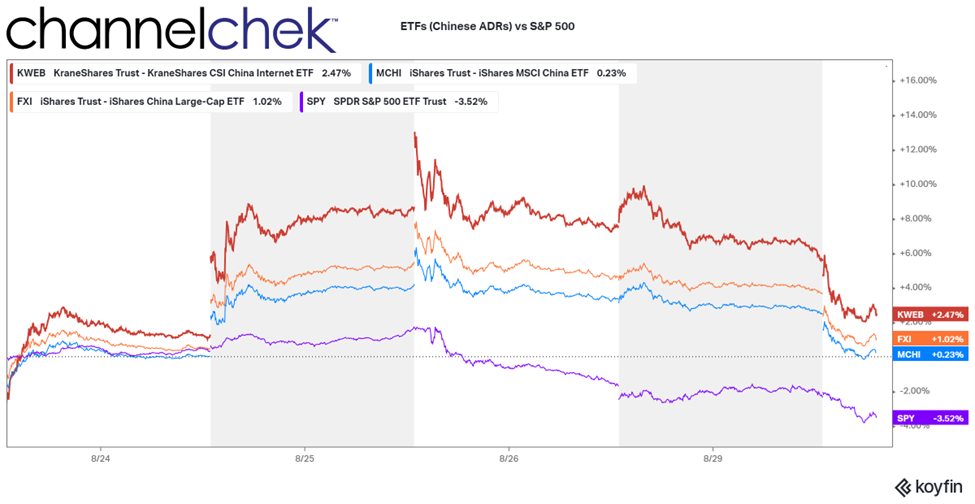
Source: Koyfin

Despite Shiba Inu’s outperformance and momentum in August, it is down over 80% from its all-time high recorded in October 2021. According to Coinglass Over $1.2 million in SHIB trades have been liquidated over the past 24 hours, predominantly from short positions, according to data from Coinglass which provides data and analytics on cryptocurrencies,

Total addresses holding SHIB have increased by 0.023% to just above 1.211 million in the last 24 hours, according to data from Etherscan.


DOGE Follows SHIB

The leading so-called meme coin, Dogecoin, is down on the month but also outperforming its peers and has seen increased trading volume. With a circulation of $9.3 billion, DOGE is the 10th-largest cryptocurrency.

The broader crypto market has leveled off after a recent shellacking.  Bitcoin (BTC) has recently risen and broken the psychological $20,000 mark.


Take Away

Removing some of a currency from circulation has a tendency to lift its value. The Federal Reserve does this by letting purchases mature and not buying more. Cryptocurrencies, although autonomous with no central authority, do this by limiting coins and even burning as Shiba Inu has done.

A stronger and more stable Shiba Inu will cause more people to want to keep it in their crypto wallet. The same is expected a more scarce higher demand crypto, and one of the reasons the dollar has strengthened so much during 2022.

Paul Hoffman

Managing Editor, Channelchek

Suggested Content


Dogecoin Group Works to Give Currency Greater Purpose


Crypto’s Ledger Technology is Keeping Track of Stock Ownership


MicroStrategy’s Huge Bitcoin Portfolio is Now Expected to Expand


Republicans Likely to Have the Majority in the House – Investors May Want to Pivot Early


Sources

https://ambcrypto.com/why-shiba-inus-400-ascension-ended-in-a-bone-afied-story/

https://decrypt.co/108212/shiba-inu-jumps-9-as-token-burn-intensifies

https://coinmarketcap.com/currencies/shiba-inu/

https://www.shibburn.com/

https://www.coinglass.com/

Stay up to date. Follow us:


Catalyst Series – Lineage Cell Therapeutics (LCTX)


This is Catalyst – a new short-form video series that asks senior executives the questions investors want answered. Exclusively on Channelchek. Brian Culley, CEO of Lineage Cell Therapeutics provides an update on the company’s OpRegen program for the treatment of dry age-related macular degeneration and answers questions regarding the latest developments with Lineage’s OPC1 program for spinal cord injury, and how they are managing in the current challenging biotech environment. All in less than three minutes.

Research, News, and Advanced Market Data on LCTX

Release – Kelly to Participate in the 15th Annual Barrington Research Virtual Fall Conference


Kelly to Participate in the 15th Annual Barrington Research Virtual Fall Conference

Research, News, and Market Data on Kelly

August 31, 2022

TROY, Mich.
Aug. 31, 2022 /PRNewswire/ — 
Kelly (Nasdaq: KELYA, KELYB), a leading specialty talent solutions provider, today announced it will participate in the 15th Annual 
Barrington Research Virtual Fall Conference on 
Thursday, September 8, 2022.

Peter Quigley , president and CEO,  Olivier Thirot , executive vice president and chief financial officer, and  James Polehna , chief investor relations officer and corporate secretary, will participate in virtual one-on-one meetings. A copy of Kelly’s investor presentation is also available at kellyservices.com.

About Kelly®

Kelly Services, Inc.
 (Nasdaq: KELYA, KELYB) connects talented people to companies in need of their skills in areas including Science, Engineering, Education, Office, Contact Center, 
Light Industrial
, and more. We’re always thinking about what’s next in the evolving world of work, and we help people ditch the script on old ways of thinking and embrace the value of all workstyles in the workplace. We directly employ more than 350,000 people around the world, and we connect thousands more with work through our global network of talent suppliers and partners in our outsourcing and consulting practice. Revenue in 2021 was 
$4.9 billion. Visit 
kellyservices.com and let us help with what’s next for you.

KLYA-FIN

ANALYST & MEDIA CONTACT:
James Polehna
(248) 244-4586
james.polehna@kellyservices.com


Release – Comstock’s LINICO Receives Main Operating Permit


Comstock’s LINICO Receives Main Operating Permit

Research, News, and Market Data on Comstock Mining

Nevada Facility Based on Advanced New
Lithium Extraction and Electrification Production Technologies

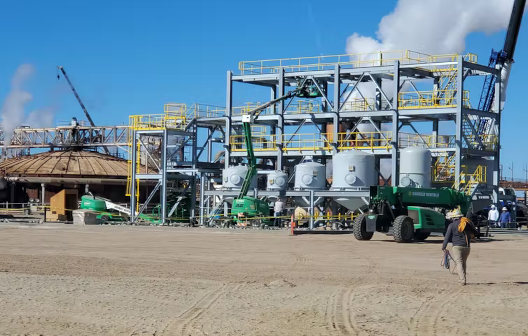
VIRGINIA CITY, NEVADA, AUGUST 31, 2022 – Comstock Inc. (NYSE: LODE) (“Comstock” and the “Company”) today announced the issuance by Nevada Division of Environmental Protection (“NDEP”) of a Written Determination of Hazardous Waste Recycling (“Operating Permit”) to Comstock’s 90% owned subsidiary, LINICO Corporation (“LiNiCo”), authorizing LiNiCo to conduct lithium-ion battery (“LIB”) recycling and related operations at its 137,000 square foot battery metal recycling facility located in the Tahoe Reno Industrial (“TRI”) Center in Storey County, Nevada (“TRI Facility”).

Commencement of Construction and Operations

“We are pleased to receive this critical permit ahead of expectation,” said Corrado De Gasperis, Comstock’s and LiNiCo’s Executive Chairman and Chief Executive Officer. “The Operating Permit is based on the first phase of LiNiCo’s advanced new LIB recycling technologies, including crushing, separating, lithium extraction and precursor cathode active products, designed for leading yields at a fraction of the capital and operating cost of all known lithium extraction and recycling methods.”

LiNiCo is currently building a commercial scale pilot facility for installation at the TRI Facility, with an anticipated commissioning and onset of operations in mid-2023, with lithium extraction capacity planned for the third quarter of 2023.

“We will use our commercial scale pilot and early adopter client agreements to confirm all engineering and other requirements for the scale-up and full commercial deployment of our unique processes at the TRI Facility,” added De Gasperis. “Our goal is to commence construction and expand to scale at the TRI Facility immediately after our commercial pilot confirmation is complete. A key advantage of LiNiCo’s technologies is that they are highly scalable and capable of being right sized to match the evolving and dynamic needs of the rapidly growing lithium recycling industry.”

Electrification and continued advancements in energy storage are vitally necessary to reduce reliance on fossil fuels. According to International Energy Agency (“IEA”), there were more than 10 million electric vehicles (“EVs”) on the road in 2020, with new EV registrations increasing by 41% over 2019 and another 140% during the first quarter of 2021. Meeting the increased EV demand is estimated to require about five times more lithium carbonate equivalent (“LCE”) than the entire lithium mining industry produces today. Miners and manufacturers may eventually scale up to meet that demand, however, according to a January 2021 USGS mineral commodity summary, there are only about 
86 million tons of identified lithium reserves worldwide, and LIBs are typically landfilled after eight to ten years of use. In short, lithium demand is increasing globally, and a tsunami of lithium recycling demand is coming as new electrification products are deployed and age out of use.

De Gasperis concluded, “LiNiCo’s technologies are designed to meet the realities of that demand by enabling profitability at the earliest stages of production, thereby positioning LiNiCo to contribute billions to Comstock’s enterprise value based on existing valuations of comparable public companies. We are very pleased to receive our first major permit and we look forward to completing all remaining permitting requirements, including air quality, so we can commence recycling by mid-2023.”

About LiNiCo Corporation

LiNiCo Corporation (“LiNiCo”) holds the rights to a portfolio of innovative processes that efficiently crush and separate LIBs, extract lithium, nickel, cobalt, and graphite, and reuse the recovered metals to produce 99% pure cathode active precursor products. Collectively, these technologies give LiNiCo, and its existing 137,000 square foot battery metal recycling facility, differentiating competitive advantages, including the ability to process upwards of 100,000 tons of LIB and related feedstocks per year into an array of electrification products, including lithium, nickel, cobalt, graphite, and cathode materials.

About Comstock Inc.

Comstock (NYSE: LODE) innovates technologies that contribute to global decarbonization and circularity by efficiently converting under-utilized natural resources into renewable fuels and electrification products that contribute to balancing global uses and emissions of carbon. The Company intends to achieve exponential growth and extraordinary financial, natural, and social gains by building, owning, and operating a fleet of advanced carbon neutral extraction and refining facilities, by selling an array of complementary process solutions and related services, and by licensing selected technologies to qualified strategic partners. To learn more, please visit www.comstock.inc.

Forward-Looking Statements

This press release and any related calls or discussions may include forward-looking statements within the meaning of Section 27A of the Securities Act of 1933, as amended, and Section 21E of the Securities Exchange Act of 1934, as amended. All statements, other than statements of historical facts, are forward-looking statements. The words “believe,” “expect,” “anticipate,” “estimate,” “project,” “plan,” “should,” “intend,” “may,” “will,” “would,” “potential” and similar expressions identify forward-looking statements but are not the exclusive means of doing so. Forward-looking statements include statements about matters such as: future industry market conditions; future explorations or acquisitions; future changes in our exploration activities; future prices and sales of, and demand for, our products; land entitlements and uses; permits; production capacity and operations; operating and overhead costs; future capital expenditures and their impact on us; operational and management changes (including changes in the Board of Directors); changes in business strategies, planning and tactics; future employment and contributions of personnel, including consultants; future land sales; investments, acquisitions, joint ventures, strategic alliances, business combinations, operational, tax, financial and restructuring initiatives, including the nature, timing and accounting for restructuring charges, derivative assets and liabilities and the impact thereof; contingencies; litigation, administrative or arbitration proceedings; environmental compliance and changes in the regulatory environment; offerings, limitations on sales or offering of equity or debt securities, including asset sales and associated costs; and future working capital, costs, revenues, business opportunities, debt levels, cash flows, margins, taxes, earnings and growth. These statements are based on assumptions and assessments made by our management considering their experience and their perception of historical and current trends, current conditions, possible future developments, and other factors they believe to be appropriate. Forward-looking statements are not guarantees, representations or warranties and are subject to risks and uncertainties, many of which are unforeseeable and beyond our control and could cause actual results, developments, and business decisions to differ materially from those contemplated by such forward-looking statements. Some of those risks and uncertainties include the risk factors set forth in our filings with the SEC and the following: adverse effects of climate changes or natural disasters; adverse effects of global or regional pandemic disease spread or other crises; global economic and capital market uncertainties; the speculative nature of gold or mineral exploration, mercury remediation and lithium, nickel and cobalt recycling, including risks of diminishing quantities or grades of qualified resources; operational or technical difficulties in connection with exploration or mercury remediation, metal recycling, processing or mining activities; costs, hazards and uncertainties associated with precious metal based activities, including environmentally friendly and economically enhancing clean mining and processing technologies, precious metal exploration, resource development, economic feasibility assessment and cash generating mineral production; costs, hazards and uncertainties associated with mercury remediation, metal recycling, processing or mining activities; contests over our title to properties; potential dilution to our stockholders from our stock issuances, recapitalization and balance sheet restructuring activities; potential inability to comply with applicable government regulations or law; adoption of or changes in legislation or regulations adversely affecting our businesses; permitting constraints or delays; ability to achieve the benefits of business opportunities that may be presented to, or pursued by, us, including those involving battery technology, mercury remediation technology and efficacy, quantum computing and advanced materials development, and development of cellulosic technology in bio-fuels and related carbon-based material production; ability to successfully identify, finance, complete and integrate acquisitions, joint ventures, strategic alliances, business combinations, asset sales, and investments that we may be party to in the future; changes in the United States or other monetary or fiscal policies or regulations; interruptions in our production capabilities due to capital constraints; equipment failures; fluctuation of prices for gold or certain other commodities (such as silver, zinc, lithium, nickel, cobalt, cyanide, water, diesel, gasoline and alternative fuels and electricity); changes in generally accepted accounting principles; adverse effects of war, mass shooting, terrorism and geopolitical events; potential inability to implement our business strategies; potential inability to grow revenues; potential inability to attract and retain key personnel; interruptions in delivery of critical supplies, equipment and raw materials due to credit or other limitations imposed by vendors; assertion of claims, lawsuits and proceedings against us; potential inability to satisfy debt and lease obligations; potential inability to maintain an effective system of internal controls over financial reporting; potential inability or failure to timely file periodic reports with the Securities and Exchange Commission; potential inability to list our securities on any securities exchange or market or maintain the listing of our securities; and work stoppages or other labor difficulties. Occurrence of such events or circumstances could have a material adverse effect on our business, financial condition, results of operations or cash flows, or the market price of our securities. All subsequent written and oral forward-looking statements by or attributable to us or persons acting on our behalf are expressly qualified in their entirety by these factors. Except as may be required by securities or other law, we undertake no obligation to publicly update or revise any forward-looking statements, whether because of new information, future events, or otherwise.

Neither this press release nor any related calls or discussions constitutes an offer to sell, the solicitation of an offer to buy or a recommendation with respect to any securities of the Company, the fund, or any other issuer.


 Contact information:


Comstock Inc.
P.O. Box 1118
Virginia City, NV 89440
www.comstock.inc

Corrado De Gasperis
Executive Chairman & CEO
Tel (775) 847-4755
degasperis@comstockmining.com

Zach Spencer
Director of External Relations
Tel (775) 847-5272 Ext.151
questions@comstockmining.com


Release – Vera Bradley Announces Second Quarter Fiscal Year 2023 Results


Vera Bradley Announces Second Quarter Fiscal Year 2023 Results

Research, News, and Market Data on Vera Bradley

Aug 31, 2022

Consolidated second quarter net revenues totaled $130.4 million

Second quarter net loss totaled ($29.8) million, or ($0.95) per diluted share; excluding certain items, non-GAAP net income totaled $2.4 million, or $0.08 per diluted share

Balance sheet remains solid, with cash and cash equivalents of $38.3 million and no debt

FORT WAYNE, Ind., Aug. 31, 2022 (GLOBE NEWSWIRE) — Vera Bradley, Inc. (Nasdaq: VRA) today announced its financial results for the second quarter ended July 30, 2022.

In this release, Vera Bradley, Inc. or “the Company” refers to the entire enterprise and includes both the Vera Bradley and Pura Vida brands. Vera Bradley on a stand-alone basis refers to the Vera Bradley brand.

Second Quarter Comments

Rob Wallstrom, Chief Executive Officer of the Company, commented, “While total Company second quarter revenues of $130.4 million were modestly below our expectations and we continued to experience gross margin pressure due to logistics costs, we drove product innovation at both Vera Bradley and Pura Vida, initiated meaningful cost reduction actions, and completed $6.0 million of share repurchases, while maintaining a solid, debt-free balance sheet.

“We are continuing to see bifurcation in the spending of our customer base. At Vera Bradley, Direct Full-Price Channel comparable revenues were nearly flat to last year and up double digits to fiscal 2020 as customers with higher household incomes remained engaged and continued to spend. However, inflationary pressures, especially higher gas prices, continued to negatively affect the purchases of customers with lower household incomes as well as traffic and spending in our Vera Bradley factory stores. Our Vera Bradley Indirect Channel continued to experience a healthy year-over-year rebound. Pura Vida’s ecommerce revenues continued to be affected by the shift in social and digital media effectiveness and escalating digital media costs.

“We are taking decisive actions to strengthen our core brands and the overall enterprise,” Wallstrom added. “We have begun implementation of annualized targeted cost reductions of $25 million, which are expected to be fully realized next fiscal year. These cost reductions will help offset inflationary expense pressures and the recessionary spending behavior from lower-income households. Expense savings are being derived across various areas of the Company, including retail store efficiencies, marketing expenses, information technology contracts, professional services, logistics and operational costs, and corporate payroll. In addition, we are continuing to evaluate and execute strategic price increases for both brands to offset rising raw material and freight costs.

“At the Vera Bradley brand, we remain confident in our core strategy, by continuing to innovate and build on our lifestyle merchandising focus. We will continue to optimize the travel category, which is nearly back to pre-pandemic levels; maximize back-to-campus opportunities, with strategic assortment enhancements; continue with powerful product collaborations like Disney and Harry Potter; and add excitement by expanding our footwear and home assortments this fall.”

Wallstrom continued, “At Pura Vida, we are focused on stabilizing the business and returning the brand to long-term growth. Our number one priority is to build a more diverse, innovative, effective, and performance-based marketing program to drive ecommerce sales. Prudent store growth can play a key role in driving new customer acquisition as we continue to diversify our marketing platforms, and stores demonstrate the power a retail presence can have on driving digital sales, omni-channel loyalty, and spending. We opened one new Pura Vida store location in the quarter, which is exceeding expectations.

“On the product front, we continue to build customer excitement and engagement through collaborations like Disney, Harry Potter, Hello Kitty, and the World Surf League; partnering with key influencers; offering themed-collections centered around key events like Shark Week; and the launch of our new demi-fine collection.”

Wallstrom further noted, “We are planning for the macro environment to remain challenging for the balance of the year and into next year. And, despite the strength in Pura Vida’s store business and opportunity for new store openings, we expect it to take time to return Pura Vida’s ecommerce business to growth as rebuilding and transforming the marketing program is underway. We are taking critical actions that will further strengthen both core brands and our company as a whole, not only to successfully manage through this period but position us for the future. Our teams are focused, and our cash position and balance sheet remain solid. We have successfully managed through difficult business cycles before, and I am confident we will manage through this period as well. We look forward to returning both brands to steady growth.”

Summary of Financial Performance for the Second Quarter

Consolidated net revenues totaled $130.4 million compared to $147.0 million in the prior year second quarter ended July 31, 2021.

For the current year second quarter, Vera Bradley, Inc.’s consolidated net loss totaled ($29.8) million, or ($0.95) per diluted share. These results included $32.2 million of net after tax charges, comprised of $18.2 million of Pura Vida goodwill and intangible asset impairment charges, $4.7 million of inventory adjustments associated with the exit of certain technology products and the write-off of excess mask inventory, $4.7 million of severance charges and other employee costs, $2.3 million of consulting fees associated with cost savings initiatives and the CEO search, $0.9 million of purchase order cancellation fees for spring 2023 goods, $0.6 million of store impairment charges, $0.5 million of intangible asset amortization, and $0.3 million of goodMRKT exit costs. On a non-GAAP basis, Vera Bradley, Inc.’s consolidated second quarter net income totaled $2.4 million, or $0.08 per diluted share.

For the prior year second quarter, Vera Bradley, Inc.’s consolidated net income totaled $9.1 million, or $0.26 per diluted share. These results included $0.4 million of net after tax charges related to intangible asset amortization. On a non-GAAP basis, Vera Bradley, Inc.’s consolidated second quarter net income totaled $9.5 million, or $0.28 per diluted share.

Summary of Financial Performance for the Six Months

Consolidated net revenues totaled $228.8 million for the current year six months ended July 30, 2022, compared to $256.1 million in the prior year six month period ended July 31, 2021.

For the current year six months, Vera Bradley, Inc.’s consolidated net loss totaled ($36.7) million, or ($1.15) per diluted share. These results included $33.1 million of net after tax charges, comprised of $18.2 million of Pura Vida goodwill and intangible asset impairment charges, $4.7 million of inventory adjustments associated with the exit of certain technology products and the write-off of excess mask inventory, $4.7 million of severance charges and other employee costs, $2.4 million of consulting fees associated with cost savings initiatives and the CEO search, $1.0 million of store and right-of-use asset impairment charges, $0.9 million of purchase order cancellation fees for spring 2023 goods, $0.9 million of intangible asset amortization, and $0.3 million of goodMRKT exit costs. On a non-GAAP basis, Vera Bradley, Inc.’s consolidated net loss for the six months totaled ($3.6) million, or ($0.11) per diluted share.

For the prior year six months, Vera Bradley, Inc’s consolidated net income totaled $6.9 million, or $0.20 per diluted share. These results included $0.9 million of net after tax charges related to intangible asset amortization. On a non-GAAP basis, excluding these charges, Vera Bradley, Inc.’s consolidated net income for the prior year totaled $7.8 million, or $0.23 per diluted share, for the six months.

Non-GAAP Numbers

The current year non-GAAP second quarter and six-month income statement numbers referenced below exclude the previously outlined goodwill and intangible asset impairment charges, inventory adjustments, severance charges and other employee costs, consulting fees, store and right-of-use asset impairment charges, purchase order cancellation fees, intangible asset amortization, and goodMRKT exit costs. The prior year non-GAAP second quarter and six-month income statement numbers referenced below exclude the previously outlined intangible asset amortization.

Second Quarter Details

Current year second quarter Vera Bradley Direct segment revenues totaled $87.0 million, a 10.4% decrease from $97.1 million in the prior year second quarter. Comparable sales declined 13.8% in the second quarter. The Company permanently closed eight full-line stores and opened six factory outlet stores in the last twelve months.

Vera Bradley Indirect segment revenues totaled $17.3 million, a 2.9% increase over $16.8 million in the prior year second quarter, reflecting an increase in certain key account orders.

Pura Vida segment revenues totaled $26.0 million, a 21.3% decrease from $33.1 million in the prior year.

Second quarter consolidated gross profit totaled $60.5 million, or 46.4% of net revenues, compared to $80.4 million, or 54.6% of net revenues, in the prior year. On a non-GAAP basis, current year gross profit totaled $67.8 million, or 52.0% of net revenues. The current year gross profit rate was negatively impacted by higher inbound and outbound freight expense, deleverage of overhead costs, and channel mix changes, partially offset by price increases.

Second quarter consolidated SG&A expense totaled $74.0 million, or 56.8% of net revenues, compared to $68.7 million, or 46.7% of net revenues, in the prior year. On a non-GAAP basis, consolidated SG&A expense totaled $64.0 million, or 49.1% of net revenues, for the current year second quarter, compared to $68.0 million, or 46.2% of net revenues, in the prior year. As expected, Vera Bradley’s non-GAAP SG&A current year expenses were lower than the prior year primarily due to a reduction in variable-related expenses due to the lower sales volume and other cost reduction initiatives.

The Company’s second quarter consolidated operating loss totaled ($42.8) million, or (32.8%) of net revenues, compared to consolidated operating income of $12.6 million, or 8.6% of net revenues, in the prior year second quarter. On a non-GAAP basis, the Company’s current year consolidated operating income totaled $3.9 million, or 3.0% of net revenues, compared to $13.4 million, or 9.1% of net revenues, in the prior year.

By segment:

  • Vera Bradley Direct operating income was $10.0 million, or 11.5% of Direct net revenues, for the second quarter, compared to $23.2 million, or 23.9% of Direct net revenues, in the prior year. On a non-GAAP basis, current year Direct operating income totaled $16.2 million, or 18.6% of Direct revenues.
  • Vera Bradley Indirect operating income was $3.9 million, or 22.6% of Indirect net revenues, compared to $5.6 million, or 33.3% of Indirect net revenues, in the prior year. On a non-GAAP basis, current year Indirect operating income totaled $4.9 million, or 28.4% of Indirect net revenues. 
  • Pura Vida’s operating loss was ($28.5) million, or (109.6%) of Pura Vida net revenues, in the current year, compared to operating income of $3.2 million, or 9.8% of Pura Vida net revenues, in the prior year. On a non-GAAP basis, Pura Vida’s operating income was $2.6 million, or 9.8% of Pura Vida net revenues, compared to $4.0 million, or 12.1% of Pura Vida net revenues, in the prior year.

Details for the Six Months

Vera Bradley Direct segment revenues for the current year six-month period totaled $148.6 million, a 9.3% decrease from $163.9 million in the prior year. Comparable sales declined 12.7% for the six months.

Vera Bradley Indirect segment revenues for the six months totaled $34.3 million, a 6.9% increase over $32.1 million, last year, reflecting an increase in certain key and specialty account orders.

Pura Vida segment revenues totaled $45.9 million, a 23.8% decline from $60.2 million in the prior year.

Consolidated gross profit for the six months totaled $113.0 million, or 49.4% of net revenues, compared to $139.5 million, or 54.5% of net revenues, in the prior year. On a non-GAAP basis, current year gross profit totaled $120.3 million, or 52.6% of net revenues. The current year gross profit rate was negatively affected by higher inbound and outbound freight expense, deleverage of overhead costs, and channel mix changes, partially offset by price increases.

For the six months, consolidated SG&A expense totaled $135.0 million, or 59.0% of net revenues, compared to $129.6 million, or 50.6% of net revenues, in the prior year. On a non-GAAP basis, current year consolidated SG&A expense totaled $123.4 million, or 53.9% of net revenues, compared to $128.1 million, or 50.0% of net revenues, in the prior year. As expected, Vera Bradley’s non-GAAP SG&A current year expenses were lower than the prior year primarily due to a reduction in variable-related expenses due to the lower sales volume and other cost reduction initiatives.

For the six months, the Company’s consolidated operating loss totaled ($51.1) million, or (22.3%) of net revenues, compared to consolidated operating income of $10.7 million, or 4.2% of net revenues, in the prior year six-month period. On a non-GAAP basis, the Company’s current year consolidated operating loss was ($2.9) million, or (1.2%) of net revenues, compared to consolidated operating income of $12.2 million, or 4.8% or net revenues, in the prior year.

By segment:

  • Vera Bradley Direct operating income was $15.5 million, or 10.5% of Direct net revenues, compared to $34.0 million, or 20.8% of Direct net revenues, in the prior year. On a non-GAAP basis, current year Direct operating income was $21.7 million, or 14.6% of Direct net revenues.
  • Vera Bradley Indirect operating income was $9.4 million, or 27.4% of Indirect net revenues, compared to $10.1 million, or 31.3% of Indirect net revenues, in the prior year. On a non-GAAP basis, current year Indirect operating income totaled $10.4 million, or 30.3% of Indirect net revenues.
  • Pura Vida’s operating loss was ($27.5) million, or (59.9%) of Pura Vida net revenues, for the current year, compared to operating income of $5.7 million, or 9.5% of Pura Vida net revenues, in the prior year. On a non-GAAP basis, Pura Vida’s operating income was $4.4 million, or 9.5% of Pura Vida net revenues, compared to $7.3 million, or 12.1% of Pura Vida net revenues, in the prior year.

Balance Sheet

Net capital spending for the second quarter and six months totaled $2.7 million and $4.4 million, respectively.

Cash, cash equivalents, and investments as of July 30, 2022 totaled $38.3 million compared to $76.5 million at the end of last year’s second quarter. The Company had no borrowings on its $75 million ABL credit facility at quarter end.

Total quarter-end inventory was $179.6 million, compared to $148.0 million at the end of the second quarter last year. Current year inventory was higher than the prior year primarily due to approximately $24.0 million of additional inventory in-transit as the Company continues to navigate delays in the supply chain and ensures it has adequate inventory coverage going into the fall and holiday selling periods.

During the second quarter, the Company repurchased approximately $6.0 million of its common stock (approximately 1.0 million shares at an average price of $6.11), bringing year-to-date purchases through the end of the second quarter to approximately $16.5 million (approximately 2.4 million shares at an average price of $6.84). The Company has $29.3 million of remaining availability under its $50.0 million repurchase authorization that expires in December 2024.

Forward Outlook

Wallstrom also commented, “We expect the challenging macroeconomic environment to continue for the balance of the year and anticipate it will take additional time to return the Pura Vida ecommerce business to growth, high gas prices and other inflationary pressures will continue to impact the Vera Bradley factory channel, and there will be continued pressure on gross margin. Therefore, we believe it is appropriate to further adjust our outlook for the fiscal year.”

Excluding net revenues, all forward-looking guidance numbers referenced below are non-GAAP. The prior year SG&A and earnings per diluted share numbers exclude the previously disclosed net charges related to intangible asset amortization. Current year guidance excludes previously disclosed goodwill impairment charges, inventory adjustments, severance and other employee costs, consulting fees, store and right-of-use asset impairment charges, purchase order cancellation fees, intangible asset amortization, goodMRKT exit costs, and any similar charges.

For Fiscal 2023, the Company’s updated expectations are as follows:

  • Consolidated net revenues of $480 to $490 million. Net revenues totaled $540.5 million in Fiscal 2022. Year-over-year Vera Bradley revenues are expected to decline between 7% and 9%, and Pura Vida revenues are expected to decline between 16% and 21%.
  • A consolidated gross profit percentage of 53.7% to 54.1% compared to 53.3% in Fiscal 2022. The expected year-over-year increase is primarily related to incremental inbound and outbound freight expense and expected deleverage on overhead costs, more than offset by price increases.
  • Consolidated SG&A expense of $246 to $250 million compared to $258.8 million in Fiscal 2022. The reduction in SG&A expense is being driven by cost reduction initiatives and a reduction in compensation expense, marketing, and other variable-related expenses due to the expected sales decline from the prior year.
  • Consolidated operating income of $11.6 to $14.5 million compared to $30.1 million in Fiscal 2022.
  • Consolidated diluted EPS of $0.20 to $0.28 based on diluted weighted-average shares outstanding of 31.6 million and an effective tax rate of between 24.0 and 25.0%. Diluted EPS totaled $0.57 last year.
  • Net capital spending of approximately $8 to $10 million compared to $5.5 million in the prior year, reflecting investments associated with new Vera Bradley factory and Pura Vida store locations and technology and logistics enhancements.

Disclosure Regarding Non-GAAP Measures

The Company’s management does not, nor does it suggest that investors should, consider the supplemental non-GAAP financial measures in isolation from, or as a substitute for, financial information prepared in accordance with accounting principles generally accepted in the United States (“GAAP”). Further, the non-GAAP measures utilized by the Company may be unique to the Company, as they may be different from non-GAAP measures used by other companies.

The Company believes that the non-GAAP measures presented in this earnings release, including free cash flow; cost of sales; gross profit; selling, general, and administrative expenses; impairment of goodwill and intangible assets; operating (loss) income; net (loss) income; net (loss) income attributable and available to Vera Bradley, Inc.; and diluted net (loss) income per share available to Vera Bradley, Inc. common shareholders, along with the associated percentages of net revenues, are helpful to investors because they allow for a more direct comparison of the Company’s year-over-year performance and are consistent with management’s evaluation of business performance. A reconciliation of the non-GAAP measures to the most directly comparable GAAP measures can be found in the Company’s supplemental schedules included in this earnings release. A recast of the supplemental schedule for the current year first quarter has been provided to exclude the consulting fees related to the cost savings initiatives for consistency with the current year second quarter supplemental schedule.

Call Information

A conference call to discuss results for the second quarter is scheduled for today, Wednesday, August 31, 2022, at 9:30 a.m. Eastern Time. A broadcast of the call will be available via Vera Bradley’s Investor Relations section of its website, www.verabradley.com. Alternatively, interested parties may dial into the call at (800) 437-2398, and enter the access code 3589431. A replay will be available shortly after the conclusion of the call and remain available through September 14, 2022. To access the recording, listeners should dial (844) 512-2921, and enter the access code 3589431.

About Vera Bradley, Inc.

Vera Bradley, Inc. operates two unique lifestyle brands – Vera Bradley and Pura Vida. Vera Bradley and Pura Vida are complementary businesses, both with devoted, emotionally-connected, and multi-generational female customer bases; alignment as casual, comfortable, affordable, and fun brands; positioning as “gifting” and socially-connected brands; strong, entrepreneurial cultures; a keen focus on community, charity, and social consciousness; multi-channel distribution strategies; and talented leadership teams aligned and committed to the long-term success of their brands.

Vera Bradley, based in Fort Wayne, Indiana, is a leading designer of women’s handbags, luggage and other travel items, fashion and home accessories, and unique gifts. Founded in 1982 by friends Barbara Bradley Baekgaard and Patricia R. Miller, the brand is known for its innovative designs, iconic patterns, and brilliant colors that inspire and connect women unlike any other brand in the global marketplace.

In July 2019, Vera Bradley, Inc. acquired a 75% interest in Creative Genius, Inc., which also operates under the name Pura Vida Bracelets (“Pura Vida”). Pura Vida, based in La Jolla, California, is a digitally native, highly-engaging lifestyle brand founded in 2010 by friends Paul Goodman and Griffin Thall. Pura Vida has a differentiated and expanding offering of bracelets, jewelry, and other lifestyle accessories.

The Company has three reportable segments: Vera Bradley Direct (“VB Direct”), Vera Bradley Indirect (“VB Indirect”), and Pura Vida. The VB Direct business consists of sales of Vera Bradley products through Vera Bradley full-line and factory outlet stores in the United States, verabradley.com, verabradley.ca, Vera Bradley’s online outlet site, and the Vera Bradley annual outlet sale in Fort Wayne, Indiana. The VB Indirect business consists of sales of Vera Bradley products to approximately 1,700 specialty retail locations throughout the United States, as well as select department stores, national accounts, third party e-commerce sites, and third-party inventory liquidators, and royalties recognized through licensing agreements related to the Vera Bradley brand. The Pura Vida segment consists of sales of Pura Vida products through the Pura Vida websites, www.puravidabracelets.comwww.puravidabracelets.eu, and 
www.puravidabracelets.ca; through the distribution of its products to wholesale retailers and department stores; and through its two Pura Vida retail stores.

Website Information

We routinely post important information for investors on our website 
www.verabradley.com in the “Investor Relations” section. We intend to use this webpage as a means of disclosing material, non-public information and for complying with our disclosure obligations under Regulation FD. Accordingly, investors should monitor the Investor Relations section of our website, in addition to following our press releases, SEC filings, public conference calls, presentations and webcasts. The information contained on, or that may be accessed through, our webpage is not incorporated by reference into, and is not a part of, this document.

Investors and other interested parties may also access the Company’s most recent Corporate Responsibility and Sustainability Report outlining its ESG (Environmental, Social, and Governance) initiatives at https://verabradley.com/pages/corporate-responsibility.

Vera Bradley Safe Harbor Statement

Certain statements in this release are “forward-looking statements” made pursuant to the safe-harbor provisions of the Private Securities Litigation Reform Act of 1995. Such forward-looking statements reflect the Company’s current expectations or beliefs concerning future events and are subject to various risks and uncertainties that may cause actual results to differ materially from those that we expected, including: possible adverse changes in general economic conditions and their impact on consumer confidence and spending; possible inability to predict and respond in a timely manner to changes in consumer demand; possible loss of key management or design associates or inability to attract and retain the talent required for our business; possible inability to maintain and enhance our brands; possible inability to successfully implement the Company’s long-term strategic plan; possible inability to successfully open new stores, close targeted stores, and/or operate current stores as planned; incremental tariffs or adverse changes in the cost of raw materials and labor used to manufacture our products; possible adverse effects resulting from a significant disruption in our distribution facilities; or business disruption caused by COVID-19 or other pandemics. Risks, uncertainties, and assumptions also include the possibility that Pura Vida acquisition benefits may not materialize as expected and that Pura Vida’s business may not perform as expected. More information on potential factors that could affect the Company’s financial results is included from time to time in the “Risk Factors” and “Management’s Discussion and Analysis of Financial Condition and Results of Operations” sections of the Company’s public reports filed with the SEC, including the Company’s Form 10-K for the fiscal year ended January 29, 2022. We undertake no obligation to publicly update or revise any forward-looking statement. Financial schedules are attached to this release.

CONTACTS:
Investors:

Julia Bentley, VP of Investor Relations and Communications
jbentley@verabradley.com
(260) 207-5116

Media:
mediacontact@verabradley.com
877-708-VERA (8372)


Vera Bradley, Inc.

Condensed Consolidated Balance Sheets

(in thousands)

(unaudited)


July 30, 2022


January 29, 2022


July 31, 2021

Assets


Current assets:


Cash and cash equivalents

$

38,321


$

88,436


$

75,753


Short-term investments


727


Accounts receivable, net


25,593


20,681


29,897


Inventories


179,557


144,881


148,048


Income taxes receivable


5,113


9,391


6,289


Prepaid expenses and other current assets


16,913


15,928


15,627


Total current assets


265,497


279,317


276,341


Operating right-of-use assets


85,793


79,873


86,617


Property, plant, and equipment, net


60,305


59,941


62,350


Intangible assets, net


32,769


44,223


45,759


Goodwill


24,833


44,254


44,254


Deferred income taxes


9,276


3,857


3,294


Other assets


4,748


6,081


6,444


Total assets

$

483,221


$

517,546


$

525,059


Liabilities, Redeemable Noncontrolling Interest, and Shareholders’ Equity


Current liabilities:


Accounts payable

$

43,722


$

30,492


$

30,247


Accrued employment costs


16,018


12,463


15,465


Short-term operating lease liabilities


19,768


18,699


20,584


Other accrued liabilities


21,526


16,422


17,522


Income taxes payable


374


Total current liabilities


101,408


78,076


83,818


Long-term operating lease liabilities


84,015


80,861


87,984


Other long-term liabilities


157


195


71


Total liabilities


185,580


159,132


171,873


Redeemable noncontrolling interest


23,491


30,974


30,364


Shareholders’ equity:


Additional paid-in-capital


107,941


107,907


106,455


Retained earnings


297,623


334,364


323,431


Accumulated other comprehensive loss


(135

)


(29

)


(4

)

Treasury stock


(131,279

)


(114,802

)


(107,060

)

Total shareholders’ equity of Vera Bradley, Inc.


274,150


327,440


322,822


Total liabilities, redeemable noncontrolling interest, and shareholders’ equity

$

483,221


$

517,546


$

525,059


Vera Bradley, Inc.


Condensed Consolidated Statements of Operations


(in thousands, except per share amounts)


(unaudited)


Thirteen Weeks Ended


Twenty-Six Weeks Ended


July 30, 2022


July 31, 2021


July 30, 2022


July 31, 2021


Net revenues

$

130,371


$

147,048


$

228,830


$

256,142


Cost of sales


69,854


66,687


115,799


116,617


Gross profit


60,517


80,361


113,031


139,525


Selling, general, and administrative expenses


74,042


68,729


134,956


129,625


Impairment of goodwill and intangible assets


29,338


29,338


Other income, net


42


1,016


209


789


Operating (loss) income


(42,821

)


12,648


(51,054

)


10,689


Interest expense, net


36


119


76


209


Income (loss) before income taxes


(42,857

)


12,529


(51,130

)


10,480


Income tax (benefit) expense


(5,956

)


2,672


(7,519

)


2,141


Net (loss) income


(36,901

)


9,857


(43,611

)


8,339


Less: Net (loss) income attributable to redeemable noncontrolling interest


(7,134

)


807


(6,870

)


1,434


Net (loss) income attributable to Vera Bradley, Inc.

$

(29,767

)


$

9,050


$

(36,741

)


$

6,905


Basic weighted-average shares outstanding


31,429


34,001


32,051


33,795


Diluted weighted-average shares outstanding


31,429


34,500


32,051


34,502


Basic net (loss) income per share available to Vera Bradley, Inc. common shareholders

$

(0.95

)


$

0.27


$

(1.15

)


$

0.20


Diluted net (loss) income per share available to Vera Bradley, Inc. common shareholders

$

(0.95

)


$

0.26


$

(1.15

)


$

0.20


Vera Bradley, Inc.

Condensed Consolidated Statements of Cash Flows

(in thousands)

(unaudited)


Twenty-Six Weeks Ended


July 30,

2022


July 31,

2021

Cash flows from operating activities


Net (loss) income

$

(43,611

)


$

8,339


Adjustments to reconcile net (loss) income to net cash (used in) provided by operating activities:


Depreciation of property, plant, and equipment


4,371


4,514


Amortization of operating right-of-use assets


10,621


10,026


Goodwill and intangible asset impairment


29,338


Other impairment charges


1,351


Amortization of intangible assets


1,537


1,537


Provision for doubtful accounts


(119

)


26


Stock-based compensation


1,444


3,372


Deferred income taxes


(5,419

)


236


Other non-cash gain, net


(45

)

Changes in assets and liabilities:


Accounts receivable


(4,793

)


(2,380

)

Inventories


(34,676

)


(6,632

)

Prepaid expenses and other assets


348


2,153


Accounts payable


12,759


2,696


Income taxes


4,652


762


Operating lease liabilities, net


(12,910

)


(13,202

)

Accrued and other liabilities


7,989


5,085


Net cash (used in) provided by operating activities


(27,118

)


16,487


Cash flows from investing activities


Purchases of property, plant, and equipment


(4,391

)


(2,281

)

Proceeds from maturities and sales of investments


565


Proceeds from disposal of property, plant, and equipment


45


Net cash used in investing activities


(4,391

)


(1,671

)


Cash flows from financing activities


Tax withholdings for equity compensation


(1,410

)


(2,350

)

Repurchase of common stock


(16,477

)


Distributions to redeemable noncontrolling interest


(613

)


(879

)

Net cash used in financing activities


(18,500

)


(3,229

)

Effect of exchange rate changes on cash and cash equivalents


(106

)


(9

)


Net (decrease) increase in cash and cash equivalents

$

(50,115

)


$

11,578


Cash and cash equivalents, beginning of period


88,436


64,175


Cash and cash equivalents, end of period

$

38,321


$

75,753


Vera Bradley, Inc.

First Quarter Fiscal 2023

GAAP to Non-GAAP Reconciliation Thirteen Weeks Ended April 30, 2022

(in thousands, except per share amounts)

(unaudited)


Thirteen Weeks Ended


As Reported


Other Items


Non-GAAP (Excluding Items)


Gross profit

$

52,514


$


$

52,514


Selling, general, and administrative expenses


60,914


1,511


1


59,403


Impairment of goodwill and intangible assets


Operating loss


(8,233

)


(1,511

)


(6,722

)


Loss before income taxes


(8,273

)


(1,511

)


(6,762

)


Income tax benefit


(1,563

)


(375

)

2


(1,188

)


Net loss


(6,710

)


(1,136

)


(5,574

)


Less: Net income (loss) attributable to redeemable noncontrolling interest


264


(192

)


456


Net loss attributable to Vera Bradley, Inc.


(6,974

)


(944

)


(6,030

)


Diluted net loss per share available to Vera Bradley, Inc. common shareholders

$

(0.21

)


$

(0.03

)


$

(0.18

)


Vera Bradley Direct segment operating income

$

5,503


$


$

5,503


Vera Bradley Indirect segment operating income

$

5,479


$


$

5,479


Pura Vida segment operating income (loss)

$

1,056


$

(769

)

3

$

1,825


Unallocated corporate expenses

$

(20,271

)


$

(742

)

4

$

(19,529

)


1Items include $769 for the amortization of definite-lived intangible assets; $592 for a right-of-use asset impairment charge; and $150 for consulting fees associated with cost savings initiatives


2Related to the tax impact of the charges mentioned above


3Related to the amortization of definite-lived intangible assets


4Related to $592 for a right-of-use asset impairment charge and $150 for consulting fees associated with cost savings initiatives


Vera Bradley, Inc.

Second Quarter Fiscal 2023

GAAP to Non-GAAP Reconciliation Thirteen Weeks Ended July 30, 2022

(in thousands, except per share amounts)

(unaudited)


Thirteen Weeks Ended


As Reported


Other Items


Non-GAAP (Excluding Items)


Gross profit (loss)

$

60,517


$

(7,276

)

1

$

67,793


Selling, general, and administrative expenses


74,042


10,076


2


63,966


Impairment of goodwill and intangible assets


29,338


29,338


Operating (loss) income


(42,821

)


(46,690

)


3,869


(Loss) Income before income taxes


(42,857

)


(46,690

)


3,833


Income tax (benefit) expense


(5,956

)


(6,760

)

3


804


Net (loss) income


(36,901

)


(39,930

)


3,029


Less: Net (loss) income attributable to redeemable noncontrolling interest


(7,134

)


(7,771

)


637


Net (loss) income attributable to Vera Bradley, Inc.


(29,767

)


(32,159

)


2,392


Diluted net (loss) income per share available to Vera Bradley, Inc. common shareholders

$

(0.95

)


$

(1.02

)


$

0.08


Vera Bradley Direct segment operating income (loss)

$

10,044


$

(6,173

)

4

$

16,217


Vera Bradley Indirect segment operating income (loss)

$

3,918


$

(994

)

5

$

4,912


Pura Vida segment operating (loss) income

$

(28,534

)


$

(31,085

)

6

$

2,551


Unallocated corporate expenses

$

(28,249

)


$

(8,438

)

7

$

(19,811

)


1Items include $6,142 for inventory adjustments associated with the exit of certain technology products and the goodMRKT brand, as well as excess mask products and $1,134 for PO cancellation fees


2Items include $5,714 for severance charges; $2,755 for consulting fees associated with cost savings initiatives and CEO search; $768 for the amortization of definite-lived intangible assets; $759 for store impairment charges; and $80 for goodMRKT brand exit costs


3Related to the tax impact of the charges mentioned above, as well as goodwill and intangible asset impairment charges


4Related to $5,097 related to an allocation for certain inventory adjustments and PO cancellation fees; $759 for store impairment charges; $302 for goodMRKT brand exit costs; and $15 for severance charges


5Related to an allocation for certain inventory adjustments and PO cancellation fees


6Related to $29,338 of goodwill and intangible asset impairment charges; $963 for inventory adjustments associated with mask products; $768 for the amortization of definite-lived intangible assets; and $16 for severance charges


7Related to $5,683 for severance charges and $2,755 for consulting fees associated with cost savings initiatives and CEO search


Vera Bradley, Inc.

Second Quarter Fiscal 2022

GAAP to Non-GAAP Reconciliation Thirteen Weeks Ended July 31, 2021

(in thousands, except per share amounts)

(unaudited)


Thirteen Weeks Ended


As Reported


Other Items


Non-GAAP (Excluding Items)


Gross profit

$

80,361


$


$

80,361


Selling, general, and administrative expenses


68,729


768


1


67,961


Operating income (loss)


12,648


(768

)


13,416


Income (loss) before income taxes


12,529


(768

)


13,297


Income tax expense (benefit)


2,672


(130

)


2,802


Net income (loss)


9,857


(638

)


10,495


Less: Net income (loss) attributable to redeemable noncontrolling interest


807


(192

)


999


Net income (loss) attributable to Vera Bradley, Inc.


9,050


(446

)


9,496


Diluted net income (loss) per share available to Vera Bradley, Inc. common shareholders

$

0.26


$

(0.01

)


$

0.28


Vera Bradley Direct segment operating income

$

23,168


$


$

23,168


Vera Bradley Indirect segment operating income

$

5,601


$


$

5,601


Pura Vida segment operating income (loss)

$

3,226


$

(768

)

1

$

3,994


Unallocated corporate expenses

$

(19,347

)


$


$

(19,347

)


1Includes the amortization of definite-lived intangible assets


Vera Bradley, Inc.

GAAP to Non-GAAP Reconciliation Twenty-Six Weeks Ended July 30, 2022

(in thousands, except per share amounts)

(unaudited)


Twenty-Six Weeks Ended


As Reported


Other Items


Non-GAAP (Excluding Items)


Gross profit (loss)

$

113,031


$

(7,276

)

1

$

120,307


Selling, general, and administrative expenses


134,956


11,587


2


123,369


Impairment of goodwill and intangible assets


29,338


29,338


Operating loss


(51,054

)


(48,201

)


(2,853

)


Loss before income taxes


(51,130

)


(48,201

)


(2,929

)


Income tax benefit


(7,519

)


(7,135

)

3


(384

)


Net loss


(43,611

)


(41,066

)


(2,545

)


Less: Net (loss) income attributable to redeemable noncontrolling interest


(6,870

)


(7,963

)


1,093


Net loss attributable to Vera Bradley, Inc.


(36,741

)


(33,103

)


(3,638

)


Diluted net loss per share available to Vera Bradley, Inc. common shareholders

$

(1.15

)


$

(1.03

)


$

(0.11

)


Vera Bradley Direct segment operating income (loss)

$

15,547


$

(6,173

)

4

$

21,720


Vera Bradley Indirect segment operating income (loss)

$

9,397


$

(994

)

5

$

10,391


Pura Vida segment operating (loss) income

$

(27,478

)


$

(31,854

)

6

$

4,376


Unallocated corporate expenses

$

(48,520

)


$

(9,180

)

7

$

(39,340

)


1Items include $6,142 for inventory adjustments associated with the exit of certain technology products and the goodMRKT brand, as well as excess mask products and $1,134 for PO cancellation fees


2Items include $5,714 for severance charges; $2,905 for consulting fees associated with cost savings initiatives and CEO search; $1,537 for the amortization of definite-lived intangible assets; $1,351 for store and right-of-use asset impairment charges; and $80 for goodMRKT brand exit costs


3Related to the tax impact of the charges mentioned above, as well as goodwill and intangible asset impairment charges


4Related to $5,097 related to an allocation for certain inventory adjustments and PO cancellation fees; $759 for store impairment charges; $302 for goodMRKT brand exit costs; and $15 for severance charges


5Related to an allocation for certain inventory adjustments and PO cancellation fees


6Related to $29,338 of goodwill and intangible asset impairment charges; $963 for inventory adjustments associated with mask products; $1,537 for the amortization of definite-lived intangible assets; and $16 for severance charges


7Related to $5,683 for severance charges; $2,905 for consulting fees associated with cost savings initiatives and CEO search; and $592 for a right-of-use asset impairment charge


Vera Bradley, Inc.

GAAP to Non-GAAP Reconciliation Twenty-Six Weeks Ended July 31, 2021

(in thousands, except per share amounts)

(unaudited)


Twenty-Six Weeks Ended


As Reported


Other Items


Non-GAAP (Excluding Items)


Gross profit

$

139,525


$


$

139,525


Selling, general, and administrative expenses


129,625


1,537


1


128,088


Operating income (loss)


10,689


(1,537

)


12,226


Income (loss) before income taxes


10,480


(1,537

)


12,017


Income tax expense (benefit)


2,141


(293

)


2,434


Net income (loss)


8,339


(1,244

)


9,583


Less: Net income (loss) attributable to redeemable noncontrolling interest


1,434


(384

)


1,818


Net income (loss) attributable to Vera Bradley, Inc.


6,905


(860

)


7,765


Diluted net income (loss) per share available to Vera Bradley, Inc. common shareholders

$

0.20


$

(0.02

)


$

0.23


Vera Bradley Direct segment operating income

$

34,028


$


$

34,028


Vera Bradley Indirect segment operating income

$

10,062


$


$

10,062


Pura Vida segment operating income (loss)

$

5,734


$

(1,537

)

1

$

7,271


Unallocated corporate expenses

$

(39,135

)


$


$

(39,135

)


1Includes the amortization of definite-lived intangible assets


Release – Orion Group Holdings Names Scott Thanisch as Executive Vice President and Chief Financial Officer


Orion Group Holdings Names Scott Thanisch as Executive Vice President and Chief Financial Officer

Research, News, and Market Data on Orion Group Holdings

August 31, 2022 16:31 ET 

HOUSTON, Aug. 31, 2022 (GLOBE NEWSWIRE) — Orion Group
Holdings, Inc. 

(NYSE: ORN) (the “Company”), a leading specialty construction company, today announced that Scott Thanisch has been named Executive Vice President and Chief Financial Officer and will assume his new duties on September 12, 2022.

Mr. Thanisch is an operationally focused executive with broad experience in global corporate finance and proven results in corporate value creation. He is a skilled change agent with the ability to identify opportunities and take decisive action. He is also a seasoned leader able to recruit, coach and develop finance talent. He comes to Orion after serving as the Chief Financial Officer of a Texas commercial construction services company and a transport services, maintenance, and repair company, having previously held various related positions in other industries. He holds a Bachelor of Business Administration degree from The University of Texas at Austin, where he was a National Merit Scholar, and holds a Master of Business Administration degree from Southern Methodist University.

Austin Shanfelter, the Company’s Interim Chief Executive Officer stated, “Scott joining our management team is a defining step forward for our company. He and Travis Boone (the Company’s incoming President and Chief Executive Officer) each bring a wealth of varied experience that will coalesce around the future growth of Orion. Scott is a seasoned financial professional with a proven track record of adding value and leading teams and is therefore well-suited to be able to help take advantage of this important opportunity. On behalf of the board of directors and the Orion Group Holdings’ employees, we are pleased to welcome Scott as our new Executive Vice President and Chief Financial Officer.”

Mr. Thanisch stated, “I am genuinely excited to join Travis and the Orion Group team at this time of significant opportunity for the Company. Orion’s unique capabilities and strengths position the Company as a key partner in the marine infrastructure, industrial, and building sectors. I feel privileged and look forward to serving Orion’s stakeholders, customers, and employees as we implement our strategic priorities to accelerate growth and value creation.”

Mr. Boone described his passion for the construction industry and stated that he is looking forward to working with such a seasoned finance professional, adding that he and Scott will focus on improving performance and increasing stockholder, customer, and team member value. He also expressed confidence in the Company’s ability to take advantage of the numerous transformational opportunities on the horizon.

About Orion Group Holdings, Inc.

Orion Group Holdings, Inc., a leading specialty construction company serving the infrastructure, industrial and building sectors, provides services both on and off the water in the continental United States, Alaska, Canada and the Caribbean Basin through its marine segment and its concrete segment. The Company’s marine segment provides construction and dredging services relating to marine transportation facility construction, marine pipeline construction, marine environmental structures, dredging of waterways, channels and ports, environmental dredging, design, and specialty services. Its concrete segment provides turnkey concrete construction services including pour and finish, dirt work, layout, forming, rebar, and mesh across the light commercial, structural and other associated business areas. The Company is headquartered in Houston, Texas with regional offices throughout its operating areas.

Forward-Looking Statements

The matters discussed in this press release may constitute or include projections or other forward-looking statements within the meaning of the Private Securities Litigation Reform Act of 1995, the provisions of which the Company is availing itself. Certain forward-looking statements can be identified by the use of forward-looking terminology, such as ‘believes’, ‘expects’, ‘may’, ‘will’, ‘could’, ‘should’, ‘seeks’, ‘approximately’, ‘intends’, ‘plans’, ‘estimates’, or ‘anticipates’, or the negative thereof or other comparable terminology, or by discussions of strategy, plans, objectives, intentions, estimates, forecasts, outlook, assumptions, or goals. In particular, statements regarding future operations or results, including those set forth in this press release and any other statement, express or implied, concerning future operating results or the future generation of or ability to generate revenues, income, net income, profit, EBITDA, EBITDA margin, or cash flow, including to service debt, and including any estimates, forecasts or assumptions regarding future revenues or revenue growth, are forward-looking statements. Forward looking statements also include estimated project start date, anticipated revenues, and contract options which may or may not be awarded in the future. Forward looking statements involve risks, including those associated with the Company’s fixed price contracts that impacts profits, unforeseen productivity delays that may alter the final profitability of the contract, cancellation of the contract by the customer for unforeseen reasons, delays or decreases in funding by the customer, levels and predictability of government funding or other governmental budgetary constraints and any potential contract options which may or may not be awarded in the future, and are the sole discretion of award by the customer. Past performance is not necessarily an indicator of future results. In light of these and other uncertainties, the inclusion of forward-looking statements in this press release should not be regarded as a representation by the Company that the Company’s plans, estimates, forecasts, goals, intentions, or objectives will be achieved or realized. Readers are cautioned not to place undue reliance on these forward-looking statements, which speak only as of the date hereof. The Company assumes no obligation to update information contained in this press release whether as a result of new developments or otherwise.

Orion Group Holdings Inc.
Francis Okoniewski, Vice President Investor Relations
(346) 616-4138
fokoniewski@orn.net
www.oriongroupholdingsinc.com

Source: Orion Group Holdings, Inc.


New Battery Concept has a Cost Per Cell of About One-Sixth that of Lithium-Ion


Image Credit: Rebecca Miller (MIT)


A New Concept for Low-Cost Batteries

David L. Chandler | MIT News Office

As the world builds out ever larger installations of wind and solar power systems, the need is growing fast for economical, large-scale backup systems to provide power when the sun is down and the air is calm. Today’s lithium-ion batteries are still too expensive for most such applications, and other options such as pumped hydro require specific topography that’s not always available.

Now, researchers at MIT and elsewhere have developed a new kind of battery, made entirely from abundant and inexpensive materials, that could help to fill that gap.

The new battery architecture, which uses aluminum and sulfur as its two electrode materials, with a molten salt electrolyte in between, is described today in the journal Nature, in a paper by MIT Professor Donald Sadoway, along with 15 others at MIT and in China, Canada, Kentucky, and Tennessee.

“I wanted to invent something that was better, much better, than lithium-ion batteries for small-scale stationary storage, and ultimately for automotive [uses],” explains Sadoway, who is the John F. Elliott Professor Emeritus of Materials Chemistry.

In addition to being expensive, lithium-ion batteries contain a flammable electrolyte, making them less than ideal for transportation. So, Sadoway started studying the periodic table, looking for cheap, Earth-abundant metals that might be able to substitute for lithium. The commercially dominant metal, iron, doesn’t have the right electrochemical properties for an efficient battery, he says. But the second-most-abundant metal in the marketplace — and actually the most abundant metal on Earth — is aluminum. “So, I said, well, let’s just make that a bookend. It’s gonna be aluminum,” he says.

Then came deciding what to pair the aluminum with for the other electrode, and what kind of electrolyte to put in between to carry ions back and forth during charging and discharging. The cheapest of all the non-metals is sulfur, so that became the second electrode material. As for the electrolyte, “we were not going to use the volatile, flammable organic liquids” that have sometimes led to dangerous fires in cars and other applications of lithium-ion batteries, Sadoway says. They tried some polymers but ended up looking at a variety of molten salts that have relatively low melting points — close to the boiling point of water, as opposed to nearly 1,000 degrees Fahrenheit for many salts. “Once you get down to near body temperature, it becomes practical” to make batteries that don’t require special insulation and anticorrosion measures, he says.

The three ingredients they ended up with are cheap and readily available — aluminum, no different from the foil at the supermarket; sulfur, which is often a waste product from processes such as petroleum refining; and widely available salts. “The ingredients are cheap, and the thing is safe — it cannot burn,” Sadoway says.

In their experiments, the team
showed that the battery cells could endure hundreds of cycles at exceptionally
high charging rates, with a projected cost per cell of about one-sixth that of
comparable lithium-ion cells.
They showed that the charging rate was highly dependent on the working temperature, with 110 degrees Celsius (230 degrees Fahrenheit) showing 25 times faster rates than 25 C (77 F).

Surprisingly, the molten salt the team chose as an electrolyte simply because of its low melting point turned out to have a fortuitous advantage. One of the biggest problems in battery reliability is the formation of dendrites, which are narrow spikes of metal that build up on one electrode and eventually grow across to contact the other electrode, causing a short-circuit and hampering efficiency. But this particular salt, it happens, is very good at preventing that malfunction.

The chloro-aluminate salt they chose “essentially retired these runaway dendrites, while also allowing for very rapid charging,” Sadoway says. “We did experiments at very high charging rates, charging in less than a minute, and we never lost cells due to dendrite shorting.”

“It’s funny,” he says, because the whole focus was on finding a salt with the lowest melting point, but the catenated chloro-aluminates they ended up with turned out to be resistant to the shorting problem. “If we had started off with trying to prevent dendritic shorting, I’m not sure I would’ve known how to pursue that,” Sadoway says. “I guess it was serendipity for us.”

What’s more, the battery requires no external heat source to maintain its operating temperature. The heat is naturally produced electrochemically by the charging and discharging of the battery. “As you charge, you generate heat, and that keeps the salt from freezing. And then, when you discharge, it also generates heat,” Sadoway says. In a typical installation used for load-leveling at a solar generation facility, for example, “you’d store electricity when the sun is shining, and then you’d draw electricity after dark, and you’d do this every day. And that charge-idle-discharge-idle is enough to generate enough heat to keep the thing at temperature.”

This new battery formulation, he says, would be ideal for installations of about the size needed to power a single home or small to medium business, producing on the order of a few tens of kilowatt-hours of storage capacity.

For larger installations, up to utility scale of tens to hundreds of megawatt hours, other technologies might be more effective, including the liquid metal batteries Sadoway and his students developed several years ago and which formed the basis for a spinoff company called Ambri, which hopes to deliver its first products within the next year. For that invention, Sadoway was recently awarded this year’s European Inventor Award.

The smaller scale of the aluminum-sulfur batteries would also make them practical for uses such as electric vehicle charging stations, Sadoway says. He points out that when electric vehicles become common enough on the roads that several cars want to charge up at once, as happens today with gasoline fuel pumps, “if you try to do that with batteries and you want rapid charging, the amperages are just so high that we don’t have that amount of amperage in the line that feeds the facility.” So having a battery system such as this to store power and then release it quickly when needed could eliminate the need for installing expensive new power lines to serve these chargers.

The new technology is already the basis for a new spinoff company called Avanti, which has licensed the patents to the system, co-founded by Sadoway and Luis Ortiz ’96 ScD ’00, who was also a co-founder of Ambri. “The first order of business for the company is to demonstrate that it works at scale,” Sadoway says, and then subject it to a series of stress tests, including running through hundreds of charging cycles.

Would a battery based on sulfur run the risk of producing the foul odors associated with some forms of sulfur? Not a chance, Sadoway says. “The rotten-egg smell is in the gas, hydrogen sulfide. This is elemental sulfur, and it’s going to be enclosed inside the cells.” If you were to try to open up a lithium-ion cell in your kitchen, he says (and please don’t try this at home!), “the moisture in the air would react and you’d start generating all sorts of foul gases as well. These are legitimate questions, but the battery is sealed, it’s not an open vessel. So I wouldn’t be concerned about that.”

The research team included members from Peking University, Yunnan University and the Wuhan University of Technology, in China; the University of Louisville, in Kentucky; the University of Waterloo, in Canada; Oak Ridge National Laboratory, in Tennessee; and MIT. The work was supported by the MIT Energy Initiative, the MIT Deshpande Center for Technological Innovation, and ENN Group.


Reprinted with permission from MIT News ( http://news.mit.edu/)

Suggested Content


EV Inflation Outpacing Traditional Cars


Toward Batteries that Pack Twice as Much Energy Per Pound


Enough US Produced Lithium to Exceed Today’s Demand


Lithium Battery vs. Hydrogen Fuel Cell Vehicles


Stay up to date. Follow us:


Higher Education Among First to Embrace the Metaverse


Image Credit: Lilith Von Hexem (Flickr)


Six Benefits that the Metaverse Offers to Colleges and Universities

Even though it’s unclear what exactly the metaverse is and whether it even exists, colleges and universities have jumped onto the metaverse bandwagon. They have augmented in-person and remote video learning with features such as gamified interactive virtual worlds, virtual reality and mixed reality.

In one of the largest efforts thus far, 10 U.S. colleges and universities have teamed up with U.S. technology company Meta and Irish virtual reality platform Engage to create 3D digital versions of their campuses, known as a metaversity. Students will engage in learning wearing immersive virtual reality headsets.

This article was republished  with
permission from   The Conversation, a
news site dedicated to sharing ideas from academic experts. It represents the
research-based findings and thoughts of  Nir Kshetri,
Professor of Management, University of North Carolina – Greensboro.

In my recent research, I have examined the metaverse and how it affects organizations and societies. I see six benefits that the metaverse offers to colleges.


1. Makes educational resources affordable

Colleges are facing budget constraints and lack access to resources necessary for learning. The metaverse can help them overcome such constraints.

For example, Nashville, Tennessee-based Fisk University hasn’t purchased cadavers due to high costs and maintenance challenges. The university is enhancing its pre-med program with virtual reality cadavers, which are a more affordable alternative.

In the virtual reality lab, a human heart can be pulled out from a cadaver’s chest cavity. It creates the sense that students can feel the weight of the heart in their hands and examine it. They can enlarge it. The class sees and touches the ventricle walls. Students can compare different hearts to understand the results of health decisions that humans made when they were alive. They engage in discussion and agree on the correct diagnosis.


Fisk University is using virtual cadavers for its pre-med program. Fisk University

Virtual cadavers don’t degrade and are easy to maintain. Additional features, such as surgical procedures and comparative learning between humans and animals, can be added over time.


2. Enhances student performance

Virtual training provides an effective means of visually demonstrating concepts with step-by-step instructions to illustrate tasks. They provide opportunities for learning by doing. Immersion in games can increase  engagement in learning activities.

Atlanta’s Morehouse College has piloted a metaversity that involves courses in world history, biology and chemistry. The college found that virtual reality classes increased student satisfaction, engagement and achievement compared to traditional and online formats and increased students’ academic performance. For instance, the virtual reality world history class had a 10% increase in students’ GPAs compared with the same class taught via Zoom and face-to-face the year before.


3. Makes virtual interactions more like real ones

The internet performs well for sending emails, spreadsheets and PDFs from one device to another to be reviewed or modified independently and asynchronously. It wasn’t built for person-to-person type live and interactive experiences, especially with many participants. Likewise, virtual spaces such as Zoom mostly allow a single conversation. In physical events, participants can move fluidly from one conversation to another.

Some universities are using metaverse technologies to overcome limitations of the internet and video meeting tools. Metaverse-related technologies bridge the gap between real-life and virtual interactions by allowing people to interact more naturally.

Professors and students at the University of Chicago and the University of Pennsylvania use virtual meeting space Gather, which mimics features of real-life interactions. Users create avatars and navigate a virtual map that represents the physical environment, such as a building. The proximity chat feature make users feel that they are running into other students and professors in the hall. Users see and hear video and audio feeds of participants close to them. When they move away, the sounds cannot be heard and the video disappears. Unlike on Zoom, users aren’t forced to be in a single conversation. They can move fluidly between conversations as speakers or listeners.

The University of Pennsylvania’s computer and information science department used Gather to recreate Levine Hall, which is home to the department. The virtual building’s layout mimics classrooms, laboratories, elevators,  stairwells and other features of Levine Hall. The student-run hub of technological innovation, Weiss Tech House, has also been recreated virtually.

The Gather space accommodates 200 students and supports multiple conversations simultaneously. There are six virtual spaces that correspond the building’s six floors. Small groups can branch off into subgroups to work on tasks or engage in conversation.


4. Enables experimentation with hard-to-create phenomena

In some situations, learning in real-world environments, such as those involving chemical experiments and flying airplanes, is risky. In such cases, special equipment, such as virtual reality headsets, software and special gloves for haptic responses, can create immersive simulations of real environments. Learners feel as though the digital world is real.

These technologies can create scenarios that are impossible or impractical to create in the real world.

In Fisk University’s planned in-person history courses, students visit historically significant locations wearing virtual reality headsets. They include the Montgomery Bus Boycott; the Edmund Pettus Bridge in Selma, Alabama; the Lorraine Motel in Memphis, Tennessee; and the National Mall in Washington.

In chemistry classes, virtual reality allows visualization of how atoms are arranged in a protein. This insight helps pharmaceutical drug research.


5. Increases accessibility for remote students

Big gaps exist in higher education between rural and urban areas.

In 2015, 18% of men and 20% of women 25 and older living in rural areas of the U.S. had earned at least a bachelor’s degree compared with 32% and 33%, respectively, in urban areas.

Metaverse technologies can close this gap by making educational resources accessible to remote students. South Dakota State University expects that its metaversity will help reach the state’s rural students.


6. Attracts a young demographic

Children and young adults are the dominant populations in well-known metaverses, which are in the gaming sector.

About half of Roblox players are under 13 and 66% are under 16. Likewise, two-thirds of Fortnite’s players in 2021 were young adults. Compared with older generations, this demographic is more experience-driven and sees interesting and exciting learning opportunities in the metaverse.

Universities are using the metaverse to attract them. Southwestern Oregon Community College’s leaders think that its metaversity will increase enrollment. This is because higher proportions of younger generations, such as Generation Z, grew up with virtual reality technologies.

Younger generations show a higher level of interest and involvement in the metaverse. In a survey conducted in the U.S. in March 2022, 64% of Gen Z respondents were interested in having a digital avatar and 56% were interested in attending a music event in the metaverse. The proportions were 28% and 25% for baby boomers.

Unique experience provided by metaverse technologies, such as virtual reality, is thus appealing to younger generations and can become a key tool to attract them to universities.


Suggested Content


Why Zuckerberg Won’t be Adding a Cryptocurrency to Meta’s Features


Science Fiction Becoming Medicines Future


US and Chinese Authorities Reach Agreement to Prevent Delisting Chinese Stocks


Catalyst Series – BioSig Technologies (BSGM)

Stay up to date. Follow us:


Two-Thirds Through 2022 and Markets Still Dropping


Image Credit: Brecht Bug (Flickr)


Worst Year for Stocks and Bonds Just Four Months to Recover

At two-thirds of the way through 2022, both stocks and bonds individually are having their worst performance in decades. For investors that have followed conventional wisdom and diversified with a 60/40 portfolio, the downside hasn’t really been offset by the asset mix. Equities and fixed income have never both been down this much, together, this late in the year. While real estate levels are still up, the most popular market index levels, often chosen for retirement savings, are making up for many good years in a row where they both climbed.


2022 Has Been a Bear

When interest rates rise, and you own a bond with lower interest rate payments or an entire fund of bonds during declining interest rates, those holdings are now not as valuable. Potential investors decide what they will pay for bonds, and this is the price that allows them to earn current rates (present value), not yesterday’s rates. And that provides a discounted or lower price for buyer and seller.

Obviously, this is very similar for stocks and stock funds; the current market price is the most you can get for your holdings, without regard to how much you paid. And since the first opening bell in 2022, rates have risen with a high reached on June 14, but with a renewed promise of what Chairman Powell called “pain” going forward in the bond market. Since his August address, where he used the “P” word twice, bond prices have resumed their orderly march downward. Year-to-date, the U.S. Treasury index is down 10.56%, and a high-grade corporate bond index (LQD) is down 15.79%.


Source: Koyfin


Stocks have gone in the same downward direction this year. They tend to be faster and more volatile than bonds on the way up, and if you consider that, market interest rates have a theoretical floor of 0.00%, and potential gains for any bond are limited. With this, stocks are underperforming bonds negative returns. The S&P 500 has taken back 16.52% from investors since January, and the Nasdaq 100 is 50% worse than the S&P at a negative 24.45%.

Will this continue? Should investors maintain a 60/40 portfolio (60% stocks, 40% bonds)? Is it foolish to stay invested now?


Answers

As with most other investment forecasts, the true answer is that it can’t be known. But, what is known is the statistics of previous years. And from these stats, probabilities can be ballparked. Previous performance is no guarantee of future performance, but it truly is the best we have to go on. Even the 60/40 “ideal portfolio” was designed by looking backward and doing the math.

Looking back 50 years, there have only been three other years where both U.S. stocks and U.S. bonds (including government and corporate debt) were both in the red through August. The years were 1973, 1974 and 1981. In 2008 and 2015, U.S. Treasuries were green (flight to safety), while investment grade corporates were red with stocks.


Source: Koyfin


According to an analysis by Bespoke Analytics, never have the year-to-date losses been as severe for both bonds and stocks simultaneously going into September. This is uncharted territory – it is thus far the worst year.


Unchartered Waters

There is no history to look back on. Any seasoned investor (or even boater) will advise when in unchartered waters, you navigate slowly and pay attention to the currents and crosscurrents.

One current that promises to continue is fewer and available
dollars
in the system
for asset purchases and other investing. This is because the Fed has promised to increase its pace of quantitative
tightening
beginning in September. The impact is $billions less direct investment in bonds and less money in the economy. The intent and likely impact of this is to push interest rates up, bonds down, and slow spending so demand more closely matches the supply of goods, services, and labor without pushing up prices.

Crosscurrents related to the Fed reducing money supply are that higher interest rates bring higher costs to businesses that tend to have high borrowing needs. Another crosscurrent is that investors who had moved into stocks because yields were near 1% may begin to find the new higher
yields
attractive, even if, after inflation the investors are worse off. This would reduce the amount investors put in the stock market. 


When Might Stocks Trend Upward?

Looking at the 20-year chart above, one might wonder why any investor with the ability to wait would invest any place but in the stock market. Nasdaq 100 is the big loser so far during the past eight months, along with the other stock indices, this year’s fall off is small compared to the growth over a longer time horizon. The probabilities would suggest this growth will continue at some point.

When will it continue upward? When there are more buyers than sellers. This happens when the people that have been holding on waiting for a turnaround finally give up. This could be soon, so much bad news is already known, and the idea of a recession (or continued recession) is already baked into prices. This has been the worst year ever through August for stocks and bonds. Bonds, it has been promised, are likely to continue down; for stocks it may be that the markets have been too negative and that brighter news than forecast is in store.

Paul Hoffman

Managing Editor, Channelchek

Suggested Content

Why Interest Rates Will Keep Rising

Money Supply Drives Stock Market Performance


Powell Answered the Market’s Three Most Pressing Questions at Jackson Hole Symposium

Is Michael Burry Frustrated that the Market Hasn’t Yet Crashed?

Sources

https://www.bespoke.bm/

https://www.ramseysolutions.com/real-estate/real-estate-trends#:~:text=With%20most%20current%20real%20estate,in%202022%E2%80%94by%207%25

https://www.marketwatch.com/story/2022-has-been-the-worst-year-for-markets-so-far-in-at-least-50-years-11661887865?mod=taxes


Stay up to date. Follow us:


Baudax Bio (BXRX) – Priced Common Offering; Reducing Price Target

Wednesday, August 31, 2022

Baudax Bio (BXRX)
Priced Common Offering; Reducing Price Target

Baudax Bio is a pharmaceutical company focused on innovative products for acute care settings. ANJESO is the first and only 24-hour, intravenous (IV) COX-2 preferential non-steroidal anti-inflammatory (NSAID) for the management of moderate to severe pain. In addition to ANJESO, Baudax Bio has a pipeline of other innovative pharmaceutical assets including two novel neuromuscular blocking agents (NMBs) and a proprietary chemical reversal agent specific to these NMBs. For more information, please visit www.baudaxbio.com.

Gregory Aurand, Senior Research Analyst, Healthcare Services & Medical Devices, Noble Capital Markets, Inc.

Refer to the full report for the price target, fundamental analysis, and rating.

Priced $6.2 million offering. Late Monday, Baudax announced the pricing of its public offering. The offering of 11.819 million shares of common or pre-funded warrants at a public offering price of $0.525 per share were sold as a unit. Each share or warrant unit included a Series A-1 warrant to purchase one share at $0.525, and a Series A-2 warrant to purchase one share at $0.525.  The Series A-1 warrant is exercisable immediately with a 5 year expiration, while the Series A-2 warrant expires 13 months from date of issuance. The gross proceeds of the offering, expected to close on or about September 1st, are around $6.2 million. Baudax intends to use the net proceeds from the offering for pipeline development activities and general corporate purposes.

Pricing is at depressed levels.  While funding needs were anticipated, the Baudax offering of common shares and warrants are coming near all-time lows.  The common stock price, at the $0.525 offering level, has declined 31% since the Q2 financials were released August 11th. 

This Company Sponsored Research is provided by Noble Capital Markets, Inc., a FINRA and S.E.C. registered broker-dealer (B/D).

*Analyst certification and important disclosures included in the full report. NOTE: investment decisions should not be based upon the content of this research summary. Proper due diligence is required before making any investment decision. 

Permex Petroleum (OILCF) – Permex reports fiscal third quarter results

Wednesday, August 31, 2022

Permex Petroleum (OILCF)
Permex reports fiscal third quarter results

Michael Heim, CFA, Senior Research Analyst, Noble Capital Markets, Inc.

Refer to the full report for the price target, fundamental analysis, and rating.

Permex reported results for the quarter ended June 30, 2022. Given limited sales at this point in the company’s development, results are largely a function of operating costs. The company reported a large jump in auditing, legal, and marketing fees as the company prepares to begin drilling on the recently-acquired Breedlove field properties. Total operating expenses were $1,278,251 for the quarter versus $177,861 for the same period last year. Net income was ($761,303) or ($0.00) per share versus ($103,541) or ($0.00) per share. We had been looking for net income of ($191,000) or ($0.00) per share.

The shares of Permex trade on company developments not financial results. We believe the company has tremendous upside as it drills out its property. Consequently, the stock price rightfully trades on operational developments instead of financial results. Along those lines, the company reported back on August 16th that it had received approval on its permit application for drilling on the Breedlove field in Martin County. We expect the company to drill one vertical and one horizontal well in Martin County before the end of the year….

This Company Sponsored Research is provided by Noble Capital Markets, Inc., a FINRA and S.E.C. registered broker-dealer (B/D).

*Analyst certification and important disclosures included in the full report. NOTE: investment decisions should not be based upon the content of this research summary. Proper due diligence is required before making any investment decision. 

US and Chinese Authorities Reach Agreement to Prevent Delisting Chinese Stocks


Image Credit: Mentatdgt (Pexels)


Deal Reached With China on ADRs is Being Treated With Caution

While U.S. stocks plunged during Fed Chair Powell’s address at Jackson Hole last Friday (August 26), shares of Chinese shares trading on U.S. exchanges were lifted. The reason was a standoff between the Securities and Exchange Commission (SEC) and China Securities Regulatory Commission (CSRC) under the U.S. Holding Foreign Companies Accountable Act (HFCAA) had just improved its chances of being settled. The agreement would avoid a mass delisting of Chinese stocks. This initially lifted most Chinese ADRs.


Details of Agreement

Last Friday, a light of hope in the US-China audit conflict was seen as authorities from both sides reached a preliminary agreement to allow American regulators to inspect audit documents at accounting firms in Hong Kong and mainland China. The preliminary agreement caused a celebratory rally in the affected securities, the arrangements still have to be tested and successful.

The constant uncertainty since the Spring of whether up to 150 Chinese companies trading on U.S. exchanges would have to find another primary exchange, such as Hong Kong, has been causing increased volatility among the shares. There may still be some unseen hurdles, but the odds now seem much better that the SEC, the Public Company Accounting Oversight Board (PCAOB) in the U.S., and Chinese authorities will bend to each other’s expectations.


What is the PCAOB’s Role?

The PCAOB inspects and investigates registered public accounting firms in more than 50 jurisdictions around the world under its mandate under the Sarbanes-Oxley Act. However, for more than a decade, the PCAOB’s access to inspect and investigate registered public accounting firms in mainland China and Hong Kong has been obstructed.

In 2020, Congress passed the Holding Foreign Companies Accountable Act (HFCAA). Under the HFCAA, beginning with 2021, after three consecutive years of PCAOB determinations where positions taken by authorities in the People’s Republic of China (PRC) obstructed the PCAOB’s ability to inspect and investigate registered public accounting firms in mainland China and Hong Kong, the companies audited by those firms would be subject to a trading prohibition on U.S. markets.

The trading prohibition would be carried out by the SEC and would apply to companies the Commission identifies as having used registered public accounting firms in mainland China and Hong Kong for three consecutive years.

In 2021, the PCAOB made determinations that the positions taken by PRC authorities prevented the PCAOB from inspecting and investigating in mainland China and Hong Kong completely.


Source: Koyfin


PCAOB Announcement

In an announcement by the US Public Company Accounting Oversight Board (PCAOB), chair Erica Williams announced, “On paper, the agreement signed today grants the PCAOB complete access to the audit work papers, audit personnel, and other information we need to inspect and investigate any firm we choose, with no loopholes and no exceptions. But the real test will be whether the words agreed to on paper translate into complete access in practice.” The announcement goes on to list three ways inspections will be allowed in a Statement of Protocol:

  1. The PCAOB has sole discretion to select the firms, audit engagements, and potential violations it inspects and investigates – without consultation with, nor input from, Chinese authorities.
  2. Procedures are in place for PCAOB inspectors and investigators to view complete audit work papers with all information included and for the PCAOB to retain information as needed.
  3. The PCAOB has direct access to interview and take testimony from all personnel associated with the audits the PCAOB inspects or investigates.

The China Securities Regulatory Commission (CSRC) and Ministry of Finance would give sole discretion for access, procedures to view documents, and direct access to all related personnel taking part in the audit inspections.


Cautious Language

By most standards, this would appear to be a completed deal, something the companies and U.S. investors could truly celebrate. But all reports by U.S. officials, including an interview with SEC Chairman Gary Gensler, had with CNBC, sound tentative. Even the tone of the PCAOB statement indicates caution about a successful outcome with concerns over compliance by China.

“On paper, the agreement signed today grants the PCAOB complete access to the audit work papers, audit personnel, and other information we need to inspect and investigate any firm we choose, with no loopholes and no exceptions,” Williams said. “But the real test will be whether the words agreed to on paper translate into complete access in practice. Now we will find out whether those promises hold up.”

In China, the CSRC also sounded unsettled, stating that delistings in the U.S. can only be avoided if further cooperation can meet the “respective regulatory needs” of both sides.


Coin Toss

Goldman Sachs Group Inc. said markets are now pricing in a 50% chance of Chinese companies being delisted from U.S. exchanges, even as the two nations reached a deal to resolve the long standoff over audits. The coin toss odds are a dramatic improvement over the 95% chance of failure Goldman said the markets gave success back in March.

In terms of loss of value if it eventually fails, Goldman’s odds makers said in the best-case scenario of no delistings, they forecast an 11 percent and 5 percent gain for Chinese ADRs and the MSCI China Index, respectively. And in the event of a forced delisting, the firm estimates a 13 percent and 6 percent fall, respectively.


What if the Agreement Does Fall Apart?

A total of 52 out of 261 US-listed Chinese firms currently do not qualify to go public in Hong Kong due to insufficient market capitalization, revenue, profit, and/or operating cash flow. If delisted, there will be extra demand for capital to buy back shares from smaller shareholders, which could cause liquidity pressures.

Chinese authorities have been making inroads to access other markets, such as Zurich and London, with the intent to establish more avenues in other European countries, including Germany. Nonetheless, Hong Kong is expected to remain as China’s main offshore market and the prime beneficiary of any US delisting.

Paul Hoffman

Managing Editor, Channelchek

Suggested Content


Are ADRs Riskier than Stocks?


How Comfortable Will You Be if Some of Your Stocks are Only Listed in Hong Kong?


Will NIO and Other Listed Chinese Companies be Exiting U.S. Exchanges?


Some DiDi Chuxing Stockholders Take an Unplanned Detour


Sources

https://www.cnbc.com/2022/08/29/goldman-us-delisting-risk-for-chinese-adr-stocks-halves-after-deal.html

https://pcaobus.org/news-events/speeches/speech-detail/pcaob-chair-williams-statement-regarding-agreement-with-chinese-authorities

https://fortune.com/2022/08/29/goldman-sachs-delisting-barometer-us-china-stocks-audit-deal/

Stay up to date. Follow us:


Grindrod Shipping (GRIN) – Grindrod receives takeover offer

Tuesday, August 30, 2022

Grindrod Shipping (GRIN)
Grindrod receives takeover offer

Grindrod Shipping operates a fleet of owned and long-term and short-term chartered-in drybulk vessels predominantly in the handysize and supramax/ultramax segments. The drybulk business, which operates under the brand “Island View Shipping” (“IVS”), includes a Core Fleet of 31 vessels consisting of 15 handysize drybulk carriers and 16 supramax/ultramax drybulk carriers. The Company also owns one medium range product tanker on bareboat charter. The Company is based in Singapore, with offices in London, Durban, Tokyo, Cape Town and Rotterdam. Grindrod Shipping is listed on NASDAQ under the ticker “GRIN” and on the JSE under the ticker “GSH”.

Michael Heim, CFA, Senior Research Analyst, Noble Capital Markets, Inc.

Refer to the full report for the price target, fundamental analysis, and rating.

Taylor Maritime Investment Limited (TMI) proposed a $26 per share offer to acquire share capital of the Company not already owned by TMI. TMI owned 4,925,023, or 25.9% of the shares of Grindrod as of August 17, 2022.The offer consists of $21 in cash and a $5 special cash dividend to be paid to shareholders. Grindrod has entered into a confidentiality agreement and an exclusivity agreement with TMI whereas TMI has been granting a period to negotiate the proposed transaction. Grindrod has not agreed to terms of the proposal nor its willingness to be acquired. 

The shares of Grindrod rose on the news but remain below spring trading levels and our price target. The shares of GRIN rose 16.73% to $23.93 per share on Monday, the day the deal was announced. The shares of GRIN traded as high as $28.98 on May 20, 2022 but have been weak since that date in response to declining shipping rates and overall market weakness. The company reported very strong financial results for the first and second quarters allowing the company to pay down debt, acquire a vessel, and raise the dividend. As a result, we have maintained our price target of $31 even as shipping rates have declined….

This Research is provided by Noble Capital Markets, Inc., a FINRA and S.E.C. registered broker-dealer (B/D).

*Analyst certification and important disclosures included in the full report. NOTE: investment decisions should not be based upon the content of this research summary. Proper due diligence is required before making any investment decision.