Senate Marijuana Bill Expected Before Summer Break


Image Credit: Office of Public Affairs (Flickr)


Senate Version of Marijuana Legalization Bill May be Unveiled in Coming Days

Investors in marijuana stocks may be given something to lift their spirits prior to Congress’s summer recess. There are reports that senators will finally introduce the Cannabis Administration and Opportunity Act (CAOA) bill. The House of Representatives has already introduced and passed its own version to legalize marijuana nationally. The Senate bill is expected to be somewhat more restrictive and have other small differences; both bills contain what the authors view as social justice measures.

It’s been a year since Senate Majority Leader Chuck Schumer (NY), Senate Finance Committee Chairman Ron Wyden (OR) and Sen. Cory Booker (NJ) first released a draft version of CAOA detailing proposed legislation to end federal cannabis prohibition. Senator Schumer has reported that the final bill to be voted on will be made public the last week in July.

There is a push to introduce the Senate’s bill ahead of the August recess (August 8 – September 5).

The final introduction of the CAOA has had many delays as the sponsors have worked to build in what they deem important while trying to move forward with something with bipartisan support. One expected aspect is that Senator Schumer has wanted the CAOA to specifically seek to build barriers so large alcohol and tobacco companies so they can’t easily overtake the industry.

Any change in details to the bill since it was first released last year is still not public. But it’s expected to place importance on removing cannabis from the Controlled Substances Act, impose a federal tax on marijuana sales, favor groups that have been hurt by what are seen as harsh laws, and provide a path to relief for those who have faced federal cannabis convictions.

Once the measure is introduced, its road to passage is still not straightforward. The measure would require a 60-vote threshold to pass in the Senate. While the bill is expected to have bipartisan support, the more conservative senators may be inclined to vote the bill down. Currently, there are senators from each of the major political parties that are non-committal.

Senator Schumer seems intent on bringing the bill to the floor for a vote. If it passes, the House of Representatives and the Senate would likely meet to work out differences between the
versions
. If they agree on one piece of legislation, they then hope the president signs it into law.

The year-long push by Senate leadership to get the legalization bill to the floor has frustrated businesses, banks, patients, and some states that have wanted to see the reform move quickly. Without approval on the national level, states may legalize cannabis products, but entities that rely on Federal charters, such as banks and even the Post Office, put themselves at risk if they do business within any part of the industry that is unlawful on the federal level.

There are serious questions about the prospects of passing any broad legalization bill in the current congressional climate, especially given the steep Senate vote threshold. Then another looming unknown is what President Joe Biden would do if a legalization measure does ultimately arrive at his desk.

Despite supermajority support for the reform within Biden’s political party, the president has held a firm opposition to adult-use legalization. Instead, he has supported modest changes such as decriminalization, rescheduling and continuing to allow states to set their own policies.

Dr. Rahul Gupta, Director of National Drug Control Policy, sometimes called “the White House drug czar,”  recently said that the Biden administration is “monitoring” states that have legalized marijuana to inform federal policy, and recognize the failures of the current prohibitionist approach.

Paul Hoffman

Managing Editor, Channelchek

Suggested Content


Bear Market Wisdom


Fed Chairman Powell Attacks the Core of Persistent Inflation


Will a Third Mandate be Added to the Fed’s Challenges?


What Investors Haven’t Yet Noticed About the Value in Some Biotechs


Sources

https://www.bloomberg.com/news/articles/2022-07-14/marijuana-decriminalization-bill-teed-up-for-senate-introduction

https://www.investopedia.com/terms/s/social-justice.asp

https://thehill.com/policy/3559842-senate-democrats-to-roll-out-bill-aimed-at-decriminalizing-weed-next-week/

https://www.marijuanamoment.net/senate-marijuana-legalization-bill-could-come-next-week-but-congressional-sources-push-back-on-report-about-timeline/

https://www.marijuanamoment.net/senate-marijuana-legalization-bill-could-come-next-week-but-congressional-sources-push-back-on-report-about-timeline/

https://www.congress.gov/bill/117th-congress/house-bill/3617

Stay up to date. Follow us:


Release – Defense Contractor Kratos Announces Plan to Add 76 Jobs at its Birmingham Advanced Concepts Engineering Facility


Defense Contractor Kratos Announces Plan to Add 76 Jobs at its Birmingham Advanced Concepts Engineering Facility

Research, News, and Market Data on Kratos Defense & Security Solutions

SAN DIEGO, 
July 19, 2022 (GLOBE NEWSWIRE) — 
San Diego Based Kratos Defense & Security Solutions, Inc. (NASDAQ: KTOS), a leading National Security Solutions provider announced plans today to expand its newly established business unit in 
Birmingham, Alabama
. With the support of critical enhancement programs provided by the 
State of Alabama
Jefferson County
 and the 
City of Birmingham, Kratos expects to add 76 jobs and make approximately 
$8.6 million
 in capital investments in its 
Birmingham facility over the next five years.

Kratos acquired the engineering division of 
Birmingham-based 
Southern Research
 in an 
$80 million
 asset transaction in May. The acquisition establishes Kratos SRE, an advanced concept group within Kratos’ Defense & 
Rocket Support Services (KDRSS) Division. SRE currently employs about 140 engineers, technicians and program support professionals conducting work in support of the space community, the 
Department of Defense and other national security customers.

The Kratos SRE Birmingham growth plan is part of the company’s overall strategy to expand leading-edge technology capabilities in areas specifically related to hypersonics. The new positions, with an average annual salary of 
$95,000, will be a mixture of engineers, technicians and support staff.

“We appreciate the support that Kratos has received from the 
State of Alabama and the 
Birmingham local government,” said  Dave Carter , President of KDRSS. “Training grants and other key incentives allow us to accelerate our capabilities expansion and enhance the already impressive workforce at Kratos SRE. The 
Birmingham advanced concepts business unit is a key enabler to expanding Kratos’ leadership in hypersonics and other technology areas.”

The growth plans for Kratos’ 
Birmingham advanced concepts business unit were announced in conjunction with the 2022 Farnborough International Airshow, held just outside of 
London. Company representatives met with the 
Alabama team today at the “Made in Alabama” booth on the opening day of the high-profile trade event.

“Over many decades, the talented workforce in the Southern Research Engineering Division has made many important contributions to the nation’s space program and critical national defense programs,” said  Greg Canfield , Secretary of the 
Alabama Department of Commerce. “I look forward to seeing the Birmingham Kratos SRE business unit continue their record of amazing accomplishments as Kratos makes investments in advanced concepts and expands their technical capabilities.”

Kratos plans to continue enhancing SRE’s industry-leading expertise in the testing and evaluation of how advanced materials behave in extreme environments to ensure the nation’s industrial base is prepared to address the unique challenges associated with space, hypersonics, missiles, propulsion systems and more.

Kratos SRE also specializes in intelligence surveillance and reconnaissance (ISR) sensor development, electromechanical systems design, aerospace engineering and other technical disciplines.

“Kratos is the perfect home for my engineering team. From hypersonics to ISR applications, Kratos brings tremendous synergies across all of our technical platforms,” said  Michael Johns , former Southern Research Engineering Division Vice President and now Kratos SRE Senior Vice President. “We have long been the leader in understanding materials in extreme environments for applications, including hypersonics, but now as part of Kratos, we are able to support programs all the way through flight test and beyond, substantially increasing our total addressable market opportunity.”

Local officials welcomed Kratos’ expansion plans at the 
Birmingham facility.

“As Birmingham and 
Jefferson County
 continues to expand its aerospace and defense industry footprint, we welcome Kratos and its plans for new jobs and investment,” 
Jefferson County
 Commissioner  Steve Ammons  said. “Southern Research’s Engineering Division was a powerful leader in defense and strategic deterrence system development, and we will continue to support Kratos in its new and innovative solutions.”

Emily Jerkins Hall, President and Chief Operating Officer of the 
Birmingham Business Alliance, said the organization is grateful that Kratos not only committed to staying in the city but also to growing there.

“Our team enjoyed working with 
Southern Research and the project team to help Kratos establish and scale their operations here,” she said. “Their investment in our community will continue to make the 
Greater Birmingham Region an attractive destination for top engineering talent from around the globe.”

About Kratos Defense & Security Solutions
Kratos Defense & Security Solutions, Inc. (NASDAQ: KTOS) develops and fields transformative, affordable technology, platforms, and systems for United States National Security related customers, allies, and commercial enterprises. Kratos is changing the way breakthrough technology for these industries are rapidly brought to market through proven commercial and venture capital backed approaches, including proactive research and streamlined development processes. At Kratos, affordability is a technology, and we specialize in unmanned systems, satellite communications, cyber security/warfare, microwave electronics, missile defense, hypersonic systems, training, combat systems and next generation turbo jet and turbo fan engine development. For more information, go to 
www.KratosDefense.com.

About the Department of
Commerce
 

The Alabama Department of Commerce is the state’s lead economic development agency, working with economic development allies throughout the state to fulfill the objectives of Accelerate Alabama, the state’s strategic economic development growth plan. In addition to its business development activities, Commerce divisions promote exporting and international investment opportunities for 
Alabama businesses, assist small businesses, and position the state as a location for film and television productions. Commerce is home to the state’s primary non-education workforce development programs, including AIDT, a nationally known job-training agency.

Notice Regarding Forward-Looking Statements
Certain statements in this press release may constitute “forward-looking statements” within the meaning of the Private Securities Litigation Reform Act of 1995. These forward-looking statements are made on the basis of the current beliefs, expectations, and assumptions of the management of Kratos and are subject to significant risks and uncertainty. Investors are cautioned not to place undue reliance on any such forward-looking statements. All such forward-looking statements speak only as of the date they are made, and Kratos undertakes no obligation to update or revise these statements, whether as a result of new information, future events or otherwise. Although Kratos believes that the expectations reflected in these forward-looking statements are reasonable, these statements involve many risks and uncertainties that may cause actual results to differ materially from what may be expressed or implied in these forward-looking statements. For a further discussion of risks and uncertainties that could cause actual results to differ from those expressed in these forward-looking statements, as well as risks relating to the business of Kratos in general, see the risk disclosures in the Annual Report on Form 10-K of Kratos for the year ended 
December 30, 2020, and in subsequent reports on Forms 10-Q and 8-K and other filings made with the 
SEC by Kratos.

Press Contact: Yolanda White 858-812-7302 Direct

Investor Information:
877-934-4687

investor@kratosdefense.com


Source: Kratos Defense & Security Solutions, Inc.


Release – Maple Gold Completes Regional Airborne Mag-EM Survey and Identifies New Drill Targets at Douay and Joutel


Maple Gold Completes Regional Airborne Mag-EM Survey and Identifies New Drill Targets at Douay and Joutel

Research, News, and Market Data on Maple Gold Mines

Vancouver, British Columbia–(Newsfile Corp. – July 19, 2022) – 
Maple Gold Mines Ltd. (TSXV: MGM) (OTCQB: MGMLF) (FSE: M3G) (“Maple
Gold
” or the “Company“) is pleased to announce that the 50/50 joint venture (the “JV”) between the Company and Agnico Eagle Mines Limited has completed a regional airborne magnetic and electromagnetic (“Mag-EM”) survey to support exploration drill targeting across 278 km2 of JV-controlled ground, including the western half of the Douay Gold Project (“Douay”) as well as the entire Joutel Gold Project (“Joutel”) in Quebec, Canada. Results from the new Mag-EM survey were analyzed alongside existing geological and geophysical data to identify anomalies of interest throughout the survey area that are prospective for pyritic gold and volcanogenic massive sulphide (VMS) styles of mineralization.

Fred Speidel, VP Exploration of Maple Gold, stated: “A
key pillar of our strategy is to focus drilling and exploration work in areas
that exhibit potential for additional larger and higher-grade mineralized zones
at Douay, while also testing the resource potential that remains along and
beyond the entire past-producing Eagle-Telbel mine trend at Joutel. We are
already drilling step-out and deep targets at both projects and these new
Mag-EM survey results point to additional targets not only in the Eagle-Telbel
mine area and along its lateral extensions, but also on the greater Douay
property, where the Company previously identified VMS targets via prospecting
in 2018. We look forward to testing this next set of targets in upcoming JV
drill campaigns.”

Interpretation and Summary of Results

The JV is currently ranking and prioritizing at least four (4) conductive target areas from the new Mag-EM survey for future drill testing (see Figure 1 for locations):

  • Joutel Targets include several EM anomalies within ~2-3 km of the historical Eagle, Telbel and Eagle West deposits that have very limited drilling. These deposits appear as discrete ~250 m diameter conductive zones aligned along a well-defined northwest trend. Known gold mineralization at Joutel is found along a series of subparallel structures over a strike length of at least 6 km along the Harricana/Joutel Deformation Zones associated with the Casa Berardi South Fault. The survey indicates possible similar structures extending more than 9 km further to the east in this area (see Figure 2 for additional detail).
  • Southeast Targets occur along the largely undrilled Douay-Joutel property boundary, within the Cartwright Hills Group basalts that are prospective for a similar style of mineralization to the Douay West and 531 Zones at Douay (see Figure 2 for additional detail).
  • Central Targets at Douay, to the west of the current mineral resource area (green pit outlines on Figure 1), are sparsely drilled and partly coincide and extend beyond VMS copper-zinc-(gold) (“Cu-Zn-(Au)”) anomalies defined during the Company’s prospecting work in 2018 (see news from November 14, 2018).
  • Northwest Targets at Douay are associated with an intrusive-like magnetic anomaly that is over 2 km across. This target area is sparsely drilled and straddles the interpreted position of the Casa Berardi North Fault.


Figure 1: Distribution of conductive target areas, known gold-bearing and other interpreted favorable structures at Douay (>17 km) and Joutel (>6 km) on a residual magnetic base map.
 

To view an enhanced version of this graphic, please visit:
https://images.newsfilecorp.com/files/3077/131243_629c94e63417b9b8_001full.jpg


Figure 2: Closeup of Eagle-Telbel mine area and Douay-Joutel property boundary with identified conductive target areas and known/interpreted structures on a Tau dB/dt EM base map.
 

To view an enhanced version of this graphic, please visit:
https://images.newsfilecorp.com/files/3077/131243_629c94e63417b9b8_002full.jpg

The Mag-EM survey utilized Geotech Ltd.’s VTEMTM Plus Time Domain EM system with a horizontal magnetic gradiometer configuration, providing a maximum depth of investigation ranging from 250-700 m that is significantly greater than the maximum depth of about 150 m from historical surveys conducted in this area. It consisted of 2,029 line-km flown using a 150 m line spacing and covered a 278 km2 area including the western half of Douay and all of Joutel.

Numerous conductive and magnetic anomalies were identified. Strong magnetic responses were noted, with a measured range of >5,700 nT, including two large (>5×8 km), intrusion-like, circular to elliptical anomalies along the northern and northeastern edges of the surveyed block.

Electromagnetically, the block is characterized as being largely resistive with sparse, moderate to highly conductive, EW to WNW-ESE linear trends occurring throughout, but mainly focused in the eastern half of the surveyed area. The western part of the block features a mainly larger area (>1×2 km) with EW elongate conductive responses, some of which may be lithologic. The eastern half of the block features a mix of numerous short strike-length (<150-500 m), discrete deeper conductor axes, mainly located in the northern part. Most EM conductors either closely parallel or coincide with magnetic high horizons. Apparent resistivities range from lows of <2-100 ohm-m to highs of 800-4,500 ohm-m.

Qualified Person

The scientific and technical data contained in this press release was reviewed and prepared under the supervision of Fred Speidel, M. Sc., P. Geo., Vice-President Exploration of Maple Gold. Mr. Speidel is a Qualified Person under National Instrument 43-101 Standards of Disclosure for Mineral Projects. Mr. Speidel has verified the data related to the exploration information disclosed in this press release through his direct participation in the work.

About Maple Gold

Maple Gold Mines Ltd. is a Canadian advanced exploration company in a 50/50 joint venture with Agnico Eagle Mines Limited to jointly advance the district-scale Douay and Joutel gold projects located in Quebec’s prolific Abitibi Greenstone Gold Belt. The projects benefit from exceptional infrastructure access and boast ~400 km2 of highly prospective ground including an established gold resource at Douay (SLR 2022) that holds significant expansion potential as well as the past-producing Eagle, Telbel and Eagle West mines at Joutel. In addition, the Company holds an exclusive option to acquire 100% of the Eagle Mine Property.

The district-scale property package also hosts a significant number of regional exploration targets covering 55 km of strike length along the Casa Berardi Deformation Zone that are yet to be drill tested, making the project ripe for new gold and polymetallic discoveries. The Company is well capitalized and is currently focused on carrying out exploration and drill programs to grow resources and make new discoveries to establish an exciting new gold district in the heart of the Abitibi. For more information, please visit 
www.maplegoldmines.com.

ON BEHALF OF MAPLE GOLD MINES LTD.

“Matthew Hornor”

B. Matthew Hornor, President & CEO

For Further Information Please Contact:

Mr. Joness Lang
Executive Vice-President
Cell: 778.686.6836
Email: 
jlang@maplegoldmines.com

Mr. Kiran Patankar
SVP, Growth Strategy
Cell: 604.935.9577
Email: 
kpatankar@maplegoldmines.com

NEITHER THE TSX VENTURE EXCHANGE NOR ITS REGULATION SERVICES
PROVIDER (AS THAT TERM IS DEFINED IN THE POLICIES OF THE TSX VENTURE EXCHANGE)
ACCEPTS RESPONSIBILITY FOR THE ADEQUACY OR ACCURACY OF THIS PRESS RELEASE.

Forward-Looking Statements:
This press release contains “forward-looking information” and “forward-looking statements” (collectively referred to as “forward-looking statements”) within the meaning of applicable Canadian securities legislation in Canada, including statements about exploration work and results from current and future work programs. Forward-looking statements are based on assumptions, uncertainties and management’s best estimate of future events. Actual events or results could differ materially from the Company’s expectations and projections. Investors are cautioned that forward-looking statements involve risks and uncertainties. Accordingly, readers should not place undue reliance on forward-looking statements. For a more detailed discussion of such risks and other factors that could cause actual results to differ materially from those expressed or implied by such forward-looking statements, refer to Maple Gold Mines Ltd.’s filings with Canadian securities regulators available on www.sedar.com or the Company’s website at www.maplegoldmines.comThe Company does not
intend, and expressly disclaims any intention or obligation to, update or
revise any forward-looking statements whether as a result of new information,
future events or otherwise, except as required by law.

To view the source version of this press release, please visit https://www.newsfilecorp.com/release/131243


Coeur Mining (CDE) – Lowering Estimates; Maintaining Outperform Rating

Tuesday, July 19, 2022

Coeur Mining (CDE)
Lowering Estimates; Maintaining Outperform Rating

Mark Reichman, Senior Research Analyst, Natural Resources, Noble Capital Markets, Inc.

Refer to the full report for the price target, fundamental analysis, and rating.

Updating estimates.  We are now forecasting 2022 adjusted EBITDA and EPS of $168.3 million and $0.01 per share, respectively, compared with our previous forecast of $182.1 million and net income of $0.02 per share. Based on lower precious metals prices, we lowered our margin expectations for the second quarter and for the remainder of the year. For 2023, we forecast EBITDA and EPS of $209.7 million and $0.15, respectively.

Second quarter financial results. Coeur Mining will report second quarter 2022 operational and financial results after the market close on August 3, 2022. Management will host a conference call for investors at 11:00 am ET on August 4, 2022. We expect key topics for the call will be: 1) the Rochester expansion, 2) Silvertip, 3) forward sale hedges, and 4) balance sheet strength. …

This Research is provided by Noble Capital Markets, Inc., a FINRA and S.E.C. registered broker-dealer (B/D).

*Analyst certification and important disclosures included in the full report. NOTE: investment decisions should not be based upon the content of this research summary. Proper due diligence is required before making any investment decision. 

Is the Strong Dollar Creating a Buying Opportunity for Gold?


For The First Time In 20 Years, 1 Dollar = 1 Euro. What This Means For Gold

If you were considering taking the family on a European vacation, now may be a good time, as the U.S. dollar and euro just achieved parity for the first time in 20 years.

But as someone who was recently in Europe, I urge travelers to be aware that prices have skyrocketed everywhere, not just in the U.S. A five-star hotel in France or Italy that might have cost $350 a night before the pandemic can now cost as much as $1,600.

This article was republished with permission from Frank Talk, a CEO Blog by Frank Holmes
of U.S. Global Investors (GROW).
Find more of Frank’s articles here – Originally published July 18, 2022.

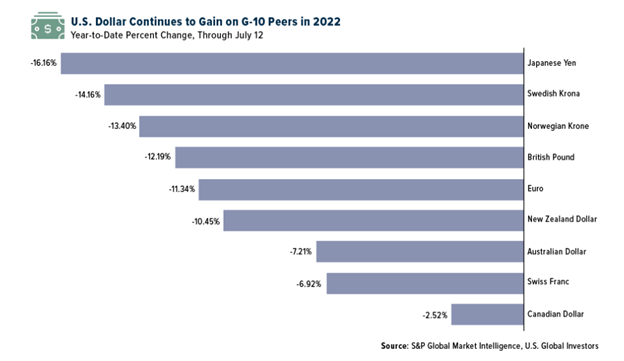
Much is being made about the USD/EUR exchange rate, but the truth is that King Dollar has made epic gains on a number of world currencies this year as the U.S. has embarked on an aggressive monetary tightening cycle to control inflation. Below you can see how much G-10 currencies have fallen in 2022 compared to the greenback.

A stronger dollar is favorable not only for Americans traveling abroad but also companies that pay to import goods from other countries—think big-box retailers such as Walmart, Target, Home Depot and Dollar Tree.

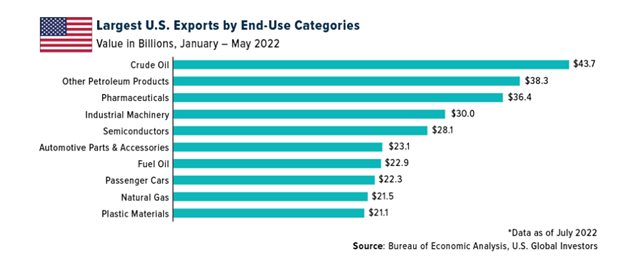
On the other hand, a soaring dollar can hurt U.S. exporters since it makes goods more expensive to foreign buyers, dampening demand. Between January and May of this year, the top U.S. exports by end-use included crude oil and petroleum products, mostly due to the massive increase in crude prices. Other top exports included pharmaceuticals, industrial machinery, semiconductors, automotive parts and accessories, fuel oil, automobiles, natural gas and plastic materials, according to Bureau of Economic Analysis (BEA) data. 

Boeing Reports Best Month For
Deliveries Since 2019

The single largest U.S. exporter in value terms is Boeing. The massive aerospace company, which recently moved its headquarters to Arlington, Virginia, faced a wave of order cancellations stemming from the tragic 2018/2019 crashes involving the 737 MAX, but orders look to be picking up again. As I shared with you last week, Boeing reported stellar delivery results for the second quarter, with 51
aircraft delivered in June alone.
 That’s the company’s best month since March 2019.

I will be curious to see if Boeing executives address the impact of the stronger dollar when the company reports second-quarter financial results later this month.

King Dollar Pushes Gold Deep
Into Oversold Territory

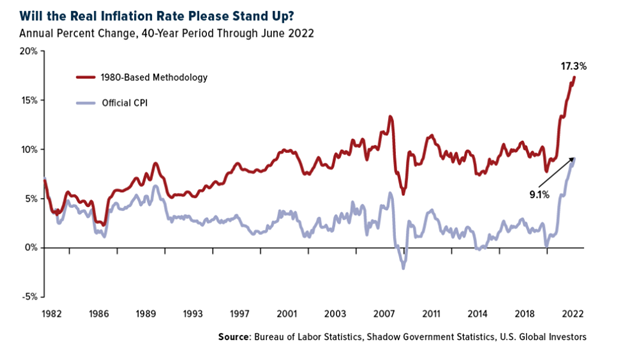
Among the biggest victims of King Dollar’s strength is gold, which, like most commodities, is priced in the greenback internationally. The yellow metal has long been valued as a safe haven during times of economic uncertainty and high inflation, which we’re certainly facing today. June’s consumer price index (CPI) came in at a scorching annual rate of 9.1%, the highest in over 40 years, but if we use the inflation methodology from 1980, the figure is closer to 17% or more.

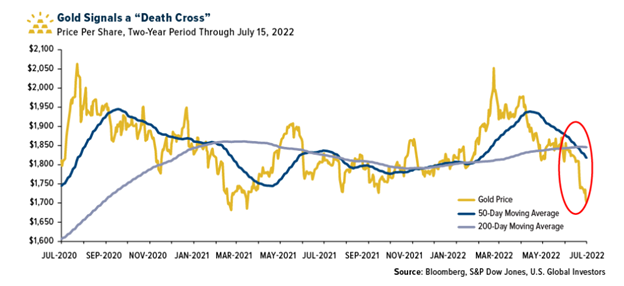
Despite this, gold has steadily fallen since its 2022 high of $2,070 per ounce, set in early March. As of today, gold is off close to 7% for the year, and last week it briefly traded below $1,700 for the first time since March 2021. Based on the 14-day relative strength index (RSI), the metal looks incredibly oversold at around 23, the lowest it’s been since August 2018.

In addition, gold has signaled a “death cross,” which occurs when the 50-day moving average dips below the 200-day moving average.

Some investors and traders see this move as a bearish sign. I see it as a buying opportunity. If you believe that the dollar is overextended relative to other currencies, and that a reversal could happen in the coming weeks and months, now may be a good time to accumulate, especially if you think we’re in the midst of a recession.

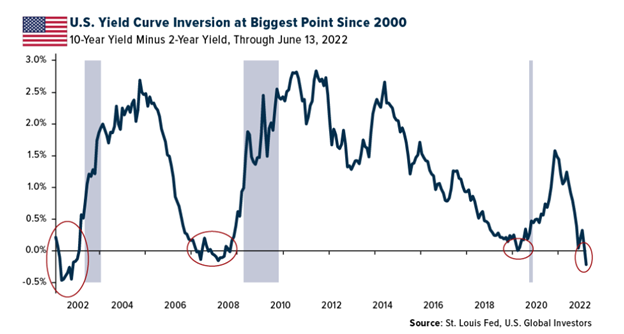
Deepest Yield Inversion Since
2000

I’ve shared with you a couple of times that we may very well be in a recession already, based on the Atlanta Federal Reserve’s GDPNow real-time forecast. The latest forecast, as of last Friday, is that the U.S. economy contracted 1.5% in the second quarter, following an annual decrease of 1.6% in the first quarter.

Even if that ends up not being the case, the bond market is telling us that a pullback may be imminent.

A yield inversion occurs when the shorter-term Treasury bond trades with a higher yield than the longer-term Treasury. Remember, bond yields go up when prices go down, so when yields invert, it suggests that investors find shorter government notes riskier to hold than longer-dated ones.

Inversions have been extraordinarily accurate at predicting recessions. Going back at least 40 years, every recession has been preceded by an inverted yield curve, using the two-year and 10-year Treasuries.

Not only is the yield curve inverted right now, but it’s inverted at the biggest point since the year 2000, soon before the dotcom bubble burst.

So what does this mean? Past performance is no guarantee of future results, but we could be looking at a pullback, if not this year then the next. More specifically, stocks and other risk assets may not have found a bottom yet. From its all-time high in early January, the S&P 500 has fallen 20%, but historically it’s dropped as much as 35% on average when a bear market coincides with a recession.

Do with that information as you wish, but I believe it’s wise and prudent to have exposure to gold at this time, between 5% and 10% of your portfolio.


Suggested Content


Inflation Is Eating Your Lunch If You’re Doing This One Common Thing


US Inflation is a Big Ship to Steer


What Can We Learn from Previous Market Crashes?


Interview with Labrador Gold CEO Roger Moss


US
Global Investors Disclaimer

The NYSE Arca Gold Miners Index is a modified market capitalization weighted index comprised of publicly traded companies involved primarily in the mining for gold and silver. The S&P 500 Stock Index is a widely recognized capitalization-weighted index of 500 common stock prices in U.S. companies. Free cash flow (FCF) represents the cash a company generates after accounting for cash outflows to support operations and maintain its capital assets. Frank Holmes has been appointed non-executive chairman of the Board of Directors of HIVE Blockchain Technologies. Both Mr. Holmes and U.S. Global Investors own shares of HIVE. Effective 8/31/2018, Frank Holmes serves as the interim executive chairman of HIVE.

Holdings may change daily. Holdings are reported as of the most recent quarter-end. The following securities mentioned in the article were held by one or more accounts managed by U.S. Global Investors as of (09/30/2021): Torex Gold Resources Inc., Centerra Gold Inc., Gran Colombia Gold Corp., Dundee Precious Metals Inc., Pretium Resources Inc., Endeavour Mining PLC, Barrick Gold Corp., Eldorado Gold Corp., SSR Mining Inc., Silver Lake Resources Ltd., Karora Resources Inc.

All opinions expressed and data provided are subject to change without notice. Some of these opinions may not be appropriate to every investor. By clicking the link(s) above, you will be directed to a third-party website(s). U.S. Global Investors does not endorse all information supplied by this/these website(s) and is not responsible for its/their content.

Stay up to date. Follow us:


C-Suite Interview with Labrador Gold (NKOSF)(LAB.V) President & CEO Roger Moss


Noble Capital Markets Senior Research Analyst Mark Reichman sits down with Labrador Gold President & CEO Roger Moss

Research, News, and Advanced Market Data on NKOSF


View all C-Suite Interviews


The 2022 C-Suite Interview series is now available on major podcast platforms

Labrador Gold is a Canadian based mineral exploration company focused on the acquisition and exploration of prospective gold projects in Eastern Canada. Labrador Gold’s flagship property is the 100% owned Kingsway project in the Gander area of Newfoundland. The three licenses comprising the Kingsway project cover approximately 12km of the Appleton Fault Zone which is associated with gold occurrences in the region, including those of New Found Gold immediately to the south of Kingsway. Infrastructure in the area is excellent located just 18km from the town of Gander with road access to the project, nearby electricity and abundant local water. LabGold is drilling a projected 100,000 metres targeting high-grade epizonal gold mineralization along the Appleton Fault Zone with encouraging results. The Company has approximately $26.5 million in working capital and is well funded to carry out the planned program. The Hopedale property covers much of the Florence Lake greenstone belt that stretches over 60 km. The belt is typical of greenstone belts around the world but has been underexplored by comparison. Work to date by Labrador Gold show gold anomalies in rocks, soils and lake sediments over a 3 kilometre section of the northern portion of the Florence Lake greenstone belt in the vicinity of the known Thurber Dog gold showing where grab samples assayed up to 7.8 g/t gold. In addition, anomalous gold in soil and lake sediment samples occur over approximately 40 km along the southern section of the greenstone belt (see news release dated January 25 th 2018 for more details). Labrador Gold now controls approximately 40km strike length of the Florence Lake Greenstone Belt. The Company has 168,889,979 common shares issued and outstanding and trades on the TSX Venture Exchange under the symbol LAB.

Release – Vera Bradley Foundation For Breast Cancer Names Stephanie Scheele Executive Director


Vera Bradley Foundation For Breast Cancer Names Stephanie Scheele Executive Director

Research, News, and Market Data on Vera Bradley

FORT WAYNE, Ind., July 19, 2022 (GLOBE NEWSWIRE) — The Vera Bradley Foundation for Breast Cancer (the “Foundation”) today announced, after a national search, it has named Stephanie Scheele as its new Executive Director.

Scheele has held the post of Chief Purpose and Communication Officer of Vera Bradley, Inc. (the “Company”) since October 2021, responsible for the Company’s enterprise-wide environmental, social and governance (ESG) efforts, including oversight of the Vera Bradley Foundation for Breast Cancer. Scheele joined the Company in 2001 and was the driving force behind various marketing and creative initiatives during her tenure, advancing the Vera Bradley brand’s marketing to an integrated, customer-segmented, research-based approach. She was named VP, Marketing Strategy and Operations in 2015; promoted to Interim Chief Marketing Officer in 2017; and promoted to Chief Marketing Officer in 2018. Prior to joining Vera Bradley, Inc., Scheele worked for Sunrise Greetings, a subsidiary of Hallmark. Scheele has served on the Foundation Board of Directors since 2018.

“We are absolutely thrilled to name Stephanie Scheele Executive Director of the Foundation. Stephanie has served on our board and has worked tirelessly over the last several years on fundraising efforts for the Foundation,” shared Ruth Cook, Chair of the Vera Bradley Foundation Board. “Her strategic, marketing, and creative expertise coupled with her institutional knowledge of the Foundation will be instrumental as we elevate funding for life-saving research that is impacting women, men, and their loved ones worldwide.”

Since 2000, the Foundation has provided $37.5 million of funding to the Indiana University School of Medicine (“IU School of Medicine”), allowing them to amass the talent, technology, and resources to become a national leader in targeted breast cancer therapies, specifically for triple negative breast cancer. In April 2022, the Foundation made an additional gift commitment of $12.5 million to IU School of Medicine, bringing the non-profit’s total commitment to breast cancer research to $50 million. The Foundation’s ongoing support led to the 2018 creation of the Vera Bradley Foundation Center for Breast Cancer Research at the Indiana University Melvin and Bren Simon Comprehensive Cancer Center (the “IU Cancer Center”) where more than 30 investigators collaborate on breast cancer discoveries. In 2019, the IU Cancer Center was designated a Comprehensive Cancer Center, the highest level of recognition awarded by the National Cancer Institute for research excellence.

Scheele noted, “I am honored and excited to accept the position of Executive Director of the Foundation. I am intensely passionate about our cause and see a future where a diagnosis of breast cancer is not scary or overwhelming. The Foundation has and will continue to provide hope to countless women and men, along with their families. I am extremely grateful for each of the dedicated servant leaders at the IU Cancer Center working tirelessly to perfect therapies and for all of the donors and volunteers that make this work possible.”

ABOUT VERA
BRADLEY FOUNDATION FOR BREAST CANCER

The Vera Bradley Foundation for Breast Cancer raises funds for breast cancer research to find a cure and to improve the lives of the many affected by this disease. The Foundation has contributed $37.5 million to the Vera Bradley Foundation Center for Breast Cancer Research at the Indiana University School of Medicine and has pledged to raise an additional $12.5 million. The Center is focused on developing and dramatically improving therapies for some of the most difficult-to-treat types of breast cancer. Funds are raised through special events, partner events, and individual donations. For more information, visit www.verabradley.org.

Press Contact
Greg Jaeger
Director of Public Relations & Social Media, Vera Bradley
gjaeger@verabradley.com


Release – Digerati Technologies Provides Update on its SkyNet and NextLevel Internet Acquisitions


Digerati Technologies Provides Update on its SkyNet and NextLevel Internet Acquisitions

Research, News, and Market Data on Digerati Technologies

SAN ANTONIO, July 19, 2022 (GLOBE NEWSWIRE) — Digerati Technologies, Inc. (OTCQB: DTGI) (“Digerati” or the “Company”), a provider of cloud services specializing in UCaaS (Unified Communications as a Service) solutions for the small to medium-sized business (“SMB”) market, is pleased to provide an update on the integration of its SkyNet and NextLevel Internet acquisitions that were closed in December 2021 and February 2022 and contributed to the Company’s highest quarterly revenue in its history.

The Company is approximately six months into its integration playbook that has resulted in the following:

  • Appointment of Patti Cuthill from NextLevel Internet as VP of People and Culture for the entire organization.
  • Appointment of George Robyn from NextLevel Internet as VP of Engineering and DevOps for the entire organization.
  • Armando Muniz, who joined the Company via the acquisition of ActivePBX in November 2020, was appointed Director of Voice Engineering for the entire organization.
  • Other re-alignments throughout the organization to gain efficiencies and maximize team productivity.
  • Annualized cost synergies of approximately $500K that are expected to continue contributing to OPCO EBITDA in the coming quarters.

The Company and its subsidiaries now serve over 4,000 business customers and approximately 45,000 users, with a run-rate of over $32 million in annual revenue.

As previously highlighted, some of the operating efficiencies, expected cost synergies and consolidation savings from the SkyNet and NextLevel acquisitions were realized over several months following the closing of the transactions. As a result, all of Digerati’s financial measures have steadily improved over the past several months which contributed to an increase in gross margin to 61.3% and improvement in non-GAAP operating EBITDA (OPCO EBITDA) to $0.969 million for the three months ended April 30, 2022. The Company continues to execute on its integration playbook and expects additional cost synergies over the next two to three quarters.

In addition, NextLevel was recently awarded and certified a Great Place to Work for the third year in a row. The prestigious award is based entirely on what current employees say about their experience working at NextLevel. This year, 97% of NextLevel’s employees said it is a great place to work, compared to the national average of 53%.

Arthur L. Smith, Chief Executive Officer of Digerati, commented, “We are pleased with the progress on integration of both SkyNet and NextLevel since the closing of both acquisitions earlier in FY 2022. Our emphasis on the UCaaS/Cloud Communications business, which operates in a segment of the telecommunications industry that continues to experience solid growth as businesses migrate from legacy phone systems to cloud-based telephony systems, has proven to be a solid strategy. We also continue to prove that the M&A aspect of our business model works while increasing penetration in Texas and expanding west into California.”

Mr. Smith added, “I commend our team on successful execution of our integration playbook while achieving financial results that demonstrated improved margins at every operating level and a boost to our profitability.”

Recap of previously reported third quarter ended April 30, 2022:

  • Revenue increased by 118% to $8.163 million compared to $3.751 million for Q3 FY2021.
  • Gross profit increased 125% to $5.002 million compared to $2.225 million for Q3 FY2021.
  • Gross margin increased to 61.3% compared to 59.3% for Q3 FY2021.
  • Non-GAAP Adjusted EBITDA income was $0.557 million, excluding all non-cash items and one-time transactional expenses, compared to Adjusted EBITDA income of $0.321 million for Q3 FY2021.
  • Non-GAAP operating EBITDA (OPCO EBITDA) improved to income of $0.969 million, excluding corporate expenses, all non-cash items, and one-time transactional expenses, compared to a non-GAAP operating EBITDA of $0.619 million for Q3 FY2022.

Digerati expects to report its fourth quarter and fiscal year end July 31, 2022, operating and financial results the week of October 24, 2022.

Use of Non-GAAP Financial Measurements

The Company believes that EBITDA (earnings before interest, taxes, depreciation and amortization) is useful to investors because it is commonly used in the cloud communications industry to evaluate companies on the basis of operating performance and leverage. Adjusted EBITDA provides an adjusted view of EBITDA that takes into account certain significant non-recurring transactions, if any, such as impairment losses and expenses associated with pending acquisitions, which vary significantly between periods and are not recurring in nature, as well as certain recurring non-cash charges such as changes in fair value of the Company’s derivative liabilities and stock-based compensation. The Company also believes that Adjusted EBITDA provides investors with a measure of the Company’s operational and financial progress that corresponds with the measurements used by management as a basis for allocating resources and making other operating decisions. Although the Company uses Adjusted EBITDA as one of several financial measures to assess its operating performance, its use is limited as it excludes certain significant operating expenses. Non-GAAP operating EBITDA (OPCO EBITDA) is useful to investors because it reflects EBITDA for the core operation of the business excluding corporate expenses, non-cash expenses and transactional expenses. EBITDA, Adjusted EBITDA, and Non-GAAP operating EBITDA are not intended to represent cash flows for the periods presented, nor have they been presented as an alternative to operating income or as an indicator of operating performance and should not be considered in isolation or as a substitute for measures of performance prepared in accordance with accounting principles generally accepted in the United States of America (“GAAP”). In accordance with SEC Regulation G, the non-GAAP measurements in this press release have been reconciled to the nearest GAAP measurement, which can be viewed under the heading “Reconciliation of Net Loss to Adjusted EBITDA” in the financial table included in this press release.

About Digerati Technologies, Inc.

Digerati Technologies, Inc. (OTCQB: DTGI) is a provider of cloud services specializing in UCaaS (Unified Communications as a Service) solutions for the business market. Through its operating subsidiaries NextLevel Internet (NextLevelinternet.com) T3 Communications (T3com.com), Nexogy (Nexogy.com), and SkyNet Telecom (Skynettelecom.net), the Company is meeting the global needs of small businesses seeking simple, flexible, reliable, and cost-effective communication and network solutions including, cloud PBX, cloud telephony, cloud WAN, cloud call center, cloud mobile, and the delivery of digital oxygen on its broadband network. The Company has developed a robust integration platform to fuel mergers and acquisitions in a highly fragmented market as it delivers business solutions on its carrier-grade network and Only in the Cloud™. For more information, please visit www.digerati-inc.com and follow DTGI on LinkedIn, Twitter and Facebook.

Forward-Looking Statements

The information in this news release includes certain forward-looking statements that are based upon assumptions that in the future may prove not to have been accurate and are subject to significant risks and uncertainties, including statements related to the future financial performance of the Company. Although the Company believes that the expectations reflected in the forward-looking statements such as annualized cost synergies of approximately $500K that are expected to continue contributing to OPCO EBITDA in the coming quarters and the Company expects additional cost synergies over the next 2-3 quarters, are reasonable, it can give no assurance that such expectations or any of its forward-looking statements will prove to be correct. Factors that could cause results to differ include, but are not limited to, successful execution of growth strategies, product development and acceptance, the impact of competitive services and pricing, general economic conditions, and other risks and uncertainties described in the Company’s periodic filings with the Securities and Exchange Commission. 

Facebook: Digerati Technologies, Inc.

Twitter: @DIGERATI_IR
LinkedIn: Digerati Technologies, Inc.

Investors:

The Eversull Group
Jack Eversull
jack@theeversullgroup.com
(972) 571-1624

ClearThink
Brian Loper
bloper@clearthink.capital
(347) 413-4234


Reconciliation
of Net Income (Loss) to Adjusted EBITDA


DIGERATI TECHNOLOGIES, INC. AND SUBSIDIARIES

CONSOLIDATED STATEMENTS OF OPERATIONS

(In thousands, except per share amounts, unaudited)


Three months ended April 30,


Nine months ended April 30,


2022


2021


2022


2021


OPERATING REVENUES:


Cloud software and service revenue


$

8,163


$

3,751


$

15,959


$

8,629


Total operating revenues


8,163


3,751


15,959


8,629


OPERATING EXPENSES:


Cost of services (exclusive of depreciation and amortization)


3,161


1,526


6,203


3,708


Selling, general and administrative expense


4,296


1,993


8,211


4,969


Legal and professional fees


756


204


2,505


717


Bad debt


36


5


51


9


Depreciation and amortization expense


1,540


611


2,514


1,204


Total operating expenses


9,789


4,339


19,484


10,607


OPERATING LOSS


(1,626

)


(588

)


(3,525

)


(1,978

)


OTHER INCOME (EXPENSE):


Gain (loss) on derivative instruments


6,827


(10,878

)


7,835


(10,860

)


Loss on extinguishment of debt


(5,480

)


Gain on settlement of debt


150


347


Income tax benefit (expense)


(167

)


(63

)


(285

)


(122

)


Other income (expense)


2


Interest expense


(1,676

)


(1,577

)


(4,563

)


(3,079

)


Total other income (expense)


4,986


(12,368

)


(2,493

)


(13,714

)


NET INCOME (LOSS) INCLUDING NONCONTROLLING INTEREST


3,360


(12,956

)


(6,018

)


(15,692

)


Less: Net loss attributable to the noncontrolling interests


546


158


1,306


223


NET INCOME (LOSS) ATTRIBUTABLE TO DIGERATI’S SHAREHOLDERS


3,906


(12,798

)


(4,712

)


(15,469

)


Deemed dividend on Series A Convertible preferred stock


(4

)


(5

)


(14

)


(15

)


NET INCOME (LOSS) ATTRIBUTABLE TO DIGERATI’S COMMON SHAREHOLDERS


$

3,902


$

(12,803

)


$

(4,726

)


$

(15,484

)


INCOME (LOSS) PER COMMON SHARE – BASIC


$

0.03


$

(0.09

)


$

(0.03

)


$

(0.12

)


LOSS PER COMMON SHARE – DILUTED


$

(0.01

)


$

(0.09

)


$

(0.03

)


$

(0.12

)


WEIGHTED AVERAGE COMMON SHARES OUTSTANDING – BASIC


139,751,107


136,719,871


139,285,833


126,524,312


WEIGHTED AVERAGE COMMON SHARES OUTSTANDING – DILUTED


254,167,793


136,719,871


139,285,833


126,524,312


See notes to consolidated unaudited financial statements


Reconciliation
of Net Income (Loss) to Adjusted EBITDA – OPCO, Net of Non-cash expenses
& Transactional Costs.


NET INCOME (LOSS) ATTRIBUTABLE TO
DIGERATI’S SHAREHOLDERS, as reported


$

3,906


$

(12,798

)


$

(4,712

)


$

(15,469

)


EXCLUDING NON-CASH ITEMS
TRANSACTIONAL COSTS & CORP EXP


ADJUSTMENTS:


Stock compensation & warrant expense


28


183


75


906


Corp Expenses (Net of stock compensation & Transactional cost)


412


298


1,169


682


Legal and professional fees – transactional costs


579


110


1,968


488


Depreciation and amortization expense


1,540


611


2,514


1,204


Bad Debt


36


5


51


9


OTHER ADJUSTMENTS


Gain (loss) on derivative instruments


(6,827

)


10,878


(7,835

)


10,860


Loss on extinguishment of debt


5,480


Gain (loss) on settlement of debt


(150

)


(347

)


Other income (expense)


(2

)


Interest expense


1,676


1,577


4,563


3,079


Income tax


167


63


285


122


Less: Net loss attributable to the noncontrolling interest


(546

)


(158

)


(1,306

)


(223

)


ADJUSTED EBITDA – OPCO


$

969


$

619


$

2,252


$

1,311


ADD-BACKS Expenses


Corp Expenses net of stock compensation & Transactional cost


412


298


1,169


682


ADJUSTED EBITDA – INCOME


$

557


$

321


$

1,083


$

629


US Dollar Strength, Commodities Weakness, and Fed Resolve


Image Credit: ILO Photostream (Flickr)


Dollar Strength Impacts Commodity Prices, Money Flow, and Worldwide Inflation

As the dollar strengthens against world currencies, US exports and everything else priced in dollars experience additional inflation as it’s exchanged back to the trading partner’s native currency. This is dampening demand, slowing the rise, and perhaps helping to bring down prices of commodities transacted in US dollars.

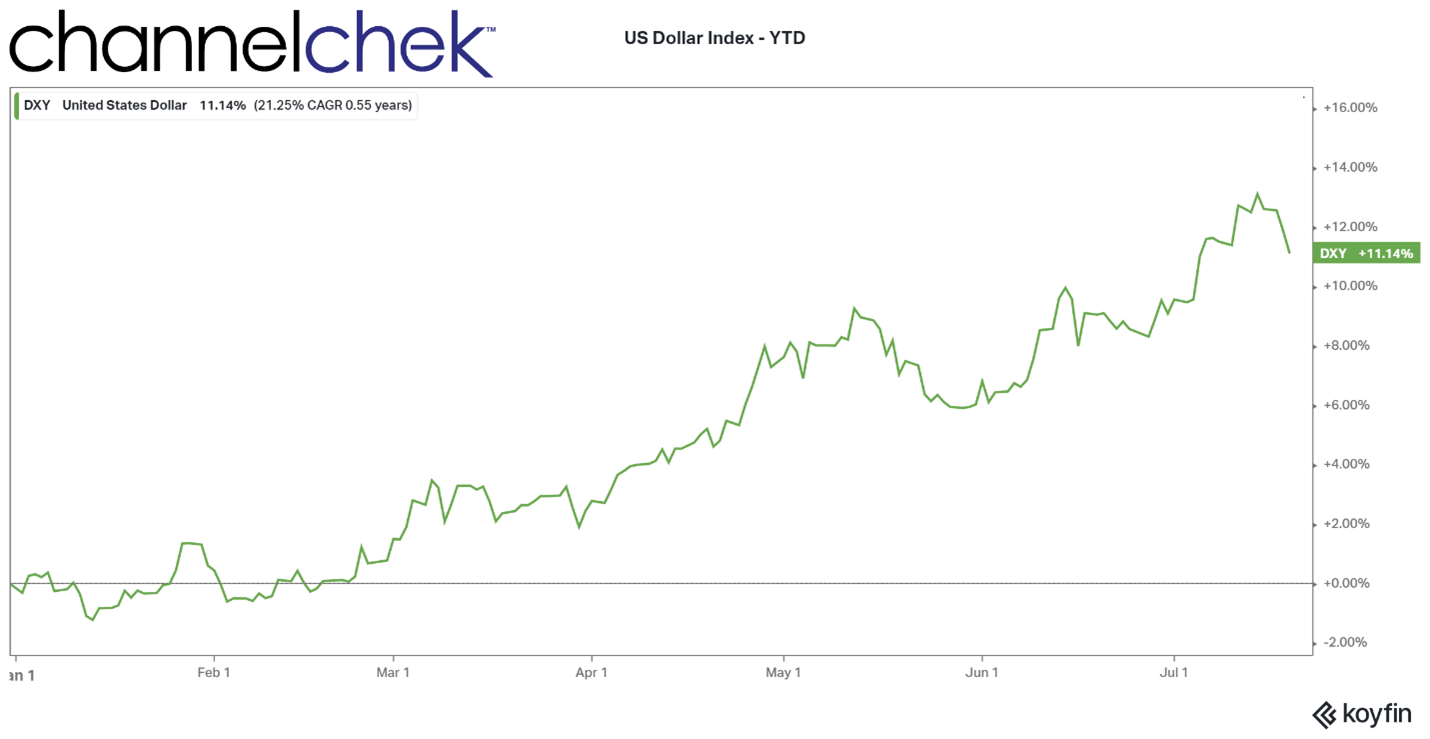
The US dollar index expressed as DXY began the year at 96.21 versus a basket of currencies and is now valued at 106.55 against the same basket. So it has gained over 11% since the beginning of the year. After 20 years of trading below the euro’s value, the US currency has recently met and even exceeded parity with the euro. 


Source: Koyfin

Commodities have been falling in response to worldwide economic stagnation and expected weakness for some time. As the dollar has continued to rise, the trend for commodities priced in US dollars has been in decline. This keeps costs closer to neutral for foreign buyers. Since the beginning of June, trends appear to show that commodities are largely hinged, with a negative correlation, to US dollars. These commodity prices may remain under downward pressure unless there is a correction in the US currency.

Prices of oil, metals, and grain shot up earlier this year in response to Russia’s invasion of Ukraine. These markets are now trading based on dollar conversion rates and expectations that central bank activities will cause a global recession. Additional lockdowns in China are also impacting demand. Copper has slipped below $7,000 a ton for the first time since September 2020, and it is down 27.4% year-to-date.

As economic weakness is expected, investment portfolio risk has come off, and the move out of foreign equities, foreign currencies, and commodities has brought in buyers of US Treasury bonds (transacted in dollars). Other traditional safe havens like gold, yen, or Swiss francs are not attracting much interest.

The Bank of Japan (BOJ) and the European Central Bank (ECB) are scheduled to hold their respective monetary policy meetings in the coming week. The BOJ is expected to maintain its extremely easy money policies. The ECB is expected to begin a cycle of raising rates. This could help unwind some of the strength of the dollar vs. the euro as higher real rates tend to create demand for the underlying method of payment. 

In the US, the Federal Reserve (Fed) has its next meeting on monetary policy next week, beginning on July 26 and concluding on the 27th. The Fed kicked off a hawkish monetary cycle in March and has raised the magnitude of rate hikes from 0.25 percent in March to 0.5 percent in May and 0.75 percent in June. With accelerating inflation well above the 2% Fed target, the Fed chairman has been resolute in his determination to get back ahead of rising prices.

Take Away

To avert risk and earn better yields, there has been an excess of money flowing to US dollar-denominated investments, especially treasuries. This has played out in the foreign exchange markets in a way that has caused a stronger dollar than we’ve experienced in 20 years versus other currencies.

The strong dollar works to lower the prices of goods denominated in US dollars and then converted to a weakening native currency. This dynamic has been pushing commodity prices lower since the second quarter or before. Also pushing prices lower are expectations of a weaker economy and, therefore, less demand.

The lower commodity prices have a slight dampening impact on US costs of manufacturing. Goods coming to the US from overseas also have a favorable exchange rate; combined, these could take some of the steam out of red hot inflation.

The FOMC meets next week to decide on interest rates. The announcement after the meeting is when the Fed chairman sets expectations going forward. These Fed statements will have as much or more implications for market moves (all markets) then the rate adjustment.

Paul Hoffman

Managing Editor, Channelchek

Suggested Content


Why Natural Gas Opportunities Should Not Always be Lumped in With the Oil Sector


Uranium and Natural Gas Investments Turn Green in 2023


Is Biotech’s Outperformance Reaching a New Stage of Development?


The Expected Slower Economy is Bringing Oil Prices Down


Sources

https://www.moneycontrol.com/news/business/commodities/commodities-prices-may-struggle-to-recover-till-substantial-correction-in-dollar-8835411.html

https://www.wsj.com/market-data/commodities

https://www.wsj.com/articles/strong-dollar-fuels-pullback-in-commodity-markets-11658223085?mod=hp_lead_pos2

https://www.wsj.com/articles/falling-commodity-prices-raise-hopes-that-inflation-has-peaked-11656811949?mod=article_inline

https://www.wsj.com/articles/strong-dollar-wins-the-inflation-battle-in-new-spin-on-currency-wars-11657369125?mod=article_inline

https://www.nasdaq.com/articles/what-is-the-dxy-index-2021-03-07

Stay up to date. Follow us:


Understanding Power Grid Blackouts, Brownouts, and Solutions


Image Credit: Andrew Gustar (Flickr)


What is Curtailment? An Electricity Market Expert Explains

Curtailment has a special meaning in electric power systems. It describes any action that reduces the amount of electricity generated to maintain the balance between supply and demand – which is critical for avoiding blackouts.

Recently, curtailment has made news in states like California and Texas that are adding a lot of wind and solar power. On very windy or sunny days, these sources may produce more electricity than the grid can take. So grid managers reduce production to manage that oversupply.

This can be a lost opportunity. Electricity from solar and wind, as well as existing nuclear plants, is inexpensive and emits less greenhouse gases than fossil fuels, so it may be in society’s interest to keep these generators running.

A Special Kind of Surplus

Consumers know about shortages and surpluses in the goods they buy. Shortages mean that shoppers can’t get that PlayStation 5 for Christmas – or, more critically, the bread, water or baby formula they need.

Surpluses look different, like unsold books classified as remainders or Easter candy discounted 80% at local drug stores on Monday morning.

But electricity is not like these goods. On today’s electric grid, shortages and surpluses can both result in the exact same thing – a blackout.

The North American grid transmits electricity as alternating current that changes direction back and forth, like water ebbing and flowing from a vintage hand pump as the handle is pushed up and down. Modern electricity grids require precise levels of frequency – the back-and-forth motion of power – to function properly.

The grid is designed to function at 60 hertz, which means that the flow of electric current shifts back and forth 60 times per second. This is achieved, in part, by ensuring that the amount of electricity produced at any given time is equal to the amount of electricity being used. If too little electricity is produced, frequency on the system drops. If too much electricity is produced, then frequency increases.

Modern power plants are designed to operate within a relatively narrow range around 60 hertz. If the actual frequency on the grid is outside that range, the plant can disconnect itself from the system. If enough plants do that, it causes a blackout.

As the U.S. electric power industry shifts increasingly to renewable sources, the national power grid will require major updates.

Managing the Flow

In some parts of the U.S., mostly the Southeast and the West, the same companies generate electricity and deliver it to customers. When power plants in a utility’s territory generate more electricity than customers are using, the company will simply produce less electricity from its most expensive power plant, or temporarily shut it off altogether.

But other states have restructured their electricity markets so that some companies produce power and others deliver it to customers. In these competitive markets, curtailment raises complex issues. Power generators stay in business by generating and selling power, so when demand drops, grid operators need a system to ensure that they make curtailment decisions fairly.

Often the first tool for choosing which plants to curtail is the prices that generators are paid. When supply grows or demand falls, the price of electricity falls. Some generators may decide that they are unwilling to produce electricity below a certain price and drop off if it hits that level.

If there’s still a power surplus, the organization that operates the grid steps in to manually curtail generators. They can either do this through signals in the grid’s data system or by contacting generators directly through phone calls. Power may be curtailed for five minutes or five hours, depending on how quickly the system returns to normal.

Overall, the U.S. needs more low-emissions electricity to help reduce air pollution and slow climate change. So curtailment isn’t a sound long-term strategy for managing power surpluses. It’s somewhat comparable to the early days of the COVID-19 pandemic when supply chain disruptions forced producers to throw away huge quantities of food even as grocery stores struggled to fill their shelves.

One solution is to expand energy storage so that generators can save excess power for a few hours instead of sending it straight into the grid. Another option is building more transmission to carry power to areas that need it. Both types of investments can reduce the need to curtail generation and forgo making clean, affordable electricity.

This article was republished with permission permission from  The Conversation, a news site dedicated to sharing ideas from academic
experts. It represents the research-based findings and thoughts of Theodore J. Kury, Director of Energy Studies, University of Florida.


Suggested Content


Clean vs Dirty Electrons on Power Grid


High Food and High Real Estate Prices Should Cause a Shift in Investors’ Watch-Lists


How does the Gates Buffett Natrium Reactor Work?


This Firm Facilitates Direct Investment in Physical Uranium

Stay up to date. Follow us:


Release – Alliance Resource Partners, L.P. Announces Second Quarter 2022 Earnings Conference Call


Alliance Resource Partners, L.P. Announces Second Quarter 2022 Earnings Conference Call

Research, News, and Market Data on Alliance Resource Partners

TULSA, Okla.–(BUSINESS WIRE)– Alliance Resource Partners, L.P. (NASDAQ: ARLP) will report its second quarter 2022 financial results before the market opens on Monday, August 1, 2022. Alliance management will discuss these results during a conference call beginning at 10:00 a.m. Eastern that same day.

To participate in the conference call, dial (877) 407-0784 and request to be connected to the Alliance Resource Partners, L.P. earnings conference call. International callers should dial (201) 689-8560 and request to be connected to the same call. Investors may also listen to the call via the “investor information” section of ARLP’s website at http://www.arlp.com.

An audio replay of the conference call will be available for approximately one week. To access the audio replay, dial U.S. Toll Free (844) 512-2921; International Toll (412) 317-6671 and request to be connected to replay using access code 13731312.

About Alliance
Resource Partners, L.P.

ARLP is a diversified energy company that is currently the largest coal producer in the Eastern United States. ARLP also generates operating and royalty income from mineral interests it owns in strategic coal and oil & gas producing regions in the United States. In addition, ARLP is positioning itself as an energy provider for the future by leveraging its core technology and operating competencies to make strategic investments in the fast-growing energy and infrastructure transition.

News, unit prices and additional information about ARLP, including filings with the Securities and Exchange Commission (“SEC”), are available at http://www.arlp.com. For more information, contact the investor relations department of ARLP at (918) 295-7674 or via e-mail at investorrelations@arlp.com.

Brian L. Cantrell
Alliance Resource Partners, L.P.
(918) 295-7673


MustGrow Biologics Corp. (MGROF) – A Healthier Way to Grow and Preserve the Food Supply

Monday, July 18, 2022

MustGrow Biologics Corp. (MGROF)
A Healthier Way to Grow and Preserve the Food Supply

Joe Gomes, Senior Research Analyst, Noble Capital Markets, Inc.

Joshua Zoepfel, Research Associate, Noble Capital Markets, Inc.

Refer to the full report for the price target, fundamental analysis, and rating.

Initiating Coverage. We are initiating coverage of MustGrow Biologics Corp. with a Market Perform rating. MustGrow is an agtech company with a natural, organic technology platform that has proved highly efficacious in controlling microbial diseases, pests, and weeds. The Company ‘s patented technology has undergone over 110 independent studies confirming its abilities.

A Greener Way. MustGrow harnesses the mustard seed’s natural defense mechanism as the base for its product. MustGrow’s active ingredient possesses several benefits including sustainability, positive soil health, and minor ecological impact. The product has the potential to be priced competitively with conventional alternatives.

This Company Sponsored Research is provided by Noble Capital Markets, Inc., a FINRA and S.E.C. registered broker-dealer (B/D).

*Analyst certification and important disclosures included in the full report. NOTE: investment decisions should not be based upon the content of this research summary. Proper due diligence is required before making any investment decision. 

Release – Orion Group Holdings, Inc. Schedules 2022 Second Quarter Results News Release for Wednesday, July 27th and Conference Call for Thursday, July 28th


Orion Group Holdings, Inc. Schedules 2022 Second Quarter Results News Release for Wednesday, July 27th and Conference Call for Thursday, July 28th

Research, News, and Market Data on Orion Group Holdings

HOUSTON, July 18, 2022 (GLOBE NEWSWIRE) — Orion Group Holdings, Inc. (NYSE: ORN) (the “Company”), a leading specialty construction company, today announced that it will issue its financial results for the second quarter ended June 30, 2022 on Wednesday, July 27, 2022, after the close of the stock market.

ORN’s management will conduct a conference call on Thursday, July 28, 2022 at 10:00 a.m. ET to review these results. To listen to the call live, dial 800-715-9871 in the US and Canada or 646-307-1963 in the US and ask for the Orion Group Holdings Conference Call. To listen to the call via the Internet, please visit 
https://edge.media-server.com/mmc/p/eywdkzdf. Please go to the website 15 minutes early to download and install any necessary audio software. If you are unable to listen live, a replay of the conference call may be accessed for approximately 30 days after the call at Orion Group Holdings’ website.

About Orion Group Holdings

Orion Group Holdings, Inc., a leading specialty construction company serving the infrastructure, industrial and building sectors, provides services both on and off the water in the continental United States, Alaska, Canada and the Caribbean Basin through its marine segment and its concrete segment. The Company’s marine segment provides construction and dredging services relating to marine transportation facility construction, marine pipeline construction, marine environmental structures, dredging of waterways, channels and ports, environmental dredging, design, and specialty services. Its concrete segment provides turnkey concrete construction services including pour and finish, dirt work, layout, forming, rebar, and mesh across the light commercial, structural and other associated business areas. The Company is headquartered in Houston, Texas with regional offices throughout its operating areas.

CONTACT: Orion Group Holdings Inc.

Francis Okoniewski, Vice President Investor Relations

(346) 616-4138

fokoniewski@orn.net

www.oriongroupholdingsinc.com


Source: Orion Group Holdings, Inc.