Release – TheStreet Partners With QuoteMedia to Advance Stock Research Tools and Streaming Solutions


TheStreet Partners With QuoteMedia to Advance Stock Research Tools and Streaming Solutions

Research, News, and Market Data on QuoteMedia

PHOENIX, July 20, 2022 (GLOBE NEWSWIRE) — QuoteMedia, Inc. (OTCQB: QMCI), a leading provider of market data and financial applications, announces today that they have partnered with The Arena Group (NYSE American: AREN) to provide financial market data and hosted content visualizations for their flagship financial destination, TheStreet.com .

To enhance access for a younger and more diverse reader, QuoteMedia’s QMod Suite of responsive market data widgets will integrate data and content across TheStreet.com while optimizing the display for viewing on all types of desktop and mobile devices. Licensed QuoteMedia content includes Equities, Options, Funds and Global Indices data, as well as a wide array of News, Fundamentals, Charting, Analytics and Transactional Portfolio modules to assist in managing TheStreet.com’s subscription products.

“TheStreet.com is one of the most important financial destinations in the world, and it has been for over 20 years,” said Dave Shworan, CEO of QuoteMedia Ltd. “It has been a trusted source of reliable, informative and objective business news and market analysis for decades. Having TheStreet choose QuoteMedia as their data provider is gratifying for our company, and we are very excited to be working with them.”

About The Arena Group
The Arena Group creates robust digital destinations that delight consumers with powerful journalism and news about the things they love – their favorite sports teams, advice on investing, the inside scoop on personal finance, and the latest on lifestyle essentials. With powerful technology, editorial expertise, data management, and marketing savvy, the transformative company enables brands like Sports Illustrated, TheStreet and Parade to deliver highly relevant content and experiences that consumers love. To learn more, visit www.thearenagroup.net.

About TheStreet
TheStreet is a leading digital financial media company. We provide our readers and advertisers with a variety of subscription-based and advertising-supported content and tools through a range of online platforms, including websites, mobile devices, email services, widgets, blogs, podcasts and online video channels.

Media Contacts:
Rachael Fink
Public Relations Manager, The Arena Group
Rachael.Fink@thearenagroup.net

About QuoteMedia
QuoteMedia is a leading software developer and cloud-based syndicator of financial market information and streaming financial data solutions to media, corporations, online brokerages, and financial services companies. The Company licenses interactive stock research tools such as streaming real-time quotes, market research, news, charting, option chains, filings, corporate financials, insider reports, market indices, portfolio management systems, and data feeds. QuoteMedia provides industry leading market data solutions and financial services for companies such as the Nasdaq Stock Exchange, TMX Group (TSX Stock Exchange), Canadian Securities Exchange (CSE), London Stock Exchange Group, FIS, U.S. Bank, Broadridge Financial Systems, JPMorgan Chase, CI Financial, Canaccord Genuity Corp., Hilltop Securities, HD Vest, Stockhouse, TheStreet.com, Zacks Investment Research, The Motley Fool, General Electric, Boeing, Bombardier, Telus International, Business Wire, PR Newswire, FolioFN, Regal Securities, ChoiceTrade, Cetera Financial Group, Dynamic Trend, Inc., Qtrade Financial, CNW Group, IA Private Wealth, Ally Invest, Inc., Suncor, Virtual Brokers, Leede Jones Gable, Firstrade Securities, Charles Schwab, First Financial, Cirano, Equisolve, Stock-Trak, Mergent, Cision, Day Trade Dash and others. Quotestream®, QMod™ and Quotestream Connect™ are trademarks of QuoteMedia. For more information, please visit www.quotemedia.com .

QuoteMedia Investor Relations
Brendan Hopkins
Email: investors@quotemedia.com
Call: (407) 645-5295

Primary Logo

News Provided by GlobeNewswire via QuoteMedia


What Competitive Advantage Looks Like for Capital Markets Firms


Image Credit: Pok Rie (Pexels)


Gaining Competitive Edge: The Data Arms Race in Capital Markets

Capital markets firms are facing competition from many corners, from the continued dominance of passive investing on the buy-side to retail brokers that operate like quasi-fintechs on the sell-side. Gaining competitive edge over both new entrants and incumbents therefore relies on better use of all of a firm’s available assets.

That means gleaning valuable insights in real time from a wide variety of data sources, both internal and external, to better arm your front office decision-makers and trading desks. It also means better understanding your clients’ activities and tailoring your services more appropriately to their requirements.

Over the last decade, much has been written about the rising tide of external data sources from which firms can gain information about particular market trends or opportunities. Whether it’s the evolution of sentiment analytics based on social media data or the addition of new sources of data for tracking environmental information such as satellite imagery, data has been at the forefront of firms’ development of innovative trading strategies, and it will continue to play a significant role in the future.

However, there are many internal sources of data that firms have yet to mine fully for business insights and opportunities, as well as building a 360-degree view of a firm’s clients. Moreover, it’s often the combination of different data sets that makes for greater insights.

Combining internal transaction data with external sentiment data, for example, can highlight patterns of behavior over time that can feed into predictive models. From a transformation standpoint, the successful implementation of artificial intelligence (AI) and machine learning (ML) also requires a high volume of high-quality data.

The evolution of the sell-side front-office has seen personnel change from pure sales traders to quants, who rely on these technologies and reliable data to deliver better returns. It has also witnessed an increasing role for risk management in a front-office context, with related increased demand for real-time risk data analytics.

Technology has become a catalyst for change and the deployment of next generation tools to handle more volume and to better manage risk is a competitive advantage. On the buy-side, there is also an efficiency play around better managing data to reduce the transaction costs for client portfolios. Staying ahead of market risk is key to better managing liquidity, which has been a regulatory concern over the last 24 months within the funds space.

Static reports based on stale data won’t cut it in today’s fast-moving market environment. The past two years have been characterized by market volatility and black swan events, which make up-to-the-second information critically important. For example, think of the difference in responding to breaking news as it happens versus a few hours or even days later. Everyone in the market understands that revenues can be seriously negatively impacted due to latency of information from a trading perspective. Yet C-suite executives often rely on internal reports that are based on stale data due to legacy technology and operational silos.

Many large financial institutions are in the throes of a multi-year transformation program, and most have placed data alongside digital as a pillar of their strategies for the future. After all, the target of aligning business units from a horizontal perspective across the organization can only be achieved via the introduction of a common data foundation.

From a cultural perspective, transformation requires lines of business to be on the same page as each other and greater collaboration can be enabled via the sharing of common data stores. This is where many firms have introduced application programming interface (API) platforms, taking a lead from the retail banking industry in Europe and its focus on open banking.

The move to a cloud environment is also part of this journey and given the regulatory and industry focus on resilience, ensuring the firm is able to switch cloud providers in the future, if required to, is increasingly important. Avoiding cloud platform lock-in is also a commercial imperative for firms that wish to retain negotiating power with their service providers. A data disintermediation layer between a firm and its cloud or software as a service provider is therefore important to enable faster onboarding and future resilience.

However, firms cannot stop and rebuild everything from scratch; they must work within the parameters of their existing technology architectures. APIs also expose the quality of the underlying data from source systems, which can result in a ‘garbage in, garbage out’ quality problem. This is where technologies such as data fabrics can come into play to normalize data from multiple sources and allow it to be consumable by downstream systems and applications. Business decision-makers can then rely on the high quality of the data on which they base their strategic insights, risk management and future plans.

The industry will continue to find new data sources to exploit and add new data-intensive services and technology applications. Just look at the growth of digital assets or the rise of environmental, social and governance (ESG) investment strategies for proof of this dynamic over the last few years. As these new products and services evolve, the complexity of data is only going to increase, and the volumes will grow as firms add more required data sources. How teams surface insights from this data and how quickly they can turn these insights into client-focused activities is already an arms race within the industry. Adding AI and ML into the mix will accelerate the race further.

Firms will also continue to grow organically and inorganically. Silos are almost impossible to eradicate, so learning how to better live with them is part and parcel of a digital transformation program. Interoperability has become a keyword within the industry, due to  the need to connect multiple entities, internal systems and market infrastructures. Interoperability isn’t something that firms should only demand from external providers; it is equally important within the four walls of their organizations. At the heart of interoperable operations is the simplification of the data stack, not by ripping and replacing but via augmentation.

There is little appetite for big bang projects that require multi-year implementations with promised return on investment (ROI) several years down the line. Firms want to become more agile and deliver incremental benefits to their clients sooner rather than later. Building vast new internal platforms from scratch is therefore something best avoided, especially given the ongoing burden to maintain these systems over time. Partnerships with specialist vendors, who can offer the right level of expertise and support is more palatable for those looking for faster deployment and incremental delivery.

Building a more resilient financial institution that can withstand the volatility of the markets, address the new product and services whims of its varied client base, increase its overall agility, and stand its ground against its competitors, new and old, requires a solid data foundation. Firms with reliable, accurate, on-demand data can adapt as the market, regulators and their clients demand.

About the Author:

Virginie O’Shea is CEO and Founder of Firebrand Research. As an analyst
and consultant, Ms. O’Shea specializes in capital markets technology, covering
asset management, international banking systems, securities services and global
financial IT.


Suggested Content


SEC Issues Cautionary Statement to Investors


US Dollar Strength, Commodities Weakness, and Fed Resolve


Blackboxstocks (BLBX) NobleCon18 Presentation Replay


The World is Hot – Panel Presentation Replay from NobleCon18

Stay up to date. Follow us:


Release – NexusBioAg and MustGrow Biologics Announce Exclusive Marketing and Distribution Agreement in Canada


NexusBioAg and MustGrow Biologics Announce Exclusive Marketing and Distribution Agreement in Canada

Research, News, and Market Data on MustGrow Biologics

Collaboration expands
innovative, sustainable and regenerative farming solutions for Canadian growers

Downers Grove, ILL. & SASKATOON, SASK. — July 20, 2022 — Univar Solutions Inc. (NYSE: UNVR) (“Univar
Solutions
“),  a leading global solutions provider to users of specialty ingredients and chemicals, announced today that NexusBioAg, a division of Univar Solutions, and MustGrow Biologics Corp. (CSE: MGRO) (OTC: MGROF) (FRA: 0C0) (“MustGrow“), an agricultural biotechnology company focused on providing science-based biological solutions for high-value crops, have reached an exclusive marketing and distribution agreement in the Canadian canola and pulse market for TerraMG™, a mustard-derived soil biopesticide technology. The addition of this plant-based technology further diversifies and expands NexusBioAg’s extensive portfolio of inoculants, micronutrients, nitrogen stabilizers and foliars for the Canadian agricultural market.

In 2021, NexusBioAg and MustGrow initiated a field research program to develop MustGrow’s sustainable farming technology in Canadian canola and pulse crops. This technology has the potential to address the agronomic challenges of ClubRoot and Aphanomyces diseases which impact these crops. Building on the past data, the companies now are moving forward to the next stage of the development process. Through this exclusive marketing and distribution agreement, NexusBioAg customers have access to the latest in agronomic innovation, which is yet to be registered with Canada’s Pest Management Regulatory Agency.

“TerraMG complements the NexusBioAg portfolio and we are excited to add this technology to our growing product offering. As the sole distributor of TerraMG in Canada for use in canola and pulse crops, this agreement further reinforces NexusBioAg’s commitment to collaborating with leading manufacturers to launch innovative, sustainable and cutting-edge solutions that provide value to the Canadian agricultural industry and benefit its growers,” said Matthew Ottaway, senior vice president, global consumer solutions for Univar Solutions.

NexusBioAg is committed to launching innovative, cutting-edge products, with a focus on sustainability and regenerative agriculture, which benefit the Canadian agricultural industry and growers. MustGrow specializes in the research and development of organic biopesticides, harnessing the mustard seed’s natural defense mechanism with a technology that has the potential to control diseases, pests and weeds. Combining the proficiencies of both companies in the agriculture market will help Canadian growers benefit from innovative and sustainable farming solutions.

“We are very pleased to partner with an organization like NexusBioAg. Their team’s technical and commercial expertise is unparalleled and will be advantageous in accelerating the development and growth of TerraMG for use in Canadian canola and pulse crops. The NexusBioAg team has tremendous knowledge of the Canadian agriculture market as well as sustainable farming solutions. We look forward to commercializing this biopesticide technology in the Canadian market together,” remarked MustGrow COO Colin Bletsky.

For more information about NexusBioAg’s crop nutrition solutions, please visit nexusbioag.com. To learn more about TerraMG™, visit mustgrow.ca.

About Univar Solutions
Univar Solutions (NYSE: UNVR) is a leading global chemical and ingredient distributor representing a premier portfolio from the world’s leading producers. With the industry’s largest private transportation fleet and technical sales force, unparalleled logistics know-how, deep market and regulatory knowledge, formulation and recipe development, and leading digital tools, Univar Solutions is well-positioned to offer tailored solutions and value-added services to a wide range of markets, industries, and applications. While fulfilling its purpose to help keep communities healthy, fed, clean and safe, Univar Solutions is committed to helping customers and suppliers innovate and focus on Growing Together. Learn more at univarsolutions.com.

About NexusBioAg
Univar Solutions’ NexusBioAg provides an expanded portfolio of crop nutrition solutions, including industry-leading inoculants, micronutrients, nitrogen stabilizers, and foliar products. With a diverse collection of inventory and logistics experts, procurement, customer service, agronomists, and sales and marketing experts, NexusBioAg strives to help meet increasingly unique agricultural businesses’ needs. Through these best-in-class capabilities, a collaborative team-oriented approach, and a commitment to agricultural integrity, NexusBioAg is helping customers innovate and grow. Learn more at NexusBioAg.com.

About MustGrow
MustGrow is an agriculture biotech company developing organic biopesticides and bioherbicides by harnessing the natural defense mechanism of the mustard plant to protect the global food supply from diseases, insect pests, and weeds. MustGrow and its leading global partners — Janssen (pharmaceutical division of Johnson & Johnson), Bayer, Sumitomo Corporation, and Univar Solutions’ NexusBioAg — are developing mustard-based organic solutions to potentially replace harmful synthetic chemicals. Over 100 independent tests have been completed, validating MustGrow’s safe and effective approach to crop and food protection. Pending regulatory approval, MustGrow’s patented liquid products could be applied through injection, standard drip or spray equipment, improving functionality and performance features. Now a platform technology, MustGrow and its global partners are pursuing applications in several different industries from preplant soil treatment and weed control, to postharvest disease control and food preservation. MustGrow has approximately 49.2 million basic common shares issued and outstanding and 55.1 million shares fully diluted. For further details please visit mustgrow.ca.  

Univar Forward-Looking Statements
This press release includes certain statements relating to future events and Univar Solutions’ intentions, beliefs, expectations, and predictions for the future, which are “forward-looking statements” within the meaning of Section 27A of the Securities Act of 1933 and Section 21E of the Securities Exchange Act of 1934, as amended. Forward-looking statements are subject to known and unknown risks and uncertainties, many of which may be beyond Univar Solutions’ control. These forward-looking statements are subject to risks and uncertainties that could cause actual results to differ materially from the expectations and assumptions. A detailed discussion of these factors and uncertainties is contained in Univar Solutions’ filings with the Securities and Exchange Commission. Potential factors that could affect such forward-looking statements include, among others: the ultimate geographic spread of the COVID-19 pandemic; the duration and severity of the COVID-19 pandemic; actions that may be taken by governmental authorities to address or otherwise mitigate the impact of the COVID-19 pandemic; the potential negative impacts of COVID-19 on the global economy and Univar Solutions’ customers and suppliers; the overall impact of the COVID-19 pandemic on Univar Solutions’ business, results of operations and financial condition; other fluctuations in general economic conditions, particularly in industrial production and the demands of Univar Solutions’ customers; significant changes in the business strategies of producers or in the operations of Univar Solutions’ customers; increased competitive pressures, including as a result of competitor consolidation; significant changes in the pricing, demand and availability of chemicals; Univar Solutions’ levels of indebtedness, the restrictions imposed by Univar Solutions’ debt instruments, and Univar Solutions’ ability to obtain additional financing when needed; the broad spectrum of laws and regulations that we are subject to, including extensive environmental, health and safety laws and regulations; an inability to integrate the business and systems of companies we acquire, including of Nexeo Solutions, Inc., or to realize the anticipated benefits of such acquisitions; potential business disruptions and security breaches, including cybersecurity incidents; an inability to generate sufficient working capital; increases in transportation and fuel costs and changes in Univar Solutions’ relationship with third party providers; accidents, safety failures, environmental damage, product quality and liability issues and recalls; major or systemic delivery failures involving Univar Solutions’ distribution network or the products we carry; operational risks for which we may not be adequately insured; ongoing litigation and other legal and regulatory risks; challenges associated with international operations; exposure to interest rate and currency fluctuations; potential impairment of goodwill; liabilities associated with acquisitions, ventures and strategic investments; negative developments affecting Univar Solutions’ pension plans and multi-employer pensions; labor disruptions associated with the unionized portion of Univar Solutions’ workforce; and the other factors described in Univar Solutions’ filings with the Securities and Exchange Commission. We caution you that the forward-looking information presented in this press release is not a guarantee of future events or results and that actual events or results may differ materially from those made in or suggested by the forward-looking information contained in this press release. In addition, forward-looking statements generally can be identified by the use of forward-looking terminology such as “may,” “plan,” “seek,” “will,” “expect,” “intend,” “estimate,” “anticipate,” “believe” or “continue” or the negative thereof or variations thereon or similar terminology. Any forward-looking information presented herein is made only as of the date of this press release, and Univar Solutions does not undertake any obligation to update or revise any forward-looking information to reflect changes in assumptions, the occurrence of unanticipated events, or otherwise, except as required by law.

MustGrow Forward-Looking Statements
Certain statements included in this news release constitute “forward-looking statements” which involve known and unknown risks, uncertainties and other factors that may affect the results, performance or achievements of MustGrow.

Generally, forward-looking information can be identified by the use of forward-looking terminology such as “plans”, “expects”, “is expected”, “budget”, “estimates”, “intends”, “anticipates” or “does not anticipate”, or “believes”, or variations of such words and phrases or statements that certain actions, events or results “may”, “could”, “would”, “might”, “occur” or “be achieved”. Examples of forward-looking statements in this news release include, among others, statements MustGrow makes regarding: (i) potential product approvals; (ii) anticipated actions by partners to drive field development work including dose rates, application frequency, application methods, and the regulatory work necessary for commercialization; (iii) expected product efficacy of MustGrow’s mustard-based technologies; and (iv) expected outcomes from collaborations with commercial partners.

Forward-looking statements are subject to a number of risks and uncertainties that may cause the actual results of MustGrow to differ materially from those discussed in such forward-looking statements, and even if such actual results are realized or substantially realized, there can be no assurance that they will have the expected consequences to, or effects on, MustGrow. Important factors that could cause MustGrow’s actual results and financial condition to differ materially from those indicated in the forward-looking statements include, among others, the following: (i) the preferences and choices of agricultural regulators with respect to product approval timelines; (ii) the ability of MustGrow’s partners to meet obligations under their respective agreements; and (iii) other risks described in more detail in MustGrow’s Annual Information Form for the year ended December 31, 2021 and other continuous disclosure documents filed by MustGrow with the applicable securities regulatory authorities which are available at www.sedar.com. Readers are referred to such documents for more detailed information about MustGrow, which is subject to the qualifications, assumptions and notes set forth therein.

This release does not constitute an offer for sale of, nor a solicitation for offers to buy, any securities in the United States.

Neither the CSE nor its Regulation Services Provider (as that term is defined in the policies of the CSE) accepts responsibility for the adequacy or accuracy of this release.

© 2022 MustGrow Biologics Corp. All rights reserved. 


An Alternative Explanation for Today’s Inverted Yield Curve


Image Credit: Karolina Grabowska


Does a Flat or Inverted Yield Curve Still Indicate Recession?

The shape of the treasury yield curve is one indicator the stock market, bond market, and real estate markets are viewing the economy with pessimism. Historically, conventional wisdom has been that if the market has priced rates lower for longer terms than shorter terms, it indicates economic weakness is expected down the road. This would include lower growth, less demand for borrowing, and at the same time, reduced inflationary pressure.

Current Interest Rates

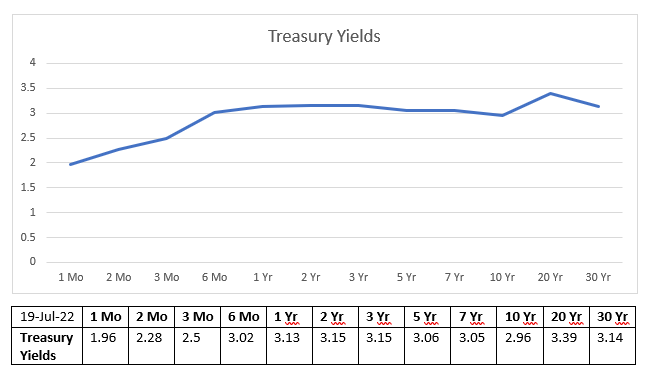
Currently, US Treasuries maturing in one year, and those maturing in 30 years return approximately the same interest rate. The seven and ten-year terms offer rates lower than maturities, longer and shorter. This flat yield curve which is inverted in the shorter end, offers low yields across all maturities. Can we assume it means bond investors expect slowing growth, low inflation, and low inflation out for decades?


Source: US
Treasury


Current Inflation

The increase in the price for a set basket of goods as measured by the Consumer Price Index (CPI-U) data was up 1.3% for the month of June (9.1% YoY). If inflation were to remain at June’s pace for the next two months (1.3%), the three-month compounded impact would be 3.95%. Much higher than the current three-month treasury yield. In fact, it would be higher than all other yields out through 2052. This suggests the mechanisms pricing the market aren’t looking at inflation expectations in the short term and may not be evaluating the risk in the long term either. Otherwise, within the shortest periods of time (3 months), one would expect the curve to be priced in-line with the most recent inflation numbers.


Source: Peter
G. Peterson Foundation

Using conventional wisdom, with the yield curve as a gauge, one would surmise the market expects that inflation will drop by half of the 1.3% it recorded in June over the next month.  If this is true, then the short end and perhaps the long end is priced appropriately. That is until one looks at the added supply that has already been added to treasuries outstanding and that which is expected to enter the market. The increased supply, based on conventional wisdom, should increase the yields needed to sell all the bonds. That’s how supply-demand pressures work.

Unconventional Yield Curve Pricing

The yield curve as an indicator of future economic expectations may be broken.

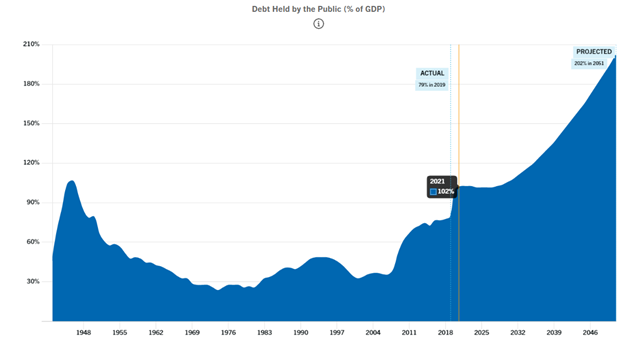
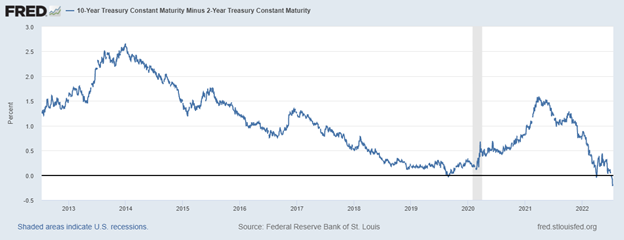
The U.S. has amassed $30,515,000,000,000. In debt. Put another way, if every single person (not household) split this debt burden in order to pay it off tomorrow, they each would owe $91,668. This is approximately double the amount it had been ten years ago, and it is now higher than GDP. As depicted in the chart below, if you go back ten years to 2012, a period with deflationary concerns, there was a yield difference between two-year and ten-year treasuries of plus 1.25%. Today it is negative 0.19% even though there is record inflation and less ability to pay the debt. Plus all rates on the upward sloping curve were higher in 2012 than they are now. Should two-year and ten-year maturities be inverted? Should rates across the curve be lower now even though there are not the same deflationary concerns?


Source: St. Louis Federal Reserve Bank


What May Be Shaping the Curve

One possible answer is the (bond) market believes the US will be driven into such a deep recession that inflation drops to near zero within the next few months. There is no evidence of this in any leading indicators, including the stock market. So we’ll look to see if there is something else skewing the normal pricing mechanisms?

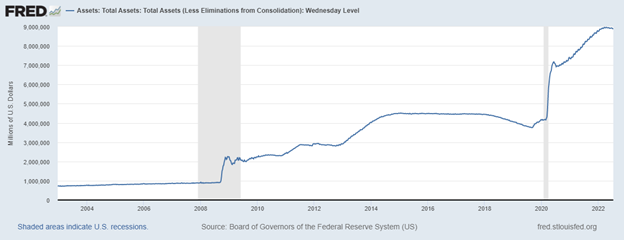
Since May of 2020, the Fed has been controlling interest rates along the entire curve by something they call Yield Curve Control (YCC). The chart below shows the Fed’s holding of US debt increased by $5 trillion from 2020 until today. Much of this was to manipulate the yield curve as they openly announced they would do in May 2020. It was part of their quantitative easing plan which continued into the second quarter of this year.

The Fed is now raising overnight rates quickly. A massive amount of debt in the mid and longer parts of the curve is still being held by the Fed and being unwound at a pace of less than $50 billion per month with the promise of accelerating that in pace September.


Source: St. Louis Federal Reserve Bank

It makes sense that the (bond) market reaction, which includes a flight to quality into US dollar-denominated securities, is not pushing longer rates steeply upward. Despite an annual inflation rate that is higher than it has been in 40 years (treasuries were paying 13% in 1982), the bond market is inverted and hasn’t sold off significantly. This cycle it can’t sell off too much because the largest holder, by far, is not market driven. It is the Fed and is using unconventional policy announced two years ago. So the results don’t follow convention.

Are We Headed Toward a Recession?

The yield curve is slightly inverted. A steep inversion has in the past been a reliable indicator of a recession ahead. As an indicator, today’s yield curve can be expected to be far less accurate than in the past. This is because the Federal Reserve has, up until very recently, been buying treasuries to stimulate the economy and help shape the yield curve. The lowest part of the curve, one year and longer, is the 10-year Treasury note. This is the rate that 30-year mortgages are spread off of; should that rise too quickly, the housing market may fall at an uncomfortable pace.

The economy may very well be in a recession or enter one in the coming months. If it does, the current signs of this happening are less likely to be found in the yield curve than at any other time in US history.

Paul Hoffman

Managing Editor, Channelchek

Suggested Content


The Yield Curve as a Leading Indicator Has Been Compromised


The Detrimental Impact of Fed Policy on Savers


How Much is a Trillion?


Yield Curve Control, Stock Prices, and Trust (June 2020)


Sources

https://fiscaldata.treasury.gov/datasets/debt-to-the-penny/debt-to-the-penny

https://www.pgpf.org/national-debt-clock#:~:text=The%20%2430%20trillion%20gross%20federal,that%20it%20owes%20to%20itself.

https://fred.stlouisfed.org/series/T10Y2Y

https://research.stlouisfed.org/

Stay up to date. Follow us:


Release – Kratos Awarded Contract from U.S. Army Future Command to Demonstrate Military SATCOM Modernization


Kratos Awarded Contract from U.S. Army Future Command to Demonstrate Military SATCOM Modernization

Research, News, and Market Data on Kratos Defense & Security Solutions

Built on Kratos’ OpenSpace
Virtual Ground System Platform, will Support Interoperability, Multi-Mission
Support and Vendor Neutrality

SAN DIEGO
July 20, 2022 (GLOBE NEWSWIRE) — 
Kratos Defense & Security Solutions, Inc. (Nasdaq: KTOS), a leading National Security Solutions provider, announced today that it was awarded a contract from the 
U.S. Army’s Combat Capabilities Development Command to demonstrate a virtualized SATCOM ground system. Based upon Kratos’ OpenSpace Platform, the solution will enable the government to field SATCOM networks in line with modernization goals including streamlining gateway and remote terminal capabilities supported by multiple vendors, reducing life-cycle costs and supporting adaptive, dynamic space operations. Funding for this award was through the Network Command, Control, Communication, and Intelligence Cross-Functional Team (N-CFT) established by the Army’s Future Command.

Supporting a “fighting SATCOM” strategy, future military satellite communications (MilSatCom) networks will require dynamic capabilities such as resiliency, the ability to adapt to suddenly changing mission conditions on the fly and the ability quickly spin up and spin down resources for multi-mission support. Today’s hardware-based networks cannot deliver the speed, interoperability or agility to meet these goals, a situation that is driving digital transformation and modernization efforts across the space industry.

Kratos’ OpenSpace Platform is the only fully-orchestrated, COTS satellite ground system architected on modern, software-defined networking (SDN) principles. OpenSpace digitizes the RF signals flowing to and from satellites so they can be processed and managed in virtual environments such as the cloud. This means applications can be instantiated faster, support multiple missions and orbits, react on-the-fly to changing conditions and operate at lower cost. For example, space network components that typically take weeks or even months to implement in today’s hardware-based world are replaced by virtual network functions (VNF) that can be stood up in just minutes with the OpenSpace Platform. Because it is based on accepted industry standards, OpenSpace is compatible with standards compliant network resources from other companies, assuring interoperability and avoiding vendor lock-in.

Chris Badgett, Vice President of Technology for Kratos Space said, “A strategic goal of the military is to operate an integrated SATCOM enterprise, which increases assured SATCOM access for the warfighter and improves the effectiveness of the infrastructure by enhancing resilience. Kratos’ OpenSpace Platform will show how critical satellite network operations can be made interoperable across domains.”

About Kratos
Defense & Security Solutions

Kratos Defense & Security Solutions, Inc. (NASDAQ:KTOS) develops and fields transformative, affordable technology, platforms and systems for United States National Security related customers, allies and commercial enterprises. Kratos is changing the way breakthrough technology for these industries are rapidly brought to market through proven commercial and venture capital backed approaches, including proactive research and streamlined development processes. At Kratos, affordability is a technology and we specialize in unmanned systems, satellite communications, cyber security/warfare, microwave electronics, missile defense, hypersonic systems, training, combat systems and next generation turbo jet and turbo fan engine development. For more information go to 
www.KratosDefense.com.

Notice Regarding Forward-Looking Statements
Certain statements in this press release may constitute “forward-looking statements” within the meaning of the Private Securities Litigation Reform Act of 1995. These forward-looking statements are made on the basis of the current beliefs, expectations and assumptions of the management of Kratos and are subject to significant risks and uncertainty. Investors are cautioned not to place undue reliance on any such forward-looking statements. All such forward-looking statements speak only as of the date they are made, and Kratos undertakes no obligation to update or revise these statements, whether as a result of new information, future events or otherwise. Although Kratos believes that the expectations reflected in these forward-looking statements are reasonable, these statements involve many risks and uncertainties that may cause actual results to differ materially from what may be expressed or implied in these forward-looking statements. For a further discussion of risks and uncertainties that could cause actual results to differ from those expressed in these forward-looking statements, as well as risks relating to the business of Kratos in general, see the risk disclosures in the Annual Report on Form 10-K of Kratos for the year ended 
December 26, 2021, and in subsequent reports on Forms 10-Q and 8-K and other filings made with the 
SEC by Kratos.

Press Contact: Yolanda White 858-812-7302 Direct

Investor Information:
877-934-4687

investor@kratosdefense.com

Source: Kratos Defense & Security Solutions, Inc.


Why the ARK Invest ESG Fund will Close by August 2022


Image: ARK Funds


Cathie Wood is Unwinding One of Her Firm’s Nine Funds

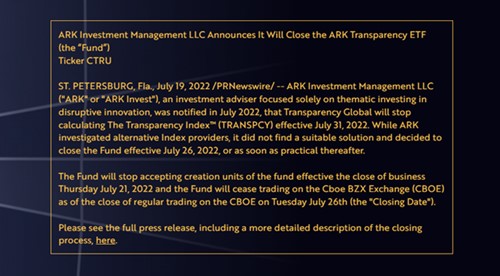
On August 31, 2021, ARK Invest, run by Cathie Wood, filed with the SEC to create her company’s first indexed-based fund. Up until then, all ARK funds were managed by the founder and Chief Investment Officer. Yesterday it was announced the fund will close by the end of July 2022. The ETF, Transparency Global (CRTU), an ESG inspired fund based on The Transparency Index™ (TRANSPCY), will have opened, then closed in less than a year.

Fund Description

The ARK Transparency ETF held companies deemed to be the 100 most transparent companies globally by the index provider. The top five holdings included Teledoc (TDOC), Spotify (SPOT), Bill.com (BILL), Netflix (NFLX), and Acushnet (GOLF). Each of the top five represented about 1% of the fund. The ARK website explains the principle behind the fund in this way, “ARK believes that transparency enhances the performance of companies while benefiting the well-being of people. Transparency implies openness, communication, accountability, and trust.”

The ARK Transparency ETF, which was launched in December, will close later this month, according to a regulatory filing. ARK currently has nine ETFs, including the transparency fund. This is the only fund of ARK’s nine ETFs that is not managed but instead index based. The ARK Transparency ETF followed an index developed by Solactive, a German-based financial index provider, and tracked by Transparency Global.

In early summer Transparency Global told ARK it would no longer calculate the ETF’s underlying benchmark after July.

Fund History

It was
reported when the fund was announced last year that Cathie Wood, the founder of ARK Invest, believes that while this carve-out index has many of the same attributes of popular ESG funds, the transparency screen could provide superior performance. The Ark application to register the then new fund came at a time when there was a massive appetite for ESG investing. At the time, ESG funds were on track for a record year of inflows after amassing $21 billion 

The Transparency fund had accumulated $12 million in assets and had fallen nearly 36% since its inception, according to FactSet. Some of the fund’s largest holdings included Teladoc Health Inc. and Bill.com Holdings Inc., which are both down about 50% this year.

The transparency fund will no longer accept creation units after Thursday and will cease trading on the Cboe BZX Exchange after July 26, according to a statement from the firm.

Paul Hoffman

Managing Editor, Channelchek

Suggested Content


Cathie Wood Talks About Being Wrong


Will Consumers Finally Adjust Spending Down?


The Proposed Ark Index-Based ETF is Appealing to ESG Investors (2021)


The Proposed Ark Index-Based ETF is Appealing to ESG Investors (2021)


Sources

https://www.bloomberg.com/news/articles/2022-07-19/cathie-wood-s-ark-shutters-transparency-etf-in-first-closure

https://etfs.ark-funds.com/hubfs/1_Download_Files_ETF_Website/Prospectuses/ARK%20ETF%20Prospectus%2011.12.21%2021.pdf

https://www.sec.gov/Archives/edgar/data/1579982/000110465921111628/tm2126418d1_485apos.htm

https://transparency.global/transparency-index/

https://www.wsj.com/articles/cathie-woods-ark-to-close-transparency-etf-11658273924?mod=hp_lead_pos12

Stay up to date. Follow us:


The GEO Group (GEO) – Maturity Wall Removed, But at What Cost?

Wednesday, July 20, 2022

The GEO Group (GEO)
Maturity Wall Removed, But at What Cost?

The GEO Group, Inc. (NYSE: GEO) is a leading diversified government service provider, specializing in design, financing, development, and support services for secure facilities, processing centers, and community reentry centers in the United States, Australia, South Africa, and the United Kingdom. GEO’s diversified services include enhanced in-custody rehabilitation and post-release support through the award-winning GEO Continuum of Care®, secure transportation, electronic monitoring, community-based programs, and correctional health and mental health care. GEO’s worldwide operations include the ownership and/or delivery of support services for 103 facilities totaling approximately 83,000 beds, including idle facilities and projects under development, with a workforce of up to approximately 18,000 employees.

Joe Gomes, Senior Research Analyst, Noble Capital Markets, Inc.

Joshua Zoepfel, Research Associate, Noble Capital Markets, Inc.

Refer to the full report for the price target, fundamental analysis, and rating.

Maturity Wall. The GEO Group has entered into a series of proposed transactions with certain of its secured and unsecured creditors that will, if completed, comprehensively address the substantial majority of the Company’s debt maturity wall. This should remove a significant near-term concern of investors and GEO shares reacted as expected, rising 8.50% yesterday.

Details. Recall, GEO has $278 million of debt payments in 2023 and $1.77 billion of repayments in 2024. Although the operating environment has turned favorable, limited capital markets access makes it unlikely GEO would be able to refinance the debt as it came due. The proposed transactions push the maturity wall out far enough that we believe GEO should be able to successfully refinance any debt that remains outstanding….

This Company Sponsored Research is provided by Noble Capital Markets, Inc., a FINRA and S.E.C. registered broker-dealer (B/D).

*Analyst certification and important disclosures included in the full report. NOTE: investment decisions should not be based upon the content of this research summary. Proper due diligence is required before making any investment decision. 

Maple Gold Mines (MGMLF) – Geophysical Survey Underscores Growing Resource Potential

Wednesday, July 20, 2022

Maple Gold Mines (MGMLF)
Geophysical Survey Underscores Growing Resource Potential

Mark Reichman, Senior Research Analyst, Natural Resources, Noble Capital Markets, Inc.

Refer to the full report for the price target, fundamental analysis, and rating.

Geophysical survey results identify new target areas. Maple Gold announced results from a regional airborne magnetic and electromagnetic survey across 278 square kilometers of its joint venture-controlled ground, including the western half of the Douay gold project and the entire Joutel gold project. The survey identified several underexplored target areas and additional targets for follow-up drilling at both Douay and Joutel. The Mag-EM survey results revealed additional targets, not only in the Eagle-Telbel mine area, but also on the greater Douay property where the company identified volcanogenic massive sulfide (VMS) targets in 2018.

Four target areas are underexplored. Multiple anomalies revealed in the survey were categorized into four target areas including: 1) Joutel targets that include several EM anomalies within two to three kilometers of the historical Eagle, Telbel and Eagle West deposits where drilling has been limited, 2) Southeast targets that occur along the largely undrilled Douay-Joutel property boundary, 3) Central targets at Douay to the west of the mineral resource area, and 4) Northwest targets at Douay that are associated with an intrusive-like magnetic anomaly that is over 2 kilometers wide. The central targets at Douay partly coincide and extend beyond VMS copper-zinc-(gold) anomalies identified by the company in 2018….

This Company Sponsored Research is provided by Noble Capital Markets, Inc., a FINRA and S.E.C. registered broker-dealer (B/D).

*Analyst certification and important disclosures included in the full report. NOTE: investment decisions should not be based upon the content of this research summary. Proper due diligence is required before making any investment decision. 

Eskay Mining Corp. (ESKYF) – Multiple Precious Metal VMS Discoveries Underscore District-Scale Potential

Wednesday, July 20, 2022

Eskay Mining Corp. (ESKYF)
Multiple Precious Metal VMS Discoveries Underscore District-Scale Potential

Mark Reichman, Senior Research Analyst, Natural Resources, Noble Capital Markets, Inc.

Refer to the full report for the price target, fundamental analysis, and rating.

Initiating coverage with an Outperform rating. Eskay Mining Corp. is focused on the exploration and development of precious metal volcanogenic massive sulfide (VMS) targets along the Eskay rift in a prolific region of northwest British Columbia known as the “Golden Triangle.” The company’s Eskay precious metal rich VMS project is comprised of 177 claims encompassing 52,600 hectares of highly prospective property within proximity to several world class gold deposits, including the past-producing Eskay Creek mine, which is considered the world’s most precious metal-rich volcanogenic massive sulfide deposit.

Drilling program in full swing. Drilling commenced on June 1 along a 5-kilometer-long corridor encompassing the TV and Jeff precious metal rich VMS targets. To date, the company has completed 5,370 meters of diamond core drilling in 13 holes, or roughly 18% of the 30,000 meters planned to be drilled in 2022. Other targets to be drill-tested this season include: 1) Scarlet Ridge, 2) Excelsior, and 3) C10-Vermillion….

This Company Sponsored Research is provided by Noble Capital Markets, Inc., a FINRA and S.E.C. registered broker-dealer (B/D).

*Analyst certification and important disclosures included in the full report. NOTE: investment decisions should not be based upon the content of this research summary. Proper due diligence is required before making any investment decision. 

How Bad Will the Housing Market Correction Be?


Image Credit: Dave Morgan (Pexels)


The Winds are Changing for Housing, How Long Can Prices Remain High?

Is the Housing market in a correction? Corrections, although unpleasant if your long the asset class, are viewed as normal and healthy. Home values have been climbing for a while. The forces that helped drive other markets higher over the past few years were also at work pushing residential properties up at an unsustainable pace. This year the stock and bond markets have come off of their steamy highs, it appears real estate and housing are setting up to do the same.

On Tuesday (July 19), it was reported by the National Association of Home Builders (NAHB)  that Single Family Starts fell to a two year low of 2%. This came just one day after it was reported that home builder confidence dropped by a steep 12 points to 55 in July. That separate report was a release of the National Association of Home Builders/Wells Fargo Housing Market Index. Sentiment has accelerated downward since December when it stood at 84 (based on 100). It is now at its lowest level since May 2020 and faced with tighter money conditions going forward.

In addition to tighter money (ie, higher mortgage rates), housing headwinds include building material supply chain bottlenecks and elevated construction costs. According to the NAHB, for the first time since June 2020, both single-family starts and permits fell below a 1 million annual pace.


Housing Starts

By falling 2%, housing starts were at a seasonally adjusted annual rate of 1.56 million units in June, according to the U.S. Department of Housing and Urban Development and the U.S. Census Bureau. The June reading of 1.56 million starts is the number of housing units builders would begin if development kept the current pace for the next 12 months. Using this overall number, single-family starts decreased 8.1% to a 982,000 seasonally adjusted annual rate. This is the lowest single-family starts pace since June 2020. Multifamily dwellings, which include apartment buildings and condos, were on the upswing; this sector increased 10.3% an annualized 577,000 pace.

“Single-family starts are retreating on higher construction costs and interest rates, and this decline is reflected in our latest builder surveys, which show a steep drop in builder sentiment for the single-family market,” said Jerry Konter, chairman of the National Association of Home Builders (NAHB). By itself, fewer homes being built and entering the market could be bullish for home sales, but the reason for the slowdown, according to Mr. Konter, is “Builders are reporting weakening traffic as housing affordability declines.”

NAHB Chairman Konter said 13% of builders who participated in the monthly survey said they had reduced home prices over the last month to lure buyers.

Rober Dietz, the chief economist at the NAHB said, “While the multifamily market remains strong on solid rental housing demand, the softening of single-family construction data should send a strong signal to the Federal Reserve that tighter financial conditions are producing a housing downturn. Dietz is concerned that supply may not match needs, “Price growth will slow significantly this year, but a housing deficit relative to demographic need will persist through this ongoing cyclical downturn.”

Regionally and on a year-to-date basis, combined single-family and multifamily starts are 4.4% lower in the Northeast, 4.7% higher in the Midwest, 11.1% higher in the South, and 0.4% lower in the West.


Housing Permits

Overall, permits to build a new home decreased 0.6% in June. Single-family permits decreased 8.0%. This is the lowest pace for single-family permits since June 2020. Multifamily permits again increased by 11.5% to an annualized 718,000 pace.

Regional permit data on a year-to-date basis, permits are 5.1% lower in the Northeast, 2.5% higher in the Midwest, 2.9% higher in the South, and 3.0% higher in the West.


Interest Rates

The average contract interest rate on a 30-year fixed-rate mortgage climbed to 5.51% for the week ending on July 14. The same rate was just below 3% one year earlier.


Take Away

The NAHB indicated a drop in confidence within the housing market due to the impact of high inflation on building costs and rising interest rates. This has resulted in “dramatically slowing sales and buyer traffic.”

Mortgage rate increases come at a time when houses are still at or near their highs from the surge experienced during the pandemic. The housing “correction” could bring monthly costs of owning a home in line with what they had been prior to recent mortgage rate increases. This would mean prices low enough to equate to the same monthly outlay to the buyer. Should the economy weaken further, there is the potential for home prices to decline further.

All markets impact the others. When housing prices rise, people feel better about their financial situation. Owners also find it easier to borrow against their home’s appreciation. The economy and stock markets all tend to do better. Home prices have remained near their highs, a shallow correction might be welcome to those that are just now looking to enter the market for a home.

Paul Hoffman

Managing Editor, Channelchek

Suggested Content


What Will It Take to End Rampant Home-Price Inflation?


Avoiding the Noise and Focusing on Managing Your Investments


The Soft Landing Challenge, Fed Chairman Makes No Promises


US Dollar Strength, Commodities Weakness, and Fed Resolve


Stay up to date. Follow us:


Understanding Drug Names – There is a Methodology


Image Credit: Diverse Stock Photos (Flickr)


Why are Drug Names So Long and Complicated? A Pharmacist Explains the Logic Behind the Nomenclature

At some point in your life, you’ll likely find yourself with a prescription from your doctor to fill. While it’s important to keep track of all the medications you’re taking, that can be hard to do when the names of so many of these drugs are difficult to pronounce and even harder to remember.

This article was republished with permission from The Conversation, a news
site dedicated to sharing ideas from academic experts. It was written by and
represents the research-based opinions of Jasmine Cutler, Assistant
Professor of Pharmacotherapeutics, University of South Florida

In my role as a pharmacist, I’ve helped countless patients figure out exactly which medication they were taking for what ailment. Some wonder why they were prescribed the medication in the first place, or need help differentiating between drugs with names that seem like complete gibberish.

But there is a rhyme and a reason to drug names. All prescribed medications follow a standard nomenclature that describes what the drug is made of and how it functions.


Who Names Drugs?

Drugs get both a brand, or proprietary, name and a generic name that is nonproprietary. Each is assigned in a slightly different process.

As long as a drug compound isn’t trademarked, drug companies decide on a proprietary brand name for the medications they sell. Usually the brand name relates to the conditions the drug is intended to treat and is easy for both providers and patients to remember but doesn’t follow a standardized naming guideline. For example, the drug Lopressor helps lower blood pressure.

On the other hand, generic drug names all follow a standard nomenclature that helps medical providers and researchers more easily recognize and classify the drug. Lopressor, for example, has a generic name of metoprolol tartrate. The U.S. Adopted Names Council, composed of representatives from the Food and Drug Administration, American Medical Association, U.S. Pharmacopeia and American Pharmacists Association, works with the World Health Organization to assign international nonproprietary names, or INNs, to drug compounds. Similar organizations exist internationally.

A globally recognized naming process makes an otherwise confusing name game more manageable. It helps the medical community easily learn and categorize newly approved medications and reduce prescribing errors by providing a unique, standard name that reflects each active ingredient in the drug.

For example, several Type 2 diabetes medications fall under one class called glucagon-like peptide-1 (GLP-1) receptor agonists. Although all medications in this class have different brand names, each of the generic versions ends in the suffix “-tide.” This helps health providers identify all the drugs that belong to this medication class. A few examples include Byetta (exenatide), Trulicity (dulaglutide) and Victoza (liraglutide).


How are Generic Drug Names Assigned?

The naming process starts when a drug company submits an application to the U.S. Adopted Names Council with a proposed generic name. USAN considers a number of factors when evaluating a name, such as whether it relates to how the drug works, how translatable it is to other languages and whether it is easy to say. In general, the name should be simple – fewer than four syllables long – and should not be easily confused with other existing generic drugs.

Once a name is agreed upon by USAN and the drug company, it is then proposed to the INN Expert Group. Sponsored by the World Health Organization, the INN Expert Group is composed of global specialists who represent the pharmaceutical, chemical, pharmacological and biochemical sciences. They may either accept the proposed name or suggest an alternative. Once the drug company, USAN and the INN Expert Group come to an agreement about a name, it is placed in the WHO Drug Information journal for four months for public comments or objections before final adoption.


What’s in a Generic Drug Name?

Generic names follow a prefix-infix-stem system. The prefix helps distinguish a drug from other drugs in the same class. The infix, used more occasionally, further subclassifies the drug. The stem at the very end of the name indicates the drug’s function and marks its place within the name game.

Stems are composed of one or two syllables that describe a drug’s biological effects as well as its physical and chemical qualities and structure. Drugs with the same stem share features like the conditions they treat and how they work in the body. The WHO publishes a regularly updated stem book to keep everything in line.

For example, the stem “-prazole” indicates that the drug is chemically related to a class of compounds called benzimidazoles that have similar functions. As a result, drugs such as lansoprazole (Prevacid), esomeprazole (Nexium) and omeprazole (Prilosec) all treat acid reflux, ulcers and heartburn. The “e” prefix of esomeprazole differentiates it from omeprazole, which has a slightly different chemical structure.

Another common example is drugs that use the stem “stat,” which means enzyme inhibitors. Atorvastatin (Lipitor), rosuvastatin (Crestor) and simvastatin (Zocor) all belong to the same class of inhibitors that block a key enzyme in the body’s cholesterol production process. As a result, these cholesterol-reducing “statins” are used to prevent cardiovascular conditions like heart attack and stroke.


Are There Exceptions to the Name Game?

Although generic names stay consistent, there have been multiple changes to brand names over the past couple of decades after increases in prescribing and dispensing errors. Some examples include the acid reflux and stomach ulcer drug omeprazole, which was rebranded from Losec to Prilosec because it was frequently confused with the diuretic Lasix. Another example is when the antidepressant Brintellix was changed to Trintellix because it was commonly confused with the blood thinner Brilinta.

Some generic medications may work at multiple targets in the body and be used for multiple conditions. For example, drugs with the stem “-afil,” such as tadalafil (Cialis), sidenafil (Viagra) and vardenafil (Levitra), belong to a class of drugs that relax smooth muscle and widen the blood vessels. Although commonly prescribed for erectile dysfunction, they can also be used to treat pulmonary arterial hypertension, a specific type of elevated blood pressure that affects the arteries in the heart and lungs.

In addition, nomenclature guidelines
aren’t set in stone, and the U.S. Adopted Names Council anticipates that they
will continue to change as newer, more complex substances are discovered, developed
and marketed.

For example, a rise in the number of drugs developed with different salts and esters has led to the use of a modified naming process to incorporate the inactive parts of the compound.

As you can guess, it takes health care providers countless months and years to learn and understand this naming process. We are taught the science behind each chemical structure and how it works, which makes it easier to know the rules of the name game. But for those without a background in chemistry and biology, it can be like reading a foreign language.

There are several resources that can help you navigate the drug name game, however. Ask your health care provider or pharmacist if you have questions about how your medication works or what it is used for. They are generally a phone call or visit away.


Suggested Content


Biotech Stocks Outperformance Factors – Will they Continue?


The Netflix Model for Pharmaceuticals


Giving Old Drugs New Purpose to Meet Unmet Needs


What is the Approval Process for Medical Devices?

Stay up to date. Follow us:


Engine Gaming and Media (GAME) – Navigating Troubled Waters

Wednesday, July 20, 2022

Engine Gaming and Media (GAME)
Navigating Troubled Waters

Engine Gaming and Media, Inc. (NASDAQ:GAME) (TSX-V:GAME) provides premium social sports and esports gaming experiences, as well as unparalleled data analytics, marketing, advertising, and intellectual property to support its owned and operated direct-to-consumer properties, while also providing these services to enable its clients and partners. The company’s subsidiaries include Stream Hatchet, the global leader in gaming video distribution analytics; Sideqik, a social influencer marketing discovery, analytics, and activation platform; WinView Games, a social predictive play-along gaming platform for viewers to play while watching live events; and Frankly Media, a digital publishing platform used to create, distribute and monetize content across all digital channels. Engine Media generates revenue through a combination of direct-to-consumer fees, streaming technology and data SaaS-based offerings, and programmatic advertising. For more information, please visit www.enginegaming.com.

Michael Kupinski, Director of Research, Noble Capital Markets, Inc.

Patrick McCann, Research Associate, Noble Capital Markets, Inc.

Refer to the full report for the price target, fundamental analysis, and rating.

Fiscal Q3 results. The company reported Q3 revenue of $9.2 million, which reflected the absence of recently divested businesses. The underlying trends of its existing businesses were strong, with double digit revenue growth and a 5% sequential quarterly revenue improvement from Q2. Adj. EBITDA was a loss of $5.1 million, which did not fully reflect the recent cost cutting initiatives.

Growing SaaS businesses. The company’s SaaS revenue grew 22% YoY to $2 million. Notably, both Stream Hatchet and Sideqik signed extensions to represent major brands during the quarter. Active clients of Stream Hatchet increased 27% in the quarter, while Sideqik’s active client base grew 10%.

This Research is provided by Noble Capital Markets, Inc., a FINRA and S.E.C. registered broker-dealer (B/D).

*Analyst certification and important disclosures included in the full report. NOTE: investment decisions should not be based upon the content of this research summary. Proper due diligence is required before making any investment decision. 

Release – Digerati Technologies Provides Update on its SkyNet and NextLevel Internet Acquisitions


Digerati Technologies Provides Update on its SkyNet and NextLevel Internet Acquisitions

Research, News, and Market Data on Digerati Technologies

SAN ANTONIO, July 19, 2022 (GLOBE NEWSWIRE) — Digerati Technologies, Inc. (OTCQB: DTGI) (“Digerati” or the “Company”), a provider of cloud services specializing in UCaaS (Unified Communications as a Service) solutions for the small to medium-sized business (“SMB”) market, is pleased to provide an update on the integration of its SkyNet and NextLevel Internet acquisitions that were closed in December 2021 and February 2022 and contributed to the Company’s highest quarterly revenue in its history.

The Company is approximately six months into its integration playbook that has resulted in the following:

  • Appointment of Patti Cuthill from NextLevel Internet as VP of People and Culture for the entire organization.
  • Appointment of George Robyn from NextLevel Internet as VP of Engineering and DevOps for the entire organization.
  • Armando Muniz, who joined the Company via the acquisition of ActivePBX in November 2020, was appointed Director of Voice Engineering for the entire organization.
  • Other re-alignments throughout the organization to gain efficiencies and maximize team productivity.
  • Annualized cost synergies of approximately $500K that are expected to continue contributing to OPCO EBITDA in the coming quarters.

The Company and its subsidiaries now serve over 4,000 business customers and approximately 45,000 users, with a run-rate of over $32 million in annual revenue.

As previously highlighted, some of the operating efficiencies, expected cost synergies and consolidation savings from the SkyNet and NextLevel acquisitions were realized over several months following the closing of the transactions. As a result, all of Digerati’s financial measures have steadily improved over the past several months which contributed to an increase in gross margin to 61.3% and improvement in non-GAAP operating EBITDA (OPCO EBITDA) to $0.969 million for the three months ended April 30, 2022. The Company continues to execute on its integration playbook and expects additional cost synergies over the next two to three quarters.

In addition, NextLevel was recently awarded and certified a Great Place to Work for the third year in a row. The prestigious award is based entirely on what current employees say about their experience working at NextLevel. This year, 97% of NextLevel’s employees said it is a great place to work, compared to the national average of 53%.

Arthur L. Smith, Chief Executive Officer of Digerati, commented, “We are pleased with the progress on integration of both SkyNet and NextLevel since the closing of both acquisitions earlier in FY 2022. Our emphasis on the UCaaS/Cloud Communications business, which operates in a segment of the telecommunications industry that continues to experience solid growth as businesses migrate from legacy phone systems to cloud-based telephony systems, has proven to be a solid strategy. We also continue to prove that the M&A aspect of our business model works while increasing penetration in Texas and expanding west into California.”

Mr. Smith added, “I commend our team on successful execution of our integration playbook while achieving financial results that demonstrated improved margins at every operating level and a boost to our profitability.”

Recap of previously reported third quarter ended April 30, 2022:

  • Revenue increased by 118% to $8.163 million compared to $3.751 million for Q3 FY2021.
  • Gross profit increased 125% to $5.002 million compared to $2.225 million for Q3 FY2021.
  • Gross margin increased to 61.3% compared to 59.3% for Q3 FY2021.
  • Non-GAAP Adjusted EBITDA income was $0.557 million, excluding all non-cash items and one-time transactional expenses, compared to Adjusted EBITDA income of $0.321 million for Q3 FY2021.
  • Non-GAAP operating EBITDA (OPCO EBITDA) improved to income of $0.969 million, excluding corporate expenses, all non-cash items, and one-time transactional expenses, compared to a non-GAAP operating EBITDA of $0.619 million for Q3 FY2022.

Digerati expects to report its fourth quarter and fiscal year end July 31, 2022, operating and financial results the week of October 24, 2022.

Use of Non-GAAP Financial Measurements

The Company believes that EBITDA (earnings before interest, taxes, depreciation and amortization) is useful to investors because it is commonly used in the cloud communications industry to evaluate companies on the basis of operating performance and leverage. Adjusted EBITDA provides an adjusted view of EBITDA that takes into account certain significant non-recurring transactions, if any, such as impairment losses and expenses associated with pending acquisitions, which vary significantly between periods and are not recurring in nature, as well as certain recurring non-cash charges such as changes in fair value of the Company’s derivative liabilities and stock-based compensation. The Company also believes that Adjusted EBITDA provides investors with a measure of the Company’s operational and financial progress that corresponds with the measurements used by management as a basis for allocating resources and making other operating decisions. Although the Company uses Adjusted EBITDA as one of several financial measures to assess its operating performance, its use is limited as it excludes certain significant operating expenses. Non-GAAP operating EBITDA (OPCO EBITDA) is useful to investors because it reflects EBITDA for the core operation of the business excluding corporate expenses, non-cash expenses and transactional expenses. EBITDA, Adjusted EBITDA, and Non-GAAP operating EBITDA are not intended to represent cash flows for the periods presented, nor have they been presented as an alternative to operating income or as an indicator of operating performance and should not be considered in isolation or as a substitute for measures of performance prepared in accordance with accounting principles generally accepted in the United States of America (“GAAP”). In accordance with SEC Regulation G, the non-GAAP measurements in this press release have been reconciled to the nearest GAAP measurement, which can be viewed under the heading “Reconciliation of Net Loss to Adjusted EBITDA” in the financial table included in this press release.

About Digerati Technologies, Inc.

Digerati Technologies, Inc. (OTCQB: DTGI) is a provider of cloud services specializing in UCaaS (Unified Communications as a Service) solutions for the business market. Through its operating subsidiaries NextLevel Internet (NextLevelinternet.com) T3 Communications (T3com.com), Nexogy (Nexogy.com), and SkyNet Telecom (Skynettelecom.net), the Company is meeting the global needs of small businesses seeking simple, flexible, reliable, and cost-effective communication and network solutions including, cloud PBX, cloud telephony, cloud WAN, cloud call center, cloud mobile, and the delivery of digital oxygen on its broadband network. The Company has developed a robust integration platform to fuel mergers and acquisitions in a highly fragmented market as it delivers business solutions on its carrier-grade network and Only in the Cloud™. For more information, please visit www.digerati-inc.com and follow DTGI on LinkedIn, Twitter and Facebook.

Forward-Looking Statements

The information in this news release includes certain forward-looking statements that are based upon assumptions that in the future may prove not to have been accurate and are subject to significant risks and uncertainties, including statements related to the future financial performance of the Company. Although the Company believes that the expectations reflected in the forward-looking statements such as annualized cost synergies of approximately $500K that are expected to continue contributing to OPCO EBITDA in the coming quarters and the Company expects additional cost synergies over the next 2-3 quarters, are reasonable, it can give no assurance that such expectations or any of its forward-looking statements will prove to be correct. Factors that could cause results to differ include, but are not limited to, successful execution of growth strategies, product development and acceptance, the impact of competitive services and pricing, general economic conditions, and other risks and uncertainties described in the Company’s periodic filings with the Securities and Exchange Commission. 

Facebook: Digerati Technologies, Inc.

Twitter: @DIGERATI_IR
LinkedIn: Digerati Technologies, Inc.

Investors:

The Eversull Group
Jack Eversull
jack@theeversullgroup.com
(972) 571-1624

ClearThink
Brian Loper
bloper@clearthink.capital
(347) 413-4234


Reconciliation
of Net Income (Loss) to Adjusted EBITDA


DIGERATI TECHNOLOGIES, INC. AND SUBSIDIARIES

CONSOLIDATED STATEMENTS OF OPERATIONS

(In thousands, except per share amounts, unaudited)


Three months ended April 30,


Nine months ended April 30,


2022


2021


2022


2021


OPERATING REVENUES:


Cloud software and service revenue


$

8,163


$

3,751


$

15,959


$

8,629


Total operating revenues


8,163


3,751


15,959


8,629


OPERATING EXPENSES:


Cost of services (exclusive of depreciation and amortization)


3,161


1,526


6,203


3,708


Selling, general and administrative expense


4,296


1,993


8,211


4,969


Legal and professional fees


756


204


2,505


717


Bad debt


36


5


51


9


Depreciation and amortization expense


1,540


611


2,514


1,204


Total operating expenses


9,789


4,339


19,484


10,607


OPERATING LOSS


(1,626

)


(588

)


(3,525

)


(1,978

)


OTHER INCOME (EXPENSE):


Gain (loss) on derivative instruments


6,827


(10,878

)


7,835


(10,860

)


Loss on extinguishment of debt


(5,480

)


Gain on settlement of debt


150


347


Income tax benefit (expense)


(167

)


(63

)


(285

)


(122

)


Other income (expense)


2


Interest expense


(1,676

)


(1,577

)


(4,563

)


(3,079

)


Total other income (expense)


4,986


(12,368

)


(2,493

)


(13,714

)


NET INCOME (LOSS) INCLUDING NONCONTROLLING INTEREST


3,360


(12,956

)


(6,018

)


(15,692

)


Less: Net loss attributable to the noncontrolling interests


546


158


1,306


223


NET INCOME (LOSS) ATTRIBUTABLE TO DIGERATI’S SHAREHOLDERS


3,906


(12,798

)


(4,712

)


(15,469

)


Deemed dividend on Series A Convertible preferred stock


(4

)


(5

)


(14

)


(15

)


NET INCOME (LOSS) ATTRIBUTABLE TO DIGERATI’S COMMON SHAREHOLDERS


$

3,902


$

(12,803

)


$

(4,726

)


$

(15,484

)


INCOME (LOSS) PER COMMON SHARE – BASIC


$

0.03


$

(0.09

)


$

(0.03

)


$

(0.12

)


LOSS PER COMMON SHARE – DILUTED


$

(0.01

)


$

(0.09

)


$

(0.03

)


$

(0.12

)


WEIGHTED AVERAGE COMMON SHARES OUTSTANDING – BASIC


139,751,107


136,719,871


139,285,833


126,524,312


WEIGHTED AVERAGE COMMON SHARES OUTSTANDING – DILUTED


254,167,793


136,719,871


139,285,833


126,524,312


See notes to consolidated unaudited financial statements


Reconciliation
of Net Income (Loss) to Adjusted EBITDA – OPCO, Net of Non-cash expenses
& Transactional Costs.


NET INCOME (LOSS) ATTRIBUTABLE TO
DIGERATI’S SHAREHOLDERS, as reported


$

3,906


$

(12,798

)


$

(4,712

)


$

(15,469

)


EXCLUDING NON-CASH ITEMS
TRANSACTIONAL COSTS & CORP EXP


ADJUSTMENTS:


Stock compensation & warrant expense


28


183


75


906


Corp Expenses (Net of stock compensation & Transactional cost)


412


298


1,169


682


Legal and professional fees – transactional costs


579


110


1,968


488


Depreciation and amortization expense


1,540


611


2,514


1,204


Bad Debt


36


5


51


9


OTHER ADJUSTMENTS


Gain (loss) on derivative instruments


(6,827

)


10,878


(7,835

)


10,860


Loss on extinguishment of debt


5,480


Gain (loss) on settlement of debt


(150

)


(347

)


Other income (expense)


(2

)


Interest expense


1,676


1,577


4,563


3,079


Income tax


167


63


285


122


Less: Net loss attributable to the noncontrolling interest


(546

)


(158

)


(1,306

)


(223

)


ADJUSTED EBITDA – OPCO


$

969


$

619


$

2,252


$

1,311


ADD-BACKS Expenses


Corp Expenses net of stock compensation & Transactional cost


412


298


1,169


682


ADJUSTED EBITDA – INCOME


$

557


$

321


$

1,083


$

629