Release – Voyager Digital Reports Revenue of US$102.7 Million for the Quarter Ended March 31, 2022


Voyager Digital Reports Revenue of US$102.7 Million for the Quarter Ended March 31, 2022

Research, News, and Market Data on Voyager Digital

NEW YORK, May 16, 2022 /CNW/ – Voyager Digital Ltd. (“Voyager” or the “Company”) (TSX: VOYG) (OTCQX: VYGVF) (FRA: UCD2) one of the fastest-growing, publicly traded cryptocurrency platforms in the United States, today announced revenue and user metrics for the fiscal 2022 third quarter ended March 31, 2022.

“We performed strongly amidst the challenging macroeconomic and lower trading volumes seen across our industry,” said Steve Ehrlich, CEO and Co-founder of Voyager. “Despite market conditions, we continued to deliver customer account and net deposit growth, while continuing to build upon our revenue diversification strategy.”

“With the announcement of the private placement of approximately USD$60 million, the Company has over $225 million of net liquidity, comprised of over $175 million in cash, and approximately $50 million in crypto. With the recent changes to our rewards model and actively addressing our cost structure to ensure an efficient use of capital, we are working toward a goal of returning to positive operating income, after adding back stock-based compensation, in early calendar 2023.  Ehrlich continued, “Additionally, in the quarter we successfully launched our extremely popular moon mode and on-boarded customers to the beta programs for both our debit card and desktop app. The debit card is on target and expected to be deployed to the remainder of the waitlist throughout the quarter and the desktop app is set to be expanded to a wide group of customers.”

The Company announces the following for fiscal 2022 third quarter ended March 31, 2022 Financial and Operational Key Metrics:

  • Revenue for the quarter is $102.7 million, up 70% compared to $60.4 million for the quarter ended March 31, 2021.
  • Operating loss is $43.0 million for the quarter vs an income of $29.8 million for the quarter ended March 31, 2021. Operating loss/income includes stock-based compensation of $5.4 million for the quarter vs $5.3 million for the quarter ended March 31, 2021, respectively.
  • Total verified users on the platform stand at 3.5 million, up 9% from 3.2 million at the quarter ended December 31, 2021.
  • Total funded accounts reached 1,190,000 as of March 31, 2022, up 11% from 1,074,000 at the quarter ended December 31, 2021.
  • Total Assets on Platform decreased to $5.8 billion from $6.0 billion at December 31, 2021.
  • Our headcount increased to 318 as of March 31, 2022, from 250 at December 31, 2021.

All figures are
preliminary and unaudited and subject to final adjustment. All amounts are in
U.S. dollars, unless otherwise indicated.

The company is also pleased to announce Ashwin Prithipaul as Chief Financial Officer. He comes to Voyager with deep financial leadership experience, including as the former CFO of Galaxy Digital. In conjunction with this, Evan Psaropoulos is moving into a new role as Chief Commercial Officer to build out the Company’s revenue diversification as well as partner with the new CFO in creating cost efficiencies.

“In closing, we strongly believe we are in the early stages of global crypto adoption. Voyager remains very well capitalized to strategically grow our business and serve consumers amidst a rapidly evolving crypto landscape,” Ehrlich added.

Conference Call Details

Voyager will discuss its fiscal 2022 third quarter results today, May 16, 2022, via a conference call at 8:00 a.m. Eastern Time. To access the webcast, please register by 
clicking here. A live webcast and a replay will be available on the Investor Relations section of the Company’s website at  https://www.investvoyager.com/investorrelations/overview.  

Forward Looking Statements

Certain information in this press release, including, but not limited to, statements regarding future growth and performance of the business, momentum in the businesses, future adoption of digital assets, and the Company’s anticipated results may constitute forward looking information or forward-looking statements, (collectively referred to as “forward-looking statements”)which can be identified by the use of terms such as “may,” “will,” “should,” “expect,” “anticipate,” “project,” “estimate,” “intend,” “continue” or “believe” (or the negatives) or other similar variations under applicable securities laws. Forward-looking statements involve known and unknown risks, uncertainties and other factors that may cause Voyager’s actual results, performance or achievements to be materially different from any of its future results, performance or achievements expressed or implied by forward-looking statements. Moreover, we operate in a very competitive and rapidly changing environment. New risks emerge from time to time. It is not possible for our management to predict all risks, nor can we assess the impact of all factors on our business or the extent to which any factor, or combination of factors, may cause actual results to differ materially from those contained in any forward-looking statements we may make. In light of these risks, uncertainties, and assumptions, the future events and trends discussed in this press release may not occur and actual results could differ materially and adversely from those anticipated or implied in the forward-looking statements. Forward looking statements are subject to the risk that the global economy, industry, or the Company’s businesses and investments do not perform as anticipated, that revenue or expenses estimates may not be met or may be materially less or more than those anticipated, that trading momentum does not continue or the demand for trading solutions declines, customer acquisition does not increase as planned, product and international expansion do not occur as planned, risks of compliance with laws and regulations that currently apply or become applicable to the business or the interpretation or application of laws and regulations by regulatory authorities, and those other risks contained in the Company’s public filings, including in its Management Discussion and Analysis and its Annual Information Form (AIF). Factors that could cause actual results of the Company and its businesses to differ materially from those described in such forward-looking statements include, but are not limited to, a decline in the digital asset market or general economic conditions; changes in laws or approaches to regulation, regulatory investigations, enforcement actions or other regulatory action or sanction, the failure or delay in the adoption of digital assets and the blockchain ecosystem by institutions; changes in the volatility of crypto currency, changes in demand for Bitcoin and Ethereum, changes in the status or classification of cryptocurrency assets, cybersecurity breaches, a delay or failure in developing infrastructure for the trading businesses or achieving mandates and gaining traction; failure to grow assets on platform, an adverse development with respect to an issuer or party to the transaction or failure to obtain a required regulatory approval. In connection with the forward-looking statements contained in this press release, the Company has made assumptions that no significant events occur outside of the Company’s normal course of business and that current trends in respect of digital assets continue. Readers are cautioned that the key metrics disclosed in this press release, including, without limitation, Assets on Platform and trading volumes fluctuate and may increase and decrease from time to time and that such fluctuations are beyond the Company’s control. Forward-looking statements, past and present performance and trends are not guarantees of future performance, accordingly, you should not put undue reliance on forward-looking statements, current or past performance, or current or past trends. Information identifying assumptions, risks, and uncertainties relating to the Company are contained in its filings with the Canadian securities regulators available at www.sedar.com. The forward-looking statements in this press release are applicable only as of the date of this release or as of the date specified in the relevant forward-looking statement and the Company undertakes no obligation to update any forward-looking statement to reflect events or circumstances after that date or to reflect the occurrence of unanticipated events. The Company assumes no obligation to provide operational updates, except as required by law. If the Company does update one or more forward-looking statements, no inference should be drawn that it will make additional updates with respect to those or other forward-looking statements, unless required by law. Readers are cautioned that past performance is not indicative of future performance and current trends in the business and demand for digital assets may not continue and readers should not put undue reliance on past performance and current trends.  Refer to definition of certain Non-IFRS terms in Management’s Discussion and Analysis including Assets On Platform, Adjusted EBITDA and Adjusted Working Capital.  All figures are in U.S. dollars unless otherwise noted.

About Voyager Digital Ltd.

Voyager Digital Ltd.’s (TSX: 
VOYG) (OTCQX: VYGVF) (FRA: UCD2) US subsidiary, Voyager Digital, LLC, is a fast-growing cryptocurrency platform in the United States founded in 2018 to bring choice, transparency, and cost-efficiency to the marketplace. Voyager offers a secure way to trade over 100 different crypto assets using its easy-to-use mobile application. Through its subsidiary Coinify ApS, Voyager provides crypto payment solutions for both consumers and merchants around the globe. To learn more about the company, please visit https://www.investvoyager.com.

The TSX has not approved
or disapproved of the information contained herein.

Press Contacts

Voyager Digital, Ltd.
Kevin Rodriguez

Investor Relations
(212) 547-8807
krodriguez@investvoyager.com

Voyager Public Relations Team
pr@investvoyager.com

Voyager Digital Ltd.
Interim Condensed Consolidated Statements of Financial Position (Unaudited)
(USD, in thousands)

March 31, 2022

June 30, 2021

Assets

Current assets

Cash and cash equivalents

$            99,406

$            193,933

Cash held for customers

112,413

162,852

Crypto assets held ($895.7 million and $0.0 million restricted, respectively)

3,433,142

2,286,399

Crypto assets loaned

2,022,444

393,561

Crypto assets collateral received

227,339

Investments

31,359

Other current assets

16,111

5,839

Total current assets

5,910,855

3,073,943

Goodwill and intangible assets

79,334

559

Other non-current assets

8,695

2,860

Total assets

$          5,998,884

$          3,077,362

Liabilities

Current liabilities

Crypto assets and fiat payable to customers

$          5,482,009

$          2,807,015

Crypto assets collateral payable

227,339

Crypto assets borrowed

36,832

Warrant liability

6,102

23,810

Other current liabilities

16,155

22,644

Total current liabilities

5,731,605

2,890,301

Other non-current liabilities

9,496

739

Total liabilities

5,741,101

2,891,040

Equity

Share capital

408,353

261,908

Share-based payments reserve

30,570

15,125

Warrant reserve

1,144

3,457

Other comprehensive loss

(347)

Accumulated deficit

(181,937)

(94,168)

Total equity

257,783

186,322

Total liabilities and equity

$          5,998,884

$          3,077,362

Voyager Digital Ltd.
Interim Condensed Consolidated Statements of Comprehensive Income/ (Loss)
(Unaudited)
(USD, in thousands except for shares data)

Three Months Ended March 31,

Nine Months Ended March 31,

2022

2021

2022

2021

Revenues

Transaction revenue

$         33,386

$          53,736

$       163,402

$          57,418

Fees from crypto assets loaned

31,025

6,702

80,892

8,590

Merchant services

18,347

48,148

Staking revenue

14,359

42,788

Other revenue

5,626

13,868

Total revenues

102,743

60,438

349,098

66,008

Operating expenses

Rewards paid to customers

59,321

7,409

182,014

8,949

Marketing and sales

30,367

8,935

82,082

10,288

Cost of merchant services

17,979

47,184

Share-based payments

5,386

5,271

14,506

6,650

Compensation and employee benefits

12,365

2,476

26,984

4,558

Total compensation and employee benefits

17,751

7,747

41,490

11,208

Trade expenses

2,984

726

14,145

1,069

Customer onboarding and service

3,525

2,677

9,179

2,677

Professional and consulting

6,033

1,141

20,371

2,233

General and administrative

7,743

1,957

20,703

5,327

Total operating expenses

145,703

30,592

417,168

41,751

Income/ (loss) before other income/ (loss)

(42,960)

29,846

(68,070)

24,257

Other income/ (loss)

Change in fair value of crypto assets held

(17,516)

12,953

(24,560)

18,440

Change in fair value of investments

18,977

6,114

29,570

Change in fair value of crypto assets borrowed

(30,030)

(13,584)

(36,282)

Change in fair value of warrant liability

9,981

(98,990)

16,825

(116,092)

Fees on crypto assets borrowed

(1,319)

(2,532)

(1,428)

Total other income/ (loss)

(7,535)

(98,409)

(17,737)

(105,792)

Net income/ (loss) before provision/ (benefit) for
income tax

(50,495)

(68,563)

(85,807)

(81,535)

Provision (benefit) for income tax

10,945

1,962

Net income/ (loss)

(61,440)

(68,563)

(87,769)

(81,535)

Other comprehensive income/ (loss)

Foreign currency translation adjustment

(148)

(14)

(347)

(14)

Total comprehensive income/ (loss)

$          (61,588)

$        (68,577)

$       (88,116)

$       (81,549)

Earnings per share

Basic

$           (0.36)

$          (0.49)

$          (0.53)

$          (0.66)

Diluted

$           (0.36)

$          (0.49)

$          (0.53)

$          (0.66)

SOURCE Voyager Digital (Canada) Ltd.


Release – Motorsport Games Reports First Quarter 2022 Financial Results


Motorsport Games Reports First Quarter 2022 Financial Results

Research, News, and Market Data on Motorsport Games

MIAMI, May 16, 2022 (GLOBE NEWSWIRE) — Motorsport Games Inc. (NASDAQ: MSGM) (“Motorsport Games” or the “Company”) today reported financial results for its first quarter ended March 31, 2022 (“Q1 2022”). The Company has also posted to the Company’s investor relations 
website a Q1 2022 Quarter End Review video and a Q1 2022 earnings slide deck, which highlight certain key milestones that occurred in the period, as well as an updated Investor Presentation.

Dmitry Kozko, Chief Executive Officer of Motorsport Games, commented, “In Q1 2022, we continued our product and content releases. We brought the full release of our KartKraft karting simulation to PC, as well as a user experience update to our rFactor 2 racing simulation game that was positively received by our audience. In January 2022, our esports team delivered the sequel to the 24 Hours of Le Mans Virtual as a world-class event, and in February 2022 we held the inaugural 2022 INDYCAR Pro-Challenge. Games and esports initiatives were also bolstered by expanding our relationship with Formula E, and we were selected by Kindred Concepts to power their next generation racing simulation experience for Formula 1 using our rFactor 2 platform.”

Kozko added, “While we continue to explore multiple funding options to resolve our going concern qualifications, we remain confident in our ability to deliver against our product roadmap.”

First Quarter 2022
Business Update

  • Le
    Mans Virtual Series Grand Finale.
     The Company held the 2-day grand finale esports event for the 5-round 2021/22 Le Mans Virtual Series in January 2022, bringing together 50 cars with 200 drivers from 39 different countries. The series was followed by more than 81 million fans across live tv, digital streaming and social media platforms.

  • Official
    KartKraft Launch in January 2022.
     The Company officially launched its first KartKraft racing game in January 2022 after acquiring the intellectual property, assets and code from original developer, Black Delta, in March 2021.

  • rFactor
    2 User Interface Refresh and Content Updates.
     The Company released a new, easier to navigate User Interface for rFactor 2 in January 2022. Additionally, the Company began releasing a regular cadence of quarterly content updates to provide players with the most robust product offering for their virtual racing needs. The Company expects the updates to revamp and improve both its rFactor 2 platform and user experience.

  • INDYCAR
    2022 Esports Pro-Challenge.
     The Company held the inaugural 2022 INDYCAR Esports Pro-Challenge in February 2022, featuring current NTT INDYCAR SERIES drivers, including reigning champion Alex Palou, 4-time Indianapolis 500 champion Helio Castroneves and 2-time series champion Josef Newgarden, making it the first official INDYCAR-branded esports event since the Company entered into the long-term license in July 2021 to produce INDYCAR virtual racing series.

  • rFactor
    2 Racing Simulation Platform Selected To Power Next-Level Formula 1
    Competitive Socializing Experience.
     Adam Breeden, the pioneer of competitive socializing in the U.K., selected rFactor 2 as the racing simulation platform for the newly-formed Kindred Concepts – a groundbreaking, immersive, state of the art F1® racing simulation experience, gamified for a mass audience.

  • rFactor
    2 Became the Official SIM Racing Platform of Formula E.
     The Company implemented Formula E content, including its drivers and teams, into rFactor 2. rFactor 2 now features every season of Formula E since 2018 and enables racing on many high-fidelity circuits within the series. The Formula E content pack was updated in March 2022 and is available to purchase for all users of rFactor 2. In addition, Formula E launched its Accelerate Esports series powered by rFactor 2’s in-game competitions platform, and rFactor 2 will power the Formula E Gaming Arena at future esports races and events allowing players to experience the thrill of the ABB FIA Formula E World Championship in esports venues all around the world.

Financial Results for
the Three Months Ended March 31, 2022

Revenues for Q1 2022 were $3.3 million, as compared to $2.5 million for Q1 2021. The $0.8 million, or 34%, quarter-over-quarter increase reflects higher gaming sales of $0.5 million in Q1 2022, primarily from rFactor 2. Q1 2022 esports revenues increased by $0.3 million, primarily from the 24 Hours of Le Mans esports event held in January 2022.

Jon New, Chief Financial Officer of Motorsport Games, commented, “It is great to see both the growth of revenues in each of our Gaming and esports segments and the increased diversity of our revenue stream, with rFactor 2 and esports contributing 27% of total revenues for the quarter. Our business plan to increase and diversify our revenue stream is beginning to drive improved top-line financial performance.” 

Q1 2022 net loss was $16.0 million, as compared to Q1 2021 net loss of $14.1 million. The $1.9 million increase in net loss was primarily due to a non-cash $9.3 million write-down of goodwill and intangible assets. This was primarily driven by revisions to the product roadmap during Q1 2022, resulting in changes to the scope and timing of new product releases, as well as changes in the value of the Company’s market capitalization during the first quarter of 2022. A $1.2 million increase in Q1 2022 development expenditures, and a $0.7 million increase in sales and marketing spend further contributed to the Q1 2022 increased net loss. The increases in expenses described above were partially offset by a $11.3 million reduction in general and administrative expenses and a $1.4 million reduction in gains from equity method investments.

The Q1 2022 decrease of $11.3 million in general and administrative expenses was primarily due to an $11.9 million reduction in non-recurring IPO expenses that were incurred in Q1 2021, including IPO bonuses and stock-based compensation.

Q1 2022 Adjusted EBITDA loss(1) was $5.6 million, as compared to Q1 2021 Adjusted EBITDA loss of $2.8 million. The $2.7 million increase in Q1 2022 Adjusted EBITDA loss(1) was primarily driven by the same factors as the increased Q1 2022 net loss, higher Q1 2022 interest and amortization and Q1 2021 had more non-operational add-backs with Q1 2021 IPO related expenses (including stock-based compensation).

The following table provides a reconciliation from net loss to Adjusted EBITDA(1) for Q1 2022 and Q1 2021, respectively:

Cash Flow and
Liquidity

For Q1 2022, the Company had negative cash flows from operations of approximately $5.6 million. The Company expects to continue to have negative operating cash flows for the foreseeable future, as it continues to incur expenses to develop new game franchises. The Company’s existing cash on hand will be insufficient to fund its minimum liquidity requirements for at least the next 12 months and will need to be supplemented with additional debt and/or equity financing, cash generated by cost control initiatives, and/or additional changes to its product roadmap to reduce working capital requirements.

The Company’s future liquidity and capital requirements include funds to support the planned costs to operate its business, including amounts required to fund working capital, support the development and introduction of new products, maintain existing game titles and certain capital expenditures. The adequacy of the Company’s available funds generally depends on many factors, including its ability to successfully develop consumer-preferred new products or enhancements to its existing products, continued development and expansion of the Company’s esports platform and its ability to collaborate with and/or acquire other companies or technologies to enhance or complement the Company’s product and service offerings.

The Company is currently seeking additional funds through a variety of arrangements discussed above, and through maintaining and enhancing strong cost controls. There can be no assurances that the sources of liquidity referred to above will provide the Company with sufficient liquidity to meet its ongoing cash requirements as, among other things, the Company’s liquidity can be impacted by a number of factors, including the Company’s level of sales and expenditures, as well as accounts receivable, sales allowances, prepaid manufacturing expenses and accrued expenses.

(1)Use of Non-GAAP Financial Measures

Adjusted EBITDA (the “Non-GAAP Measure”) is not a financial measure defined by U.S. generally accepted accounting principles (“U.S. GAAP”). See the reconciliations of the Non-GAAP Measure to its most directly comparable U.S. GAAP measure in the financial table above.

Adjusted EBITDA, a measure used by management to assess the Company’s operating performance, is defined as EBITDA, which is net loss plus interest (income) expense, depreciation and amortization, less income tax benefit (if any), adjusted to exclude: (i) IPO-related expenses; (ii) acquisition related expenses; (iii) gain attributable to equity method investment resulting from the acquisition of additional equity interest in Le Mans Esports Series Ltd.; (iv) stock-based compensation expenses; (v) impairment of goodwill and intangible assets, and (vi) other charges or gains resulting from non-recurring events. 

The Company uses the Non-GAAP Measure to manage its business and evaluate its financial performance, as Adjusted EBITDA eliminates items that affect comparability between periods that the Company believes are not representative of its core ongoing operating business. Additionally, management believes that using the Non-GAAP Measure is useful to its investors because it enhances investors’ understanding and assessment of the Company’s normalized operating performance and facilitates comparisons to prior periods and its competitors’ results (who may define Adjusted EBITDA differently).

The Non-GAAP Measure is not a recognized term under U.S. GAAP and does not purport to be an alternative to revenue, income/loss from operations, net (loss) income, or cash flows from operations or as a measure of liquidity or any other performance measure derived in accordance with U.S. GAAP. Additionally, the Non-GAAP Measure is not intended to be a measure of free cash flows available for management’s discretionary use, as it does not consider certain cash requirements, such as interest payments, tax payments, working capital requirements and debt service requirements. The Non-GAAP Measure has limitations as an analytical tool, and investors should not consider it in isolation or as a substitute for the Company’s results as reported under U.S. GAAP. Management compensates for the limitations of using non-GAAP financial measures by using them to supplement U.S. GAAP results to provide a more complete understanding of the factors and trends affecting the business than would be presented by using only measures in accordance with U.S. GAAP. Because not all companies use identical calculations, the Company’s measures may not be comparable to other similarly titled measures of other companies. Reconciliations of the Non-GAAP Measure to net loss, its most directly comparable financial measure, calculated and presented in accordance with U.S. GAAP, are presented in the table above.

Conference Call and
Webcast Details

The Company will host a conference call and webcast at 5:00 p.m. ET today, May 16, 2022, to discuss its financial results. The live conference call can be accessed by dialing 1-800-786-6104 from the U.S. or 1-416-981-9029. Alternatively, participants may access the live webcast on the Motorsport Games Investor Relations website at 
https://ir.motorsportgames.com under “Events.”

About Motorsport Games

Motorsport Games, a Motorsport Network company, combines innovative and engaging video games with exciting esports competitions and content for racing fans and gamers around the globe. The Company is the officially licensed video game developer and publisher for iconic motorsport racing series across PC, PlayStation, Xbox, Nintendo Switch and mobile, including NASCAR, INDYCAR, 24 Hours of Le Mans and the British Touring Car Championship (“BTCC”). Motorsport Games is an award-winning esports partner of choice for 24 Hours of Le Mans, Formula E, BTCC, the FIA World Rallycross Championship and the eNASCAR Heat Pro League, among others.

For more information about Motorsport Games visit: www.motorsportgames.com.

Forward-Looking Statements

Certain statements in this press release, the related conference call and webcast which are not historical facts are forward-looking statements within the meaning of Section 27A of the Securities Act of 1933, as amended, and Section 21E of the Securities Exchange Act of 1934, as amended, and are provided pursuant to the safe harbor provisions of the Private Securities Litigation Reform Act of 1995. Any statements in this press release, the related conference call and webcast that are not statements of historical fact may be deemed forward-looking statements. Words such as “continue,” “will,” “may,” “could,” “should,” “expect,” “expected,” “plans,” “intend,” “anticipate,” “believe,” “estimate,” “predict,” “potential,” and similar expressions are intended to identify such forward-looking statements. These forward-looking statements include, but are not limited to, statements concerning: (i) Motorsport Games’ future business, future results of operations and/or financial condition; (ii) the expected future impact of new or planned products or offerings and the timing of launching such products and offerings, including, without limitation our belief that we will deliver against our product roadmap, our expectations that our rFactor 2 updates will revamp and improve both our rFactor 2 platform and user experience and our expectations that rFactor 2 will power the Formula E Gaming Arena at future esports races and events and allow players to experience the thrill of the ABB FIA Formula E World Championship in esports venues all around the world; (iii) the expected future impact of implementing management strategies and the impact of other industry trends, including, without limitation our ability to execute a business continuity plan and adapt to developments real-time, as well as our business plan to increase and diversify our revenue stream; (iv) the ability of the Company to fund future development and operating expenses, including, without exception our expectation that the Company will continue to have negative operating cash flows for the foreseeable future, as we continue to incur expenses to develop new game franchises; and (v) our liquidity and capital requirements, including, without limitation, our ability to continue as a going concern, our belief that our existing cash on hand will not be sufficient to fund our liquidity requirements for at least the next 12 months, our belief that it will be necessary for us to secure additional funds to continue our existing business operations, including any references to our existing $12 million line of credit with our parent company, Motorsport Network, and to fund our obligations, including, without limitation, the Company’s expectation to supplement its liquidity through additional debt and/or equity financing, cash generated by cost control initiatives, and/or additional changes to our product roadmap to reduce working capital requirements, as well as statements regarding our cash flows and anticipated uses of cash. All forward-looking statements involve significant risks and uncertainties that could cause actual results to differ materially from those expressed or implied in the forward-looking statements, many of which are generally outside the control of Motorsport Games and are difficult to predict. Examples of such risks and uncertainties include, but are not limited to: (i) difficulties, delays or less than expected results in achieving the Company’s growth plans, objectives and expectations, such as due to a slower than anticipated economic recovery and/or the Company’s inability, in whole or in part, to continue to execute its business strategies and plans, such as due to less than anticipated customer acceptance of the Company’s new game titles, the Company’s experiencing difficulties or the inability to launch its games as planned, less than anticipated performance of the games impacting customer acceptance and sales and/or greater than anticipated costs and expenses to develop and launch its games, including, without limitation, higher than expected labor costs and, in addition to the factors set forth in (ii) through (iv) below, the Company’s continuing financial condition and ability to obtain additional debt or equity financing to meet its liquidity requirements, such as the going concern qualification on the Company’s annual audited financial statements posing difficulties in obtaining new financing on terms acceptable to the Company, or at all; (ii) difficulties, delays in or unanticipated events that may impact the timing and scope of new product launches, such as due to difficulties or delays in using its product development personnel in Russia due to the Russia invasion of Ukraine and the related sanctions and/or more restrictive sanctions rendering transacting in the region more difficult or costly and/or difficulties and/or delays arising out of any resurgence of the ongoing and prolonged COVID-19 pandemic; (iii) less than expected benefits from implementing the Company’s management strategies and/or adverse economic, market and geopolitical conditions that negatively impact industry trends, such as significant changes in the labor markets, an extended or higher than expected inflationary environment (such as the impact on consumer discretionary spending as a result of significant increases in energy and gas prices which have been increasing since early in 2020), a higher interest rate environment, tax increases impacting consumer discretionary spending and or quantitative easing that results in higher interest rates that negatively impact consumers’ discretionary spending, or adverse developments relating to the Russia invasion of Ukraine; and/or (iv) difficulties and/or delays in resolving our liquidity position, and other unanticipated difficulties in resolving our continuing financial condition and ability to obtain additional capital to meet our liquidity needs, including without limitation, difficulties in securing funding that is on commercially acceptable terms to us or at all, such as our inability to complete in whole or in part any potential debt and/or equity financing transactions, as well as any inability to achieve cost reductions and/or less than expected availability of funds under its $12 million line of credit from Motorsport Network. Factors other than those referred to above could also cause Motorsport Games’ results to differ materially from expected results. Additional examples of such risks and uncertainties include, but are not limited to: (i) delays and higher than anticipated expenses related to the ongoing and prolonged COVID-19 pandemic, any resurgence of COVID-19 and the Russia invasion of Ukraine; (ii) Motorsport Games’ ability (or inability) to maintain existing, and to secure additional, licenses and other agreements with various racing series; (iii) Motorsport Games’ ability to successfully manage and integrate any joint ventures, acquisitions of businesses, solutions or technologies; (iv) unanticipated operating costs, transaction costs and actual or contingent liabilities; (v) the ability to attract and retain qualified employees and key personnel; (vi) adverse effects of increased competition; (vii) changes in consumer behavior, including as a result of general economic factors, such as increased inflation, higher energy prices and higher interest rates; (viii) Motorsport Games’ ability to protect its intellectual property; and/or (ix) local, industry and general business and economic conditions. Additional factors that could cause actual results to differ materially from those expressed or implied in the forward-looking statements can be found in Motorsport Games’ filings with the SEC, including its Annual Report on Form 10-K for the fiscal year ended December 31, 2021, its Quarterly Reports on Form 10-Q filed with the SEC during 2022, as well as in its subsequent filings with the SEC. Motorsport Games anticipates that subsequent events and developments may cause its plans, intentions and expectations to change. Motorsport Games assumes no obligation, and it specifically disclaims any intention or obligation, to update any forward-looking statements, whether as a result of new information, future events or otherwise, except as expressly required by law. Forward-looking statements speak only as of the date they are made and should not be relied upon as representing Motorsport Games’ plans and expectations as of any subsequent date.

Website and Social
Media Disclosure

Investors and others should note that we announce material financial information to our investors using our investor relations website (ir.motorsportgames.com), SEC filings, press releases, public conference calls and webcasts. We use these channels, as well as social media and blogs, to communicate with our investors and the public about our company and our products. It is possible that the information we post on our websites, social media and blogs could be deemed to be material information. Therefore, we encourage investors, the media and others interested in our company to review the information we post on the websites, social media channels and blogs, including the following (which list we will update from time to time on our investor relations website):


Websites


Social Media

motorsportgames.com


Twitter: @msportgames &
@traxiongg


traxion.gg


Instagram: msportgames & traxiongg


motorsport.com


Facebook: Motorsport
Games
 & traxiongg


LinkedIn: Motorsport
Games


Twitch: traxiongg


Reddit: traxiongg

The contents of these websites and social media channels are not part of, nor will they be incorporated by reference into, this press release.

Contacts:

Investors:
Ashley DeSimone
Ashley.DeSimone@icrinc.com

Media:
ASTRSK PR
motorsportgames@astrskpr.com


Harte Hanks (HHS) – A Great Start To The Year

Friday, May 13, 2022

Harte Hanks (HHS)
A Great Start To The Year

Harte Hanks (NASDAQ: HHS) is a leading global customer experience company whose mission is to partner with clients to provide them with CX strategy, data-driven analytics and actionable insights combined with seamless program execution to better understand, attract, and engage their customers. Using its unparalleled resources and award-winning talent in the areas of Customer Care, Fulfillment and Logistics, and Marketing Services, Harte Hanks has a proven track record of driving results for some of the world’s premier brands including Bank of America, GlaxoSmithKline, Unilever, Pfizer, HBOMax, Volvo, Ford, FedEx, Midea, Sony, and IBM among others. Headquartered in Chelmsford, Massachusetts , Harte Hanks has over 2,500 employees in offices across the Americas, Europe and Asia Pacific .

Michael Kupinski, Director of Research, Noble Capital Markets, Inc.

Patrick McCann, Research Associate, Noble Capital Markets, Inc.

Refer to the full report for the price target, fundamental analysis, and rating.

Q1 beats expectations. The company reported Q1 revenue of $49.1 million, a 12.1% increase over the prior year quarter and a solid 7.1% above our estimate of $45.8 million. Adj. EBITDA of $4.8 million, which increased 114% above the prior year quarter, beat our estimate of $2.3 million by 108%.

Fulfillment & Logistics booming. A key driver of the company’s strong quarter was its Fulfillment & Logistics Services segment, which increased revenue 28.4%, a sequential improvement from Q4 at 24.5%. Fulfillment & Logistics will likely be a key revenue driver for the company in 2022, in addition to improving revenue trends in its Marketing Services segment.

This Company Sponsored Research is provided by Noble Capital Markets, Inc., a FINRA and S.E.C. registered broker-dealer (B/D).

*Analyst certification and important disclosures included in the full report. NOTE: investment decisions should not be based upon the content of this research summary. Proper due diligence is required before making any investment decision. 

Sierra Metals (SMTS) – On the Road to Recovery

Friday, May 13, 2022

Sierra Metals (SMTS)
On the Road to Recovery

Sierra Metals Inc. is a diversified Canadian mining company with Green Metal exposure including increasing copper production and base metal production with precious metals byproduct credits, focused on the production and development of its Yauricocha Mine in Peru, and Bolivar and Cusi Mines in Mexico. The Company is focused on increasing production volume and growing mineral resources. Sierra Metals has recently had several new key discoveries and still has many more exciting brownfield exploration opportunities at all three Mines in Peru and Mexico that are within close proximity to the existing mines. Additionally, the Company also has large land packages at all three mines with several prospective regional targets providing longer-term exploration upside and mineral resource growth potential.

Mark Reichman, Senior Research Analyst, Natural Resources, Noble Capital Markets, Inc.

Refer to the full report for the price target, fundamental analysis, and rating.

First quarter earnings exceed expectations. Sierra Metals reported first quarter adjusted net income of $5.9 million, or $0.04 per share, compared with $4.7 million, or $0.03 per share, during the prior year period and our estimate of $5.5 million, or $0.03 per share. Adjusted EBITDA amounted to $16.0 million compared to $27.9 million during the prior year period. The company appears well on its way toward achieving its 2022 production guidance in the range of 79.5 million to 89.7 million pounds of copper equivalent.

Updating estimates. We have increased our 2022 EPS and EBITDA estimates to $0.23 and $101.9 from $0.21 and $100.8 million, respectively. We expect steady growth in EBITDA throughout the year as Bolivar ramps up production and the company makes up for lost first quarter production at Yauricocha during the remainder of the year. While Yauricocha and Bolivar cash and all in sustaining costs per copper equivalent pound remained elevated during the first quarter, management expects achieve its 2022 cost guidance based on higher levels of production during the balance of the year….

This Company Sponsored Research is provided by Noble Capital Markets, Inc., a FINRA and S.E.C. registered broker-dealer (B/D).

*Analyst certification and important disclosures included in the full report. NOTE: investment decisions should not be based upon the content of this research summary. Proper due diligence is required before making any investment decision. 

Kelly Services (KELYA) – A Productive Start to the Year

Friday, May 13, 2022

Kelly Services (KELYA)
A Productive Start to the Year

Kelly (Nasdaq: KELYA, KELYB) connects talented people to companies in need of their skills in areas including Science, Engineering, Education, Office, Contact Center, Light Industrial, and more. We’re always thinking about what’s next in the evolving world of work, and we help people ditch the script on old ways of thinking and embrace the value of all workstyles in the workplace. We directly employ nearly 350,000 people around the world and connect thousands more with work through our global network of talent suppliers and partners in our outsourcing and consulting practice. Revenue in 2021 was $4.9 billion. Visit kellyservices.com and let us help with what’s next for you.

Joe Gomes, Senior Research Analyst, Noble Capital Markets, Inc.

Joshua Zoepfel, Research Associate, Noble Capital Markets, Inc.

Refer to the full report for the price target, fundamental analysis, and rating.

1Q22. Revenue of $1.296 billion was up 7.5% year-over-year (9% in constant currency). Consensus was $1.26 billion and we were also at $1.26 billion. Kelly reported operating earnings of $23.4 million, compared to $10.6 million a year ago. We were at $11.0 million. GAAP loss per share was $1.23 compared to GAAP net income of $0.64/sh. Adjusted EPS for the first quarter was $0.46 versus $0.12 last year. We had projected adjusted EPS of $0.23.

GP Rate Continues to Improve. Management has done a masterful job of increasing gross profit rate over the years, even in the face of the recent economic hardships, including COVID. GP rate for the quarter was 19.9%, up 220 basis points y-o-y. The improvement has come from a combination of steps to improve organic GP and the addition of higher margin specialty business through recent acquisitions. We believe GP rate can continue to increase….

This Company Sponsored Research is provided by Noble Capital Markets, Inc., a FINRA and S.E.C. registered broker-dealer (B/D).

*Analyst certification and important disclosures included in the full report. NOTE: investment decisions should not be based upon the content of this research summary. Proper due diligence is required before making any investment decision. 

Lineage Cell Therapeutics (LCTX) – 1Q22 Reported With Clinical Program Review

Friday, May 13, 2022

Lineage Cell Therapeutics (LCTX)
1Q22 Reported With Clinical Program Review

Lineage Cell Therapeutics is a clinical-stage biotechnology company developing novel cell therapies for unmet medical needs. Lineage’s programs are based on its robust proprietary cell-based therapy platform and associated in-house development and manufacturing capabilities. With this platform Lineage develops and manufactures specialized, terminally differentiated human cells from its pluripotent and progenitor cell starting materials. These differentiated cells are developed to either replace or support cells that are dysfunctional or absent due to degenerative disease or traumatic injury or administered as a means of helping the body mount an effective immune response to cancer. Lineage’s clinical programs are in markets with billion dollar opportunities and include five allogeneic (“off-the-shelf”) product candidates: (i) OpRegen, a retinal pigment epithelial cell therapy in Phase 1/2a development for the treatment of geographic atrophy secondary to age-related macular degeneration; (ii) OPC1, an oligodendrocyte progenitor cell therapy in Phase 1/2a development for the treatment of acute spinal cord injuries; (iii) VAC2, a dendritic cell therapy produced from Lineage’s VAC technology platform for immuno-oncology and infectious disease, currently in Phase 1 clinical development for the treatment of non-small cell lung cancer (iv) ANP1, an auditory neuronal progenitor cell therapy for the potential treatment of auditory neuropathy, and (v) PNC1, a photoreceptor neural cell therapy for the treatment of vision loss due to photoreceptor dysfunction or damage. For more information, please visit www.lineagecell.com or follow the company on Twitter @LineageCell.

Robert LeBoyer, Vice President, Research Analyst, Life Sciences , Noble Capital Markets, Inc.

Refer to the full report for the price target, fundamental analysis, and rating.

Lineage Reported 1Q22.  Lineage Cell Therapies reported a loss of $7.1 million or $(0.04) per share.  Revenues included recognition of a portion of the payment from the Roche/Genentech collaboration, with revenue to be recognized each quarter as obligations under the agreement are completed. Total Operating Expenses included a $3.5 million accrual for a legal settlement.  Cash at the end of the quarter was $78.1 million.

Payment Under The OpRegen Collaboration Will Be Amortized Over The Course Of The Agreement.  In December 2021, Lineage made a collaborative agreement with Roche/Genentech for development and commercialization of OpRegen, its RPE cell transplant for age-related macular degeneration (dry AMD).  Lineage received $50 million in signing fees in January, with a portion going to its early collaborators and licensors.  Lineage will be recognizing the fee as revenue as its obligations under the agreement are met.  We expect uneven, milestone-driven recognition over the next several quarters….

This Company Sponsored Research is provided by Noble Capital Markets, Inc., a FINRA and S.E.C. registered broker-dealer (B/D).

*Analyst certification and important disclosures included in the full report. NOTE: investment decisions should not be based upon the content of this research summary. Proper due diligence is required before making any investment decision. 

Release – Endeavour Silver Announces 2022 Annual General Meeting Voting Results


Endeavour Silver Announces 2022 Annual General Meeting Voting Results

Research, News, and Market Data on Endeavour Silver

VANCOUVER, British Columbia, May 13, 2022 (GLOBE NEWSWIRE)
— Endeavour Silver Corp. (“Endeavour” or the “Company”) (NYSE: EXK; TSX: EDR)
is pleased to announce that at the Company’s 2022 Annual General Meeting (“AGM”) held on May 12, 2022 in Vancouver, shareholders voted in favour of all items of business. A total of 74,416,771 votes were cast or represented by proxy at the AGM, representing 43.57% of the outstanding common shares as of the record date. The following is a tabulation of the votes submitted by proxy:

DIRECTORS

NUMBER OF SHARES

PERCENTAGE OF VOTES
CAST

FOR

WITHHELD/
ABSTAIN

FOR

WITHHELD

Margaret M. Beck

44,199,571

1,947,032

95.78%

4.22%

Ricardo M. Campoy

44,287,849

1,858,754

95.97%

4.03%

Bradford J. Cooke

42,952,074

3,194,529

93.08%

6.92%

Daniel Dickson

45,220,569

926,034

97.99%

2.01%

Amy Jacobsen

45,163,634

982,969

97.87%

2.13%

Rex J. McLennan

42,409,137

3,737,465

91.90%

8.10%

Kenneth Pickering

44,867,006

1,279,596

97.23%

2.77%

Mario D. Szotlender

44,085,535

2,061,067

95.53%

4.47%

All director nominees were re-elected.

On a vote by show of hands, shareholders voted in favour of re-appointing KPMG LLP as auditor of the Company and authorized the Board to fix the auditor’s remuneration for the ensuing year.

About Endeavour Silver – Endeavour Silver Corp. is a mid-tier precious metals mining company that operates two high-grade underground silver-gold mines in Mexico. Endeavour is currently advancing the Terronera mine project towards a development decision, pending financing and final permits and exploring its portfolio of exploration and development projects in Mexico, Chile and the United States to facilitate its goal to become a premier senior silver producer.  Our philosophy of corporate social integrity creates value for all stakeholders.

SOURCE Endeavour Silver Corp.

Contact Information
Trish Moran
Interim Head of Investor Relations
Tel: (416) 564-4290
Email: pmoran@edrsilver.com
Website: www.edrsilver.com


Release – QuoteMedia Announces 18% Revenue Growth for Q1 2022


QuoteMedia Announces 18% Revenue Growth for Q1 2022

Research, News, and Market Data on QuoteMedia

PHOENIX, May 13, 2022 (GLOBE NEWSWIRE) — QuoteMedia, Inc. (OTCQB: QMCI), a leading provider of market data and financial applications, announced financial results for the quarter ended March 31, 2022.

QuoteMedia provides banks, brokerage firms, private equity firms, financial planners and sophisticated investors with a more economical, higher quality alternative source of stock market data and related research information. We compete with several larger legacy organizations and a modest community of other smaller companies. QuoteMedia provides comprehensive market data services, including streaming data feeds, on-demand request-based data (XML/JSON), web content solutions (financial content for website integration) and applications such as Quotestream Professional desktop and mobile.

Highlights for Q1 2022 include the following:

  • Quarterly revenue increased to $4,263,796 in Q1 2022 from $3,606,218 in 2021, an increase of $657,578 (18%).
  • Quarter over quarter revenue increased 9% when comparing Q1 2022 to Q4 2021.
  • Net income for Q1 2022 was $204,666 compared to $23,087 in Q1 2021, an improvement in profitability of $181,579.
  • Adjusted EBITDA for Q1 2022 was $680,424 compared to $243,913 in Q1 2021, an improvement of $436,511.

“2021 was a great year for QuoteMedia, and the momentum has carried over into 2022,” said Robert J. Thompson, Chairman of the Board. “We continued to increase our market share, developed important relationships with clients and partners, created new innovative product and service offerings, and we are continuing to explore other opportunities to grow the company. Consistent with our previous forecasts, we experienced very strong revenue growth during the quarter, and we fully expect to maintain this trajectory throughout the remainder of the year and beyond. Based on clients already under contract, or in final stages of negotiations, we anticipate particularly strong revenue growth in the second half of this year, and we remain on track to achieve full year revenue growth of 20% or higher.”

QuoteMedia will host a conference call Friday, May 13, 2022 at 2:00 PM Eastern Time to discuss the Q1 2022 financial results and provide a business update.

Conference Call Details:

Date: May 13, 2022

Time: 2:00 PM Eastern

Dial-in number: 866-342-8591

Conference ID: QUOTEMEDIA

An audio rebroadcast of the call will be available later at: www.quotemedia.com

About QuoteMedia

QuoteMedia is a leading software developer and cloud-based syndicator of financial market information and streaming financial data solutions to media, corporations, online brokerages, and financial services companies. The Company licenses interactive stock research tools such as streaming real-time quotes, market research, news, charting, option chains, filings, corporate financials, insider reports, market indices, portfolio management systems, and data feeds. QuoteMedia provides industry leading market data solutions and financial services for companies such as the Nasdaq Stock Exchange, TMX Group (TSX Stock Exchange), Canadian Securities Exchange (CSE), London Stock Exchange Group, FIS, U.S. Bank, Broadridge Financial Systems, JPMorgan Chase, CI Financial, Canaccord Genuity Corp., Hilltop Securities, HD Vest, Stockhouse, Zacks Investment Research, General Electric, Boeing, Bombardier, Telus International, Business Wire, PR Newswire, FolioFN, Regal Securities, ChoiceTrade, Cetera Financial Group, Dynamic Trend, Inc., Qtrade Financial, CNW Group, IA Private Wealth, Ally Invest, Inc., Suncor, Virtual Brokers, Leede Jones Gable, Firstrade Securities, Charles Schwab, First Financial, Cirano, Equisolve, Stock-Trak, Mergent, Cision, Day Trade Dash, LLC and others. Quotestream®, QModTM and Quotestream ConnectTM are trademarks of QuoteMedia. For more information, please visit 
www.quotemedia.com .

Statements about QuoteMedia’s future expectations, including future revenue, earnings, and transactions, as well as all other statements in this press release other than historical facts are “forward-looking statements” within the meaning of the Private Securities Litigation Reform Act of 1995. QuoteMedia intends that such forward-looking statements be subject to the safe harbors created thereby. These statements involve risks and uncertainties that are identified from time to time in the Company’s SEC reports and filings and are subject to change at any time. QuoteMedia’s actual results and other corporate developments could differ materially from that which has been anticipated in such statements.

Below are the specific forward-looking statements included in this press release:

  • Consistent with our previous forecasts, we experienced very strong revenue growth during the quarter, and we fully expect to maintain this trajectory throughout the remainder of the year and beyond. Based on clients already under contract, or in final stages of negotiations, we anticipate particularly strong revenue growth in the 2nd half of this year, and we remain on track to achieve full year revenue growth of 20% or higher.

QuoteMedia Investor
Relations

Brendan Hopkins
Email: 
investors@quotemedia.com
Call: (407) 645-5295

Note 1 on Non-GAAP
Financial Measures

We believe that Adjusted EBITDA, as a non-GAAP pro forma financial measure, provides meaningful information to investors in terms of enhancing their understanding of our operating performance and results, as it allows investors to more easily compare our financial performance on a consistent basis compared to the prior year periods. This non-GAAP financial measure also corresponds with the way we expect investment analysts to evaluate and compare our results. Any non-GAAP pro forma financial measures should be considered only as supplements to, and not as substitutes for or in isolation from, or superior to, our other measures of financial information prepared in accordance with GAAP, such as net income attributable to QuoteMedia, Inc.

We define and calculate Adjusted EBITDA as net income attributable to QuoteMedia, Inc., plus: 1) depreciation and amortization, 2) stock compensation expense, 3) interest expense, 4) foreign exchange loss (or minus a foreign exchange gain), and 5) income tax expense. We disclose Adjusted EBITDA because we believe it is a useful metric by which to compare the performance of our business from period to period. We understand that measures similar to Adjusted EBITDA are broadly used by analysts, rating agencies, investors and financial institutions in assessing our performance. Accordingly, we believe that the presentation of Adjusted EBITDA provides useful information to investors. The table below provides a reconciliation of Adjusted EBITDA to net income attributable to QuoteMedia, Inc., the most directly comparable GAAP financial measure.

Quotemedia, Inc. Adjusted EBITDA Reconciliation to Net Income

2022

2021

Net income

$

204,666

$

23,087

Depreciation and amortization

487,095

347,788

Stock-based compensation

4,239

6,939

Interest expense

1,224

1,008

Foreign exchange gain

(17,590)

(2,448)

Income tax expense

790

796

PPP loan forgiveness

(133,257)

Adjusted EBITDA

$

680,424

$

243,913


Release – Garibaldi’s Casper Vein Returns 30 G/T Gold Along Strike To The SE


Casper Vein Returns 30 g/t Gold Along Strike To The South-East

Research, News, and Market Data on Garibaldi Resources

Vancouver, British
Columbia
, May 13, 2022 – Garibaldi Resources (TSXV: GGI) (the “Company” or “Garibaldi”) is pleased to announce results from early-stage exploratory drill holes testing multiple mineralized veins and volcanic rock units at the Casper Quartz Gold Vein System (see news release October 31, 2021). Drilling at Casper, 20km north of E&L in the Eskay Camp of Northwestern British Columbia, was completed in late 2021.

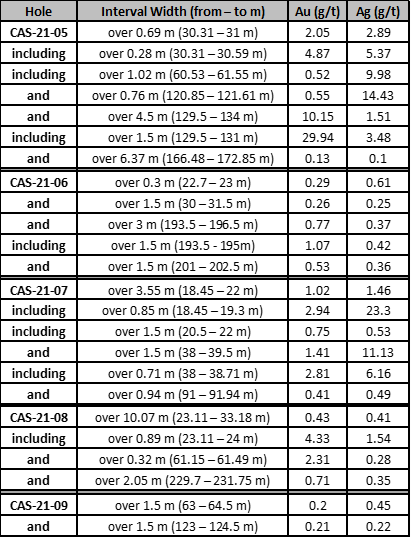
  • Five diamond drill holes followed-up the first four holes into the Casper Discovery reported on Feb. 12 2021. Eight of the nine holes have intersected significant gold mineralization, with increasing gold grades towards the southeast.
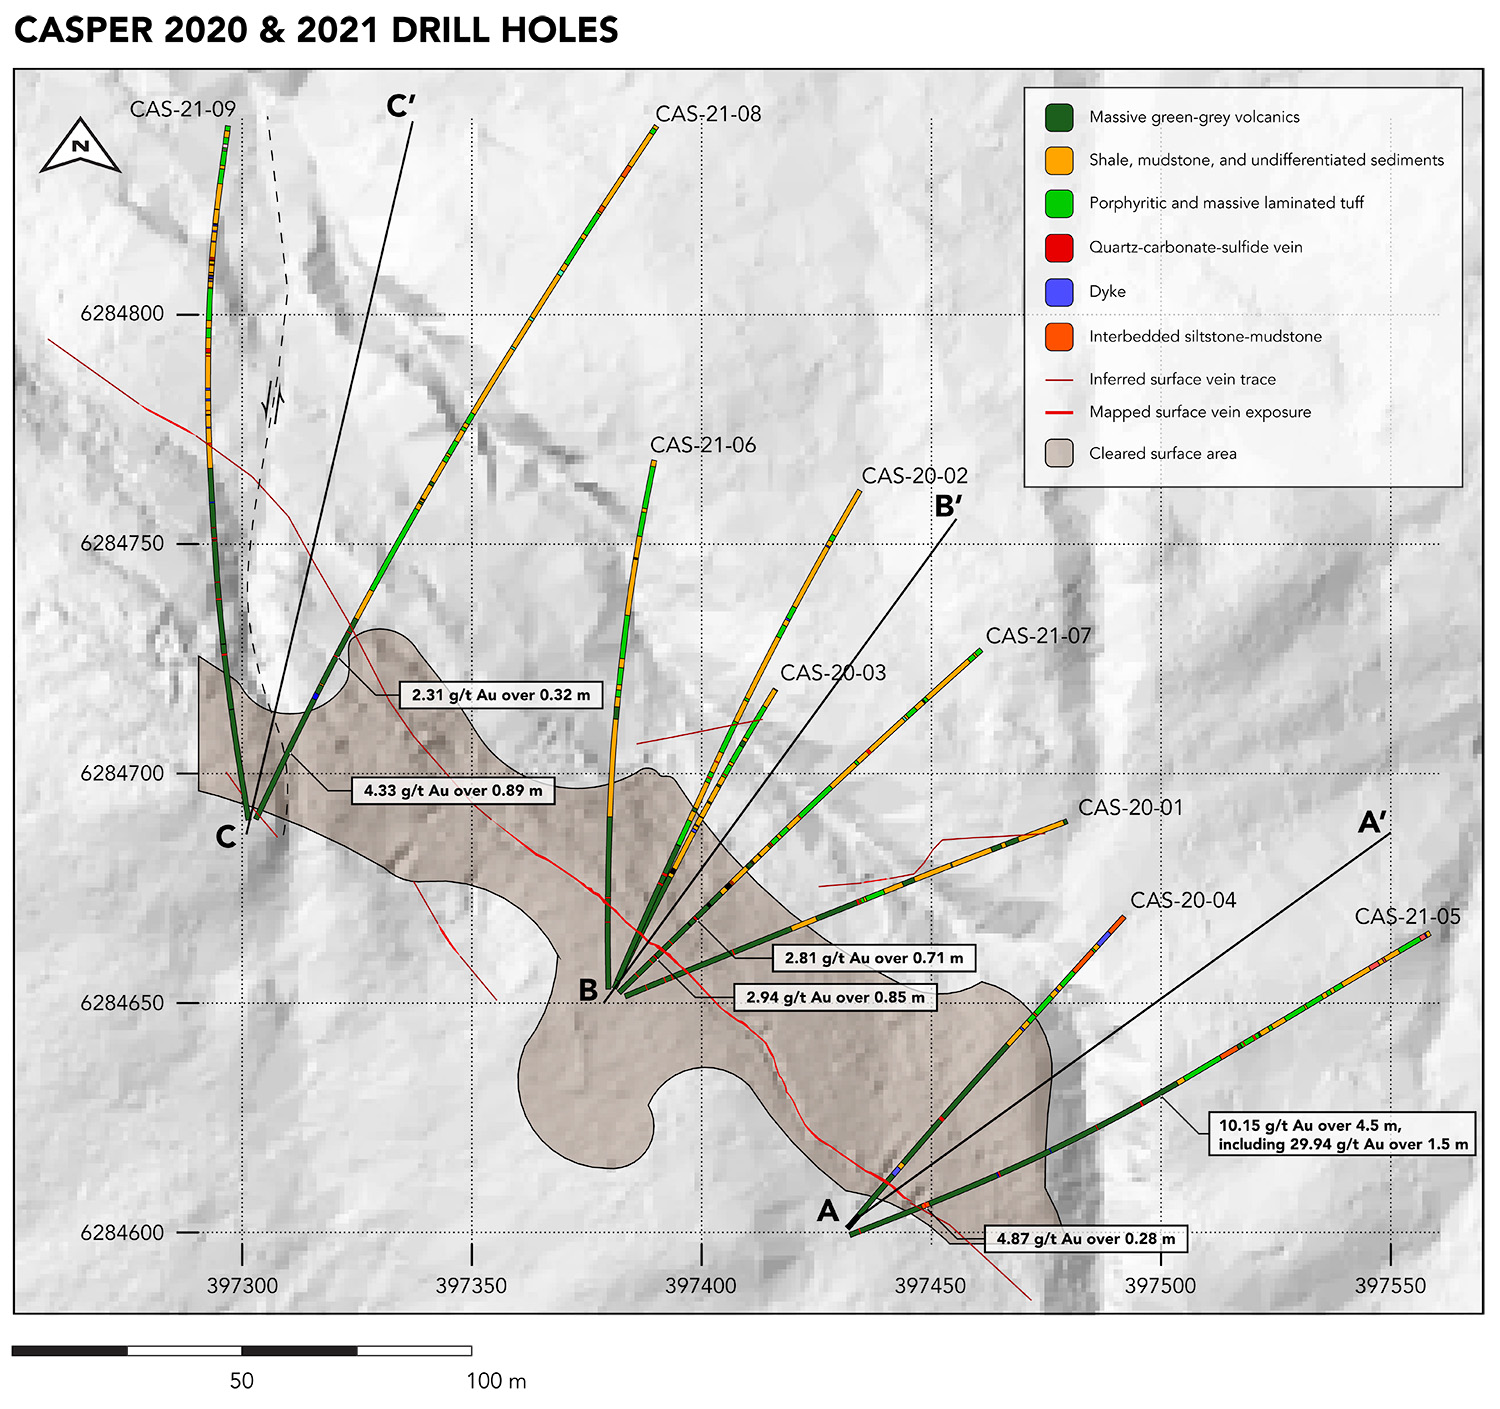
  • Drill core samples from silicified volcanic rocks containing quartz-carbonate-sulfide veins at a depth of 129.5 m returned 10.15 g/t gold over 4.5 m (CAS-21-05: 129.5-134m), including 29.94 g/t gold over 1.5 m (CAS-21-05: 129.5-131m). This intercept may be continuous with the 4-meter-thick mineralized silicified unit containing visible gold intercepted in 2020, located approximately 65 m to the northwest (see news dated Feb. 12, 2021). This hole validates the exploration concept that gold mineralization is associated with a broad silicified volcanic unit rather than discrete local veins, expanding the potential for a much larger gold-bearing mineral system.
  • Elevated gold abundances along a 260m strike length are confirmed by drilling, and the system remains open with increasing potential to the southeast. Previously reported surface trenching has also exposed the Casper vein for over 120m strike length, and select rock samples exceeding 1.0 g/t Au occur at surface for over 330m, within a 500 m wide zone of anomalous gold concentrations in soil.
  • Fine grained visible gold has been intercepted in both 2021 and 2022 drilling as well as 2022 trenching. Multiple grab samples with visible gold trenched in 2020 from the east side of the main Casper vein returned 249.0, 92.3, 75.3 and 58.4 g/t gold (see news dated Sept. 22, 2020)

Exploration at Casper has identified a continuous zone of gold-rich quartz vein mineralization in association with soil geochemical gold anomalies and extensive rock-chip gold anomalies both along strike and across strike indicating potential for multiple sub-parallel veins of mineralization. The development of silicified country rocks with elevated gold content, and the complex structural relationships evident from the LiDAR data highlight the potential that the results sit on the edge of a much larger gold-bearing mineral system where altered country rocks and quartz veins with elevated gold are controlled by NW-SE and N-S lineaments corresponding to a shear zone. An exciting opportunity exists to expand the footprint of the mineral zone and identify structurally-controlled blow-outs with economically interesting grade and thickness of gold-silver mineralization.

Jeremy Hanson, Garibaldi VP-Exploration, stated: “We are very encouraged by the second round of drilling results at Casper. We are still in the very early stages of this project, but we have confirmed that gold is present in both veins and the silicified host rocks. This verifies that the Casper system could be another gold rich system in the Eskay Camp.”

Steve Regoci, Garibaldi CEO stated “The Casper discovery continues to bolster our impressive Eskay area precious metal prospects. It is the first gold system discovered amongst our numerous gold showings which will be the focus of a separate exploration initiative along with Palm Springs during 2022.

The high-grade Ni-Cu-PGE E&L system at Nickel Mountain is the primary focus along with numerous base metal targets identified from the results of the property wide ZTEM geophysical survey. These new base and precious metal targets will provide additional opportunities for significant discoveries in the Golden Triangle.”

Drill Hole Results Table – CAS-21-05 to CAS-20-09

Drill Hole Coordinates Table

Hole

Easting*

Northing*

Elevation
(MASL)

Azimuth (°)

Dip (°)

Length (m)

CAS-21-05

397432

6284599

432

068

-55

248

CAS-21-06

397380

6284653

426

000

-55

210

CAS-21-07

397382

6284652

426

044

-55

180

CAS-21-08

397303

6284690

431

024

-50

262

CAS-21-09

397301

6284690

432

000

-50

253

* UTM Zone 9N WGS 84

Figure 1 – Drill hole traces from 2021-2022 along showing extent of gold mineralization in core and at surface. Drilling has confirmed gold mineralization is present along strike for over 220m, remains open and increases in grade to the southeast. Which is concurrent with exposed surface mineralization before system extends under cover.

Casper Drilling Plan & Sections Maps

See www.garibaldiresources.com for the latest Casper maps & sections outlining mineralized veins and volcanics units.

Quality Assurance/Quality Control (QA/QC)

Garibaldi Resources has applied a rigorous quality assurance/quality control program at the Casper Project using best industry practice. All core was logged by a geoscientist and selected intervals were sampled. NQ drill core was sawn in half and each sample half was placed in a marked sample bag with a corresponding sample tag then sealed. The remaining half core is retained in core boxes that are stored at a secure facility in Smithers, British Columbia. Chain of custody of samples was recorded and maintained for all samples from the drill to the laboratory. All sample batches included 5% QA/QC samples consisting of certified blanks, standards and field duplicates. Multiple certified assay laboratory standards and one blank standard were used in the process. Samples were prepared by crushing the entire sample to 75% passing 2mm, riffle splitting 250g and pulverizing the split to better than 85% passing 105 microns. Gold was analyzed using a 50-gram fire assay and ICP-AES, or metallic screen for coarse gold. Samples with coarse visible gold are subject to the nugget effect, may be difficult to reproduce or duplicate and may not be indicative of the overall mineralization of the vein. Samples with visible gold were analyzed using the Metallic Screen method where a minimum 500 gram sample is crushed and separated into two batches. A Minus batch with particles less than 106 microns, and a Plus batch with particles greater than 106 microns. Both batches of the sample are analyzed with a fire assay and finished with AAS, ICP-OES or gravimetric depending on grade. A final weighted average is calculated.

Sample 71604 (CAS-21-05 129.5-131m) was submitted for fire assay with gravimetric analysis and returned a value of 27.9 g/t Au. Following this result, two duplicates were prepared at the lab from the initial drill core sample and submitted for metallic screening procedure at 106 um mesh followed by fire assay with gravimetric analysis, and a separate fire assay with gravimetric analysis to confirm the initial result. Metallic screen returned a value of 31.43 g/t Au, with the secondary fire assay and gravimetric analysis returning a value of 30.51 g/t Au for an overall average of 29.94 g/t Au

Qualified Person & Data Verification

Jim Hutter, P.Geo., a qualified person as defined by NI- 43-101, has supervised the preparation of and reviewed and approved of the disclosure of information in this news release. Mr. Hutter has verified the data, including drilling, sampling, test and recovery data, by supervising all of such procedures. There are no known factors that could materially affect the reliability of data collected and verified under his supervision. No quality assurance/quality control issues have been identified to date.

About Garibaldi

Garibaldi Resources Corp. is an active Canadian-based junior exploration company focused on creating shareholder value through discoveries and strategic development of its assets in some of the most prolific mining regions in British Columbia and Mexico.

We seek safe harbor.

GARIBALDI RESOURCES CORP.

Per: “Steve Regoci”
Steve Regoci, President

Neither the TSX Venture Exchange nor its
Regulation Services Provider accepts responsibility for the adequacy or the
accuracy of this release

Protecting Portfolios from Losses While Capturing Gains


Image Credit: Pixabay (Pexels)


Better Your Risk Management Investing Strategy with Protective Puts

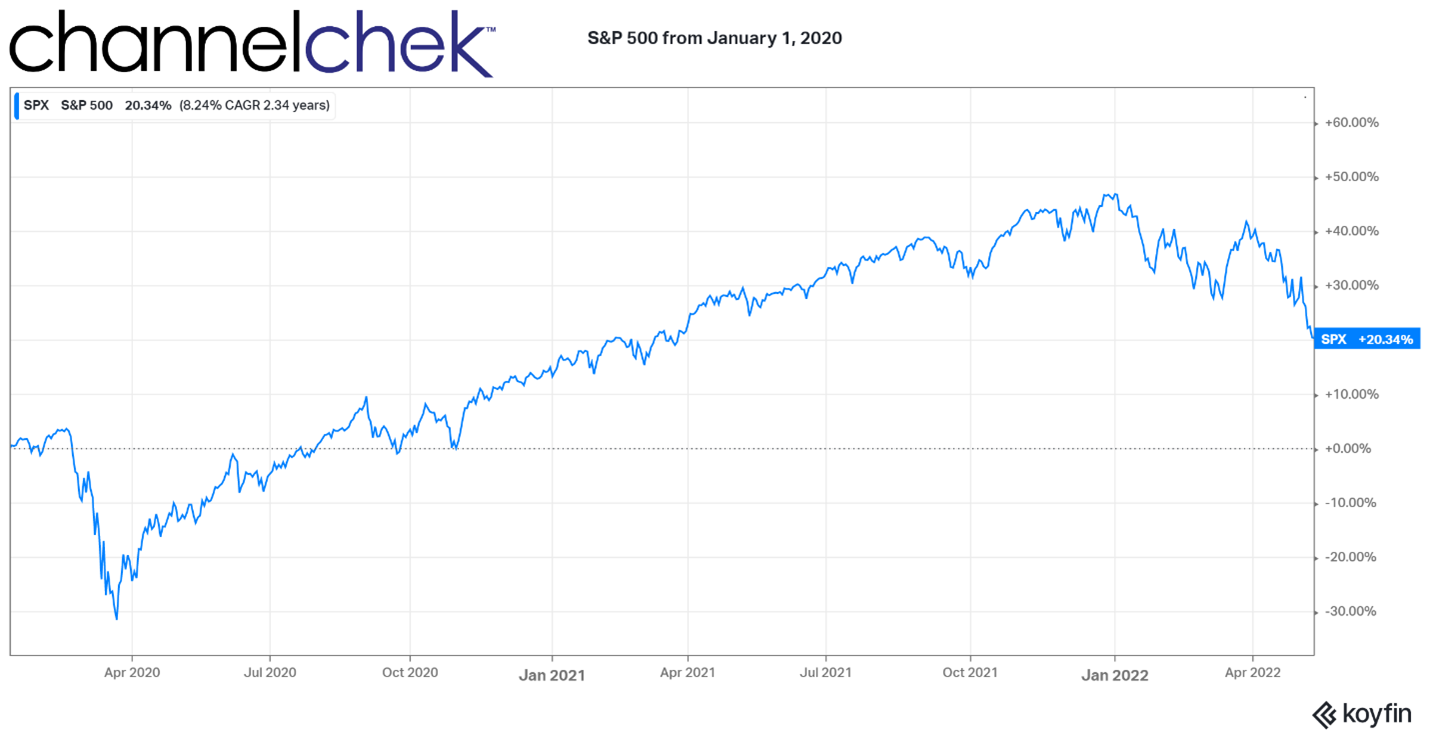
The year 2020 and 2021, despite the coronavirus-related selloff, left most stock market investors with outsized gains. From January 1, 2020, through today (May 13), the S&P is up 20%. So while this year’s moves may be negative, many investors still have gains to either realize or protect. Realizing gains is easy; you pick your spot and sell out of your position. But what may not be easy is the taxes that may accompany those gains or parting with a position that you believe over the long term will excel. If you are confident the best place for your assets is your current position, protecting it with an options strategy may be the best way to protect against your downside, and only curtail your upside potential by the price of the protective options used as insurance.

Hedging Against Downward Moves

If you have unrealized capital gains, you are probably glad but may be an anxious trader or investor. Volatility, as measured by the VIX is at a level that is considered negative for stocks. Yet, if you believe stocks you own still have upside once we get through this period where covid, crypto, low unemployment, higher interest rates, and war can cause the prices on your holdings to swing in an unpredictable fashion, an options strategy may make sense for you.  

One method experienced investors employ is the protective put.


Image: Koyfin

What is a Protective Put?

There are two main types of options: put and call options. The buyer of a call has the right to buy a stock at a set price until the options contract expires. The buyer of a put has the right to sell a stock at a set price until the contract expires.

If you own a stock, a protective put position is created by purchasing put options on the name or something highly correlated to the stock. And, at a quantity that will roughly trade one to one with your position. The put allows the owner to sell the underlying stock at the price predefined in the options contract. This is the mirror trade to a covered call which involves selling the right to buy a stock owned. Investors that are more comfortable with covered call options can think of purchasing a put to protect a long stock position, much like a synthetic long call.

The benefit of a protective put strategy is it helps protect against losses during a price decline in the assets name, while still benefitting from capital appreciation if the stock increases in value. Of course, there is a cost to any insurance against big losses: in the case of a protective put, it is the price of the option. Essentially, if the stock goes up, you have unlimited profit potential (less the cost of the put options), and if the stock goes down, the put goes up in value to offset losses on the stock.

Removing the Mystery

Assume you own 100 shares of ABC Company at $50 per share from April 2020. The cost of this trade was $5,000.

The stock is now trading at $65 per share, and you think it might go to $70 or more. However, you are concerned about stablecoin problems and the Fed putting the kibosh on growth.

A protective put reduces risk if you maintain your position in the stock so you benefit if it reaches your $70 price target. At the same time, the put offers protection in case the market weakens or there is an unforeseen event with the company you own.

Example

Let’s say the stock is trading at $65, and suppose you’re tired of seeing your gains erode so you decide to purchase the 62 ABC Company October put option contract (the underlying asset is ABC Company stock, the exercise price is $62, and the expiration month is November) at $3 per contract (option price) for a total cost of $300 ($3 per contract multiplied by 100 contract shares).

If ABC continues to go up in value, your underlying stock position increases as normal and the put option falls “out of the money” (it can’t be exercised). For instance, if, at the expiration of the put contract, the stock reaches your $70 price target, you might then choose to sell the stock for a pretax profit of $1,700 ($2,000 profit on the underlying stock less the $300 cost of the option) and the option would expire worthless. It the stock went to $74, your overall net would be $2100. And you could realize it without having concerns about a sinking price.

But what if the price did get beaten up? If your fears about the market were realized and the stock was negatively impacted, your capital gains would be protected against a decline by the put.

Here’s how:

Assume ABC Corp. common shares declined from $65 to $55 prior to the option’s expiration. Without owning the put, if you sold the stock at $55, your pretax profit would be just $500 ($5,500 less $5,000). If you purchased the 62 ABC October put, and then sold the stock by exercising the option, your pretax profit would be $900. You could then sell the stock at the (put) exercise price of $62. As a result the profit from the put position would be $900. To calculate, use the $500 profit on the underlying stock, plus the $700 from the in-the-money put profit, less the $300 cost of that option. Compare this with a profit of $500 without the option contract.

The cost of the option doesn’t take much away from upside potential, by it protects against downside losses. If you think your stock price will not move in either direction, a put option may not benefit your strategy.


Circumstances to Consider Put Protection

Protective puts can be a useful strategy for traders and investors that expect a short- or intermediate-term decline in the price of a stock they own and have reasons not to sell. The reasons could be tax related, you may be somehow restricted from selling the shares, fierce volatility in the share price, it is exposure to the company you work for and selling is not yet permitted, building the position in thinly traded shares took time, etc.

Any one of these reasons might make it prudent to consider a protective put. Additionally there may be an event such as an earnings report that you expect will drive the price in ne direction or another, and you want to protect against the downside risk of that report.


Take -Away

Option protection in the form of puts comes at a cost that the investor needs to factor into their overall strategy. However, in volatile markets, knowing you’ll capture a large part of the upside if your stock moves up, and are protected from profit erosion if the stock declines allow for more overall comfort with the limited risk in the position.

Paul Hoffman

Managing Editor, Channelchek

Suggested Content


SPAC Investors Benefit from the Ability to Exercise Different Options


Finding Tomorrow’s Best Stocks Beneath a Cloak of Invisibility


Can You Gauge the Onset of Market Capitulation?


Managing Investment Portfolio Risk

Sources

https://www.nerdwallet.com/article/investing/put-options

Stay up to date. Follow us:


Glucose Fuel Cells Powering Medical Implant Technology


Image Credit: Kent Dayton (MIT News Office)


Ultrathin Fuel Cell Uses the Body’s Own Sugar to Generate Electricity

Jennifer Chu | MIT News
Office

Glucose is the sugar we absorb from the foods we eat. It is the fuel that powers every cell in our bodies. Could glucose also power tomorrow’s medical implants?

Engineers at MIT and the Technical University of Munich think so. They have designed a new kind of glucose fuel cell that converts glucose directly into electricity. The device is smaller than other proposed glucose fuel cells, measuring just 400 nanometers thick, or about 1/100 the diameter of a human hair. The sugary power source generates about 43 microwatts per square centimeter of electricity, achieving the highest power density of any glucose fuel cell to date under ambient conditions.

The new device is also resilient, able to withstand temperatures up to 600 degrees Celsius. If incorporated into a medical implant, the fuel cell could remain stable through the high-temperature sterilization process required for all implantable devices.

The heart of the new device is made from ceramic, a material that retains its electrochemical properties even at high temperatures and miniature scales. The researchers envision the new design could be made into ultrathin films or coatings and wrapped around implants to passively power electronics, using the body’s abundant glucose supply.

“Glucose is everywhere in the body, and the idea is to harvest this readily available energy and use it to power implantable devices,” says Philipp Simons, who developed the design as part of his PhD thesis in MIT’s Department of Materials Science and Engineering (DMSE). “In our work we show a new glucose fuel cell electrochemistry.”

“Instead of using a battery, which can take up 90 percent of an implant’s volume, you could make a device with a thin film, and you’d have a power source with no volumetric footprint,” says Jennifer L.M. Rupp, Simons’ thesis supervisor and a DMSE visiting professor, who is also an associate professor of solid-state electrolyte chemistry at Technical University Munich in Germany.


A “Hard” Separation

The inspiration for the new fuel cell came in 2016, when Rupp, who specializes in ceramics and electrochemical devices, went to take a routine glucose test toward the end of her pregnancy.

“In the doctor’s office, I was a very bored electrochemist, thinking what you could do with sugar and electrochemistry,” Rupp recalls. “Then I realized, it would be good to have a glucose-powered solid state device. And Philipp and I met over coffee and wrote out on a napkin the first drawings.”

The team is not the first to conceive of a glucose fuel cell, which was initially introduced in the 1960s and showed potential for converting glucose’s chemical energy into electrical energy. But glucose fuel cells at the time were based on soft polymers and were quickly eclipsed by lithium-iodide batteries, which would become the standard power source for medical implants, most notably the cardiac pacemaker.

However, batteries have a limit to how small they can be made, as their design requires the physical capacity to store energy.

“Fuel cells directly convert energy rather than storing it in a device, so you don’t need all that volume that’s required to store energy in a battery,” Rupp says.

In recent years, scientists have taken another look at glucose fuel cells as potentially smaller power sources, fueled directly by the body’s abundant glucose.


A glucose fuel cell’s basic design consists of three layers: a top anode, a middle electrolyte, and a bottom cathode. The anode reacts with glucose in bodily fluids, transforming the sugar into gluconic acid. This electrochemical conversion releases a pair of protons and a pair of electrons. The middle electrolyte acts to separate the protons from the electrons, conducting the protons through the fuel cell, where they combine with air to form molecules of water — a harmless byproduct that flows away with the body’s fluid. Meanwhile, the isolated electrons flow to an external circuit, where they can be used to power an electronic device.

The team looked to improve on existing materials and designs by modifying the electrolyte layer, which is often made from polymers. But polymer properties, along with their ability to conduct protons, easily degrade at high temperatures, are difficult to retain when scaled down to the dimension of nanometers, and are hard to sterilize. The researchers wondered if a ceramic — a heat-resistant material which can naturally conduct protons — could be made into an electrolyte for glucose fuel cells.

“When you think of ceramics for such a glucose fuel cell, they have the advantage of long-term stability, small scalability, and silicon chip integration,” Rupp notes. “They’re hard and robust.”

Peak Power

The researchers designed a glucose fuel cell with an electrolyte made from ceria, a ceramic material that possesses high ion conductivity, is mechanically robust, and as such, is widely used as an electrolyte in hydrogen fuel cells. It has also been shown to be biocompatible.

“Ceria is actively studied in the cancer research community,” Simons notes. “It’s also similar to zirconia, which is used in tooth implants, and is biocompatible and safe.”

The team sandwiched the electrolyte with an anode and cathode made of platinum, a stable material that readily reacts with glucose. They fabricated 150 individual glucose fuel cells on a chip, each about 400 nanometers thin, and about 300 micrometers wide (about the width of 30 human hairs). They patterned the cells onto silicon wafers, showing that the devices can be paired with a common semiconductor material. They then measured the current produced by each cell as they flowed a solution of glucose over each wafer in a custom-fabricated test station.


They found many cells produced a peak voltage of about 80 millivolts. Given the tiny size of each cell, this output is the highest power density of any existing glucose fuel cell design.

“Excitingly, we are able to draw power and current that’s sufficient to power implantable devices,” Simons says.

“It is the first time that proton conduction in electroceramic materials can be used for glucose-to-power conversion, defining a new type of electrochemstry,” Rupp says. “It extends the material use-cases from hydrogen fuel cells to new, exciting glucose-conversion modes.”

The researchers “have opened a new route to miniature power sources for implanted sensors and maybe other functions,” says Truls Norby, a professor of chemistry at the University of Oslo in Norway, who did not contribute to the work. “The ceramics used are nontoxic, cheap, and not least inert both to the conditions in the body and to conditions of sterilization prior to implantation. The concept and demonstration so far are promising indeed.”


Reprinted with permission of MIT News (http://news.mit.edu/)


Suggested Reading


Baudax Bio (BXRX) NobleCon18 Presentation Replay


BioSig Technologies (BSGM) NobleCon18 Presentation Replay


Cocrystal Pharma (COCP) NobleCon18 Presentation Replay


Genprex (GNPX) NobleCon18 Presentation Replay


Stay up to date. Follow us:


Another Clue Consumer Inflation Will Remain Hot


Image Credit: Shvets Anna (Pexels)


Wholesale Prices are Still Hot and Passing the Cost Increases on to Final Goods

Last Thursday, while the markets were transfixed on watching a so-called stablecoin on its rapid path down to almost $0.00, the Bureau of Labor Statistics (BLS) released the Producer Price Index Report (PPI). If not for the cryptocurrency distraction, the BLS report may have been the most market impactful data made available so far this May. PPI measures the inputs to manufacturing and services and calculates the average change over time of these production costs. It’s often an indicator of where consumer prices are headed.

For April 2022, year-over-year growth in the producer price inflation data came in at 11%. It has been over 10 percent for five consecutive months. PPI experienced a small drop from March’s year-over-year rate of 11.5 percent but continues to scream that costs are rising at a double-digit pace, at least for those manufacturing goods. The monthly figure was a deceleration from March, but the increase is on a growing base.

Year-over-year changes in the PPI have been over 7 percent for 11 months.

Producer Price Index (PPI)

As with the Consumer Price Index (CPI), the expectations just a few months ago were overly optimistic. Analysts forecast that PPI would moderate significantly in April and signal a downward turn. Instead, the April number disappointed those that were looking for signs of a more transitory rise in prices that then quickly moderate.

The report included some signs that price increases have reduced acceleration, but from a surprisingly high level. Despite the tapered increase, prices are still rising at a historically quick pace. Wholesale food costs rose 1.5% during April from March, this one-month increase is extreme. Even more extreme are shipping and warehousing price increases for the month of 3.6%.

What it Could Mean

There are still no indications that inflationary pressures have reached a peak and will move more toward the Fed’s target of 2% to 3%. And from a policy standpoint, there are concerns that neither the Federal Reserve (US Central Bank), Congress, nor the White House have decided to show plans that decisively wage a battle against the purchasing power erosion of US dollars. So the trend may endure for an extended period.

The Federal Reserve which embraced the stimulative position back in 2008 of adding significant liquidity to the US economy and then expanded its efforts during the government’s reaction to the pandemic starting in 2020 has been a significant catalyst to rising prices. Some analysts fear that its tepid steps do little to extinguish the raging price increases.

After nearly a year of historically relevant elevated inflation rates, the Fed has more or less assured us it will decrease its balance sheet. This would take money out of the system of at least $47.5 billion each month. As compared to the size of the overall economy, these Fed held maturities of US Treasuries and Mortgaged Backed Securities reduce money in the system by a like amount and require non-Fed investors to participate in the rolling of this debt. With consumer inflation running above 8% and 10-year US Treasuries only at 3%, history suggests either interest rates will gravitate upward to compensate investors, or inflation needs to come down. The PPI number on Thursday made it clear that the pipeline of costs that lead to consumer prices has not pulled back by much.

Take-Away

The Fed has raised interest rates twice this year. Word is they will continue to move 50 bp for at least one, probably the next two meetings. In the meantime, the pipeline of rising price inputs to consumer goods hasn’t backed off much. Equity investors view stocks as a natural hedge against inflation. What they do however need to watch is the notion that higher interest rates could cause some money that never wanted to take on risk, may leave the stock market. Fewer investors lead to lower prices.

Paul Hoffman

Managing Editor, Channelchek

Suggested Content


Inflation and the Reflation Trade


The Last Time Inflation Was This High Fed Funds Were 14.5%


Deflation Not Inflation is Risk Says Cathie Wood


The Limits of Government Economic Tinkering (July 2020)

Stay up to date. Follow us:


Avivagen Inc. (VIVXF) – The China Road Is Now Open

Friday, May 13, 2022

Avivagen Inc. (VIVXF)
The China Road Is Now Open

Avivagen is a life sciences corporation focused on developing and commercializing products for livestock, companion animal and human applications that, by safely supporting immune function, promote general health and performance. It is a public corporation traded on the TSX Venture Exchange under the symbol VIV and is headquartered in Ottawa, Canada, based in partnership facilities of the National Research Council of Canada. For more information, visit www.avivagen.com. The contents of the website are expressly not incorporated by reference in this press release.

Joe Gomes, Senior Research Analyst, Noble Capital Markets, Inc.

Joshua Zoepfel, Research Associate, Noble Capital Markets, Inc.

Refer to the full report for the price target, fundamental analysis, and rating.

China Approval. Avivagen’s oxidized carotenoid-based feed additive, OxC-beta, has received approval for use in China. This is a significant accomplishment for Avivagen and should have a positive impact on operating results going forward. China marks the second key market, along with Vietnam, in which OxC-beta has received approval this year. With China and Vietnam approvals and the land-mark eight-year deal with AB Vista for exclusive distribution of OxC-beta for use with poultry, swine, ruminants (dairy and beef), and aquaculture in the U.S., Brazil, and Thailand, we believe Avivagen is on the cusp of significant revenue growth.

Number 1. China is the world’s largest feed market. According to Alltech Agri-Food Outlook, the country will produce over 261 million metric tons of feed in 2022. In addition, the country also experienced the largest increase in feed production by tonnage during 2021, as the country’s feed industry continues to consolidate and modernize. China has been a leader in efforts to reduce antibiotic use with livestock nationwide, in an effort to reduce antimicrobial-resistance in the region, which plays directly into OxC-beta’s strengths….

This Company Sponsored Research is provided by Noble Capital Markets, Inc., a FINRA and S.E.C. registered broker-dealer (B/D).

*Analyst certification and important disclosures included in the full report. NOTE: investment decisions should not be based upon the content of this research summary. Proper due diligence is required before making any investment decision.