Release – Onconova Therapeutics Reports First Quarter 2022 Financial Results And Provides Business Update


Onconova Therapeutics Reports First Quarter 2022 Financial Results And Provides Business Update

News and Market Data on Onconova Therapeutics


Conference call and live webcast at 4:30 p.m. ET today

NEWTOWN, Pa., May 11, 2022 (GLOBE NEWSWIRE) — Onconova Therapeutics, Inc. (NASDAQ: ONTX), (“Onconova”), a clinical-stage biopharmaceutical company focused on discovering and developing novel products for patients with cancer, today announced financial results for the three months ended March 31, 2022, and provided a business update.

Highlights for the first quarter of 2022 and recent weeks include:

  • The ongoing Phase 1 solid tumor trials of narazaciclib in the United States and China continue to generate encouraging safety data with the maximum tolerated dose not yet reached in either trial. The trial in the United States is currently enrolling into its fourth dose cohort, which is evaluating a 160 mg dose administered orally each day (i.e. continuous daily dosing). The trial in China is enrolling into its fifth dose cohort, which is evaluating a 200 mg dose administered orally once a day on days 1-21 of 28-day cycles. A protocol amendment is being prepared to enable further dose escalation in the trial in China.
  • An abstract titled “Narazaciclib’s kinase inhibitory activity is differentiated from approved CDK4/6 inhibitors in preclinical models,” has been accepted for publication at the upcoming American Society of Clinical Oncology (ASCO) Annual Meeting.
  • Rigosertib’s investigator-sponsored program has seen progress across multiple ongoing and planned trials. The expansion cohort of the Phase 1/2a study of oral rigosertib plus nivolumab in patients with KRAS+ non-small cell lung cancer (NSCLC) continues to enroll patients, as does the Phase 2 trial of rigosertib monotherapy in advanced squamous cell carcinoma associated with recessive dystrophic epidermolysis bullosa (RDEB-associated SCC). A planned Phase 2 trial of rigosertib plus pembrolizumab in patients with metastatic melanoma was recently cleared to proceed by the United States Food and Drug Administration (FDA) following a review of its protocol.

Management
Commentary

“We are pleased to be advancing two highly differentiated therapeutic candidates towards near-term milestones with cash runway expected to extend for at least eighteen months,” said Steven M. Fruchtman, M.D., President and Chief Executive Officer of Onconova. “We remain on track to identify narazaciclib’s recommended Phase 2 dose later this year, which will enable us to move forward into later-stage studies designed to evaluate its safety and efficacy in monotherapy and combination settings. As we finalize the specifics of these upcoming trials, we will continue to be informed by the results of our ongoing Phase 1 program and preclinical studies. The results of these studies to-date set narazaciclib apart from currently approved CDK4/6 inhibitors, and we look forward to building on these data in future trials.”

Dr. Fruchtman continued, “Rigosertib’s investigator sponsored study program is also moving towards key catalysts. Later this quarter, our collaborators expect to initiate a Phase 2 study evaluating rigosertib plus anti-PD-1 therapy in metastatic melanoma patients refractory to checkpoint blockade. This trial is supported both by preclinical data that demonstrate rigosertib’s immunotherapeutic effects, and prior clinical results from the ongoing investigator sponsored study of the rigosertib-anti-PD-1 combination therapy in KRAS-mutated NSCLC. These initial results showed the studied doublet generating responses in refractory patients who previously failed therapy with a checkpoint inhibitor, a finding we hope to replicate in melanoma. We have continued to amass data in NSCLC since this initial readout, and look forward to providing updated results from the ongoing Phase 1/2a trial by the end of the year. The advancement of this and rigosertib’s other investigator-sponsored studies is expected to serve as a valuable complement to our narazaciclib program, which remains our core focus.”

First
Quarter Financial Results

Cash and cash equivalents as of March 31, 2022, were $50.8 million, compared with $55.1 million as of December 31, 2021. The Company believes that its cash and cash equivalents will be sufficient to fund ongoing clinical trials and business operations for at least eighteen months.

Research and development expenses were $2.0 million for the first quarter of 2022, compared with $1.9 million for the first quarter of 2021.

General and administrative expenses were $2.2 million for the first quarter of 2022, compared with $2.2 million for the first quarter of 2021.

Net loss for the first quarter of 2022 was $4.1 million, or $0.20 per share on 20.9 million weighted average shares outstanding, compared with a net loss of $4.7 million, or $0.32 per share for the first quarter of 2021 on 14.6 million weighted average shares outstanding.

Conference
Call and Webcast

Onconova will host an investment community conference call today beginning at 4:30 p.m. Eastern Time, during which management will discuss financial results for the first quarter of 2022, provide a business update, and answer questions. Interested parties can participate by dialing (855) 428-5741 (domestic callers) or (210) 229-8823 (international callers) and using conference ID 7369861.

A live webcast of the conference call will be available in the Investors & Media section of the Company’s website at www.onconova.com. A replay of the webcast will be available on the Onconova website for 90 days following the call.

About
Onconova Therapeutics, Inc.

Onconova Therapeutics is a clinical-stage biopharmaceutical company focused on discovering and developing novel products for patients with cancer. The Company has proprietary targeted anti-cancer agents designed to disrupt specific cellular pathways that are important for cancer cell proliferation.

Onconova’s novel, proprietary multi-kinase inhibitor narazaciclib (formerly ON 123300) is being evaluated in two separate and complementary Phase 1 dose-escalation and expansion studies. These trials are currently underway in the United States and China.

Onconova’s product candidate rigosertib is being studied in an investigator-sponsored study program, including in a dose-escalation and expansion Phase 1/2a investigator-sponsored study with oral rigosertib in combination with nivolumab for patients with KRAS+ non-small cell lung cancer.

For more information, please visit www.onconova.com.

Forward-Looking
Statements

Some of the statements in this release are forward-looking statements within the meaning of Section 27A of the Securities Act of 1933, as amended, Section 21E of the Securities Exchange Act of 1934, as amended, and the Private Securities Litigation Reform Act of 1995, and involve risks and uncertainties. These statements relate to Onconova’s expectations regarding the timing of Onconova’s and investigator-initiated clinical development and data presentation plans, and the mechanisms and indications for Onconova’s product candidates. Onconova has attempted to identify forward-looking statements by terminology including “believes,” “estimates,” “anticipates,” “expects,” “plans,” “intends,” “may,” “could,” “might,” “will,” “should,” “preliminary,” “encouraging,” “approximately” or other words that convey uncertainty of future events or outcomes. Although Onconova believes that the expectations reflected in such forward-looking statements are reasonable as of the date made, expectations may prove to have been materially different from the results expressed or implied by such forward-looking statements. These statements are only predictions and involve known and unknown risks, uncertainties, and other factors, including the success and timing of Onconova’s clinical trials, investigator-initiated trials and regulatory agency and institutional review board approvals of protocols, Onconova’s collaborations, market conditions and those discussed under the heading “Risk Factors” in Onconova’s most recent Annual Report on Form 10-K and quarterly reports on Form 10-Q. Any forward-looking statements contained in this release speak only as of its date. Onconova undertakes no obligation to update any forward-looking statements contained in this release to reflect events or circumstances occurring after its date or to reflect the occurrence of unanticipated events.

Company
Contact:

Avi Oler
Onconova Therapeutics, Inc.
267-759-3680

ir@onconova.us
https://www.onconova.com/contact/

Investor Contact:
Bruce Mackle
LifeSci Advisors, LLC
646-889-1200


bmackle@lifesciadvisors.com


Useful Information on Where CPI Numbers Come From


Image Credit: Brett Jordan (Flickr)


How the Bureau of Labor Statistics Confirms Your Sticker Shock by Measuring CPI

As purchases of pretty much everything cost more than they did a year ago, a correct accounting of average cost per household has recently taken the spotlight. The methods the federal government uses to track changes in prices each month on a hundred thousand goods and services were given little thought during non-inflationary periods. But now, as more consumers are asking whether the 8.3% inflation rate corresponds with their anecdotal 23% increase in groceries or the change in prices they’re experiencing with cars, understanding where the government gets the statistics from is useful information.

Bureau of Labor Statistics

Quantifying the magnitude and pace of inflation is among the Bureau of Labor Statistics (BLS) official jobs.

There are 477 workers that work for the BLS that track price changes. Many of these are “on-the-ground” economists whose job it is to confirm that you just paid $1.37 for a can of tuna and that it isn’t a fluke. Their work literally moves markets, including all those tied to interest rates, the stock market, COLA raises for Social Security recipients, and other prices tied to one of the CPI indices.

After a two-year pandemic-related shift away from in-person confirmation, many price checkers have returned and are back out in stores and visiting service businesses in person to collect data. This could include visiting a reception hall, checking prices on a manicure, asking accountants what they charge for a basic tax return, oil change, etc.

Under the Spotlight

For decades there was little attention paid to inflation. For most of the years, the risk of deflation was the most spoken about concern. Retirees would complain that their COLA was more than eaten up by rising Medicaid deductions, and many of us were amazed each time we decided to buy electronics like a new TV. Not only did it cost less than the last one we purchased, but it had better features.

A recent story in the Wall Street Journal about one of these BLS price-checking economists explains she spends more time than ever at each location. Not because she has more business there, but because business owners want to complain to her about rising prices. The story in the Journal says this checker has six children and lately she’s been called upon by her husband and friends to suggest ways to avoid higher bills. This advice she can share. What she cannot help with is sharing any information she has that is confidential, as it could be market moving and considered insider information.

The job of a price-checker has been described as a treasure hunt. As you might imagine, they have very strict price collection rules. Shop owners are not at all counted on to know any of the rules because there is no financial incentive or accountability for them to care enough to treat the task with the importance required.

The job is exacting. To price an item, BLS workers go through up to an 11-page list of data points to make sure they are pricing the same item as they did the prior month. As an example of how exacting, a can of soup will have 12 different specifications, including flavor, size, brand, organic labeling, material of the packaging and dietary features, such as sodium content.

Challenge of Monthly Measurement

The BLS tracks prices on their list of goods and services, along with 8,000 housing units each month. The bureau determines which items to include using census-collected data on buying habits. This makes sure the measurements reflect the way Americans spend their money and captures new buying habits as they emerge using a four-year cycle.

Business participation in the monthly CPI price gathering is voluntary. Businesses can’t be required to participate.  

One challenge they have recently run into is supply-chain shortages. It has made it more difficult to check prices from month to month over the pandemic since goods are often out of stock.

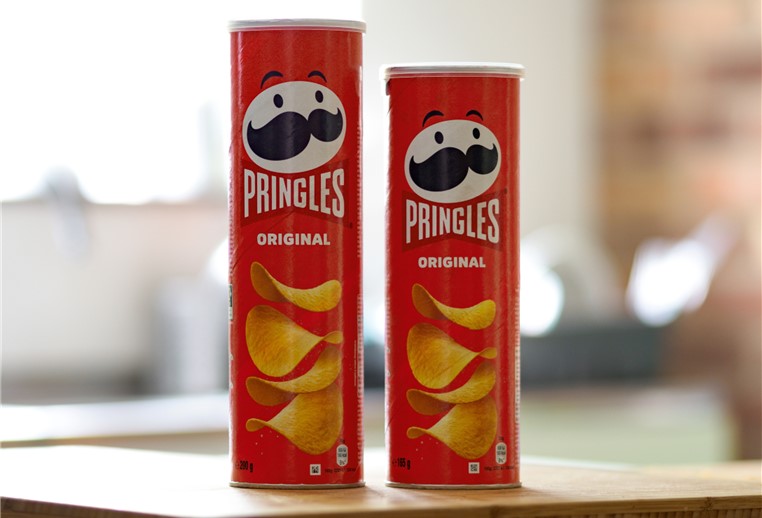
And what about shrinkflation? The price checkers are challenged with watching for quantity changes. If a container of ice cream or can of Pringles has an unchanged price, but the package has shrunk, the price checker has to account for it as a price increase.

Paul Hoffman

Managing Editor, Channelchek

Suggested Content


History of Hawkish Fed Policy and Soft Landings


Asset Classes that Perform Best and Worst with Negative Real Interest Rates


The Detrimental Impact of Fed Policy on Savers


Inflation is No Baloney

Sources

https://newscorp.com/business/dow-jones/

https://www.dowjones.com/

https://www.marketwatch.com/

https://www.wsj.com/articles/inflation-bls-price-checkers-who-determine-cpi-11652132333?mod=hp_lead_pos8

https://bigcharts.marketwatch.com/

Stay up to date. Follow us:


Finding Tomorrow’s Best Stocks Beneath a Cloak of Invisibility


Image Credit: Mob Mob (Flickr)


Reinventing Your Trading as the Market Transforms Yet Again

Momentum traders were big gainers from the Summer of 2020 until January of 2022. Only a year ago, jumping onboard the Globalstar (GSAT), Gamestop (GME), or other meme stock freight train helped turn many accounts extremely green. That trade seems to be over for now, and traders and investors may now have to pivot. Just as they pivoted after the March 2020 selloff to find opportunity investing in FAANG stocks or following r/wallstreetbets conversations – the recent economic upheaval suggests another pivot may be required for investors to survive and thrive.

About the Market Selloff

While the activities of many retail investors quickly become running for cover when the market sells off, time should be dedicated to calmly looking at the big picture while remembering which products and services will have global appeal when the downward trend ends.

Lining up opportunities uncovered in the current carnage will prepare you to jump when the time is right.

This isn’t simple, it involves experiencing the anxiety of red days and recognizing the potential for future green. Some of the red stocks have become “on-sale” and should be further analyzed; others are approaching where they should have been valued all along. Work to determine which is which.

The markets have changed for now, going forward they will require the work they always used to require, and the rewards may not come as quickly or easily. But interesting companies still exist.

What I  Mean by “Interesting”

One company that seems to have its hand in everything that will be hot tomorrow, or maybe the day after, is Meta Materials (Nasdaq: MMAT). I’ll use it as an example as their earnings came out yesterday (May 10), and first quarter revenue was up 299%. This year the stock price has tumbled. Like most young tech companies, MMAT still operates at a loss; this example is not a recommendation one way or another.

Meta Materials was a company that flew under my radar until I learned about them at NobleCon18. They are involved in products that will help the builders of everything that we expect to see more of in the future. This includes:

  • Making 5G work substantially better
  • Resolving weather-related issues with automotive sensors
  • Medical imaging and sensing enhancement
  • Eliminating the need for expensive rare earth materials in touch screens
  • And a lot more

Ken Rice, the COO and CFO of Meta Materials, said at NobleCon, “we didn’t leave the Stone Age because we ran out of rocks, we left the Stone Age because somebody invented bronze and figured out it was better…” The company is providing better materials to growing industries and is doing it with greater speed, lower cost, and improved scale. 

They have over 269 active or pending patents from which to benefit; it is not a patent portfolio held to trade, this was made clear when during the NobleCon presentation, the COO said they exist to “keep everybody out of our sandbox.”

Meta materials is an interesting company with the promise of trumping yesterday’s amazing high-tech building materials with better ones. Watch the NobleCon18 video to understand how Meta Materials can essentially produce the “cloak of invisibility.”

What to Look For

History has shown us a few things about the stock market. First, it has always come back and hit new highs. Second, it confounds those that require certainty, investors are better served by placing probabilities in their corner, and third, there is always a rotation, while money is leaving one industry or sector, it is moving to another.

Technology has been a sector where a product or invention that was incredible when released, becomes replaced by something even better in a dozen years or so years. Pay no more attention to old technology then new. Look at what tomorrow is likely to demand to be better, this is one smart place theme to start a search.

Take-Away

Markets go up and markets go down. If it were predictable, it would already be where it’s going. What is highly probable is tomorrow’s technologies are going to be replacements for today’s. And, tomorrow is coming, there’s nothing we can do about it.

For investors and traders that are seeing more red in their portfolio than they have since March 2020, look with a level head at the possibilities still around, read up on some of the 6000+ small companies available on Channelchek, subscribe to Channelchek’s YouTube channel and don’t rush into anything until you’ve got a handle on your odds of success.

Paul Hoffman

Managing Editor, Channelchek

Suggested Content


Where are Consumers Most Likely to Spend Their Leisure Budget?


Winners and Losers in a Market Capitulation


History of Hawkish Fed Policy and Soft Landings


Meta Materials (MMAT) NobleCon18 Presentation Replay

Sources

https://feeds.issuerdirect.com/news-release.html?newsid=8330648170070524

https://channelchek.com/news-channel/Meta_Materials__MMAT__NobleCon18_Presentation_Replay

Stay up to date. Follow us:


Release – InPlay Oil Corp. Announces First Quarter 2022 Financial and Operating Results Highlighted by Record Quarterly Production and Financial Results


InPlay Oil Corp. Announces First Quarter 2022 Financial and Operating Results Highlighted by Record Quarterly Production and Financial Results

News and Market Data on InPlay Oil Corp

CALGARY, Alberta, May 11, 2022 — InPlay Oil Corp. (TSX: IPO) (OTCQX: IPOOF) (“InPlay” or the “Company”) announces its record setting financial and operating results for the three months ended March 31, 2022, our first full quarter incorporating the acquisition of Prairie Storm Resources Corp. (“Prairie Storm”). InPlay’s condensed unaudited interim financial statements and notes, as well as Management’s Discussion and Analysis (“MD&A”) for the three months ended March 31, 2022 will be available at “www.sedar.com” and our website at “www.inplayoil.com”. Our corporate presentation will soon be available on our website.

First Quarter 2022 Financial &
Operating Highlights

  • Achieved record average quarterly production of 8,221 boe/d(1) (59% light crude oil and NGLs), an increase of 66% from first quarter production in 2021 of 4,965 boe/d
    (1) (70% light crude oil and NGLs) and an increase of 23% compared to our previous quarterly record of 6,687 boe/d(1) (61% light crude oil and NGLs) in the fourth quarter of 2021. Average production per weighted average basic share increased 31% compared to the first quarter of 2021 (34% on a debt adjusted(4) basis) and 3% compared to the fourth quarter of 2021 (9% on a debt adjusted basis).
  • Generated record quarterly adjusted funds flow (“AFF”)(2) of $29.4 million ($0.34 per weighted average basic share(3)), an increase of 381% compared to $6.1 million ($0.09 per weighted average basic share) in the first quarter of 2021 and an increase of 71% compared to $17.1 million ($0.23 per weighted average basic share) in the fourth quarter of 2021, our prior record quarter.
  • Increased operating netbacks
    (4) by 73% to $46.06/boe from $26.66/boe in the first quarter of 2021 and 17% compared to $39.43/boe in the fourth quarter of 2021, our prior record quarter.
  • Realized quarterly record operating income(4) and operating income profit margin(4) of $34.1 million and 65% respectively compared to $11.9 million and 60% in the first quarter of 2021; $24.3 million and 65% in the fourth quarter of 2021, our prior record quarter.
  • Reduced operating expenses by 10% to $12.96/boe compared to $14.37/boe in the first quarter of 2021, despite rising costs of services in the industry.
  • Generated free adjusted funds flow (“FAFF”)(4) of $7.8 million, a quarterly record for the Company.
  • Achieved a record quarterly annualized net debt(2) to earnings before interest, taxes and depletion (“EBITDA”)(4) ratio of 0.6, compared to 2.6 in the first quarter of 2021 and 1.1 in fourth quarter of 2021.
  • Realized net income of $18.8 million ($0.22 per basic share; $0.21 per diluted share) compared to a net loss of $7.5 million ($0.11 per basic and diluted share) in the first quarter of 2021.

Notes:

1.

See
“Reader Advisories – Production Breakdown by Product Type”

2.

Capital
management measure. See “Non-GAAP and Other Financial Measures” contained
within this press release.

3.

Supplementary
financial measure. See “Non-GAAP and Other Financial Measures” contained
within this press release.

4.

Non-GAAP
financial measure or ratio that does not have a standardized meaning under
International Financial Reporting Standards (IFRS) and GAAP and therefore may
not be comparable with the calculations of similar measures for other
companies. Please refer to “Non-GAAP and Other Financial Measures” contained
within this press release.


Financial and Operating Results:

(CDN) ($000’s)

Three months ended
March 31


2022


2021


Financial


Oil and natural gas sales

52,156


20,001


Adjusted funds flow(1)

29,379


6,105


Per share – basic (1)

0.34


0.09


Per share –diluted(1)

0.32


0.09


Per boe(1)

39.71


13.66


Comprehensive income (loss)

18,774


(7,536

)

Per share – basic

0.22


(0.11

)

Per share – diluted

0.21


(0.11

)

Capital expenditures – PP&E and E&E

21,562


12,209


Property acquisitions (dispositions)

(1

)

19


Corporate acquisitions

432


Net debt(1)

(73,392

)

(79,780

)

Shares outstanding

86,537,351


68,256,616


Basic weighted-average shares

86,449,636


68,256,616


Diluted weighted-average shares

90,964,311


68,256,616


Operational


Daily production volumes


Light and medium crude oil (bbls/d)

3,571


2,665


Natural gas liquids (bbls/d)

1,307


802


Conventional natural gas (Mcf/d)

20,054


8,994


Total (boe/d)

8,221


4,965


Realized prices(2)


Light and medium crude oil & NGLs ($/bbls)

97.50


55.75


Conventional natural gas ($/Mcf)

5.18


3.22


Total ($/boe)

70.50


44.76


Operating netbacks ($/boe)(3)


Oil and natural gas sales

70.50


44.76


Royalties

(10.27

)

(2.79

)

Transportation expense

(1.21

)

(0.94

)

Operating costs

(12.96

)

(14.37

)

Operating netback

46.06


26.66


Realized (loss) on derivative contracts

(0.81

)

(6.81

)

Operating netback (including realized derivative contracts)

45.25


19.85


(1)

Capital
management measure. See “Non-GAAP and Other Financial Measures” contained
within this press release.

(2)

Supplementary
financial measure. See “Non-GAAP and Other Financial Measures” contained
within this press release.

(3)

Non-GAAP
financial measure or ratio that does not have a standardized meaning under
International Financial Reporting Standards (IFRS) and GAAP and therefore may
not be comparable with the calculations of similar measures for other
companies. Please refer to “Non-GAAP and Other Financial Measures” contained
within this press release.


First Quarter 2022 Financial &
Operations Overview:

Production averaged 8,221 boe/d (59% light crude oil & NGLs)(1) in the first quarter of 2022 which includes the impact of a force majeure of a third party facility that affected March production by approximately 200 boe/d. Production increased by 66% compared to 4,965 boe/d (70% light crude oil & NGLs)
(1) in the first quarter of 2021 and 23% compared to 6,687 boe/d (61% light crude oil & NGLs)(1) in the fourth quarter of 2021. This resulted in a quarterly record $29.4 million of Adjusted Funds Flow (“AFF”) generated during the first quarter of 2022 and $7.8 million in Free Adjusted Funds Flow (“FAFF”) which reduced debt levels.

InPlay’s capital program for the first quarter of 2022 consisted of $21.6 million of capital expenditures. The Company drilled, completed and brought on production three (3.0 net) Extended Reach Horizontal (“ERH”) wells in Pembina, and two (1.7 net) Willesden Green wells on our newly acquired Prairie Storm assets, and participated in one (0.2 net) non-operated Willesden Green ERH well. The Company also completed the two (1.6 net) wells that were drilled in December on Prairie Storm Willesden Green assets and these wells were brought on production in the second half of January. A total of six (4.9 net) wells were drilled during the quarter, the most active quarter in the Company’s history. The first quarter capital program also included lease construction to expedite the second quarter drilling program and the construction of a small modular multi-well battery in Willesden Green to accommodate future drilling. Given the strong economics tied to the current pricing environment, InPlay also increased its well servicing expenditures in the quarter to optimize wells, activate wellbores that had been down and to reduce operating expenses on certain wells.

The average well results from the first quarter capital program are above our forecasted type curves with average payouts of wells (with over two months of production data) expected to be approximately three months in the current pricing environment. The initial production (“IP”) rates for the two (1.6 net) wells drilled in Willesden Green in December and brought on production in the second half of January, which are stabilizing ahead of forecast, were as follows:


IP 30

IP 60

IP 90


(% light crude oil and NGLs)

(% light crude oil and NGLs)

(% light crude oil and NGLs)

1.5 mile well

593 boe/d (80%)

433 boe/d (79%)

355 boe/d (78%)

1.0 mile well

203 boe/d (83%)

169 boe/d (77%)

161 boe/d (72%)

The combined IP rates for the three (3.0 net) ERH wells drilled in Pembina and brought on production ahead of schedule in late February continue to clean up as follows:

IP 30

IP 60

Current(1)

(% light crude oil and NGLs)

(% light crude oil and NGLs)

(% light crude oil and NGLs)

1,063 boe/d (73%)

1,122 boe/d (67%)

1,292 boe/d (55%)

The IP rates for the two (1.7 net) wells drilled in Willesden Green and brought on production in mid-March continue to clean up as follows:


IP 30

Current(1)


(% light crude oil and NGLs)

(% light crude oil and NGLs)

1.5 mile well

296 boe/d (88%)

415 boe/d (82%)

1.0 mile well*

126 boe/d (85%)

197 boe/d (80%)


* The 1.0 mile well had initially experienced wax and pumping issues.

(1)   Based on field
estimates.

Efficient field operations and increased production levels resulted in the Company achieving a 10% reduction to operating expenses to $12.96/boe compared to $14.37/boe in the first quarter of 2021. This was a significant achievement given the cold winter, inflationary pressures in the industry and ongoing supply chain disruptions. The resulting operating income(2) and operating income profit margin(2) for the first quarter of 2022 were quarterly records for the Company at $34.1 million and 65% respectively. Net income of $18.8 million ($0.22 per basic share; $0.21 per diluted share) was realized in the first quarter compared to a net loss of $7.5 million ($0.11 per basic and diluted share) in the first quarter of 2021.

Notes:

1.

See
“Reader Advisories – Production Breakdown by Product Type”

2.

Non-GAAP
financial measure or ratio that does not have a standardized meaning under
International Financial Reporting Standards (IFRS) and GAAP and therefore may
not be comparable with the calculations of similar measures for other
companies. Please refer to “Non-GAAP and Other Financial Measures”.


Operations Update

InPlay’s capital program for the second quarter of 2022 is ahead of schedule which will benefit the Company as production is anticipated to be brought on earlier than forecasted into a very strong price environment. Drilling operations for three (3.0 net) wells in Pembina have just finished and these wells are expected to come on production by the end of May. An additional two (1.9 net) two-mile wells are planned to be drilled in Willesden Green during the second quarter and are expected to come on production in mid-July. The Company plans to utilize the same drilling rig for the remainder of our 2022 capital program allowing for continued drilling efficiencies and cost savings associated with a consistent and experienced crew, materially reducing our inflation risk in the current environment.

Environmental, Social and Governance
(“ESG”) Update

InPlay is committed to environmental stewardship while safely and efficiently developing our assets that contribute to the local, provincial and Canadian economies. The Company will further outline our ESG initiatives with the release of our inaugural sustainability report this summer. We place a high importance on managing emissions, water conservation, spill mitigation and abandonment and reclamation activities. Our goal is to ensure all stakeholders benefit from our business operations both in the short-term and long into the future.

The Company continues to reduce our inactive well liability. During the first quarter of 2022, InPlay spent $1.4 million on the abandonment of 14 wellbores and the reclamation of 4 well sites. To further evidence our commitment to ESG initiatives, the Company has added approximately $1 million to our budget for emission related projects during 2022. Specifically, the Company will be accelerating projects to convert high-bleed pneumatic devices to low-bleed pneumatics and install vapor recovery units at certain facilities. These projects will have the benefit of materially reducing our emissions while also providing the Company with economic benefit through more efficient operations and gas conservation.

Outlook(4)

InPlay’s successful first quarter capital program has led to a strong start to the year and establishes a solid foundation to generate significant FAFF throughout the remainder of the year while providing strong returns to shareholders. InPlay’s production in April averaged approximately 9,000 boe/d(1) based on field estimates and is currently tracking at the mid-point of our average annual production guidance of 8,900 to 9,400 boe/d(1). The Company’s drilling program is ahead of schedule, and with approximately 70% of our planned 2022 wells remaining to be drilled and expected to be on production by the middle of the fourth quarter, InPlay is well positioned to deliver strong production and FAFF growth to its shareholders.

Strong commodity pricing, increased fuel prices, supply chain disruptions and increased activity levels have heightened inflationary pressures across the industry. One of the biggest issues has been the supply of steel casing and tubular products required to drill wells. InPlay has been able to mitigate these supply issues through strong industry relationships and proactive decision making. The Company proactively acquired an inventory of these products at favorable pricing in the summer and fall of 2021 to accommodate our H1 2022 drilling program. The Company has acquired all pipe products to accommodate our drilling program for the second half of the year, albeit at higher pricing levels. InPlay will also incur additional costs associated with drilling two (1.9 net) two mile wells (versus 1.5 mile wells in our original budget), and approximately $1 million for various emission reduction initiatives. In aggregate, these additional activities combined with inflationary pressures has our 2022 capital budget increased to $64 million (previously $58 million). The Company will continue to monitor industry wide cost pressures and efforts will be taken to minimize their impact on our operations.

With the further strengthening of commodity prices and our updated capital budget, InPlay now forecasts 2022 AFF(2) of $147 to $156 million (versus prior guidance of $141 to $150 million) with FAFF(3) at $83 to $92 million (in line with prior guidance), which would result in InPlay being in a positive working capital position, in excess of debt, by year end. The Company’s leverage metrics are forecasted to remain at historically low levels, with net debt to quarterly annualized earnings before interest, taxes and depletion (“EBITDA”)
(3) forecasted to be 0.3x for the second quarter of 2022.

InPlay is executing its strategy to provide disciplined, top-tier light oil weighted production and FAFF per share growth, reducing debt and leverage ratios, while seeking to capitalize on strategic and accretive acquisition opportunities with our pristine balance sheet. Execution of InPlay’s disciplined strategy is significantly ahead of schedule on debt and leverage reduction which places the Company in a solid position to sustainably generate long-term per share growth and deliver top-tier returns to shareholders in a prudent and fiscally responsible manner. Management would like to thank our employees, board members, lenders and shareholders for their support and we look forward to continuing our journey of deleveraging and maximizing shareholder returns.

For further information please contact:


Doug Bartole

Darren Dittmer

President and Chief Executive Officer

Chief Financial Officer

InPlay Oil Corp.

InPlay Oil Corp.

Telephone: (587) 955-0632

Telephone: (587) 955-0634


Notes:

1.

See
“Production Breakdown by Product Type” at the end of this press release.

2.

Capital
management measure. See “Non-GAAP and Other Financial Measures” contained
within this press release.

3.

Non-GAAP
financial measure or ratio that does not have a standardized meaning under
International Financial Reporting Standards (IFRS) and GAAP and therefore may
not be comparable with the calculations of similar measures for other
companies. Please refer to “Non-GAAP and Other Financial Measures” contained
within this press release.

4.

See
“Reader Advisories – Forward Looking Information and Statements” for key
budget and underlying assumptions related to our 2022 capital program and
associated guidance.


Reader Advisories

Non-GAAP and Other Financial Measures

Throughout this press release and other materials disclosed by the Company, InPlay uses certain measures to analyze financial performance, financial position and cash flow. These non-GAAP and other financial measures do not have any standardized meaning prescribed under GAAP and therefore may not be comparable to similar measures presented by other entities. The non-GAAP and other financial measures should not be considered alternatives to, or more meaningful than, financial measures that are determined in accordance with GAAP as indicators of the Company performance. Management believes that the presentation of these non-GAAP and other financial measures provides useful information to shareholders and investors in understanding and evaluating the Company’s ongoing operating performance, and the measures provide increased transparency and the ability to better analyze InPlay’s business performance against prior periods on a comparable basis.

Non-GAAP
Financial Measures and Ratios

Included in this document are references to the terms “free adjusted funds flow”, “operating income”, “operating netback per boe”, “operating income profit margin”, “Net Debt to EBITDA” and “Debt adjusted production per share”. Management believes these measures are helpful supplementary measures of financial and operating performance and provide users with similar, but potentially not comparable, information that is commonly used by other oil and natural gas companies. These terms do not have any standardized meaning prescribed by GAAP and should not be considered an alternative to, or more meaningful than “profit (loss) before taxes”, “profit (loss) and comprehensive income (loss)”, “adjusted funds flow”, “capital expenditures”, “corporate acquisitions, net of cash acquired”, “net debt”, “weighted average number of common shares (basic)” or assets and liabilities as determined in accordance with GAAP as a measure of the Company’s performance and financial position.

Free Adjusted Funds Flow

Management considers free adjusted funds flow and free adjusted funds flow per share important measures to identify the Company’s ability to improve its financial condition through debt repayment, which has become more important recently with the introduction of second lien lenders, on an absolute and weighted average per share basis. Free adjusted funds flow should not be considered as an alternative to or more meaningful than adjusted funds flow as determined in accordance with GAAP as an indicator of the Company’s performance. Free adjusted funds flow is calculated by the Company as adjusted funds flow less exploration and development capital expenditures and property dispositions (acquisitions) and is a measure of the cashflow remaining after capital expenditures before corporate acquisitions that can be used for additional capital activity, corporate acquisitions, repayment of debt or decommissioning expenditures. Free adjusted funds flow per share is calculated by the Company as free adjusted funds flow divided by weighted average outstanding shares. Refer below for a calculation of historical Free adjusted fund flow and to the “Forward Looking Information and Statements” section for a calculation of forecast Free adjusted funds flow.

(thousands of dollars)

Three Months Ended
March 31


2022


2021


Adjusted funds flow

29,379


6,105


Exploration and dev. capital expenditures

(21,562

)

(12,209

)

Property dispositions (acquisitions)

1


(19

)

Free adjusted funds flow

7,818


(6,123

)

Operating Income/Operating Netback per
boe/Operating Income Profit Margin

InPlay uses “operating income”, “operating netback per boe” and “operating income profit margin” as key performance indicators. Operating income is calculated by the Company as oil and natural gas sales less royalties, operating expenses and transportation expenses and is a measure of the profitability of operations before administrative, share-based compensation, financing and other non-cash items. Management considers operating income an important measure to evaluate its operational performance as it demonstrates its field level profitability. Operating income should not be considered as an alternative to or more meaningful than net income as determined in accordance with GAAP as an indicator of the Company’s performance. Operating netback per boe is calculated by the Company as operating income divided by average production for the respective period. Management considers operating netback per boe an important measure to evaluate its operational performance as it demonstrates its field level profitability per unit of production. Operating income profit margin is calculated by the Company as operating income as a percentage of oil and natural gas sales. Management considers operating income profit margin an important measure to evaluate its operational performance as it demonstrates how efficiently the Company generates field level profits from its sales revenue. Refer below for a calculation of operating income, operating netback per boe and operating income profit margin.

(thousands of dollars)

Three Months Ended
March 31


2022


2021


Revenue

52,156


20,001


Royalties

(7,599

)

(1,245

)

Operating expenses

(9,588

)

(6,422

)

Transportation expenses

(893

)

(418

)

Operating income (2)

34,076


11,916


Sales volume (Mboe)

739.9


446.9


Per boe


Revenue

70.50


44.76


Royalties

(10.27

)

(2.79

)

Operating expenses

(12.96

)

(14.37

)

Transportation expenses

(1.21

)

(0.94

)

Operating netback per boe

46.06


26.66


Operating income profit margin

65

%

60

%

Net Debt to EBITDA

Management considers Net Debt to EBITDA an important measure as it is a key metric to identify the Company’s ability to fund financing expenses, net debt reductions and other obligations. EBITDA is calculated by the Company as adjusted funds flow before interest expense. When this measure is presented quarterly, EBITDA is annualized by multiplying by four. This measure is consistent with the EBITDA formula prescribed under the Company’s Senior Credit Facility. Net Debt to EBITDA is calculated as Net Debt divided by EBITDA. Refer to the “Forward Looking Information and Statements” section for a calculation of forecast Net Debt to EBITDA.

Production per Debt Adjusted Share

InPlay uses “Production per debt adjusted share” as a key performance indicator. Debt adjusted shares should not be considered as an alternative to or more meaningful than common shares as determined in accordance with GAAP as an indicator of the Company’s performance. Debt adjusted shares is a non-GAAP measure used in the calculation of Production per debt adjusted share and is calculated by the Company as common shares outstanding plus the change in net debt divided by the Company’s current trading price on the TSX, converting net debt to equity. Debt adjusted shares should not be considered as an alternative to or more meaningful than weighted average number of common shares (basic) as determined in accordance with GAAP as an indicator of the Company’s performance. Management considers Debt adjusted share is a key performance indicator as it adjusts for the effects of capital structure in relation to the Company’s peers. Production per debt adjusted share is calculated by the Company as production divided by debt adjusted shares. Management considers Production per debt adjusted share is a key performance indicator as it adjusts for the effects of changes in annual production in relation to the Company’s capital structure. Refer below for a calculation of Production per debt adjusted share.


Three months ended
March 31


2022

2021


Production

Boe/d

8,221

4,965

Net Debt

$ millions

$73.4

$79.8

Weighted average outstanding shares

# millions

86.4

68.3

Assumed Share price(2)

$

3.20

N/A

Production per debt adjusted share growth(2)


34%

N/A


Three months ended


March 31,
2022

Dec. 31,
2021

Production

Boe/d

8,221

6,687

Net Debt

$ millions

$73.4

$80.2

Weighted average outstanding shares

# millions

86.4

74.3

Assumed Share price(2)

$

3.20

N/A

Production per debt adjusted share growth(2)


9%

N/A


(1)

Production per debt adjusted share is calculated by the Company as production divided by debt adjusted shares. Debt adjusted shares is calculated by the Company as common shares outstanding plus the change in net debt divided by the Company’s current trading price on the TSX, converting net debt to equity. Share price at December 31, 2022 is assumed to be consistent with the share price at December 31, 2021.


(2)

Weighted average share price throughout the first quarter of 2022.


Capital
Management Measures

Adjusted Funds Flow

Management considers adjusted funds flow to be an important measure of InPlay’s ability to generate the funds necessary to finance capital expenditures. Adjusted funds flow is a GAAP measure and is disclosed in the notes to the Company’s consolidated financial statements for the year ending December 31, 2021. All references to adjusted funds flow throughout this document are calculated as funds flow adjusting for decommissioning expenditures and transaction and integration costs. This item is adjusted from funds flow as decommissioning expenditures are incurred on a discretionary and irregular basis and are primarily incurred on previous operating assets and transaction costs are non-recurring costs for the purposes of an acquisition, making the exclusion of these items relevant in Management’s view to the reader in the evaluation of InPlay’s operating performance. The Company also presents adjusted funds flow per share whereby per share amounts are calculated using weighted average shares outstanding consistent with the calculation of profit (loss) per common share.

Net Debt

Net debt is a GAAP measure and is disclosed in the notes to the Company’s consolidated financial statements for the year ending December 31, 2021. The Company closely monitors its capital structure with a goal of maintaining a strong balance sheet to fund the future growth of the Company. The Company monitors net debt as part of its capital structure. The Company uses net debt (bank debt plus accounts payable and accrued liabilities less accounts receivables and accrued receivables, prepaid expenses and deposits and inventory) as an alternative measure of outstanding debt. Management considers net debt an important measure to assist in assessing the liquidity of the Company.

Supplementary
Measures

“Average realized crude oil
price”
is comprised of crude oil commodity sales from production, as determined in accordance with IFRS, divided by the Company’s crude oil production. Average prices are before deduction of transportation costs and do not include gains and losses on financial instruments.

“Average realized NGL price” is comprised of NGL commodity sales from production, as determined in accordance with IFRS, divided by the Company’s NGL production. Average prices are before deduction of transportation costs and do not include gains and losses on financial instruments.

“Average realized natural gas
price”
is comprised of natural gas commodity sales from production, as determined in accordance with IFRS, divided by the Company’s natural gas production. Average prices are before deduction of transportation costs and do not include gains and losses on financial instruments.

“Average realized commodity
price”
is comprised of commodity sales from production, as determined in accordance with IFRS, divided by the Company’s production. Average prices are before deduction of transportation costs and do not include gains and losses on financial instruments.

“Adjusted funds flow per weighted
average basic share”
is comprised of adjusted funds flow divided by the basic weighted average common shares.

“Adjusted funds flow per weighted
average diluted share”
is comprised of adjusted funds flow divided by the diluted weighted average common shares.

“Adjusted funds flow per
boe”
is comprised of adjusted funds flow divided by total production.

Forward-Looking Information and
Statements

This news release contains certain forward–looking information and statements within the meaning of applicable securities laws. The use of any of the words “expect”, “anticipate”, “continue”, “estimate”, “may”, “will”, “project”, “should”, “believe”, “plans”, “intends”, “forecast” and similar expressions are intended to identify forward-looking information or statements. In particular, but without limiting the foregoing, this news release contains forward-looking information and statements pertaining to the following; the Company’s planned 2022 capital program including wells to be drilled and completed and the timing of the same; 2022 guidance based on the planned capital program including forecasts of 2022 annual average production levels, debt adjusted production levels, adjusted funds flow, free adjusted funds flow, Net Debt/EBITDA ratio, operating income profit margin, and Management’s belief that the Company can grow some or all of these attributes and specified measures; light crude oil and NGLs weighting estimates; expectations regarding future commodity prices; future oil and natural gas prices; future liquidity and financial capacity; future results from operations and operating metrics; future costs, expenses and royalty rates; future interest costs; the exchange rate between the $US and $Cdn; future development, exploration, acquisition, development and infrastructure activities and related capital expenditures, including our planned 2022 capital program; the amount and timing of capital projects; forecasted spending on decommissioning and emission reduction projects in 2022; the expectation that InPlay will be in a positive working capital position by 2022 year end; the expectation that the Company will experience inflationary cost pressures in the second half of 2022; the Company’s planned 2022 abandonment and reclamation program, including the abandonments and reclamations to be completed, forecasted spending on these activities, reduction to our ARO and forecasted LMR rating; the planned release of InPlay’s inaugural sustainability report in the summer of 2022; and methods of funding our capital program.

Forward-looking statements or information are based on a number of material factors, expectations or assumptions of InPlay which have been used to develop such statements and information but which may prove to be incorrect. Although InPlay believes that the expectations reflected in such forward-looking statements or information are reasonable, undue reliance should not be placed on forward-looking statements because InPlay can give no assurance that such expectations will prove to be correct. In addition to other factors and assumptions which may be identified herein, assumptions have been made regarding, among other things: the impact of increasing competition; the general stability of the economic and political environment in which InPlay operates; the timely receipt of any required regulatory approvals; the ability of InPlay to obtain qualified staff, equipment and services in a timely and cost efficient manner; drilling results; the ability of the operator of the projects in which InPlay has an interest in to operate the field in a safe, efficient and effective manner; the ability of InPlay to obtain debt and/or equity financing on acceptable terms; field production rates and decline rates; the ability to replace and expand oil and natural gas reserves through acquisition, development and exploration; the timing and cost of pipeline, storage and facility construction and the ability of InPlay to secure adequate product transportation; future commodity prices; that various conditions to a shareholder return strategy can be satisfied; expectations regarding the potential impact of COVID-19 and the Russia/Ukraine conflict; currency, exchange and interest rates; regulatory framework regarding royalties, taxes and environmental matters in the jurisdictions in which InPlay operates; and the ability of InPlay to successfully market its oil and natural gas products.   

The forward-looking information and statements included herein are not guarantees of future performance and should not be unduly relied upon. Such information and statements, including the assumptions made in respect thereof, involve known and unknown risks, uncertainties and other factors that may cause actual results or events to defer materially from those anticipated in such forward-looking information or statements including, without limitation: the continuing impact of the COVID-19 pandemic and the Russia/Ukraine conflict; changes in our planned 2022 capital program; changes in commodity prices and other assumptions outlined herein; the potential for variation in the quality of the reservoirs in which we operate; changes in the demand for or supply of our products; unanticipated operating results or production declines; changes in tax or environmental laws, royalty rates or other regulatory matters; changes in development plans or strategies of InPlay or by third party operators of our properties; changes in our credit structure, increased debt levels or debt service requirements; inaccurate estimation of our light crude oil and natural gas reserve and resource volumes; limited, unfavorable or a lack of access to capital markets; increased costs; a lack of adequate insurance coverage; the impact of competitors; and certain other risks detailed from time-to-time in InPlay’s continuous disclosure documents filed on SEDAR including our Annual Information Form and our MD&A.

The internal projections, expectations or beliefs underlying the Company’s 2022 capital budget, associated guidance and corporate outlook for 2022 and beyond are subject to change in light of ongoing results, prevailing economic circumstances, commodity prices and industry conditions and regulations. InPlay’s outlook for 2022 and beyond provides shareholders with relevant information on management’s expectations for results of operations, excluding any potential acquisitions, dispositions or strategic transactions that may be completed in 2022 and beyond including, without limitation, the potential impact of any shareholder return strategy that may be implemented in the future. Accordingly, readers are cautioned that events or circumstances could cause results to differ materially from those predicted and InPlay’s 2022 guidance and outlook may not be appropriate for other purposes.

This press release contains future-oriented financial information and financial outlook information (collectively, “FOFI”) about InPlay’s prospective capital expenditures, all of which are subject to the same assumptions, risk factors, limitations, and qualifications as set forth in the above paragraphs. The actual results of operations of InPlay and the resulting financial results will likely vary from the amounts set forth in this press release and such variation may be material. InPlay and its management believe that the FOFI has been prepared on a reasonable basis, reflecting management’s best estimates and judgments. However, because this information is subjective and subject to numerous risks, it should not be relied on as necessarily indicative of future results. Except as required by applicable securities laws, InPlay undertakes no obligation to update such FOFI. FOFI contained in this press release was made as of the date of this press release and was provided for the purpose of providing further information about InPlay’s anticipated future business operations. Readers are cautioned that the FOFI contained in this press release should not be used for purposes other than for which it is disclosed herein.

The forward-looking information and statements contained in this news release speak only as of the date hereof and InPlay does not assume any obligation to publicly update or revise any of the included forward-looking statements or information, whether as a result of new information, future events or otherwise, except as may be required by applicable securities laws.

The key budget and underlying material assumptions used by the Company in the development of its 2022 guidance including forecasted production, operating income, capital expenditures, adjusted funds flow, free adjusted funds flow, FAFF yield, Net Debt, Net Debt/EBITDA, EV/DAAFF, production per debt adjusted share growth are as follows:


Actuals
FY 2021

Previous Guidance
FY 2022(1)

Updated Guidance
FY 2022

WTI

US$/bbl

$67.91

$90.00

$95.40

NGL Price

$/boe

$37.79

$52.35

$47.80

AECO

$/GJ

$3.44

$4.30

$6.00

Foreign Exchange Rate

CDN$/US$

0.80

0.80

0.79

MSW Differential

US$/bbl

$3.88

$3.00

$2.70

Production

Boe/d

5,768

8,900 – 9,400

8,900 – 9,400

Royalties

$/boe

5.51

9.80 – 10.60

11.50 – 13.00

Operating Expenses

$/boe

12.83

10.00 – 13.00

11.00 – 14.00

Transportation

$/boe

1.11

0.85 – 1.10

1.05 – 1.30

Interest

$/boe

2.67

0.75 – 1.15

0.85 – 1.25

General and Administrative

$/boe

2.83

2.00 – 2.60

2.40 – 2.95

Hedging loss

$/boe

6.20

0.35 – 0.65

1.85 – 2.15

Decommissioning Expenditures

$ millions

$1.4

$2.0 – $2.5

$2.0 – $2.5

Adjusted Funds Flow

$ millions

$47.0

$141 – $150

$147 – $156

Weighted average outstanding shares

# millions

69.8

86.2

86.5

Adjusted Funds Flow per share

$/share

0.67

1.64 – 1.75

1.70 – 1.80


Actuals
FY 2021

Previous Guidance
FY 2022(1)

Updated Guidance
FY 2022

Adjusted Funds Flow

$ millions

$47.0

$141 – $150

$147 – $156

Capital Expenditures

$ millions

$33.3

$58.0

$64.0

Free Adjusted Funds Flow

$ millions

$13.6

$83 – $92

$83 – $92

Shares outstanding, end of year

# millions

86.2

86.2

86.5

Assumed Share Price

$

2.18(4)

3.06

3.66

Market capitalization

$ millions

$188

$264

$317

FAFF Yield

%

7%

31% – 35%

26% – 29%


Actuals
FY 2021

Previous Guidance
FY 2022(1)

Updated Guidance
FY 2022

Adjusted Funds Flow

$ millions

$47.0

$141 – $150

$147 – $156

Interest

$/boe

2.67

0.75 – 1.15

0.85 – 1.25

EBITDA

$ millions

$52.6

$144 – $153

$150 – $159

Net Debt/(Positive working capital, in excess of debt)

$ millions

$80.2

($1) – ($10)

($1) – ($10)

Net Debt/EBITDA


1.5

0.0 – 0.1

0.0 – 0.1


Actuals
Q2 2021

Previous Guidance
FY 2022(1)

Updated Guidance
Q2 2022

Adjusted Funds Flow

$ millions

$8.2


$37 – $40

Interest

$/boe

3.27


1.00 – 1.25

EBITDA

$ millions

$9.8


$38 – $41

Annualized EBITDA

$ millions

$39.2


$154 – $162

Net Debt/(Positive working capital, in excess of debt)

$ millions

$76.1


$50 – $53

Net Debt/EBITDA


1.9

N/A(3)

0.3


Actuals
FY 2021

Previous Guidance
FY 2022(1)

Updated Guidance
FY 2022

Production

Boe/d

5,768

8,900 – 9,400

8,900 – 9,400

Opening Net Debt

$ millions

$73.7

$80.2

$80.2

Ending Net Debt/(Pos. working capital, in excess of debt)

$ millions

$80.2

($1) – ($10)

($1) – ($10)

Weighted average outstanding shares

# millions

69.8

86.2

86.5

Assumed Share price

$

1.16(5)

3.06

3.66

Production per debt adjusted share growth(2)


31%

85% – 95%

70% – 80%


Actuals
FY 2021

Previous Guidance
FY 2022(1)

Updated Guidance
FY 2022

Share outstanding, end of year

# millions

86.2

86.2

86.5

Assumed Share price

$

2.18(3)

3.06

3.66

Market capitalization

$ millions

$188

$264

$317

Net Debt/(Positive working capital, in excess of debt)

$ millions

$80.2

($1) – ($10)

($1) – ($10)

Enterprise value

$millions

$268.2

$253 – $261

$307 – $316

Adjusted Funds Flow

$ millions

$44.1

$141 – $150

$147 – $156

Interest

$/boe

2.67

0.75 – 1.15

0.85 – 1.25

Debt Adjusted AFF

$ millions

$49.7

$144 – $153

$151 – $160

EV/DAAFF


5.4

1.6 – 1.8

1.9 – 2.1


(1)

As previously released March 16, 2022.


(2)

Production per debt adjusted share is calculated by the Company as production divided by debt adjusted shares. Debt adjusted shares is calculated by the Company as common shares outstanding plus the change in net debt divided by the Company’s current trading price on the TSX, converting net debt to equity. Share price at December 31, 2022 is assumed to be consistent with the current share price.


(3)

Guidance had not been previously released for this measure.


(4)

Ending share price at December 31, 2021.


(5)

Weighted average share price throughout 2021.


See “Production Breakdown by Product Type” below


Quality and pipeline transmission adjustments may impact realized oil prices in addition to the MSW Differential provided above


Changes in working capital are not assumed to have a material impact between Dec 31, 2021 and Dec 31, 2022.


Test Results and Initial Production
(“IP”) Rates

Test results and initial production rates disclosed herein, particularly those short in duration, may not necessarily be indicative of long term performance or of ultimate recovery. A pressure transient analysis or well-test interpretation has not been carried out and thus certain of the test results provided herein should be considered to be preliminary until such analysis or interpretation has been completed.

Production Breakdown by Product Type
Disclosure of production on a per boe basis in this press release consists of the constituent product types as defined in NI 51-101 and their respective quantities disclosed in the table below:


Light and Medium
Crude oil
(bbls/d)


NGLS
(boe/d)


Conventional Natural gas
(Mcf/d)


Total
(boe/d)

Q1 2021 Average Production

2,665


802


8,994


4,965

Q4 2021 Average Production

3,156


932


15,589


6,687

2021 Average Production

2,981


782


12,030


5,768

Q1 2022 Average Production

3,571


1,307


20,054


8,221

2022 Annual Guidance

4,320


1,311


21,114


9,150(1)

April 2022 Average Production

3,971


1,447


21,492


9,000


Note:


1.

This
reflects the mid-point of the Company’s 2022 production guidance range of
8,900 to 9,400 boe/d.


2.

With
respect to forward-looking production guidance, product type breakdown is
based upon management’s expectations based on reasonable assumptions but are
subject to variability based on actual well results.


References to crude oil, NGLs or natural gas production in this press release refer to the light and medium crude oil, natural gas liquids and conventional natural gas product types, respectively, as defined in National Instrument 51-101, Standards of Disclosure for Oil and Gas Activities (“Nl 51-101”).

BOE Equivalent
Barrel of oil equivalents or BOEs may be misleading, particularly if used in isolation. A BOE conversion ratio of 6 mcf: 1 bbl is based on an energy equivalency conversion method primarily applicable at the burner tip and does not represent a value equivalency at the wellhead. Given that the value ratio based on the current price of crude oil as compared to natural gas is significantly different than the energy equivalency of 6:1, utilizing a 6:1 conversion basis may be misleading as an indication of value.  

Oil and Gas Metrics
This presentation may contain metrics commonly used in the oil and natural gas industry, such as “payout”. This term does not have standardized meaning or standardized methods of calculation and therefore may not be comparable to similar measures presented by other companies, and therefore should not be used to make such comparisons. Management uses oil and gas metrics for its own performance measurements and to provide shareholders with measures to compare InPlay’s operations over time. Readers are cautioned that the information provided by these metrics, or that can be derived from the metrics presented in this presentation, should not be unduly relied upon.

“Payout” refers to the time required to pay back the capital expenditures (on a before tax basis) of a project.

Release – The Big Tomato, Hydroponic Division of Schwazze, Receives Westword Best of Denver Award for the Best Home Cultivation Store


The Big Tomato, Hydroponic Division of Schwazze, Receives Westword Best of Denver Award for the Best Home Cultivation Store

Research, News, and Market Data on Schwazze


DENVER, May 9, 2022 /PRNewswire/ – 
Schwazze, (OTCQX: SHWZ) (NEO: SHWZ), a premier vertically integrated, multi-state operating cannabis company with assets in Colorado and New Mexico is proud to announce that its hydroponic and indoor gardening brand, The Big Tomato has been named the Best Home Cultivation Store in the city of Denver by Westword magazine.

Westword magazine states, “The Big Tomato was helping home growers long before the dispensary boom, selling indoor gardening supplies for over two decades. Now owned by Schwazze, a Denver-based cannabis corporation, the Big Tomato still offers the same friendly service for newbies and regulars, but now has even more of a cannabis focus — and an online shopping option, to boot. For beginning green thumbs, finding a trustworthy growing store is like searching for a new mechanic; more cynical shops can take advantage of that lack of experience by suggesting unnecessary lighting equipment and nutrients. That’s not the case at the Big Tomato, so don’t be afraid to ask questions.”

“We are honored to receive the Westword award for Best Home Cultivation Store in Denver,” said Jeremy Bullock, Vice President – Commercial Sales. “We are proud to serve our community and provide expert advice to an industry that has historically lacked access to information and education about the best practices for cultivating cannabis.”

The Big Tomato (Big Tomato) has served the indoor, hydroponic and community of Colorado for over 20 years. Big Tomato predates the hydroponics boom, and offers competitive prices and an extensive selection of expertly curated supplies. The experienced growers at Big Tomato offer superior product knowledge to hobbyists and commercial growers alike. From propagation to harvest, Big Tomato has developed a reputation as the go-to source for all garden supply needs.

695 Billing St.,
Aurora, Colorado
303-364-4769

thebigtomato.com

About Schwazze

Schwazze (OTCQX:SHWZ, NEO:SHWZ) is building a premier vertically integrated regional cannabis company with assets in Colorado and New Mexico and will continue to take its operating system to other states where it can develop a differentiated regional leadership position. Schwazze is the parent company of a portfolio of leading cannabis businesses and brands spanning seed to sale. The Company is committed to unlocking the full potential of the cannabis plant to improve the human condition. Schwazze is anchored by a high-performance culture that combines customer-centric thinking and data science to test, measure, and drive decisions and outcomes. The Company’s leadership team has deep expertise in retailing, wholesaling, and building consumer brands at Fortune 500 companies as well as in the cannabis sector. Schwazze is passionate about making a difference in our communities, promoting diversity and inclusion, and doing our part to incorporate climate-conscious best practices.

Medicine Man Technologies, Inc. was Schwazze’s former operating trade name. The corporate entity continues to be named Medicine Man Technologies, Inc. Schwazze derives its name from the pruning technique of a cannabis plant to enhance plant structure and promote healthy growth.

Forward-Looking Statements

This press release contains “forward-looking statements.” Such statements may be preceded by the words “plan,” “will,” “may,”, “predicts,” or similar words. Forward-looking statements are not guarantees of future events or performance, are based on certain assumptions, and are subject to various known and unknown risks and uncertainties, many of which are beyond the Company’s control and cannot be predicted or quantified. Consequently, actual events and results may differ materially from those expressed or implied by such forward-looking statements. Such risks and uncertainties include, without limitation, risks and uncertainties associated with (i) our inability to manufacture our products and product candidates on a commercial scale on our own or in collaboration with third parties; (ii) difficulties in obtaining financing on commercially reasonable terms; (iii) changes in the size and nature of our competition; (iv) loss of one or more key executives or scientists; (v) difficulties in securing regulatory approval to market our products and product candidates; (vi) our ability to successfully execute our growth strategy in Colorado and outside the state, (vii) our ability to consummate the acquisition described in this press release or to identify and consummate future acquisitions that meet our criteria, (viii) our ability to successfully integrate acquired businesses and realize synergies therefrom, (ix) the ongoing COVID-19 pandemic, * the timing and extent of governmental stimulus programs, (xi) the uncertainty in the application of federal, state and local laws to our business, and any changes in such laws, and * out ability to satisfy the closing conditions for the private finding described in this press release. More detailed information about the Company and the risk factors that may affect the realization of forward-looking statements is set forth in the Company’s filings with the Securities and Exchange Commission (SEC), including the Company’s Annual Report on Form 10-K and its Quarterly Reports on Form 10-Q. Investors and security holders are urged to read these documents free of charge on the SEC’s website at http://www.sec.gov. The Company assumes no obligation to publicly update or revise its forward-looking statements as a result of new information, future events or otherwise except as required by law.

Cision View original content:https://www.prnewswire.com/news-releases/the-big-tomato-hydroponic-division-of-schwazze-receives-westword-best-of-denver-award-for-the-best-home-cultivation-store-301541846.html

SOURCE Schwazze


Release – PDS Biotech Provides Business Update and Reports First Quarter 2022 Financial Results


PDS Biotech Provides Business Update and Reports First Quarter 2022 Financial Results

Research, News, and Market Data on PDS Biotech

Company to host
conference call and webcast today, May 11, 2022, at 8:00 AM EDT

FLORHAM PARK, N.J., May 11, 2022 (GLOBE NEWSWIRE) — PDS Biotechnology Corporation (Nasdaq: PDSB), a clinical-stage immunotherapy company developing a growing pipeline of molecularly targeted cancer immunotherapies and infectious disease vaccines based on the Company’s proprietary Versamune® and Infectimune™ T-cell activating technologies, will discuss its financial results for the quarter ended March 31, 2022, and provide a business update on its conference call today.

“2022 is shaping up to be an incredibly productive year for PDS Biotech,” commented Dr. Frank Bedu-Addo, President and Chief Executive Officer of the Company. “As we continue to make significant clinical progress on our lead oncology candidate, PDS0101, we’re looking ahead to presentations of preliminary data from our two most advanced Phase 2 clinical trials at this year’s ASCO meeting in early June. We believe ASCO’s selection of the preliminary data from both trials for presentation at the June meeting is a testament to the quality of work being done by our team and our partners, as well as the potential demonstrated by PDS0101 in treating advanced HPV-associated cancers. We look forward to sharing these efficacy and safety data in the near term. In addition, we continue to leverage our proprietary platforms to advance our pre-clinical pipeline into clinical studies, focused on a variety of cancer targets and infectious diseases. Lastly, due to our partnering model and our financial discipline, we finished the quarter with a strong cash balance which we project to fund our current operations into 2024.”

Recent Business Highlights:

  • Announced two abstracts accepted for poster presentation during the 2022 American Society of Clinical Oncology (ASCO) Annual Meeting taking place June 3-7 in Chicago:
    • The poster presentation of Abstract # 6041 will summarize updates to the preliminary efficacy and safety data from the PDS-sponsored VERSATILE-002 Phase 2 clinical trial, which is evaluating PDS0101 in combination with Merck’s anti-PD-1 therapy KEYTRUDA® (pembrolizumab) for the treatment of recurrent or metastatic HPV16-positive head and neck cancer.
    • The poster presentation of Abstract # 2518 will summarize updates from last year’s ASCO presentation to efficacy and survival data, as well as new findings from the ongoing National Cancer Institute (NCI)-led Triple Combination Phase 2 clinical trial. This trial is evaluating PDS0101 in combination with two investigational immune-modulating agents across the range of HPV16-positive advanced relapsed refractory cancers.
  • In April, received $1.2 million from the net sale of tax benefits to an unrelated, profitable New Jersey corporation pursuant to the Company’s participation in the New Jersey Technology Business Tax Certificate Transfer Net Operating Loss (NOL) program for State Fiscal Year 2021.
  • Announced that the NCI achieved the enrollment objective of 30 patients in the checkpoint inhibitor (CPI) refractory arm of the Triple Combination Phase 2 clinical trial for PDS0101.

First Quarter 2022
Financial Results

PDS Biotech reported a net loss of approximately $8.5 million, or $0.32 per basic share and diluted share, for the three months ended March 31, 2022 compared to a net loss of approximately $3.0 million, or $0.14 per basic share and diluted share, for the three months ended March 31, 2021.

Research and development (R&D) expenses increased to approximately $5.2 million for the three months ended March 31, 2022 from approximately $1.4 million for the three months ended March 31, 2021. The increase of approximately $3.7 million in 2022 was primarily attributable to an increase of $1.8 million in manufacturing services and quality costs, $1.04 million in clinical study and regulatory costs, $0.8 million in personnel costs and $0.06 million in facilities.

General and administrative expenses increased to approximately $3.3 million for the three months ended March 31, 2022 from approximately $1.6 million for the three months ended March 31, 2021. The increase of approximately $1.7 million is primarily attributable to an increase of $1.0 million in personnel costs, $0.6 million in legal fees and $0.1 in marketing expenses.

Total operating expenses increased to approximately $8.5 million for the three months ended March 31, 2022 from approximately $3.0 million for the three months ended March 31, 2021 for the reasons described above. 

PDS Biotech’s cash balance as of March 31, 2022 was approximately $58.9 million.

Conference Call and
Webcast

The conference call is scheduled to begin at 8:00 AM EDT on Wednesday, May 11, 2022. Participants should dial 877-407-3088 (United States) or 201-389-0927 (International) and reference conference ID 13728184. To access the webcast, please use the following link PDS Biotech Earnings Webcast. The event will be archived in the investor relations section of PDS Biotech’s website for six months. 

About PDS Biotechnology
PDS Biotech is a clinical-stage immunotherapy company developing a growing pipeline of molecularly targeted cancer and infectious disease immunotherapies based on the Company’s proprietary Versamune® and Infectimune™ T-cell activating technology platforms. Our Versamune®-based products have demonstrated the potential to overcome the limitations of current immunotherapy by inducing in vivo, large quantities of high-quality, highly potent polyfunctional tumor specific CD4+ helper and CD8+ killer T-cells. PDS Biotech has developed multiple therapies, based on combinations of Versamune® and disease-specific antigens, designed to train the immune system to better recognize diseased cells and effectively attack and destroy them. The Company’s pipeline products address various cancers including HPV16-associated cancers (anal, cervical, head and neck, penile, vaginal, vulvar) and breast, colon, lung, prostate and ovarian cancers.

Our Infectimune™ -based vaccines have demonstrated the potential to induce not only robust and durable neutralizing antibody responses, but also powerful T-cell responses including long-lasting memory T-cell responses. To learn more, please visit www.pdsbiotech.com or follow us on Twitter at @PDSBiotech.

Forward Looking
Statements

This communication contains forward-looking statements (including within the meaning of Section 21E of the United States Securities Exchange Act of 1934, as amended, and Section 27A of the United States Securities Act of 1933, as amended) concerning PDS Biotechnology Corporation (the “Company”) and other matters. These statements may discuss goals, intentions and expectations as to future plans, trends, events, results of operations or financial condition, or otherwise, based on current beliefs of the Company’s management, as well as assumptions made by, and information currently available to, management. Forward-looking statements generally include statements that are predictive in nature and depend upon or refer to future events or conditions, and include words such as “may,” “will,” “should,” “would,” “expect,” “anticipate,” “plan,” “likely,” “believe,” “estimate,” “project,” “intend,” “forecast,” “guidance”, “outlook” and other similar expressions among others. Forward-looking statements are based on current beliefs and assumptions that are subject to risks and uncertainties and are not guarantees of future performance. Actual results could differ materially from those contained in any forward-looking statement as a result of various factors, including, without limitation: the Company’s ability to protect its intellectual property rights; the Company’s anticipated capital requirements, including the Company’s anticipated cash runway and the Company’s current expectations regarding its plans for future equity financings; the Company’s dependence on additional financing to fund its operations and complete the development and commercialization of its product candidates, and the risks that raising such additional capital may restrict the Company’s operations or require the Company to relinquish rights to the Company’s technologies or product candidates; the Company’s limited operating history in the Company’s current line of business, which makes it difficult to evaluate the Company’s prospects, the Company’s business plan or the likelihood of the Company’s successful implementation of such business plan; the timing for the Company or its partners to initiate the planned clinical trials for PDS0101, PDS0203 and other Versamune® and Infectimune™-based product candidates; the future success of such trials; the successful implementation of the Company’s research and development programs and collaborations, including any collaboration studies concerning PDS0101, PDS0203 and other Versamune® and Infectimune™-based product candidates and the Company’s interpretation of the results and findings of such programs and collaborations and whether such results are sufficient to support the future success of the Company’s product candidates; the success, timing and cost of the Company’s ongoing clinical trials and anticipated clinical trials for the Company’s current product candidates, including statements regarding the timing of initiation, pace of enrollment and completion of the trials (including the Company’s ability to fully fund its disclosed clinical trials, which assumes no material changes to our currently projected expenses), futility analyses, presentations at conferences and data reported in an abstract, and receipt of interim results (including, without limitation, any preclinical results or data), which are not necessarily indicative of the final results of the Company’s ongoing clinical trials; any Company statements about its understanding of product candidates mechanisms of action and interpretation of preclinical and early clinical results from its clinical development programs and any collaboration studies; and other factors, including legislative, regulatory, political and economic developments not within the Company’s control, including unforeseen circumstances or other disruptions to normal business operations arising from or related to COVID-19. The foregoing review of important factors that could cause actual events to differ from expectations should not be construed as exhaustive and should be read in conjunction with statements that are included herein and elsewhere, including the risk factors included in the Company’s annual and periodic reports filed with the SEC. The forward-looking statements are made only as of the date of this press release and, except as required by applicable law, the Company undertakes no obligation to revise or update any forward-looking statement, or to make any other forward-looking statements, whether as a result of new information, future events or otherwise.

Versamune® is a registered trademark and Infectimune™ is a trademark of PDS Biotechnology.

KEYTRUDA® is a registered trademark of Merck Sharp and Dohme Corp. a subsidiary of Meck & Co., Inc. Kenilworth, NJ USA.

Investor Contact:
Rich Cockrell
CG Capital
Phone: +1 (404) 736-3838
Email: 
pdsb@cg.capital


PDS BIOTECHNOLOGY CORPORATION AND SUBSIDIARY

Condensed Consolidated Statements of Operations and
Comprehensive Loss

(Unaudited)


March 31, 2022


December 31, 2021

ASSETS

(unaudited)


Current assets:


Cash and cash equivalents

$

58,881,101


$

65,242,622


Prepaid expenses and other


1,849,406


1,597,569


Total current assets


60,730,507


66,840,191


Property and equipment, net


86


Operating lease right-to-use asset


308,327


357,611


Total assets

$

61,038,834


$

67,197,888


LIABILITIES AND STOCKHOLDERS’ EQUITY


Current liabilities:


Accounts payable

$

2,745,709


$

1,309,403


Accrued expenses


1,961,468


2,187,704


Operating lease obligation-short term


311,311


258,924


Total current liabilities


5,018,488


3,756,031


Noncurrent liability:


Operating lease obligation-long term


146,980


231,430


Total Liabilities:

$

5,165,468


$

3,987,461


STOCKHOLDERS’ EQUITY


Common stock, $0.00033 par value, 75,000,000 shares authorized at March 31, 2022 and December 31, 2021, 28,450,894 shares and 28,448,612 shares issued and outstanding at March 31, 2022 and December 31, 2021, respectively


9,388


9,387


Additional paid-in capital


125,041,062


123,904,602


Accumulated deficit


(69,177,084

)


(60,703,562

)

Total stockholders’ equity


55,873,366


63,210,427


Total liabilities and stockholders’ equity

$

61,038,834


$

67,197,888


PDS BIOTECHNOLOGY CORPORATION AND SUBSIDIARY
Condensed Consolidated Statements of Operations and
Comprehensive Loss

(Unaudited)


Three Months Ended March 31,


2022


2021


Operating expenses:


Research and development expenses

$

5,161,315


$

1,413,057


General and administrative expenses


3,317,907


1,636,216


Total operating expenses


8,479,222


3,049,273


Loss from operations


(8,479,222

)


(3,049,273

)


Other income


Interest income


5,700


655


Net loss and comprehensive loss

$

(8,473,522

)


$

(3,048,618

)


Per share information:


Net loss per share, basic

$

(0.32

)


$

(0.14

)

Net loss per share, diluted

$

(0.32

)


$

(0.14

)


Weighted average common shares outstanding, basic


26,161,156


22,263,838


Weighted average common shares outstanding, diluted


26,161,156


22,263,838


PDS BIOTECHNOLOGY CORPORATION AND SUBSIDIARY
Condensed Consolidated Statements
of Cash Flows

(Unaudited)


Three Months Ended March 31,


2022


2021


Cash flows from
operating activities:


Net loss

$

(8,473,522

)


$

(3,048,618

)

Adjustments to reconcile net loss to net cash used in operating activities:


Stock-based compensation expense


1,128,973


257,622


Stock-based 401K company common match


35,747


Depreciation expense


86


1,860


Operating lease expense


60,257


60,257


Changes in assets and liabilities:


Prepaid expenses and other assets


(251,837

)


(721,849

)

Accounts payable


1,436,306


(464,626

)

Accrued expenses


(226,236

)


119,473


Operating lease liabilities


(43,036

)


(42,057

)


Net cash used in operating activities


(6,369,009

)


(3,802,191

)


Cash flow from
financing activities:


Proceeds from exercise of stock options


7,488


Net cash provided by financing activities


7,488


Net decrease in cash
and cash equivalents


(6,361,521

)


(3,802,191

)

Cash and cash equivalents at beginning of period


65,242,622


28,839,565


Cash and cash
equivalents at end of period

$

58,881,101


$

25,037,374


Release – Direct Digital Holdings to Report First Quarter 2022 Financial Results


Direct Digital Holdings to Report First Quarter 2022 Financial Results

Research, News, and Market Data on Direct Digital Holdings

HOUSTON, May 11, 2022 /PRNewswire/ — Direct Digital Holdings (Nasdaq: DRCT) (“Direct Digital”), a leading advertising and marketing technology holding group, will report financial results for the first quarter ended March 31, 2022, on Thursday, May 12, 2022 after the U.S. stock market closes. Management will host a conference call and webcast on the same day at 5:00 p.m. ET to discuss the results.

The live webcast and replay can be accessed at https://ir.directdigitalholdings.com/

About Direct Digital
Holdings
Direct Digital Holdings (Nasdaq: DRCT) brings state-of-the-art supply- and demand-side advertising platforms together under one umbrella company. The holding group’s supply-side platform Colossus SSP offers advertisers of all sizes extensive reach within general market and multicultural media properties. Its operating companies Huddled Masses and Orange142 deliver significant ROI for middle market advertisers by providing data-optimized programmatic solutions at scale for businesses in sectors that range from energy to healthcare and travel to financial services. Direct Digital Holdings’ sell- and buy-side solutions manage 17,500 clients daily, generating over 30 billion impressions per month across display, CTV, in-app, and other media channels.

Cision View original content to download multimedia:https://www.prnewswire.com/news-releases/reminder-direct-digital-holdings-to-report-first-quarter-2022-financial-results-301545448.html

SOURCE Direct Digital Holdings

Released May 11, 2022

Release – Cocrystal Pharma Reports First Quarter 2022 Financial Results and Provides Updates on its Antiviral Development Programs and Milestones


Cocrystal Pharma Reports First Quarter 2022 Financial Results and Provides Updates on its Antiviral Development Programs and Milestones

Research, News, and Market Data on Cocrystal Pharma

  • Reported favorable preliminary data from the two initial cohorts in its Phase 1 study with CC-42344 for the treatment of pandemic and seasonal influenza A
  • Announced a collaboration with the National Institute of Allergy and Infectious Diseases (NIAID) to evaluate the Company’s COVID-19 protease inhibitors
  • Initiated scale-up synthesis and process chemistry development in preparation to begin a Phase 1 study with oral and inhalation inhibitors for the treatment of COVID-19

BOTHELL, Wash., May 11, 2022 (GLOBE NEWSWIRE)
— 
Cocrystal Pharma, Inc. (Nasdaq: COCP) reports financial results for the three months ended March 31, 2022, and provides updates on its antiviral pipeline, upcoming milestones and business activities.

“I am pleased to be reporting progress and important developments with our antiviral programs for the treatment of influenza and COVID-19,” said Sam Lee, Ph.D., President and co-interim CEO of Cocrystal. “With our oral PB2 inhibitor, CC-42344 for the treatment of pandemic and seasonal influenza A, we announced favorable preliminary safety and pharmacokinetic data from the first two cohorts of healthy adults in our dose-escalation Phase 1 study underway in Australia. Enrollment in the remaining cohorts is ongoing.

“We are also advancing toward the start of a Phase 1 study with our novel, broad-spectrum inhalation SARS-CoV-2 3CL (main) protease inhibitor CDI-45205 for the treatment of COVID-19. Scale-up synthesis and process chemistry development are ongoing as we prepare data to support an IND application,” Dr. Lee added.

“Among our goals this year is to complete the 
CC-42344 Phase 1 influenza study and to initiate two Phase 1 COVID-19 studies with CDI-45205 and a novel, broad-spectrum orally administered protease inhibitor designed and developed using our proprietary structure-based drug discovery platform technology,” said James Martin, CFO and co-interim CEO. “We are well positioned to execute on these goals in the current challenging economic environment, given our clean capital structure and a cash balance we believe is sufficient to fund planned operations through 2023.”

Antiviral Pipeline Overview
Many antiviral drugs are effective only against certain strains of a virus and are less effective or not effective at all against other strains or variants. Cocrystal is developing drug candidates that specifically target proteins involved in viral replication. Despite the numerous strains that may exist or emerge, these enzymes are required for viral replication and are essentially similar (highly conserved) across all strains. By targeting these highly conserved regions of the replication enzymes, our antiviral compounds are designed and tested to be effective against major virus strains.

COVID-19 and Other
Coronavirus Programs

By targeting viral replication enzymes and protease, we believe it is possible to develop an effective treatment for all coronavirus diseases including COVID-19, Severe Acute Respiratory Syndrome (SARS) and Middle East Respiratory Syndrome (MERS). Our main SARS-CoV-2 protease inhibitors showed potent in
vitro 
pan-viral activity against common human coronaviruses, rhinoviruses and respiratory enteroviruses that cause the common cold, as well as against noroviruses that can cause symptoms of acute gastroenteritis.

  • Intranasal/Pulmonary Protease
    Inhibitor CDI-45205
    • CDI-45205 is our novel SARS-CoV-2 3CL (main) protease inhibitor being developed as a potential treatment for COVID-19 and its variants via intranasal/pulmonary delivery.
    • We have initiated scale-up synthesis and process chemistry development with CDI-45205 as we assemble data to support an IND application with the goal of progressing to a first-in-human clinical trial in 2022.
    • We received guidance from the FDA regarding further preclinical and clinical development of CDI-45205 that provides a clearer pathway for the Phase 1 study we plan to initiate in 2022, as well as directives for designing a subsequent Phase 2 study.
    • CDI-45205 and several analogs showed potent in
      vitro 
      activity against the SARS-CoV-2 Omicron (Botswana and South Africa/BA.1), Delta (India/B.1.617.2), Gamma (Brazil/P.1), Alpha (United Kingdom/B.1.1.7) and Beta (South Africa/B.1.351) variants, surpassing the activity observed with the original wild-type (Wuhan) strain.
    • CDI-45205 demonstrated good bioavailability in mouse and rat pharmacokinetic studies via intraperitoneal injection, and no cytotoxicity against a variety of human cell lines. CDI-45205 also demonstrated a strong synergistic effect with the FDA-approved COVID-19 medicine remdesivir.
    • CDI-45205 was among the broad-spectrum viral protease inhibitors obtained from Kansas State University Research Foundation (KSURF) under an exclusive license agreement announced in 2020. We believe the protease inhibitors obtained from KSURF have the ability to inhibit the inactive SARS-CoV-2 polymerase replication enzymes into an active form.
  • Oral Protease Inhibitors

    • We selected investigational novel antiviral drug candidates CDI-988 and CDI-873 for further development as potential oral treatments for SARS-CoV-2. Both candidates were designed and developed using our proprietary structure-based drug discovery platform technology. These agents are chemically differentiated and exhibit superior in vitro potency again SARS-CoV-2, with activity maintained against current variants of concern. Both candidates demonstrated a favorable safety profile and pharmacokinetic properties that are supportive of daily oral dosing.
    • We plan to initiate a Phase 1 study as soon as possible in 2022 with one of these candidates. We believe the FDA’s guidance for further development of CDI-45205 provides us with a clearer pathway for the clinical development of our oral COVID-19 program.
  • Replication Inhibitors

    • We are using our proprietary structure-based drug discovery platform technology to discover replication inhibitors as orally administered therapeutic and prophylactic treatments for SARS-CoV-2. Replication inhibitors hold potential to work with protease inhibitors in a combination therapy regimen.

Influenza Programs
Influenza is a severe respiratory illness caused by either the influenza A or B virus that results in outbreaks of disease mainly during the winter months. The global market for influenza therapeutics is expected to reach nearly $6.5 billion annually by 2022, according to a report published by BCC Research in May 2018.

  • Pandemic and Seasonal Influenza
    A
    • A novel PB2 inhibitor, CC-42344 has shown excellent antiviral activity against influenza A strains including pandemic and seasonal strains, as well as strains resistant to Tamiflu® and Xofluza
      ®CC-42344 also has favorable pharmacokinetic and drug-resistance profiles.
    • In March 2022 we initiated enrollment in our Phase 1 study with orally administrated antiviral CC-42344 in healthy adults. This randomized, double-controlled, dose-escalating study is designed to assess the safety, tolerability and pharmacokinetics of 
      CC-42344.
    • In April 2022 we announced preliminary data from our Phase 1 study with CC-42344, demonstrating a favorable safety and pharmacokinetic profile in the first two cohorts administered single-ascending doses of 100 mg and 200 mg. We expect to report full results from the Phase 1 clinical study in 2022.
  • Pandemic and Seasonal Influenza
    A/B program
    • In January 2019 we entered into an Exclusive License and Research Collaboration Agreement with Merck Sharp & Dohme Corp. to discover and develop certain proprietary influenza antiviral agents that are effective against both influenza A and B strains. This agreement includes milestone payments of up to $156 million plus royalties on sales of products discovered under the agreement.
    • In January 2021 we announced completion of all research obligations under the agreement. Merck is now solely responsible for further preclinical and clinical development of compounds discovered under this agreement.
    • Merck continues development activities with the compounds discovered under this agreement.

Norovirus Program

  • We are developing certain proprietary broad-spectrum protease and replication inhibitors for the treatment of norovirus infections.
  • We plan to select preclinical leads in the 2022-2023 timeframe.
  • Norovirus is a global public health problem responsible for nearly 90% of epidemic, non-bacterial outbreaks of gastroenteritis around the world.

Hepatitis C Program

  • We are seeking a partner to advance the development of CC-31244 following successful completion of a Phase 2a study. This compound has shown favorable safety and preliminary efficacy in a triple-regimen Phase 2a study in combination with Epclusa (sofosbuvir/velpatasvir) for the ultra-short duration treatment of individuals infected with the hepatitis C virus (HCV).
  • HCV is a viral infection of the liver that causes both acute and chronic infection. The 2017 World Health Organization Global Hepatitis Report estimates that 71 million people worldwide have chronic HCV infections.

First Quarter 2022 Financial Results
Research and development (R&D) expenses for the first quarter of 2022 were $2.9 million compared with $1.6 million for the first quarter of 2021, with the increase primarily related to COVID-19 and influenza programs. The Company expects R&D expenses to increase during 2022 due to the advancement of its influenza A program into the clinic and progress with preclinical COVID-19 programs toward clinical development. General and administrative expenses for the first quarter of 2022 were $1.3 million compared with $1.2 million for the first quarter of 2021, with the increase primarily due to insurance costs and reduced by the conclusion of certain previously reported legal matters.

The net loss for the first quarter of 2022 was $4.2 million, or $0.04 per share, compared with a net loss for the first quarter of 2021 of $2.7 million, or $0.04 per share.

The Company reported unrestricted cash of $54.8 million as of March 31, 2022, compared with $58.7 million as of December 31, 2021. Net cash used in operating activities for the first quarter of 2022 was $3.9 million. The Company reported working capital of $53.8 million as of March 31, 2022.

About Cocrystal Pharma, Inc.
Cocrystal Pharma, Inc. is a clinical-stage biotechnology company discovering and developing novel antiviral therapeutics that target the replication process of influenza viruses, coronaviruses (including SARS-CoV-2), hepatitis C viruses and noroviruses. Cocrystal employs unique structure-based technologies and Nobel Prize-winning expertise to create first- and best-in-class antiviral drugs. For further information about Cocrystal, please visit www.cocrystalpharma.com.

Cautionary Note Regarding Forward-Looking
Statements

This press release contains forward-looking statements within the meaning of the Private Securities Litigation Reform Act of 1995, including statements regarding our goals of initiating two Phase 1 studies for our COVID-19 programs in 2022, our expectations of reporting data from the Phase 1 clinical study of our Influenza A product candidate later in 2022, the viability and efficacy of potential treatments for coronavirus and other diseases, expectations for the global market for influenza therapeutics, our attempts to discover replication inhibitors, our development of antiviral treatments for norovirus, our expectations concerning R&D expenses, the expected sufficiency of our cash balance to fund our planned operations and our liquidity. The words “believe,” “may,” “estimate,” “continue,” “anticipate,” “intend,” “should,” “plan,” “could,” “target,” “potential,” “is likely,” “will,” “expect” and similar expressions, as they relate to us, are intended to identify forward-looking statements. We have based these forward-looking statements largely on our current expectations and projections about future events. Some or all of the events anticipated by these forward-looking statements may not occur. Important factors that could cause actual results to differ from those in the forward-looking statements include, but are not limited to, the risks arising from the impact of the COVID-19 pandemic and the Ukraine war on our Company, our collaboration partners, and on the national and global economy, including manufacturing and research delays arising from raw materials and labor shortages, supply chain disruptions and other business interruptions including and adverse impacts on our ability to obtain raw materials and test animals as well as similar problems with our vendors and our current Clinical Research Organization (CRO) and any future CROs and Contract Manufacturing Organizations, the impact of inflation and Federal Reserve interest rate increases in response thereto on the economy, the ability of our current CRO to recruit volunteers for, and to proceed with, clinical studies, possible delays resulting from future lockdowns in Australia, our reliance on Merck for further development in the influenza A/B program under the license and collaboration agreement, our and our collaboration partners’ technology and software performing as expected, financial difficulties experienced by certain partners, the results of future preclinical and clinical trials, general risks arising from clinical trials, receipt of regulatory approvals, regulatory changes, development of effective treatments and/or vaccines by competitors, including as part of the programs financed by the U.S. government, and potential mutations in a virus we are targeting which may result in variants that are resistant to a product candidate we develop. Further information on our risk factors is contained in our filings with the SEC, including our Annual Report on Form 10-K for the year ended December 31, 2021. Any forward-looking statement made by us herein speaks only as of the date on which it is made. Factors or events that could cause our actual results to differ may emerge from time to time, and it is not possible for us to predict all of them. We undertake no obligation to publicly update any forward-looking statement, whether as a result of new information, future developments or otherwise, except as may be required by law.

Investor Contact:
LHA Investor Relations
Jody Cain
310-691-7100

jcain@lhai.com

Media Contact:
JQA Partners
Jules Abraham
917-885-7378

Jabraham@jqapartners.com

Salem Media Group (SALM) – Transforming The Way You Think About Salem

Wednesday, May 11, 2022

Salem Media Group (SALM)
Transforming The Way You Think About Salem

Salem Media Group is America’s leading multimedia company specializing in Christian and conservative content, with media properties comprising radio, digital media and book and newsletter publishing. Each day Salem serves a loyal and dedicated audience of listeners and readers numbering in the millions nationally. With its unique programming focus, Salem provides compelling content, fresh commentary and relevant information from some of the most respected figures across the Christian and conservative media landscape.

Michael Kupinski, Director of Research, Noble Capital Markets, Inc.

Patrick McCann, Research Associate, Noble Capital Markets, Inc.

Refer to the full report for the price target, fundamental analysis, and rating.

Solid 1st quarter. The company reported Q1 revenue of $62.9 million, 1.8% above our estimate of $61.5 million. Adj. EBITDA of $6.85 million was virtually in line with our forecast of $6.9 million, deviating by just 0.8%.

Block programming looking strong. Block programming revenue was up 10%, which consists of 3% growth in local and 13% growth in national. This was due in part to the addition of two large ministries in the quarter. Notably, Salem has a 95%+ renewal rate with block programming….

This Company Sponsored Research is provided by Noble Capital Markets, Inc., a FINRA and S.E.C. registered broker-dealer (B/D).

*Analyst certification and important disclosures included in the full report. NOTE: investment decisions should not be based upon the content of this research summary. Proper due diligence is required before making any investment decision. 

Release – Endeavour Silver Announces Strong Q1 2022 Financial and Operating Results with Earnings Per Share of $0.07


Endeavour Silver Announces Strong Q1 2022 Financial and Operating Results with Earnings Per Share of $0.07

Research, News, and Market Data on Endeavour Silver


VANCOUVER, British Columbia, May 11, 2022 (GLOBE NEWSWIRE) —
Endeavour Silver Corp. (“Endeavour” or the “Company”) (NYSE: EXK;
TSX: EDR) 
is pleased to announce its financial and operating results for the three months ended March 31, 2022. All dollar amounts are in US dollars (US$).

“Our first quarter performance was strong, putting us on track to achieve our 2022 production guidance,” stated Dan Dickson, CEO of Endeavour Silver. “High-grade ore at Guanacevi was a driving force and is expected to continue throughout the balance of the year, while production at Bolanitos remains solid.  Industry-wide inflation is a growing challenge and we continue to look for ways to mitigate its negative impact.”

Added Mr. Dickson, “Looking ahead to the second quarter, we are targeting two major milestones:     securing debt financing for Terronera and closing the Pitarrilla transaction. This acquisition, which is fully financed, is expected to close this quarter following receipt of approval from the Mexican Federal Economics Competition Commission. After the deal closes, drilling will commence to verify Pitarrilla’s historical data and update the historical resource. This will become a key focus for us for the balance of 2022.”

Q1 2022 Highlights

  • Strong Production: 1,314,955 ounces (oz) of silver and 8,695 oz of gold for 2.0 million oz silver equivalent (AgEq) ( 1) .
  • Significant Growth in Net Revenue : Net revenue of $57.7 million from the sale of 1,717,768 oz of silver and 8,381 oz of gold at average realized prices of $24.38 per oz silver and $1,970 per oz gold.
  • Slight Decline in Net Earnings : Net earnings of $11.7 million, or $0.07 per share, down from net earnings of $12.2 million, or $0.08 per share in Q1 2021. Mine operating earnings of $20.3 million, up from mine operating earnings of $5.7 million in Q1 2021.
  • Improved Earnings Before Interest, Taxes, Depreciation &
    Amortization (EBITDA) 
    ( 2) : $25.6 million, an increase of 7% from Q1 2021.
  • Increased Cash Flow : $20.6 million in operating cash flow before working capital changes ( 2) , an increase of 293%. Mine operating cash flow before taxes ( 2) increased 101% to $26.7 million.
  • Higher Costs Due to Industry-Wide Inflation: Cash costs ( 2) of $10.21 per oz payable silver and all-in sustaining costs ( 2 ) of $20.90 per oz payable silver, net of gold credits. Cash costs ( 2) were slightly above guidance due to increased labour, power and consumables costs.
  • Healthy Balance Sheet: Cash position of $151.0 million and working capital ( 2) $168.4 million as at March 31, 2022.
  • Guanacevi Continued to Outperform: Production exceeded plan driven by higher grades.
  • Bolañitos Remained Steady: Strong silver production, higher silver grades and increased throughput were offset by lower than anticipated gold production and lower gold grades.
  • Reduced Metal Inventories : Sold 1,717,768 oz silver and 8,381 oz gold during the quarter. Management significantly reduced silver inventory and slightly increased gold inventory during the quarter and carried metal inventory at quarter end totaling 608,788 oz silver and 1,911 oz gold of bullion inventory and 59,594 oz silver and 1,931 oz gold in concentrate inventory.
  • Advanced the Terronera Project : The Terronera project continued to progress as work continued on final detailed engineering, early earth works, critical contracts and the procurement of long lead items. The Company intends to make a formal construction decision subject to completion of a financing package and receipt of additional amended permits in the coming months.
  • Announced Definitive Agreement to Acquire the Pitarrilla
    Project: 
    Endeavour’s acquisition of Pitarrilla, one of the largest undeveloped silver deposits in the world, is expected to close in Q2 2022.
  • Completed $46.0 Million Bought Deal Financing: On March 22, 2022 Endeavour completed a prospectus offering for the issuance of 9,293,150 common shares at a price of $4.95 per common share for gross proceeds of $46.0 million. The Company plans to use the net proceeds to pay the $35 million cash consideration payable to SSR Mining Inc. on completion of the Company’s acquisition of the Pitarrilla project and for the Company’s general corporate purposes and working capital.

Financial Overview (see appendix for consolidated financial statements)

Highlights

Three Months Ended March 31


2022

2021

% Change

Production


Silver ounces produced

1,314,955

1,048,100

25%

Gold ounces produced

8,695

11,109

(22%)

Payable silver ounces produced

1,303,540

1,036,710

26%

Payable gold ounces produced

8,549

10,894

(22%)

Silver equivalent ounces produced (2)

2,010,555

1,936,820

4%

Cash costs per silver ounce (2)

10.21

7.86

30%

Total production costs per ounce (2)

15.13

15.41

(2%)

All-in sustaining costs per ounce (2)

20.90

19.94

5%

Processed tonnes

206,147

209,453

(2%)

Direct operating costs per tonne (2)

122.86

112.36

9%

Direct costs per tonne (2)

148.53

126.23

18%

Silver co-product cash costs (2)

15.18

15.16

0%

Gold co-product cash costs (2)

1,226

950

29%

Financial

Revenue ($ millions)

57.7

34.5

67%

Silver ounces sold

1,717,768

623,379

176%

Gold ounces sold

8,381

10,663

(21%)

Realized silver price per ounce

24.38

27.17

(10%)

Realized gold price per ounce

1,970

1,703

16%

Net earnings ($ millions)

11.7

12.2

(5%)

Adjusted net earnings (loss) (2) ($ millions)

11.7

(4.5)

357%

Mine operating earnings ($ millions)

20.3

5.7

258%

Mine operating cash flow before taxes (2) ($ millions)

26.7

13.3

101%

Operating cash flow before working capital changes (2)

20.6

5.2

293%

EBITDA (2) ($ millions)

25.6

24.0

7%

Working capital (2) ($ millions)

168.4

113.1

49%

Shareholders

Earnings per share – basic ($)

0.07

0.08

(13%)

Adjusted earnings (loss) per share – basic (8) ($)

0.07

(0.03)

339%

Operating cash flow before working capital changes per share (2)

0.12

0.03

266%

Weighted average shares outstanding

171,557,220

159,670,842

7%

( 1 ) Silver equivalent (AgEq) is calculated using an 80:1 silver:gold ratio.

(2) These are non-IFRS financial measures and ratios. Further details on these non-IFRS financial measures and ratios are provided at the end of this press release and in the MD&A accompanying the Company’s financial statements, which can be viewed on the Company’s website, on SEDAR at www.sedar.com and on EDGAR at www.sec.gov .

For the three months ended March 31, 2022, net revenue, net of $0.7 million of smelting and refining costs, increased by 67% to $57.7 million (Q1 2021: $34.5 million).

Gross sales of $58.4 million in Q1 2022 represented a 66% increase over the $35.1 million in Q1 2021. Silver oz sold increased by 176%, due to both increased silver production and the sale of the larger finished goods inventory held at December 31, 2021. There was a 10% decrease in the realized silver price, resulting in a 148% increase in proceeds from silver sales. Gold oz sold decreased by 21% with a 16% increase in the realized gold price, resulting in a 9% decrease in proceeds from gold sales. During the period, the Company sold 1,717,768 oz silver and 8,381 oz gold for realized prices of $24.38 and $1,970 per oz, respectively, compared to Q1 2021 sales of 623,379 oz silver and 10,663 oz gold for realized prices of $27.17 and $1,703 per oz, respectively. In Q1 2022, London spot prices for silver and gold averaged $24.01 and $1,877, respectively.

The Company significantly decreased its finished goods silver inventory and slightly increased its finished goods gold inventory to 668,382 oz and 3,841 oz, respectively, at March 31, 2022 compared to 1,082,610 oz silver and 3,674 oz gold at December 31, 2021. The cost allocated to these finished goods was $13.5 million at March 31, 2022 compared to $15.6 million at December 31, 2021. At March 31, 2022, the finished goods inventory fair market value was $24.1 million, compared to $31.7 million at December 31, 2021. Earnings and other financial metrics, including mine operating cash flow ( 2) , operating cash flow (2) and EBITDA (2) were impacted by the sale during Q1 2022 of the increased bullion inventory held at year end.

After cost of sales of $37.4 million (Q1 2021 – $28.8 million), an increase of 30%, mine operating earnings were $20.3 million (Q1 2021 – $5.7 million). The increase in cost of sales was impacted by both an increase in the quantity of silver ounces sold during the period, increased production and increased labour, power and consumables costs with significantly higher royalty costs, partially offset by improved productivity at the Guanaceví and Bolañitos operations. Royalties increased 75% to $4.3 million primarily due to the increase in silver ounces sold during the period.

The Company had operating earnings of $12.6 million (Q1 2021: $14.3 million) after exploration and evaluation costs of $3.2 million (Q1 2021: $4.1 million), general and administrative costs of $4.3 million (Q1 2021: $3.5 million), and care and maintenance cost of $0.2 million (Q1 2021: $0.5 million). Operating earnings in Q1 2021 were also positively impacted by an impairment reversal of $16.8 million as a result of the valuation assessment done for El Cubo mine and related assets upon classification as held for sale.

Earnings before income taxes were $18.9 million (Q1 2021: $16.0 million) after finance costs of $0.3 million (Q1 2021: $0.3 million), a foreign exchange gain of $0.8 million (Q1 2021: loss of $0.7 million), and investment and other income of $5.8 million (Q1 2021: $2.7 million). The investment and other income during Q1 2022 primarily resulted from an unrealized gain on marketable securities and warrants of $5.4 million (Q1 2021: $2.5 million).

The Company realized net earnings for the period of $11.7 million (Q1 2021: $12.2 million) after an income tax expense of $7.2 million (Q1 2021: $3.8 million).   Current income tax expense increased to $1.0 million (Q1 2021 – $0.7 million) due to increased profitability impacting the special mining duty, while deferred income tax expense of $6.2 million is primarily due to the estimated use of loss carryforwards to reduce taxable income generated at both Guanacevi and Bolanitos (Q1 2021 – $3.1 million).

Direct operating costs ( 2) on a per tonne basis increased to $122.86, up 9% compared with Q1 2021 due to higher operating costs at Guanaceví and Bolañitos. Guanaceví and Bolañitos have seen increased labour, power and consumables costs and at Guanaceví, increased third party ore purchased and operating development have increased compared to the prior year.

Consolidated cash costs per oz, net of by-product credits, increased to $10.21 primarily due to the higher direct costs per tonne and lower gold credit driven by lower gold production compared to Q1 2021. AISC increased by 5% on a per oz basis compared to Q1 2021 as a result of higher cash costs, increased capital expenditures at Guanaceví, increased allocated general and administrative costs, offset by increased production.

The complete financial statements and management’s discussion & analysis can be viewed on the Company’s website, on SEDAR at www.sedar.com and on EDGAR at www.sec.gov . All shareholders can receive a hard copy of the Company’s complete audited financial statements free of charge upon request. To receive this material in hard copy, please contact Investor Relations at 604-640-4804, toll free at 1-877-685-9775 or by email at info@edrsilver.com.

Conference Call

A conference call to discuss the Company’s Q1 2022 financial results will be held today at 10:00 a.m. PT / 1:00 p.m. ET. To participate in the conference call, please dial the numbers below.

Date & Time:


Wednesday, May 11, 2022 at 10:00 a.m. PT / 1:00 p.m. ET


Telephone:


Toll-free in Canada and the US +1-800-319-4610

Local or International +1-604-638-5340
Please allow up to 10 minutes to be connected to the conference call.


Replay:


A replay of the conference call will be available by dialing (toll-free)
+1-800-319-6413 in Canada and the US (toll-free) or +1-604-638-9010 outside of Canada and the US. The replay passcode is 8312#. The replay will also be available on the Company’s website at www.edrsilver.com .


About Endeavour Silver – Endeavour Silver Corp. is a mid-tier precious metals mining company that operates two high-grade underground silver-gold mines in Mexico. Endeavour is currently advancing the Terronera mine project towards a development decision, pending financing and final permits and exploring its portfolio of exploration and development projects in Mexico, Chile and the United States to facilitate its goal to become a premier senior silver producer.  Our philosophy of corporate social integrity creates value for all stakeholders.

SOURCE Endeavour Silver Corp.

Contact Information
Trish Moran
Interim Head of Investor Relations
Tel: (416) 564-4290
Email: pmoran@edrsilver.com

Website: 
www.edrsilver.com


Release – QuoteMedia Q1 2022 Financial Results and Investors’ Conference Call May 13, 2022


QuoteMedia Q1 2022 Financial Results and Investors’ Conference Call May 13, 2022

Research, News, and Market Data on QuoteMedia

PHOENIX, May 10, 2022 (GLOBE NEWSWIRE) — QuoteMedia, Inc. (OTCQB: QMCI), a leading provider of market data and financial applications, today announced that its earnings for its quarter ended March 31, 2022 will be released the morning of May 13, 2022. That same day, the company will host a conference call at 2:00 PM Eastern time to discuss the financial results and provide a business update.

Conference Call Details:

Date: May 13, 2022

Time: 2:00 PM Eastern

Dial-in numbers: 866-342-8591

Conference ID: QUOTEMEDIA

An audio rebroadcast of the call will be available later at: www.quotemedia.com

About QuoteMedia

QuoteMedia is a leading software developer and cloud-based syndicator of financial market information and streaming financial data solutions to media, corporations, online brokerages, and financial services companies. The Company licenses interactive stock research tools such as streaming real-time quotes, market research, news, charting, option chains, filings, corporate financials, insider reports, market indices, portfolio management systems, and data feeds. QuoteMedia provides industry leading market data solutions and financial services for companies such as the Nasdaq Stock Exchange, TMX Group (TSX Stock Exchange), Canadian Securities Exchange (CSE), London Stock Exchange Group, FIS, U.S. Bank, Broadridge Financial Systems, JPMorgan Chase, CI Financial, Canaccord Genuity Corp., Hilltop Securities, HD Vest, Stockhouse, Zacks Investment Research, General Electric, Boeing, Bombardier, Telus International, Business Wire, PR Newswire, FolioFN, Regal Securities, ChoiceTrade, Cetera Financial Group, Dynamic Trend, Inc., Qtrade Financial, CNW Group, IA Private Wealth, Ally Invest, Inc., Suncor, Virtual Brokers, Leede Jones Gable, Firstrade Securities, Charles Schwab, First Financial, Cirano, Equisolve, Stock-Trak, Mergent, Cision, Day Trade Dash, LLC and others. Quotestream®, QModTM and Quotestream ConnectTM are trademarks of QuoteMedia. For more information, please visit www.quotemedia.com.

QuoteMedia Investor
Relations

Brendan Hopkins
Email: 
investors@quotemedia.com
Call: (407) 645-5295

RCI Hospitality Holdings (RICK) – Momentum Continues to Build

Tuesday, May 10, 2022

RCI Hospitality Holdings (RICK)
Momentum Continues to Build

With more than 50 units, RCI Hospitality Holdings, Inc., through its subsidiaries, is the country’s leading company in gentlemen’s clubs and sports bars/restaurants. Clubs in New York City, Chicago, Dallas-Fort Worth, Houston, Miami, Minneapolis, Denver, St. Louis, Charlotte, Pittsburgh, Raleigh, Louisville, and other markets operate under brand names such as Rick’s Cabaret, XTC, Club Onyx, Vivid Cabaret, Jaguars Club, Tootsie’s Cabaret, and Scarlett’s Cabaret. Sports bars/restaurants operate under the brand name Bombshells Restaurant & Bar.

Joe Gomes, Senior Research Analyst, Noble Capital Markets, Inc.

Joshua Zoepfel, Research Associate, Noble Capital Markets, Inc.

Refer to the full report for the price target, fundamental analysis, and rating.

2Q22 Results. Revenue hit a record $63.7 million, up 3.0% sequentially and up 44.6% y-o-y. Omicron cut quarterly revenue by an estimated $2 million. We had projected $65.3 million of revenue. Net income was $11.0 million, or $1.15 per share, compared to $6.1 million, or $0.68 per share last year. We were at $11.6 million, or $1.22 per share.

Club Acquisitions and Growth. RCI just acquired another South Florida club for $16 million, or 4.1x club EBITDA and is under contract to purchase a club in Ft. Worth, TX. In addition, the rebranded Louisiana club was opened in March and the reformatted San Antonio club will open in the third quarter.  …

This Company Sponsored Research is provided by Noble Capital Markets, Inc., a FINRA and S.E.C. registered broker-dealer (B/D).

*Analyst certification and important disclosures included in the full report. NOTE: investment decisions should not be based upon the content of this research summary. Proper due diligence is required before making any investment decision. 

Information Services Group (III) – An Exceeding First Quarter

Tuesday, May 10, 2022

Information Services Group (III)
An Exceeding First Quarter

ISG (Information Services Group) (Nasdaq: III) is a leading global technology research and advisory firm. A trusted business partner to more than 700 clients, including more than 75 of the world’s top 100 enterprises, ISG is committed to helping corporations, public sector organizations, and service and technology providers achieve operational excellence and faster growth. The firm specializes in digital transformation services, including automation, cloud and data analytics; sourcing advisory; managed governance and risk services; network carrier services; strategy and operations design; change management; market intelligence and technology research and analysis. Founded in 2006, and based in Stamford, Conn., ISG employs more than 1,300 digital-ready professionals operating in more than 20 countries—a global team known for its innovative thinking, market influence, deep industry and technology expertise, and world-class research and analytical capabilities based on the industry’s most comprehensive marketplace data. For additional information, visit www.ISG-One.com

Joe Gomes, Senior Research Analyst, Noble Capital Markets, Inc.

Joshua Zoepfel, Research Associate, Noble Capital Markets, Inc.

Refer to the full report for the price target, fundamental analysis, and rating.

Going Past Expectations. ISG announced record revenue of $72.6 million, continuing the trend of record revenue, an increase of 12% in constant currency and exceeding our estimate of $70 million. The quarter had record net income of $4.9 million, or $0.10 fully diluted EPS, versus $3.4 million and $0.07 the previous year. Adjusted EBITDA also was a record at $10.6 million, a 23% increase year-over-year. We forecasted net income of $4.65 million, $0.09 fully diluted EPS, and adjusted EBITDA of $9 million.

Still Having Momentum. The Company is continuing to see a favorable environment with companies investing in technology to power through market headwinds. ISG experienced double digit growth in recurring revenues, especially on its subscription research and platform businesses, and management sees market momentum continuing in 2022. This momentum is continued with the expansion of the Company’s ISG GovernX platform with the Agreemint acquisition, which we believe will be additive to the segment top-line growth….

This Company Sponsored Research is provided by Noble Capital Markets, Inc., a FINRA and S.E.C. registered broker-dealer (B/D).

*Analyst certification and important disclosures included in the full report. NOTE: investment decisions should not be based upon the content of this research summary. Proper due diligence is required before making any investment decision.