Russell Reconstitution 2022, What Investors Should Know


The Annual Russell Index Revision and Dates to Watch (2022)

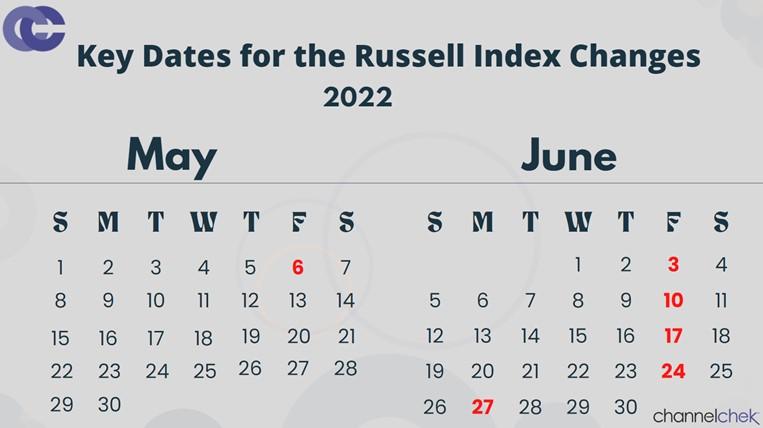
The yearly process of recasting the Russell Indexes begins on May 6, 2022, and will be complete by market opening on June 27. During the period in between, FTSE Russell will rank stocks for additions, for deletions and evaluate the companies to make sure they conform overall. The methodology for inserting and removing tickers in the Russell 3000, Russell 2000, and Russell 1000 is intentionally transparent to help eliminate price shocks. Price movements do of course occur along the way, and investors try to foresee and capitalize on them. Channelchek will be providing updates that may uncover opportunities, or at least provide an understanding of stock price swings during this period.

Background

Russell index products are widely used by institutional and retail investors throughout the world. There is more than $16 trillion currently benchmarked to a Russell index. This includes approximately $9 trillion benchmarked to the Russell US Equity indexes. The trading volume of some companies moving into an index will heighten around the last Friday in June as fund managers seek to maintain level tracking with their benchmark target. 

Opportunity

For non-passive investor money, determining which stocks may benefit from moving up to a large-cap index, down to a smaller one, or into or out of the measurements is an annual event causing volatility around stocks. There is, of course, the potential for very profitable long and short trades. And the potential for an unwitting investor to be holding a company moving out of an index, could cause less interest in the stock.

Active investors should make themselves aware of the forces at play so they may either get out of the way or become involved by taking positions with those being added or those at the end of their reign within one of the Russell measurements.

Dramatic Valuation Shifts

The leading industries and growing market-cap companies of a year ago have shifted dramatically from the reconstitution
last year
. This will be reflected in the 2022 rebalancing and is going to impact a much larger number of companies than most years. That is to say, more companies than normal will move in, out, or to another index, perhaps with amplified price movement.

The 2022 Russell Reconstitution Schedule:

• Friday, May 6 – “Rank Day” – Index membership eligibility for 2022 Russell Reconstitution determined from constituent market capitalization at market close.

• Friday, June 3 – Preliminary index additions & deletions membership lists posted to the FTSE Russell website after 6 PM US eastern time.

• Friday, June 10th & 17th – Preliminary membership lists (reflecting any updates) posted to the FTSE Russell website after 6 PM US eastern time.

• Monday, June 13 – “Lock-down” period begins with the updated membership lists published on June 17 considered to be final.

• Friday, June 24 – Russell Reconstitution is final after the close of the US equity markets.

• Monday, June 27 – Equity markets open with the newly reconstituted Russell US Indexes.


Take-Away

The annual reconstitution is a significant driver of dramatic shifts in some stock prices as portfolio managers have their needs shifted within a very short period of time. Longer-term demand for certain equities is altered as well. Sizable price movements and volatility are expected, especially around the last week in June. In fact, the opening day of the reconstitution is typically one of the highest trading-volume days of the year in the US equity markets.

The market event impacts more than $9 trillion of investor assets benchmarked to or invested in products based on the Russell US Indexes. Portfolio managers that are required to track one of these indexes will work to have minimal portfolio slippage away from their benchmark.  The days and weeks from May 6 through the end of June can create opportunities for investors seeking to benefit from price moves, Channelchek will be covering the event as stocks to be added to, or removed from this year’s Russell Reconstitution and other information plays out.

Be sure to register to receive Channelchek updates and information.

Paul Hoffman

Managing Editor, Channelchek


Suggested Content


Will Small Cap Stocks Outperform in 2022?


Small Caps are Bigger than Ever, Investors May Need to Adjust


Trump Media De-Spac in Face of Musk Twitter Purchase


No Punches Pulled at NobleCon18 Panel Discussion


Source

https://www.ftserussell.com/resources/russell-reconstitution


Stay up to date. Follow us:


Dealing With False Positives During Drug Screening Process


Image Credit: Alex Green (Pexels)


Discovering New Drugs is a Long and Expensive Process – Chemical Compounds that Dupe Screening Tools Make it Even Harder

Modern drug discovery is an expensive and complicated process. Hundreds of scientists and at least a decade are often required to produce a single medicine. One of the most critical steps in this process is the first one – identifying new chemical compounds that could be developed into new medicines.

Researchers rely heavily on bioassays to identify potential drug candidates. These tests measure a compound’s ability to act on a biological target of interest. Candidates that show up as a “hit” by interacting with a target of interest (such as fitting into a binding site on the target) move on to further study and development. Advances in technology called high-throughput screening have allowed researchers to run thousands of compounds through bioassays in a short time, significantly streamlining the process.

But some of these “hits” don’t actually interact with the target as intended. And for the unwary researcher, this can lead down a rabbit hole of lost time and money.

This article was republished with permission from The Conversation, a news site dedicated to sharing ideas from academic experts. It was written by and represents the research-based opinions of Martin Clasby, Research Assistant Professor of Medicinal Chemistry, University of Michigan.

I am a medicinal chemist who has been working in the drug discovery field for over 26 years, and one of the greatest challenges I have faced in my research is selecting good candidates from drug screening tests. One particular category of compounds, known as pan-assay interference compounds, or PAINS, is a common pitfall.

Bioassays involve placing a chemical compound together with the target of interest and measuring the strength of their interaction. Researchers assess interaction strength using a number of methods depending on how the bioassay is designed. A common assay design emits light when there is an interaction, where the intensity of the light depends upon the strength of interaction.

PAINS refer to compounds that often come up as false positives during the screening process. Because of certain characteristics of these molecules, they can interact with a target in nonspecific or unexpected ways. Some can even react chemically with the target. So while PAINS may come up as a hit in a screen, it doesn’t necessarily mean they actually do what researchers hoped they’d do. Common worst offenders include compounds like quinones, catechols and rhodanines.


Unlike desired drug compounds that interact specifically with a target of interest, PAINS react nonspecifically with a wide variety of targets. Image credit: Bcary (Wikipedia Commons)

There are a number of ways that PAINS dupe bioassays.

Some PAINS have properties that cause them to emit light (or fluoresce) under certain conditions. Since many bioassays detect light as a signal for a hit, this can confuse the assay readout and result in a false positive.

Other PAINS can act as redox cyclers in bioassays – producing hydrogen peroxide that can block the target and be misread as a hit.

Similarly, some PAINS form colloidal aggregates – clumps of molecules that interfere with the target of interest by absorbing it or modifying the molecular structure. In rare cases, these clumps can even elicit a desired interaction with the target of interest because of their large size.

Trace impurities left over from manufacturing can also elicit a PAINS response.

To make things even more complicated, because PAINS react with targets much more strongly than most compounds that are true drug candidates, PAINS often appear as the most promising hits in screening.

Curcumin, the bright yellow chemical commonly found in the turmeric in curry, is one notorious example of a pan-assay interference compound.


What Can be Done About PAINS?

An estimated 5% to 12% of compounds in the screening libraries academic institutions use for drug discovery consist of PAINS. Scientists misled by a false positive can waste considerable time if they try to develop these compounds into usable drugs.

Since researchers became aware of the existence of PAINS, medicinal chemists have identified frequent offenders and actively remove these compounds from screening libraries. However, some compounds will always fall through the cracks. It is ultimately up to the researcher to identify and discard these PAINS when they show up as false positives.

There are a few things researchers can do to filter out PAINS. In some cases, visually inspecting compounds for structural similarities with other known PAINS can be enough. For other cases, additional experiments are necessary to eliminate false positives.

Testing for the presence of hydrogen peroxide, for example, can help identify redox cyclers. Likewise, adding detergents can help break up colloidal aggregates. And bioassays that do not use light detection to register hits can circumvent PAINS that emit light.

Even the most experienced medicinal chemist needs to be cognizant of the dangers of these false positives. Taking steps to ensure that these types of compounds don’t make it to the next stage of drug discovery can avoid wasted time and effort and ultimately lead to a more efficient and cost-effective drug discovery process.

Suggested Reading


Psychedelic Medicine a Revolution for the Mind


A Global Reimagined Health Ecosystem


Generating Synthetic Data to Speed AI


Tracing the Origins of a Virus


Stay up to date. Follow us:


Release – Neovasc to Report First Quarter Financial Results on May 12 2022


Neovasc to Report First Quarter Financial Results on May 12, 2022

Research, News, and Market Data on Neovasc


VANCOUVER and MINNEAPOLIS – ( NewMediaWire ) – April 28, 2022 – Neovasc Inc. (NASDAQ ,  TSX : NVCN), will report financial results for the quarter ended March 31, 2022 on Thursday, May 12, 2022. Neovasc’s President and Chief Executive Officer Fred Colen, and Chris Clark, Chief Financial Officer, will host a conference call to review the company’s results at 4:30 pm EDT on May 12, 2022.

Interested parties may access the conference call by dialing (877) 407-9208 or (201) 493-6784 (International) and reference Conference ID 13729200. Participants wishing to join the call via webcast should use the link posted on the investor relations section of the Neovasc website at  neovasc.com/investors/. A replay of the webcast will be available approximately 30 minutes after the conclusion of the call using the link on the Neovasc website.


About Neovasc Inc.

Neovasc is a specialty medical device company that develops, manufactures, and markets products for the rapidly growing cardiovascular marketplace. Its products include Reducer, for the treatment of refractory angina, which is under clinical investigation in the United States and has been commercially available in Europe since 2015, and Tiara™ for the transcatheter treatment of mitral valve disease, which is currently under clinical investigation in the United States, Canada, Israel and Europe. For more information, visit:  www.neovasc.com.


Forward-Looking Statement Disclaimer

Certain statements in this news release contain forward-looking statements within the meaning of the U.S. Private Securities Litigation Reform Act of 1995 and applicable Canadian securities laws that may not be based on historical fact. When used herein, the words expect, anticipate, estimate, may, will, should, intend, believe, and similar expressions, are intended to identify forward-looking statements. Forward-looking statements may involve, but are not limited to, the growing cardiovascular marketplace. Forward-looking statements are based on estimates and assumptions made by the Company in light of its experience and its perception of historical trends, current conditions and expected future developments, as well as other factors that the Company believes are appropriate in the circumstances. Many factors could cause the Company’s actual results, performance or achievements to differ materially from those expressed or implied by the forward-looking statements, including those described in the Risk Factors section of the Company’s Annual Report on Form 20-F and in the Management’s Discussion and Analysis for the year ended December 31, 2021 (copies of which may be obtained at www.sedar.com or www.sec.gov). These factors should be considered carefully, and readers should not place undue reliance on the Company’s forward-looking statements. The Company has no intention and undertakes no obligation to update or revise any forward-looking statements, whether as a result of new information, future events or otherwise.


Contacts

Investors
Mike Cavanaugh
Westwicke/ICR
Phone: +1.617.877.9641
Email: Mike.Cavanaugh@westwicke.com


Media
Sean Leous
Westwicke/ICR
Phone: +1.646.866.4012
Email: Sean.Leous@icrinc.com

Has the Fed Run Out of Good Options?


What Will the Fed Choose: Recession or an Economic Crisis?

Last week was all about earnings, as some of Wall Street’s heavyweights released their quarterly reports. Moreover, while mixed results caused sentiment to swing from one extreme to the other, inflation remains front and center, and the outlook for Fed policy is bullish.

For example, whether it’s PepsiCo, Mondelez, or Whirlpool, companies have warned that inflation remains extremely problematic. Moreover, with American Express and Visa highlighting consumers’ eagerness to spend, the pricing pressures show no signs of slowing down. Likewise, S&P Global released its U.S. Composite PMI on Apr. 22, and I wrote on Apr. 25 that it was another all-time high for inflation.

Services:


Source: S&P Global

Manufacturing:
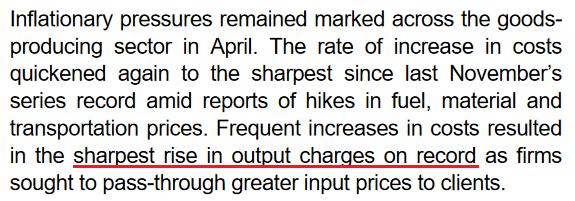

Source: S&P Global

With growth, employment and inflation supporting several rate hikes over the next several months, there is little in the release that implies a dovish U-turn. To that point, please remember that the survey was conducted from Apr. 11 to Apr. 21. Therefore, while investors hope that decelerating growth and inflation will allow the Fed to back off, the PMI data suggests otherwise. As such, the Fed’s conundrum continues to intensify.

Furthermore, with more appetizing earnings reports released on Apr. 28, the results were even more bullish for Fed policy. Likewise, with the precious metals (PMs’) force fields wearing off, they should suffer profoundly as rate hike volatility increases. For example, McDonald’s released its first-quarter earnings on Apr. 28. CFO Kevin Ozan said during the Q1 earnings call:

“In the U.S., I think last quarter, I mentioned that we thought commodities were going to be up roughly 8% or so for the U.S. That number is now more like 12% to 14% for the year. So U.S. commodities clearly have risen (…).”

“On the labor side, in the U.S., it’s probably over 10% right now. Part of that is because, you’ll recall that we made adjustments to our wages in our company-owned restaurants mid-year last year, so we haven’t lapped that. So part of it is due to that and part of it is due to just continued wage inflation.”

As a result, the Fed is losing control of the inflation situation, and the largest restaurant chain in the world is still sounding the alarm. Therefore, with the pricing pressures unwilling to abate on their own (which I’ve warned about for some time), killing demand is the only way to reduce the wage-price spiral.

Please see below:
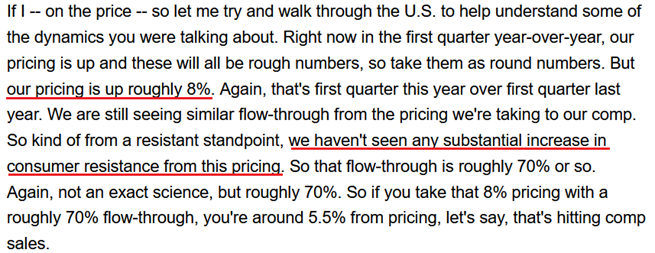

Source: McDonald’s/Seeking Alpha

On top of that, Caterpillar released its first-quarter earnings on Apr. 28. For context, the company is the world’s largest construction equipment manufacturer. CFO Andrew Bonfield said during the Q1 earnings call:

“We remain encouraged by the strong demand for our products and services. The first quarter of 2022 marked the fifth consecutive quarter of higher end user demand compared to the prior year. Services remained strong in the quarter. We continue to make progress on our service initiatives, including customer value agreements, e-commerce, connected assets and prioritized service events.”

CEO Jim Umpleby added:

“Absent the supply chain constraints, our top line would have been even stronger. When the supply chain conditions ease, we expect to be well positioned to fully meet demand and gain operating leverage from higher volumes.”

Thus, with each new earnings season, companies note that demand remains resilient. As a result, why not raise prices and capitalize on too much stimulus?
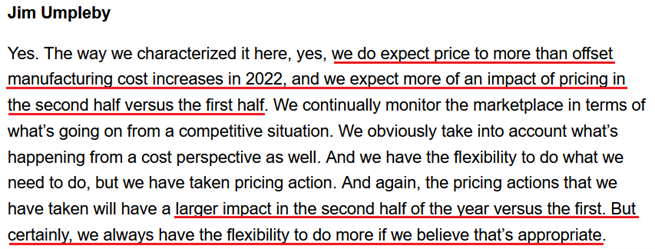

Source: Caterpillar/Seeking Alpha

As expected, the “transitory” camp waved the white flag in 2022. However, the merry-go-round of input/output inflation was visible from a mile away. For example, remember what I wrote on Mar. 30, 2021?

Didn’t Powell insist that near-term inflation was only “one-time” and “transient”? Well, despite government-issued CPI data failing to capture the effect of the Fed’s liquidity circus, pricing pressures are popping up everywhere. And with corporations’ decision tree left to raising prices or accepting lower margins, which one do you think they’ll choose?

Continuing the theme, Domino’s Pizza reported its first-quarter earnings on Apr. 28. For context, the company is the largest pizza chain in the U.S. Moreover, when contrasting the quarterly results of Microsoft and Alphabet on Apr. 28, I wrote that investors fail to realize that some companies have succumbed to the medium-term realities sooner than others. Therefore, Domino’s Pizza is another example. CEO Ritch Allison said during the Q1 earnings call:

“Consistent with our communications during our prior earnings call, we faced significant inflationary cost increases across the business in Q1. Those cost pressures combined with the deleveraging from the decline in U.S. same-store sales resulted in earnings falling short of our high expectations for the business (…).”

“We believe that we will continue to face pressure both on the top line for our U.S. business and on our bottom line earnings over the next few quarters. While we remain very optimistic about our ability to drive long-term profitable growth in the near-term 2022 is shaping up to be a challenging year.”


CFO Sandeep Reddy added:

“In addition, we would like to update the guidance we provided in March for 2022. Based on the continuously evolving inflationary environment, we now expect the increase in the store food basket within our U.S. system to range from 10% to 12% as compared to 2021 levels.”

If that wasn’t enough, with unprecedented handouts reducing U.S. citizens’ incentive to work, staffing shortages materially impacted Domino’s Q1 results. Moreover, the development is extremely inflationary and only increases the chances of future interest rate hikes.

Please see below:


Source: Domino’s Pizza/Seeking Alpha

Therefore, while I’ve warned on numerous occasions that the Fed is in a lose-lose situation, investors still hold out hope for a dovish pivot. However, they fail to understand the consequences. For example, a dovish 180 is extremely unlikely in this environment; but even if officials completely reversed course, the long-term economic damage would be even more paramount.

When companies are saddled with input pressures, even value-oriented chains like Domino’s Pizza can only endure margin erosion for so long. Thus, with management searching for new ways to appease investors, Fed officials’ patience will only cause an even bigger long-term collapse once inflationary demand destruction unfolds.

Please see below:


Source: Domino’s Pizza/Seeking Alpha

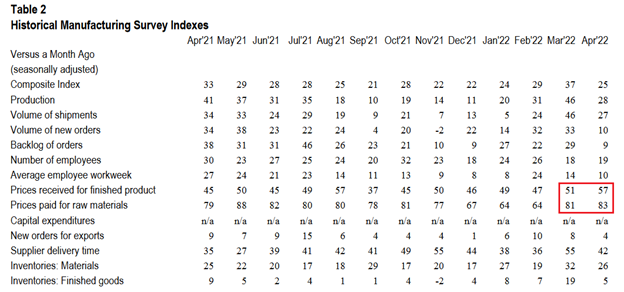
Turning to the macroeconomic front, some interesting data also hit the wire on Apr. 28. For example, the Kansas City Fed released its Tenth District Manufacturing Survey. The headline index declined from 37 in March to 25 in April. Chad Wilkerson, Vice President and Economist at the KC Fed, said:

“The pace of regional factory growth eased somewhat but remained strong. Firms continued to report issues with higher input prices, increased supply chain disruptions, and labor shortages. However, firms were optimistic about future activity and reported little impact from higher interest rates.”

To that point, both the prices paid and received indexes increased month-over-month (MoM).


Please see below:

Source: KC Fed

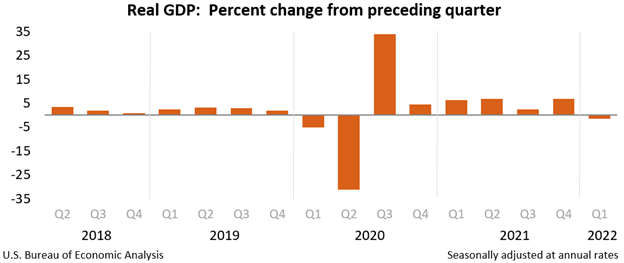
Finally, the major surprise on Apr. 28 was that U.S. real GDP contracted by 1.4% (advance estimate) in Q1. The report stated: “The decrease in real GDP reflected decreases in private inventory investment, exports, federal government spending, and state and local government spending, while imports, which are a subtraction in the calculation of GDP, increased.”

However: “Personal consumption expenditures (PCE), nonresidential fixed investment, and residential fixed investment increased.”

Therefore, with supply chain disruptions leading to import stockpiling (which hurts GDP), net trade was the weak link. However, the dynamic should reverse in Q2 and Q3, and if so, shouldn’t impact the Fed’s rate hike cycle.
The bottom line? The Fed is stuck between a rock and a hard place: deal with inflation now and (likely) push the U.S. into a recession later or ignore inflation and watch an even bigger crisis unfold down the road. As such, the first option is the most likely outcome. Remember, while Fed officials may seem out of touch, they’re not stupid, and history shows the devastating consequences of letting unabated inflation fester. Therefore, interest rate hikes should dominate the headlines over the next several months, and the PMs and the S&P 500 should suffer mightily along the way.

In conclusion, the PMs were mixed on Apr. 28, as silver was the daily underperformer. Moreover, while mining stocks were boosted by the S&P 500, the ‘buy the dip’ crowd is fighting a losing battle. With Amazon and Apple down after the bell on Apr. 28, weak earnings guidance should also dominate the headlines in the months to come. As a result, with the USD Index on fire and real yields poised to continue their ascent, the PMs’ medium-term outlooks are extremely treacherous.

What to Watch for Next Week

With more U.S. economic data releases next week, the most important are as follows:

May 2: ISM Manufacturing PMI

Like this week’s S&P Global Report, ISM’s report is one of the most important data points because it covers growth, inflation, and employment across the entire U.S. Therefore, the results are more relevant than regional surveys.

May 3: JOLTS job openings

Since the lagged data covers March’s figures, it’s less relevant than leading data like the PMIs. However, it’s still important to monitor how government-tallied results are shaping up.

May 4: ADP private payrolls, ISM Services PMI, FOMC statement and press conference

With the FOMC poised to hike interest rates by 50 basis points on May 4, the results and Powell’s comments are the most important fundamental developments of the week. However, ADP’s private payrolls will also provide insight into the health of the U.S. labor market, while the ISM’s Services PMI will have similar implications as the manufacturing PMI. Moreover, both will provide clues about future Fed policy.

May 5: Challenger jobs cuts

With the data showcasing how many employees were fired in April, it’s another indicator of the health of the U.S. labor market.

May 6: Nonfarm payrolls, unemployment rate, average hourly earnings

Half of the Fed’s dual mandate is maximum employment, so continued strength in nonfarm payrolls is bullish for Fed policy. In addition, a low unemployment rate is also helpful, while average hourly earnings will showcase the current state of wage inflation.

All in all, economic data releases impact precious metals because they impact monetary policy. Moreover, if we continue to see higher employment and inflation, the Fed should keep its foot on the hawkish accelerator. If that occurs, the outcome is profoundly bearish for the PMs.

About the Author: Przemyslaw Radomski, CFA (PR) writes for and publishes articles that underscore his disposition of being passionately curious about markets behavior. He uses his statistical and financial background to question the common views and profit on the misconceptions.

Suggested Reading


Can the Fed Stop Inflation?


CPI and PPI Both Suggests Persistent Inflation


Deflation Not Inflation is Risk Says Cathie Wood


Will the Fed be Fighting Inflation Now?


Stay up to date. Follow us:


Release – Ocugen, Inc. to Present Preclinical Results at The Association for Research in Vision and Ophthalmology (ARVO) 2022 Annual Meeting


Ocugen, Inc. to Present Preclinical Results at The Association for Research in Vision and Ophthalmology (ARVO) 2022 Annual Meeting

Research, News, and Market Data on Ocugen

MALVERN, Pa., April 29, 2022 (GLOBE NEWSWIRE) — Ocugen, Inc. (NASDAQ: OCGN), a biotechnology company focused on discovering, developing and commercializing novel gene therapies, biologicals and vaccines, today announced two presentations on the company’s research into the development of a modifier gene therapy to treat dry age-related macular degeneration (AMD), and a novel biologic to treat wet-AMD and diabetic macular edema (DME) at The Association for Research in Vision and Ophthalmology’s (ARVO) 2022 Annual Meeting in Denver on May 1 – 4, 2022.

“We are excited to share information about two of the innovative treatments for blindness diseases we’ve been working on,” said Arun Upadhyay, PhD, Ocugen’s Senior Vice President of Research & Development. “Our breakthrough modifier gene therapy platform, OCU410, consisting of a RORA modifier gene, has the potential to treat patients with dry age-related macular degeneration (Dry-AMD). RORA regulates inflammatory and oxidative pathways associated with Dry-AMD and establishes homeostasis in molecular processes to control the disease pathophysiology. We believe that OCU200, our novel biologic product candidate, has the potential to offer a better therapy to millions of people with diabetic macular edema, diabetic retinopathy, and Wet-AMD, furthering our goal to provide a new option for people who are currently underserved.”

Ocugen
Presentations at ARVO 2022:

Presentation
Title:
 OCU410, a Potential Therapeutic for
Dry-AMD, Suppresses Inflammatory Cytokine Gene Expression in Retinal Pigment
Epithelial Cells

Authors: Dinesh K. Singh, Sree S. Kattala, Arun K. Upadhyay

Presentation Type: Poster Session
Presenter: Dinesh K. Singh, Principal Scientist, Discovery
Date/Time: May 1, 2022, from 12:15 – 2:15 PM MDT

Presentation
Title:
   Binding Affinity: A Measure of Potency
for OCU200, a Potential Therapeutic for the Treatment of Wet-AMD and DME

Authors: Pratap C. Naha, Subechhya Neupane, Arun K. Upadhyay.  
Presentation Type: Oral Presentation

Presenter: Pratahap C. Naha, PhD, Associate Director, Drug Delivery and Nanotechnology
Date/Time: May 4, 2022, at 3:00 PM MDT

About Dry
Age-related Macular Degenerations (Dry AMD)

Age-related Macular Degeneration (AMD) is characterized by thickening and loss of normal architecture within Bruch’s membrane, lipofuscin accumulation in the retinal pigment epithelium (“RPE”), and drusen formation beneath the RPE in Bruch’s membrane. These deposits consist of complement components, other inflammatory molecules, lipids, lipoproteins B and E, and glycoproteins. Dry AMD, which affects about 9 to 10 million Americans, involves the slow deterioration of the retina with submacular drusen (small white or yellow dots on the retina), atrophy, loss of macular function and central vision impairment. Dry AMD accounts for 85-90% of the total AMD population, and there is no approved treatment.

About
Diabetic Macular Edema (DME and Diabetic Retinopathy (DR)

Diabetic macular edema (DME) and diabetic retinopathy (DR) are the most common vision-threatening diseases occurring in people with diabetes. Approximately 7.7 million people are affected with DR and approximately 745,000 with DME in the United States. These numbers are expected to further increase as the number of people with diabetes increases.

About
Wet-AMD

About 10-15% of people with AMD progress to the advanced “wet” form. It’s generally caused by abnormal blood vessels that leak fluid or blood into the macula. (The part of the retina that’s responsible for central vision.) The result can be irreversible damage to photoreceptor cells and rapid, severe vision loss, particularly in the center of the field of vision, causing significant functional impairment. Wet-AMD accounts for 90% of all AMD-related blindness.

About
Ocugen, Inc.

Ocugen, Inc. is a biotechnology company focused on discovering, developing, and commercializing novel gene therapies, biologicals and vaccines that improve health and offer hope for people and global communities. We are making an impact through courageous innovation, taking science in new directions in service of patients. Our breakthrough modifier gene therapy platform has the potential to treat multiple diseases with one drug and we are advancing research in other therapeutic areas to offer new options for people with unmet medical needs. Discover more at www.ocugen.com and follow us on Twitter and LinkedIn.

Cautionary Note on Forward-Looking Statements
This press release contains forward-looking statements within the meaning of The Private Securities Litigation Reform Act of 1995, which are subject to risks and uncertainties. Such forward-looking statements within this press release include, without limitation, the intended use of net proceeds from the registered direct offering. We may, in some cases, use terms such as “predicts,” “believes,” “potential,” “proposed,” “continue,” “estimates,” “anticipates,” “expects,” “plans,” “intends,” “may,” “could,” “might,” “will,” “should” or other words that convey uncertainty of future events or outcomes to identify these forward-looking statements. Such statements are subject to numerous important factors, risks and uncertainties that may cause actual events or results to differ materially from our current expectations, such as market and other conditions. These and other risks and uncertainties are more fully described in our periodic filings with the Securities and Exchange Commission (the “SEC”), including the risk factors described in the section entitled “Risk Factors” in the quarterly and annual reports that we file with the SEC. Any forward-looking statements that we make in this press release speak only as of the date of this press release. Except as required by law, we assume no obligation to update forward-looking statements contained in this press release whether as a result of new information, future events or otherwise, after the date of this press release.

Ocugen
Contact:

Ken Inchausti
Head, Investor Relations & Communications
ken.inchausti@ocugen.com

1-800-Flowers.com (FLWS) – What To Do Now?

Friday, April 29, 2022

1-800-Flowers.com (FLWS)
What To Do Now?

1-800-FLOWERS.COM, Inc. is the leading provider of gourmet and floral gifts for all occasions. For nearly 40 years, 1-800-FLOWERS® has been helping deliver smiles for customers with gifts for every occasion, including fresh flowers, premium, gift-quality fruits, and other gourmet items from Harry & David®, popcorn and specialty treats from The Popcorn Factory®; cookies and baked gifts from Cheryl’s®; premium chocolates and confections from Fannie May®; gift baskets and towers from 1-800-Baskets.com®; premium English muffins and other breakfast treats from Wolferman’s; carved fresh fruit arrangements from FruitBouquets.com; and top quality steaks and chops from Stock Yards®. The Company’s BloomNet® international floral wire service provides a broad range of quality products and value-added services designed to help professional florists grow their businesses profitably.

Michael Kupinski, Director of Research, Noble Capital Markets, Inc.

Patrick McCann, Research Associate, Noble Capital Markets, Inc.

Refer to the full report for the price target, fundamental analysis, and rating.

    Fiscal Q3 miss. The company reported fiscal Q3 2022 revenue of $469.6 million, missing our estimate of $478.8 million by 1.9%. Adj. EBITDA also missed our expectation in the quarter at a seasonal loss of $12 million compared with our forecast of a loss of $8 million.

    Costs challenges.  Gross profit margin was down in all three business segments compared with the prior year period. The sharpest gross margin decline was in the Gourmet Foods & Gift Baskets segment. The decline in company wide gross margins, down over 600 basis points, was due to increased labor costs, higher inbound and outbound shipping costs, and write-offs of inventories …


This Company Sponsored Research is provided by Noble Capital Markets, Inc., a FINRA and S.E.C. registered broker-dealer (B/D).

*Analyst certification and important disclosures included in the full report. NOTE: investment decisions should not be based upon the content of this research summary. Proper due diligence is required before making any investment decision. 


Orion Group Holdings (ORN) – Post Call Commentary and Updated Model

Friday, April 29, 2022

Orion Group Holdings (ORN)
Post Call Commentary and Updated Model

Orion Group Holdings, based in Houston, Texas, is a specialty construction company within the Marine and Industrial Construction sectors, with operations focused in the continental United States and Caribbean. Revenue is split roughly 50/50 between a Marine Construction segment that provides marine facility, pipeline and structural construction services and a Commercial Concrete segment that provides turnkey concrete services in the light commercial and structural construction markets.

Joe Gomes, Senior Research Analyst, Noble Capital Markets, Inc.

Joshua Zoepfel, Research Associate, Noble Capital Markets, Inc.

Refer to the full report for the price target, fundamental analysis, and rating.

    Interim CEO. The key Company development was the appointment of Austin Shanfelter as Interim CEO on April 7th. A member of the Board since 2007, Mr. Shanfelter brings a wealth of experience to the position, including as Chief Executive Officer and President of MasTec from 2001 to 2007.

    Short-term Goals.  Although it is in the early days, among Mr. Shanfelter’s immediate goals is to improve the quality of the backlog, improve utilization of the asset base, and enhance efficiencies to capitalize on industry tailwinds. Given Mr. Shanfelter’s background, we believe he will be successful in implementing the necessary changes to improve Orion’s operating performance …


This Company Sponsored Research is provided by Noble Capital Markets, Inc., a FINRA and S.E.C. registered broker-dealer (B/D).

*Analyst certification and important disclosures included in the full report. NOTE: investment decisions should not be based upon the content of this research summary. Proper due diligence is required before making any investment decision. 


Release – Sierra Metals Announces New High-Grade Zone Discovery at Its Yauricocha Mine in Peru


Sierra Metals Announces New High-Grade Zone Discovery at Its Yauricocha Mine in Peru

Research, News, and Market Data on Sierra Metals


  • Exploration drilling of 8 holes, intercepts high grade sulfide adjacent to existing underground operations at Yauricocha Mine.
  • Drilling demonstrates high grade mineralization potential which continues and remains open above the 1120 level.

TORONTO–(BUSINESS WIRE)– Drill hole highlights include:

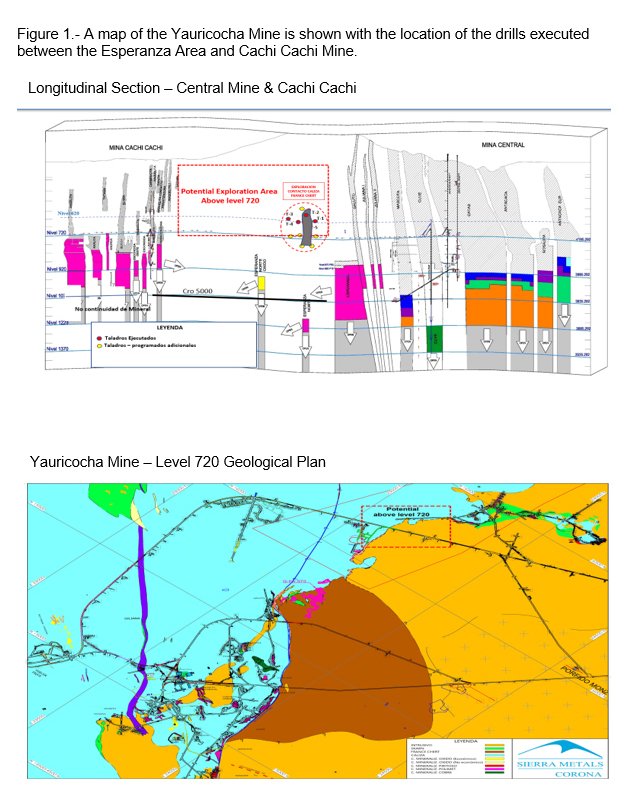
Figure 1.- A map of the Yauricocha Mine is shown with the location of the drills executed between the Esperanza Area and Cachi Cachi Mine. (Graphic: Business Wire)

Figure 1.- A map of the Yauricocha Mine is shown with the location of the drills executed between the Esperanza Area and Cachi Cachi Mine. (Graphic: Business Wire)

Hole

Width
(m)


Cu
(%)


Zn
(%)


CuEq
(%)

ECF 10 22 02

2.85


0.31


12.94


6.39

4.90


0.33


27.22


11.86

ECF 10 22 04

0.55


0.20


12.18


5.89

ECF 10 22 05

4.80


6.41


3.51


9.38

1.40


0.46


20.3


8.89

ECF 10 22 03 A

1.15


0.16


15.15


6.68

ECF 10 22 04 A

2.65


2.06


8.36


6.13

*True widths have not been determined

Sierra Metals Inc. (TSX: SMT) (BVL: SMT) (“Sierra Metals” or “the Company”) is pleased to announce the discovery of a new high grade ore sulfide zone referred to as the “Fortuna” zone, located adjacent to the current mine operations. The discovery comes as part of an ongoing exploration drilling program at the Yauricocha Mine.

To date, 8 holes have been executed from the 720 level of the Yauricocha Mine within the Yauricocha System. These holes have intercepted mineralization containing high-grade Copper, Zinc and Lead zones. These results demonstrate the potential for high grade mineralization within the reported, and surrounding, areas.

Luis Marchese, CEO of Sierra Metals stated: “Today’s results represent significant progress in our efforts to expand Yauricocha’s ore resource within currently permitted levels of the mine. Mining of this readily accessible new high grade zone will increase expected ore grade for the next couple of years. We are working towards accessing part of the orebody as early as Q3 of 2022 which would have a positive impact on head grades in the second half of 2022.”

Alonso Lujan, Vice President, Exploration of Sierra Metals commented: “The reported results from the Fortuna zone, located laterally, between the Esperanza zone and Cachi Cachi Mine demonstrates the continued resource potential within the Yauricocha Mine.” He added, “The high value ore that has been defined suggests that continued exploration in the area is warranted, to better define its potential.”

Table 1.1 Shows the results of the drilling program

Hole Number

From

To

Width**

Ag

Pb

Cu

Zn

Au

CuEq


m

g/t

%

%

%

g/t

%

ECF 10 22 02

397.25

400.10

2.85

72

3.91

0.31

12.94

0.30

6.39


404.65

409.55

4.90

95

5.14

0.33

27.22

0.49

11.86


417.00

418.60

1.60

19

0.50

0.10

3.70

0.16

1.72


418.60

424.70

6.10

20

0.56

0.09

1.77

0.17

1.08


424.70

428.70

4.00

134

0.86

0.42

12.98

0.65

6.52


ECF 10 22 04

396.35

396.90

0.55

52

4.43

0.20

12.18

0.15

5.89


ECF 10 22 05

366.40

371.20

4.80

126

1.76

6.41

3.51

0.58

9.38


376.00

382.00

6.00

25

0.57

0.11

5.36

0.18

2.38


433.50

434.90

1.40

172

0.52

0.46

20.30

0.00

8.89


446.20

449.40

3.20

15

0.43

0.12

1.63

0.00

0.89


ECF 10 22 01 A

132.00

133.00

1.00

12

0.12

0.20

1.09

0.04

0.72


135.00

136.00

1.00

30

0.25

1.14

1.18

0.03

1.86


139.40

148.45

8.95

38

1.52

1.19

6.08

0.45

4.19


ECF 10 22 02 A

138.40

138.75

0.35

21

0.42

0.76

2.49

0.28

2.04


138.75

139.70

0.95

24

0.49

0.95

1.86

0.34

2.09


139.70

140.60

0.90

46

0.54

3.31

1.73

0.68

4.81


141.50

142.35

0.85

22

0.43

0.93

1.79

0.25

1.97


155.20

155.50

0.30

7

0.18

0.06

1.97

0.65

1.22


ECF 10 22 03 A

175.35

176.50

1.15

68

2.31

0.16

15.15

0.44

6.68


ECF 10 22 04 A

132.00

134.00

2.00

36

0.78

0.77

3.51

0.16

2.53


134.00

136.65

2.65

71

1.48

2.06

8.36

0.50

6.13


*Prices Consensus Ag 24.05USD/Oz,Au 1806 USD/Oz,Pb 1.0USD/Lb,Zn 1.47USD/Lb,Cu 4.31USD/Lb

**True widths have not been determined

Method of Analysis

Samples are prepared at the Yauricocha lab facilities at the Chumpe Mill, which is located on site. Drill core samples from the mine are assayed utilizing two procedures. Silver, Lead, Zinc and Copper are assayed by atomic absorption. Gold is fire-assayed with an atomic absorption finish. Diamond drill core samples sent for analysis consist of half NQ size or BQ size drill core which is split on site.

Quality Control

Américo Zuzunaga, FAusIMM CP (Mining Engineer) and Vice President of Corporate Planning, is a Qualified Person under National Instrument 43-101 – Standards of Disclosure for Mineral Projects.

About Sierra Metals

Sierra Metals Inc. is a diversified Canadian mining company with Green Metal exposure including increasing copper production and base metal production with precious metals byproduct credits, focused on the production and development of its Yauricocha Mine in Peru, and Bolivar and Cusi Mines in Mexico. The Company is focused on increasing production volume and growing mineral resources. Sierra Metals has recently had several new key discoveries and still has many more exciting brownfield exploration opportunities at all three Mines in Peru and Mexico that are within close proximity to the existing mines. Additionally, the Company also has large land packages at all three mines with several prospective regional targets providing longer-term exploration upside and mineral resource growth potential.

The Company’s Common Shares trade on the Bolsa de Valores de Lima and on the Toronto Stock Exchange under the symbol “SMT” and on the NYSE American Exchange under the symbol “SMTS”.

For further information regarding Sierra Metals, please visit www.sierrametals.com

Continue to Follow, Like and Watch our progress:

Web: www.sierrametals.com | Twitter: sierrametals | Facebook: SierraMetalsInc | LinkedIn: Sierra Metals Inc | Instagram: sierrametals

Forward-Looking Statements

This press release contains “forward-looking information” and “forward-looking statements” within the meaning of Canadian and U.S. securities laws (collectively, “forward-looking information”). Forward-looking information includes, but is not limited to, statements with respect to the date of the 2020 Shareholders’ Meeting and the anticipated filing of the Compensation Disclosure. Any statements that express or involve discussions with respect to predictions, expectations, beliefs, plans, projections, objectives, assumptions or future events or performance (often, but not always, using words or phrases such as “expects”, “anticipates”, “plans”, “projects”, “estimates”, “assumes”, “intends”, “strategy”, “goals”, “objectives”, “potential” or variations thereof, or stating that certain actions, events or results “may”, “could”, “would”, “might” or “will” be taken, occur or be achieved, or the negative of any of these terms and similar expressions) are not statements of historical fact and may be forward-looking information.

Forward-looking information is subject to a variety of risks and uncertainties, which could cause actual events or results to differ from those reflected in the forward-looking information, including, without limitation, the risks described under the heading “Risk Factors” in the Company’s annual information form dated March 16, 2022 for its fiscal year ended December 31, 2021 and other risks identified in the Company’s filings with Canadian securities regulators and the United States Securities and Exchange Commission, which filings are available at www.sedar.com and www.sec.gov, respectively.

The risk factors referred to above are not an exhaustive list of the factors that may affect any of the Company’s forward-looking information. Forward-looking information includes statements about the future and is inherently uncertain, and the Company’s actual achievements or other future events or conditions may differ materially from those reflected in the forward-looking information due to a variety of risks, uncertainties and other factors. The Company’s statements containing forward-looking information are based on the beliefs, expectations, and opinions of management on the date the statements are made, and the Company does not assume any obligation to update such forward-looking information if circumstances or management’s beliefs, expectations or opinions should change, other than as required by applicable law. For the reasons set forth above, one should not place undue reliance on forward-looking information.

Investor Relations
Sierra Metals Inc.
(416) 366 7777
Email: info@sierrametals.com

J.Alonso Lujan
Vice President, Exploration Sierra Metals Inc.
(51) 630 3100
(52) 614 426 0211

Luis Marchese
President & CEO
Sierra Metals Inc.
(416) 366 7777

Source: Sierra Metals Inc.

Sierra Metals (SMTS)(SMT:CA) – On Track to Meet First Half Production Guidance; New High-Grade Discovery at Yauricocha

Friday, April 29, 2022

Sierra Metals (SMTS)(SMT:CA)
On Track to Meet First Half Production Guidance; New High-Grade Discovery at Yauricocha

As of April 24, 2020, Noble Capital Markets research on Sierra Metals is published under ticker symbols (SMTS and SMT:CA). The price target is in USD and based on ticker symbol SMTS. Research reports dated prior to April 24, 2020 may not follow these guidelines and could account for a variance in the price target.

Sierra Metals Inc is a precious and base metals producer in Latin America. The company acquires, explores, extracts, and produces mineral concentrates consisting of silver, copper, lead, zinc and gold in Mexico and Peru. Its activity includes the operation of the Yauricocha Mine in Peru, and the Bolivar and Cusi mines in Mexico. Yauricocha is an underground polymetallic mine using the sublevel block caving and cut-and-fill mining methods. Bolivar is a copper-silver-zinc-gold underground mine using room-and-pillar mining method. The majority of the revenue is earned by selling of the mineral concentrates to its customers in Peru.

Mark Reichman, Senior Research Analyst of Natural Resources, Noble Capital Markets, Inc.

Refer to the full report for the price target, fundamental analysis, and rating.

    First quarter 2022 production. During the first quarter, Sierra Metals produced 6.3 million pounds of copper, 4.2 million pounds of lead, 10.5 million pounds of zinc, 1.9 thousand ounces of gold, and 734 thousand ounces of silver. Compared with the prior year period, first quarter production of copper, lead, zinc, gold, and silver declined 19.9%, 53.2%, 56.5%, 27.0%, and 23.6%, respectively. On a sequential basis, copper and silver production increased 4.2% and 3.2%, respectively, while lead, zinc, and silver production declined 29.9%, 29.6%, and 8.8%, respectively. In our view, production is on track to reach the company’s first half guidance of 34.0 to 39.5 million copper equivalent pounds.

    Estimates are little changed.  We are maintaining our first quarter and full year EPS estimates of $0.03 and $0.21, respectively. We forecast full year EBITDA of $100.8 million compared to our prior estimate of $100.9 million. Sierra will report first quarter financial results after the market close on May 11 and will host an investor conference call on May 12 at 11:00 am ET …


This Company Sponsored Research is provided by Noble Capital Markets, Inc., a FINRA and S.E.C. registered broker-dealer (B/D).

*Analyst certification and important disclosures included in the full report. NOTE: investment decisions should not be based upon the content of this research summary. Proper due diligence is required before making any investment decision. 


Release – Tonix Pharmaceuticals to Present at the 2022 Q2 Investor Summit


Tonix Pharmaceuticals to Present at the 2022 Q2 Investor Summit

Research, News, and Market Data on Tonix Pharmaceuticals


CHATHAM, N.J., April 28, 2022 (GLOBE NEWSWIRE) — Tonix Pharmaceuticals Holding Corp. (Nasdaq: TNXP), a clinical-stage biopharmaceutical company, announced today that Jessica Morris, Chief Operating Officer of Tonix Pharmaceuticals, will present at the 2022 Q2 Investor Summit on Wednesday, May 4, 2022, at 11:00 a.m. ET at the Westin New York Grand Central, New York, NY.

Investors interested in arranging a meeting with the Company’s management during the conference should contact the Investor Summit conference coordinator. A webcast of the presentation will be available under the IR Events tab of the Tonix website at www.tonixpharma.com.

About Tonix Pharmaceuticals Holding Corp.
Tonix is a clinical-stage biopharmaceutical company focused on discovering, licensing, acquiring and developing therapeutics and diagnostics to treat and prevent human disease and alleviate suffering. Tonix’s portfolio is composed of immunology, rare disease, infectious disease, and central nervous system (CNS) product candidates. Tonix’s immunology portfolio includes biologics to address organ transplant rejection, autoimmunity and cancer, including TNX-1500which is a humanized monoclonal antibody targeting CD40-ligand being developed for the prevention of allograft and xenograft rejection and for the treatment of autoimmune diseases. A Phase 1 study of TNX-1500 is expected to be initiated in the second half of 2022. Tonix’s rare disease portfolio includes TNX-29002 for the treatment of Prader-Willi syndrome. TNX-2900 has been granted Orphan-Drug Designation by the FDA. Tonix’s infectious disease pipeline includes a vaccine in development to prevent smallpox and monkeypox called TNX-8013, next-generation vaccines to prevent COVID-19, and an antiviral to treat COVID-19. Tonix’s lead vaccine candidates for COVID-19 are TNX-1840 and TNX-18504, which are live virus vaccines based on Tonix’s recombinant pox vaccine (RPV) platform. TNX-35005 (sangivamycin, i.v. solution) is a small molecule antiviral drug to treat acute COVID-19 and is in the pre-IND stage of development. TNX-102 SL6, (cyclobenzaprine HCl sublingual tablets), is a small molecule drug being developed to treat Long COVID, a chronic post-acute COVID-19 condition. Tonix expects to initiate a Phase 2 study in Long COVID in the second quarter of 2022. The Company’s CNS portfolio includes both small molecules and biologics to treat pain, neurologic, psychiatric and addiction conditions. Tonix’s lead CNS candidate, TNX-102 SL, is in mid-Phase 3 development for the management of fibromyalgia with a new Phase 3 study launched in the second quarter of 2022. Finally, TNX-13007 is a biologic designed to treat cocaine intoxication that is expected to start a Phase 2 trial in the second quarter of 2022. TNX-1300 has been granted Breakthrough Therapy Designation by the FDA.

1TNX-1500 is an investigational new biologic at the pre-IND stage of development and has not been approved for any indication.
2TNX-2900 is an investigational new drug at the pre-IND stage of development and has not been approved for any indication.
3TNX-801 is an investigational new biologic at the pre-IND stage of development and has not been approved for any indication.
4TNX-1840 and TNX-1850 are investigational new biologics at the pre-IND stage of development and have not been approved for any indication. 
5TNX-3500 is an investigational new drug at the pre-IND stage of development and has not been approved for any indication.
6TNX-102 SL is an investigational new drug and has not been approved for any indication.
7TNX-1300 is an investigational new biologic and has not been approved for any indication.

This press release and further information about Tonix can be found at www.tonixpharma.com.

Forward Looking Statements
Certain statements in this press release are forward-looking within the meaning of the Private Securities Litigation Reform Act of 1995. These statements may be identified by the use of forward-looking words such as “anticipate,” “believe,” “forecast,” “estimate,” “expect,” and “intend,” among others. These forward-looking statements are based on Tonix’s current expectations and actual results could differ materially. There are a number of factors that could cause actual events to differ materially from those indicated by such forward-looking statements. These factors include, but are not limited to, risks related to the failure to obtain FDA clearances or approvals and noncompliance with FDA regulations; delays and uncertainties caused by the global COVID-19 pandemic; risks related to the timing and progress of clinical development of our product candidates; our need for additional financing; uncertainties of patent protection and litigation; uncertainties of government or third party payor reimbursement; limited research and development efforts and dependence upon third parties; and substantial competition. As with any pharmaceutical under development, there are significant risks in the development, regulatory approval and commercialization of new products. Tonix does not undertake an obligation to update or revise any forward-looking statement. Investors should read the risk factors set forth in the Annual Report on Form 10-K for the year ended December 31, 2021, as filed with the Securities and Exchange Commission (the “SEC”) on March 14, 2022, and periodic reports filed with the SEC on or after the date thereof. All of Tonix’s forward-looking statements are expressly qualified by all such risk factors and other cautionary statements. The information set forth herein speaks only as of the date thereof.

Contacts

Jessica Morris (corporate)
Tonix Pharmaceuticals
investor.relations@tonixpharma.com
(862) 799-8599

Olipriya Das, Ph.D. (media)
Russo Partners
Olipriya.Das@russopartnersllc.com
(646) 942-5588

Peter Vozzo (investors)
ICR Westwicke
peter.vozzo@westwicke.com
(443) 213-0505

Source: Tonix Pharmaceuticals Holding Corp.

Digerati Technologies (DTGI) – A Recipe for Accretive M & A

Thursday, April 28, 2022

Digerati Technologies (DTGI)
A Recipe for Accretive M & A

Digerati Technologies, Inc. (OTCQB: DTGI) is a telecom and technology provider of diverse, carrier-grade, Only in the Cloud™ communication and network solutions including Unified Communication as a Service, cloud telephony, cloud WAN, cloud call center, cloud mobile, and delivery of digital oxygen on its fiber/mobile broadband network. Digerati has developed a robust integration platform to fuel mergers and acquisitions in a highly fragmented market as it delivers flexible, cost-effective services with enterprise-grade quality and reliability. A multi-year recipient of Deloitte’s Fast500 and Fast50 Awards for one of the fastest growing technology companies in North America, Digerati has become an expert at successfully merging and managing subsidiary operations since 2015. The Company’s impressive tech-stack serves 28,000 business users on its platform and its dynamic channel program includes over 300 channel partners that serve as a conduit for sales growth. Digerati has continuously increased customer adoption while serving diverse industries including Healthcare, Banking, Financial Services, Legal, Real Estate, and Construction. Digerati currently has a strong platform for growth throughout Texas and Florida, the 2nd and 4th largest state economies by GDP in the U.S. The Company’s clean and clear fundamentals, combined with its clearly defined growth plan, disciplined acquisition strategy and seasoned leadership team is expected to increase shareholder value as it enters the next phase of its corporate development plan. For more information, please visit www.digerati-inc.com.

Michael Kupinski, Director of Research, Noble Capital Markets, Inc.

Patrick McCann, Research Associate, Noble Capital Markets, Inc.

Refer to the full report for the price target, fundamental analysis, and rating.

    Noblecon 18 highlights. CEO, Art Smith, highlighted a number of topics such as: the company’s roll-up strategy, diversified client base, recent acquisitions, and plans to up-list to a major exchange. The full replay of the presentation can be found here.

    Disciplined M&A strategy.  Management employs a disciplined acquisition strategy, including targeting companies on the same technology stack, in order to fast-track the integration process and maximize cost synergies. This results in Digerati typically being able to take companies with EBITDA margins of around 15% and quickly improve those margins to greater than 20% …


This Company Sponsored Research is provided by Noble Capital Markets, Inc., a FINRA and S.E.C. registered broker-dealer (B/D).

*Analyst certification and important disclosures included in the full report. NOTE: investment decisions should not be based upon the content of this research summary. Proper due diligence is required before making any investment decision. 


SPACtrac Report – Forbes Global Media: A Compelling Growth Story

Thursday, April 28, 2021

Forbes Global Media: A Compelling Growth Story

Michael Kupinski, Director of Research, Noble Capital Markets, Inc.

Refer to end of report for Analyst Certification & Disclosures

Noblecon 18 highlights. Forbes CEO, Mike Federle, and CFO, Mike York, presented at Noblecon18, speaking on several topics, such as Forbes recent strong results and outlook for 2022, the impacts of Forbes’ brand elasticity on its growth prospects, how the company plans to leverage its in-house technology stack, a strategic investment from Binance, and when the SPAC merger is likely to close. The full video of the presentation can be found here.

2022 pacing well. Management stated that 2022 is off to a good start and expects a strong year of growth. Our full year 2022 revenue estimate is $290 million, which assumes 12% growth over 2021.

Technological advantages. During the presentation Forbes management stressed the importance of modern media companies having a strong technological foundation. Forbes has such a foundation with its analytics platform, ForbesOne, which gathers over 600 data points per user. This data allows the company to identify audience cohorts to improve content offerings as well as increase the value proposition for advertising partners.

SPAC merger update. The SPAC is expected to close by May 31. Upon the completion of the merger, shares of the SPAC (OPA) will convert to common stock of Forbes Global Media (FRBS).

Attractive valuation. Near current levels, the OPA shares trade at 9.4 times enterprise value to expected 2022 EBITDA and 7.5 times EV to expected 2023 EBITDA. Our price target of $16 represents a 60% premium to near current levels and a target EV/2022 EBITDA multiple of 16.5 times.


GENERAL DISCLAIMERS

All statements or opinions contained herein that include the words “we”, “us”, or “our” are solely the responsibility of Noble Capital Markets, Inc.(“Noble”) and do not necessarily reflect statements or opinions expressed by any person or party affiliated with the company mentioned in this report. Any opinions expressed herein are subject to change without notice. All information provided herein is based on public and non-public information believed to be accurate and reliable, but is not necessarily complete and cannot be guaranteed. No judgment is hereby expressed or should be implied as to the suitability of any security described herein for any specific investor or any specific investment portfolio. The decision to undertake any investment regarding the security mentioned herein should be made by each reader of this publication based on its own appraisal of the implications and risks of such decision.

This publication is intended for information purposes only and shall not constitute an offer to buy/sell or the solicitation of an offer to buy/sell any security mentioned in this report, nor shall there be any sale of the security herein in any state or domicile in which said offer, solicitation or sale would be unlawful prior to registration or qualification under the securities laws of any such state or domicile. This publication and all information, comments, statements or opinions contained or expressed herein are applicable only as of the date of this publication and subject to change without prior notice. Past performance is not indicative of future results.

Noble accepts no liability for loss arising from the use of the material in this report, except that this exclusion of liability does not apply to the extent that such liability arises under specific statutes or regulations applicable to Noble. This report is not to be relied upon as a substitute for the exercising of independent judgement. Noble may have published, and may in the future publish, other research reports that are inconsistent with, and reach different conclusions from, the information provided in this report. Noble is under no obligation to bring to the attention of any recipient of this report, any past or future reports. Investors should only consider this report as single factor in making an investment decision.

IMPORTANT DISCLOSURES

This publication is confidential for the information of the addressee only and may not be reproduced in whole or in part, copies circulated, or discussed to another party, without the written consent of Noble Capital Markets, Inc. (“Noble”). Noble seeks to update its research as appropriate, but may be unable to do so based upon various regulatory constraints. Research reports are not published at regular intervals; publication times and dates are based upon the analyst’s judgement. Noble professionals including traders, salespeople and investment bankers may provide written or oral market commentary, or discuss trading strategies to Noble clients and the Noble proprietary trading desk that reflect opinions that are contrary to the opinions expressed in this research report.

The majority of companies that Noble follows are emerging growth companies. Securities in these companies involve a higher degree of risk and more volatility than the securities of more established companies. The securities discussed in Noble research reports may not be suitable for some investors and as such, investors must take extra care and make their own determination of the appropriateness of an investment based upon risk tolerance, investment objectives and financial status.

Company Specific Disclosures

The following disclosures relate to relationships between Noble and the company (the “Company”) covered by the Noble Research Division and referred to in this research report.

Company Specific Disclosures

The following disclosures relate to relationships between Noble and the company (the “Company”) covered by the Noble Research Division and referred to in this research report.

The SPAC Company in this report is a participant in the Company Sponsored Research Program (CSRP); Noble receives compensation from the Company for such participation. No part of the CSRP compensation was, is, or will be directly or indirectly related to any specific recommendations or views expressed by the analyst in this research report.

Noble is not a market maker in any of the companies mentioned in this report. Noble intends to seek compensation for investment banking services and non-investment banking services (securities and non-securities related) with any or all of the companies mentioned in this report within the next 3 months

ANALYST CREDENTIALS, PROFESSIONAL DESIGNATIONS, AND EXPERIENCE

Director of Research. Senior Equity Analyst specializing in Media & Entertainment. 34 years of experience as an analyst. Member of the National Cable Television Society Foundation and the National Association of Broadcasters. BS in Management Science, Computer Science Certificate and MBA specializing in Finance from St. Louis University.
Named WSJ ‘Best on the Street’ Analyst six times.
FINRA licenses 7, 24, 66, 86, 87

WARNING

This report is intended to provide general securities advice, and does not purport to make any recommendation that any securities transaction is appropriate for any recipient particular investment objectives, financial situation or particular needs. Prior to making any investment decision, recipients should assess, or seek advice from their advisors, on whether any relevant part of this report is appropriate to their individual circumstances. If a recipient was referred to Noble Capital Markets, Inc. by an investment advisor, that advisor may receive a benefit in respect of transactions effected on the recipients behalf, details of which will be available on request in regard to a transaction that involves a personalized securities recommendation. Additional risks associated with the security mentioned in this report that might impede achievement of the target can be found in its initial report issued by Noble Capital Markets, Inc.. This report may not be reproduced, distributed or published for any purpose unless authorized by Noble Capital Markets, Inc.

RESEARCH ANALYST CERTIFICATION

Independence Of View
All views expressed in this report accurately reflect my personal views about the subject securities or issuers.

Receipt of Compensation
No part of my compensation was, is, or will be directly or indirectly related to any specific recommendations or views expressed in the public
appearance and/or research report.

Ownership and Material Conflicts of Interest
Neither I nor anybody in my household has a financial interest in the securities of the subject company or any other company mentioned in this report.

NOBLE RATINGS DEFINITIONS % OF SECURITIES COVERED % IB CLIENTS
Outperform: potential return is >15% above the current price 99% 28%
Market Perform: potential return is -15% to 15% of the current price 6% 3%
Underperform: potential return is >15% below the current price 0% 0%

NOTE: On August 20, 2018, Noble Capital Markets, Inc. changed the terminology of its ratings (as shown above) from “Buy” to “Outperform”, from “Hold” to “Market Perform” and from “Sell” to “Underperform.” The percentage relationships, as compared to current price (definitions), have remained the same.

Additional information is available upon request. Any recipient of this report that wishes further information regarding the subject company or the disclosure information mentioned herein, should contact Noble Capital Markets, Inc. by mail or phone.

Noble Capital Markets, Inc.
150 East Palmetto Park Rd., Suite 110
Boca Raton, FL 33432
561-994-1191

Noble Capital Markets, Inc. is a FINRA (Financial Industry Regulatory Authority) registered broker/dealer.
Noble Capital Markets, Inc. is an MSRB (Municipal Securities Rulemaking Board) registered broker/dealer.
Member – SIPC (Securities Investor Protection Corporation)

Report ID: 24770

What is the VIX?


What Does it Mean When the VIX (Fear Index) is Rising or Falling?


Volatility is how fast stock market prices change.

The VIX, or CBOE Volatility Index is designed to be a live mathematically-based representation of expectations for stock market volatility over the next 30 days. Some investors use the VIX to measure the level of risk, fear, and/or stress in the market when making investment decisions. In general, true traders prefer high volatility, whereas ost investors prefer more predictability.

Traders can also speculate on the direction of the VIX using a variety of options and exchange-traded products.


What Does the VIX Signal?

The VIX is designed to signal the level of fear or stress in the S&P 500. This is why it’s often called the “Fear Index.”  When the VIX level is rising, it is said that market related fear is rising. A level above 30 indicates a very high level of uncertainty and fear. VIX values below 20 generally point to stable, stress-free periods in the markets.


Where Does it Come From?

The index is derived from the prices of SPX index options with near-term expiration dates, from these short options there is a calculated 30-day forward projection of volatility. Volatility is seen as a way to gauge market sentiment, and in particular, the degree of fear among market participants.

The index was created by the Chicago Board Options Exchange (CBOE) and is maintained by CBOE Global Markets. It is an important index in the world of trading and investment because it provides a quantifiable measure of market risk and investors’ sentiments.


VIX vs. S&P 500 Price

Volatility value, investors’ fear, and VIX values all move up when the market is falling. The reverse is true when the market advances – the index values, fear, and volatility decline.

The price action of the S&P 500 and the VIX often shows inverse price action: when the S&P falls sharply, the VIX rises—and vice-versa.


How to Trade the VIX

The VIX has paved the way for using volatility as a tradable asset, albeit through derivative products. Cboe launched the first VIX-based exchange-traded futures contract in March 2004, followed by the launch of VIX options in February 2006.1


Suggested Reading


What is a Tender Offer?


What is Fed Tightening?


Stay up to date. Follow us: