Are Economic Excesses Creating Investment Opportunity


Image Credit: Monstera (Pexels)


Tilt Confidently – A Perspective on Financial Markets and the Economy


Tilt Confidently

Economic excesses often create potential investment opportunities. When a key economic factor reaches a ridiculous level, it frequently proves profitable to expect a reversal: Recall the 10-year bond yield at 0.5% in mid-2020 (those who tilted investment bets toward rising-yield beneficiaries have since profited)—or the early-1981 extreme of 16%? Another example was 1995, when the U.S. dollar spiked to levels never seen before—nor since. In the 1990s, the labor participation rate peaked near 68% after having never risen above 60% prior to 1970. And, in the mid-1990s, following a decline of nearly 20% from its 1973 post-war high, the real-wage rate finally bottomed.

Although short-term timing on any economic trend is always a challenge, when something gets severely out of bounds, the favored odds are that it is apt to soon adjust. Today, there are several matters that could be considered remarkably out of the norm, including economic policies, inflation, various commodity prices, and geopolitical turmoil. However, in our view, the greatest economic extreme, at this time, is “confidence.”
 

Extreme Main-Street Pessimism?

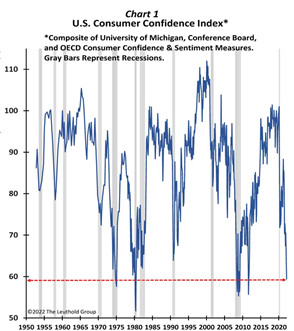
Chart 1 shows a measure of U.S. consumer confidence from the 1950s to date. At present, confidence is lower than 98.5% of the time since 1952! Obviously, pessimism is at an extreme—there have been only a handful of readings as low as today. But what makes this extraordinarily uncommon is, for the last two years, confidence has plummeted while stocks have been in a strong bull market driven by a robust economic recovery. Yes, inflation is currently very high, and there is a war in Ukraine. All the same, inflation was even higher, for longer, in the 1970s when the Vietnam War was ongoing, and, yet, outside of recessions, consumer confidence sustained at much higher levels.

Nearly every significant decay in confidence occurred when the U.S. was in a recession. While an imminent recession is always possible, the likelihood that the U.S. is now in a recession—or even headed for one this year—seems rather remote. Outside of recessions, there was only one other time that confidence was as low as it is today: After a solid recovery in confidence at the start of the 2009 expansion, there was a brief confidence breakdown in mid-2011. Then, renewed fears that the expansion would fail is probably why confidence again declined. Those fears, however, proved unfounded; confidence quickly revived and embarked on a multi-year advance until the 2020 pandemic.

Is confidence about the contemporary expansion following a similar path? It bounced from about 70 to 90 during the first year of this recovery, but since last April, it has again collapsed (like in 2011). Despite strong economic growth and the S&P 500 within 5% of its all-time high, Main Street confidence remains depressed due to a combination of Federal Reserve and interest-rate fears, the highest inflation rate in decades, and Putin’s war.

In our view, even if some or all of these fears continue to fester, confidence will not likely fall much further. Indeed, it would truly be “extreme” if it did. Rather, some of the current nightmares facing the recovery will probably turn out better than feared, causing Main Street sentiment to soon lift, as it did after its 2011 break- down.

According to a Bloomberg survey of private-sector economists, the consensus for U.S. real-GDP growth in 2022 is a robust 3.5%. With Main Street characterized by excessive pessimism and solid real growth, in our view, an opportunity exists for investors to exploit the likelihood that confidence is poised to rise.

Portfolio Tilts For “Rising Confidence?”

Confidence as subdued as today’s is reminiscent of being in a recession that is nearing the start of a new economic expansion. Consequently, many of the investment options highlighted here are typically favored in the infancy of a new economic expansion. It is very odd for conviction to be so low when starting the third year of a recovery.

Nonetheless, if confidence does perk up from today’s extraordinarily low level—whether it is the start of a new expansion or the third year of an ongoing recovery—greater enthusiasm will likely run through both the economy and the stock market in a fashion similar to how it has traditionally done in a fresh recovery.

The following charts illustrate six distinct investments whose relative performance corresponds closely with consumer confidence. Investors may want to consider some of these as possible portfolio tilts.


1. Cyclicals Need Some Confidence!

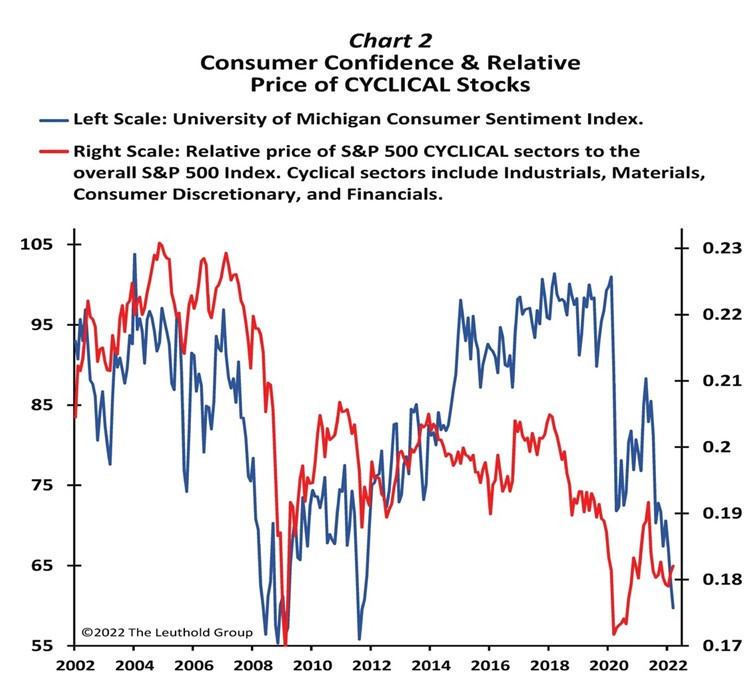
Chart 2 overlays the relative return of the S&P 500’s major cyclical sectors with the Consumer Confidence Index. At least since 2002, there has been a close relationship between cyclical stock leadership and Main Street confidence. Indeed, cyclicals led after the March 2020 bear-market bottom until May 2021, when confidence rolled over. Could cyclical stocks be nearing a “mini-replay” of 2020, driven by a renewed spike in consumer confidence?


2. Low Quality?

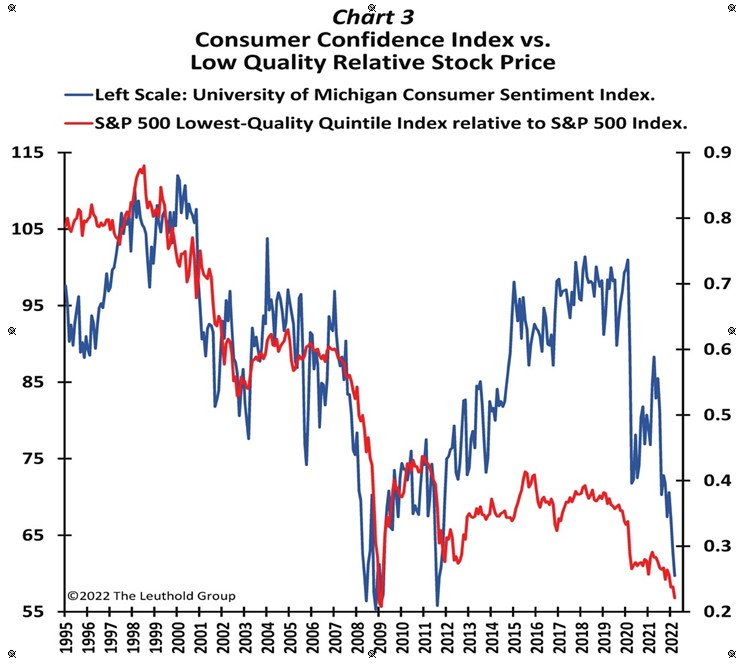
With the S&P 500 Index still trying to recover from a recent correction, and yields rising at an aggressive pace, most are advocating to boost the “quality” in portfolios. However, as illustrated in Chart 3, not only is the relative price of low-quality stocks nearly the same today as at the bottom of the 2009 bear market, but a trend of improved confidence could prompt a period of leadership for low-quality stocks.


3. High-Beta’s Run To Continue?

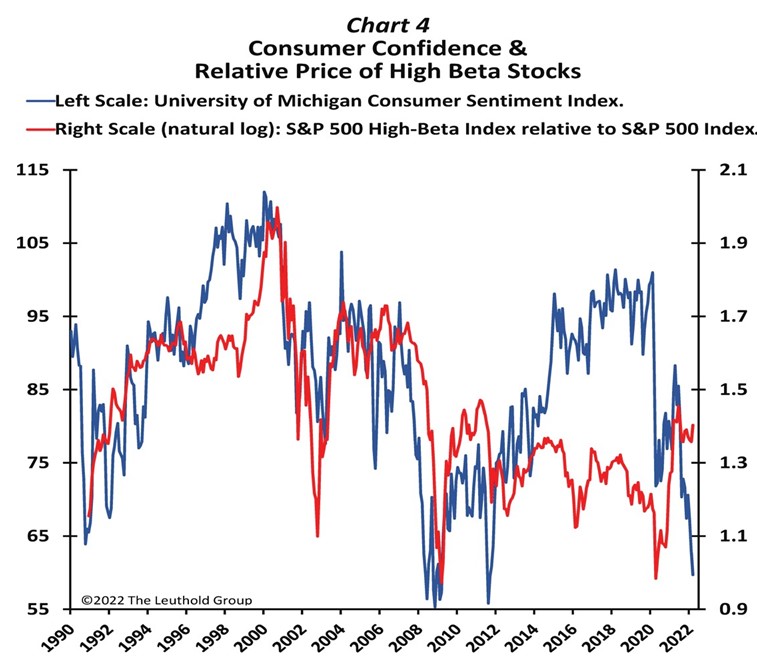
High-beta stocks have led the stock market throughout most of this bull run (Chart 4) and may continue to be superior investments should Main Street confidence finally improve. Most recently, after confidence peaked last May, high-beta has slightly underperformed but has not suffered as aggressively as other confidence-sensitive investments. Nevertheless, since at least 1990, it has paid to be overweight high-beta stocks during periods of improving confidence.


4. An IPO Leadership Replay?

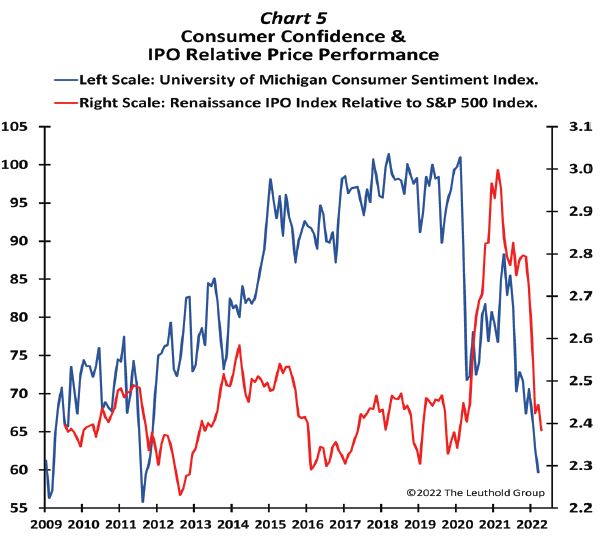
IPOs and SPACs had a massive run earlier in this bull market, followed by an epic collapse (Chart 5). The pattern is similar to the surge and plunge of Main Street confidence. While far from a perfect relationship, since at least 2009, when confidence improved, IPOs directionally outpaced. Likewise, periods of rising pessimism on Main Street have been associated with underperforming IPOs. Many perceive the IPO run as a speculative frenzy that has now been left for dead. Is it possible, though, if confidence again turns up, IPOs could have another “curtain call” in the balance of this bull market?


5. Smaller Cap For A Confidence Run!

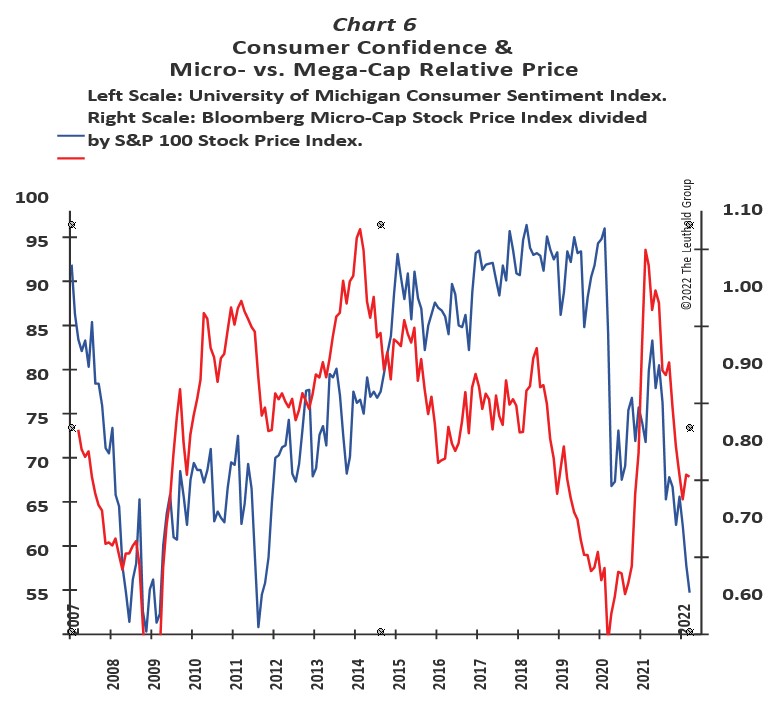
Not surprisingly, as illustrated by Chart 6, smaller-cap stocks do best when consumer confidence rises. The blue line represents the price return of micro-cap stocks relative to mega-caps. The notable periods when consumer confidence surged (2009, 2011, and 2020) were all associated with solid leadership by microcap stocks. As confidence collapsed over the last year, versus the largest stocks, micro caps have relinquished about two-thirds of their cumulative outperformance since this bull market began in March 2020. If consumer confidence is poised for another revival, it may be time to tilt away from your mega-cap winners toward smaller stocks!


6. Tilting Toward EM Debt?

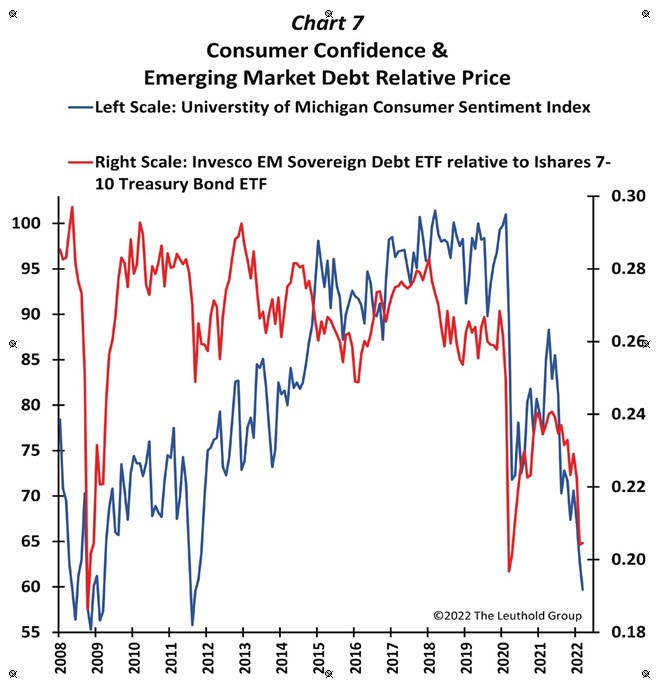
It is not obvious why EM debt tends to outpace when U.S. consumers are confident. As shown in Chart 7, since 2008, EM debt has significantly rewarded investors whenever Main Street sentiment was improving. Currently, the price of EM debt relative to Treasuries is nearly as low as it was at the stock-market bottoms of 2009 and 2020. It is not a coincidence these were periods when consumer confidence had also declined substantially. This chart is a good reminder that if Main Street confidence does soon improve, investors may need to adjust exposure to bonds as well as stocks.


Final Comments


Consumer confidence is now as low—or lower— than it has been in any recession in the post-war era. Considering that economic growth looks healthy and the stock market is near record highs, today’s excessive level of Main Street pessimism is odd.

Understandably, many investments that typically do poorly as pessimism rises have been severe underperformers in the last year. Even if a recession is imminent, neither consumer confidence nor sentiment-sensitive investments are likely to do much worse because both are already priced for a recession. But should today’s economic fears prove overblown, Main Street confidence is likely headed for a substantial recovery that should boost the relative results of a number of investments, including cyclicals, low-quality, high-beta, IPOs, small caps, and EM debt.

If you, too, believe there is simply too much pessimism today, get your shopping list ready and “Tilt Confidently.”


The above was reprinted with permission from Paulsen’s Perspective an institutional newsletter published by THE LEUTHOLD GROUP.

Authored by James W Paulsen, Ph.D.  Chief Investment Strategist of The Leuthold Group, LLC. Jim is a member of the investment committee, authors market and economic commentary, and works with the Leuthold investment team in serving institutional, financial advisor, and investment professional clients.

The Leuthold Group has been producing original analysis for the institutional marketplace for nearly half a century. Driven by the research, its investment management arm is centered on tactical asset allocation and disciplined quantitative methodologies.


Stay up to date. Follow us:


QuoteMedia Announces 22% Revenue Growth for 2021


QuoteMedia Announces 22% Revenue Growth for 2021

Research, News, and Market Data on QuoteMedia


PHOENIX, March 30, 2022 (GLOBE NEWSWIRE) — QuoteMedia, Inc. (OTCQB: QMCI), a leading provider of market data and financial applications, announced financial results for the fiscal year ended December 31, 2021.

QuoteMedia provides banks, brokerage firms, private equity firms, financial planners and sophisticated investors with a more economical, higher quality alternative source of stock market data and related research information. We compete with several larger legacy organizations and a modest community of other smaller companies.  QuoteMedia provides comprehensive market data services, including streaming data feeds, on-demand request-based data (XML/JSON), web content solutions (financial content for website integration) and applications such as Quotestream Professional desktop and mobile.

Highlights for fiscal 2021 include the following:

  • Annual revenue increased to $15,174,372 in 2021 from $12,402,224 in 2020, an increase of $2,772,148 (22%).
  • Net income for 2021 was $212,372 compared to a net loss of $646,324 in 2020, an improvement in profitability of $858,696.
  • Adjusted EBITDA for 2021 was $1,649,679 compared to $734,068 in 2020, an improvement of $915,611.

“This was an enormously successful year for QuoteMedia, and we are very pleased with our results,” said Robert J. Thompson, Chairman of the Board. “We experienced strong growth across virtually every success metric, including revenue growth, profitability and market share; and we also grew and improved our product lines, data coverage and infrastructure. We are even more excited about the year to come, as we expect to maintain this momentum and improve upon the results we achieved in 2022.

“2022 has started on a positive footing. QuoteMedia entered into preliminary agreements with two large multinational financial institutions to start a range of services while definitive multi-year agreements are being finalized. Based on those new contracts and our other clients currently under contract, we expect our revenue growth in fiscal 2022 to be comparable to the 22% annual revenue growth rate we achieved in 2021; and we expect to significantly improve upon the $212,372 net income figure reported in 2021.

“Additionally, because of the efforts and investments we made to improve our infrastructure, security, and business continuity management over the last year, we anticipate achieving our SOC2 Type II certification in the coming months. SOC2 certification provides independent assurance that an organization maintains a high level of information security, data integrity and business resiliency. This certification will allow QuoteMedia to make even greater gains in market share, as it is increasingly becoming a requirement for those providing services to large financial institutions.

“2021 was a very good year for QuoteMedia, and 2022 looks like it may be even better.”

QuoteMedia will host a conference call Wednesday, March 30, 2022 at 2:00 PM Eastern Time to discuss the 2021 financial results and provide a business update.

Conference Call Details:

Date: March 30, 2022

Time: 2:00 PM Eastern

Dial-in number: 866-831-8713

Conference ID: QUOTEMEDIA

An audio rebroadcast of the call will be available later at: www.quotemedia.com

About QuoteMedia

QuoteMedia is a leading software developer and cloud-based syndicator of financial market information and streaming financial data solutions to media, corporations, online brokerages, and financial services companies. The Company licenses interactive stock research tools such as streaming real-time quotes, market research, news, charting, option chains, filings, corporate financials, insider reports, market indices, portfolio management systems, and data feeds. QuoteMedia provides industry leading market data solutions and financial services for companies such as the Nasdaq Stock Exchange, TMX Group (TSX Stock Exchange), Canadian Securities Exchange (CSE), London Stock Exchange Group, FIS, U.S. Bank, Broadridge Financial Systems, JPMorgan Chase, CI Financial, Canaccord Genuity Corp., Hilltop Securities, HD Vest, Stockhouse, Zacks Investment Research, General Electric, Boeing, Bombardier, Telus International, Business Wire, PR Newswire, FolioFN, Regal Securities, ChoiceTrade, Cetera Financial Group, Dynamic Trend, Inc., Qtrade Financial, CNW Group, IA Private Wealth, Ally Invest, Inc., Suncor, Virtual Brokers, Leede Jones Gable, Firstrade Securities, Charles Schwab, First Financial, Cirano, Equisolve, Stock-Trak, Mergent, Cision, Day Trade Dash and others. Quotestream®, QModTM and Quotestream ConnectTM are trademarks of QuoteMedia. For more information, please visit www.quotemedia.com .

Statements about QuoteMedia’s future expectations, including future revenue, earnings, and transactions, as well as all other statements in this press release other than historical facts are “forward-looking statements” within the meaning of the Private Securities Litigation Reform Act of 1995. QuoteMedia intends that such forward-looking statements be subject to the safe harbors created thereby. These statements involve risks and uncertainties that are identified from time to time in the Company’s SEC reports and filings and are subject to change at any time. QuoteMedia’s actual results and other corporate developments could differ materially from that which has been anticipated in such statements.

Below are the specific forward-looking statements included in this press release:

  • Based on those new contracts and our other clients currently under contract, we expect our revenue growth in fiscal 2022 to be comparable to the 22% annual revenue growth rate we achieved in 2021; and we expect to significantly improve upon the $212,372 net income figure reported in 2021.
  • Additionally, because of the efforts and investments we made to improve our infrastructure, security, and business continuity management over the last year, we anticipate achieving our SOC2 Type II certification in the coming months. SOC2 certification provides independent assurance that an organization maintains a high level of information security, data integrity and business resiliency. This certification will allow QuoteMedia to make even greater gains in market share, as it is increasingly becoming a requirement for those providing services to large financial institutions.
  • 2021 was a very good year for QuoteMedia, and 2022 looks like it may be even better.

QuoteMedia Investor Relations
Brendan Hopkins
Email: investors@quotemedia.com
Call: (407) 645-5295

Note 1 on Non-GAAP Financial Measures

We believe that Adjusted EBITDA, as a non-GAAP pro forma financial measure, provides meaningful information to investors in terms of enhancing their understanding of our operating performance and results, as it allows investors to more easily compare our financial performance on a consistent basis compared to the prior year periods. This non-GAAP financial measure also corresponds with the way we expect investment analysts to evaluate and compare our results. Any non-GAAP pro forma financial measures should be considered only as supplements to, and not as substitutes for or in isolation from, or superior to, our other measures of financial information prepared in accordance with GAAP, such as net income attributable to QuoteMedia, Inc.

We define and calculate Adjusted EBITDA as net income attributable to QuoteMedia, Inc., plus: 1) depreciation and amortization, 2) stock compensation expense, 3) interest expense, 4) foreign exchange loss (or minus a foreign exchange gain), and 5) income tax expense. We disclose Adjusted EBITDA because we believe it is a useful metric by which to compare the performance of our business from period to period. We understand that measures similar to Adjusted EBITDA are broadly used by analysts, rating agencies, investors and financial institutions in assessing our performance. Accordingly, we believe that the presentation of Adjusted EBITDA provides useful information to investors. The table below provides a reconciliation of Adjusted EBITDA to net income attributable to QuoteMedia, Inc., the most directly comparable GAAP financial measure.

QuoteMedia, Inc. Adjusted EBITDA Reconciliation to Net Loss

2021 2020
Net income (loss) $ 212,372 $ (646,324 )
Depreciation and amortization 1,640,245 1,331,910
Stock-based compensation 31,876 37,872
Interest expense 2,641 4,582
Foreign exchange loss (107,382 ) 3,791
Income tax expense 3,184 2,237
PPP loan forgiveness (133,257 )
Adjusted EBITDA $ 1,649,679 $ 734,068

Release – QuoteMedia Announces 22 Revenue Growth for 2021


QuoteMedia Announces 22% Revenue Growth for 2021

Research, News, and Market Data on QuoteMedia


PHOENIX, March 30, 2022 (GLOBE NEWSWIRE) — QuoteMedia, Inc. (OTCQB: QMCI), a leading provider of market data and financial applications, announced financial results for the fiscal year ended December 31, 2021.

QuoteMedia provides banks, brokerage firms, private equity firms, financial planners and sophisticated investors with a more economical, higher quality alternative source of stock market data and related research information. We compete with several larger legacy organizations and a modest community of other smaller companies.  QuoteMedia provides comprehensive market data services, including streaming data feeds, on-demand request-based data (XML/JSON), web content solutions (financial content for website integration) and applications such as Quotestream Professional desktop and mobile.

Highlights for fiscal 2021 include the following:

  • Annual revenue increased to $15,174,372 in 2021 from $12,402,224 in 2020, an increase of $2,772,148 (22%).
  • Net income for 2021 was $212,372 compared to a net loss of $646,324 in 2020, an improvement in profitability of $858,696.
  • Adjusted EBITDA for 2021 was $1,649,679 compared to $734,068 in 2020, an improvement of $915,611.

“This was an enormously successful year for QuoteMedia, and we are very pleased with our results,” said Robert J. Thompson, Chairman of the Board. “We experienced strong growth across virtually every success metric, including revenue growth, profitability and market share; and we also grew and improved our product lines, data coverage and infrastructure. We are even more excited about the year to come, as we expect to maintain this momentum and improve upon the results we achieved in 2022.

“2022 has started on a positive footing. QuoteMedia entered into preliminary agreements with two large multinational financial institutions to start a range of services while definitive multi-year agreements are being finalized. Based on those new contracts and our other clients currently under contract, we expect our revenue growth in fiscal 2022 to be comparable to the 22% annual revenue growth rate we achieved in 2021; and we expect to significantly improve upon the $212,372 net income figure reported in 2021.

“Additionally, because of the efforts and investments we made to improve our infrastructure, security, and business continuity management over the last year, we anticipate achieving our SOC2 Type II certification in the coming months. SOC2 certification provides independent assurance that an organization maintains a high level of information security, data integrity and business resiliency. This certification will allow QuoteMedia to make even greater gains in market share, as it is increasingly becoming a requirement for those providing services to large financial institutions.

“2021 was a very good year for QuoteMedia, and 2022 looks like it may be even better.”

QuoteMedia will host a conference call Wednesday, March 30, 2022 at 2:00 PM Eastern Time to discuss the 2021 financial results and provide a business update.

Conference Call Details:

Date: March 30, 2022

Time: 2:00 PM Eastern

Dial-in number: 866-831-8713

Conference ID: QUOTEMEDIA

An audio rebroadcast of the call will be available later at: www.quotemedia.com

About QuoteMedia

QuoteMedia is a leading software developer and cloud-based syndicator of financial market information and streaming financial data solutions to media, corporations, online brokerages, and financial services companies. The Company licenses interactive stock research tools such as streaming real-time quotes, market research, news, charting, option chains, filings, corporate financials, insider reports, market indices, portfolio management systems, and data feeds. QuoteMedia provides industry leading market data solutions and financial services for companies such as the Nasdaq Stock Exchange, TMX Group (TSX Stock Exchange), Canadian Securities Exchange (CSE), London Stock Exchange Group, FIS, U.S. Bank, Broadridge Financial Systems, JPMorgan Chase, CI Financial, Canaccord Genuity Corp., Hilltop Securities, HD Vest, Stockhouse, Zacks Investment Research, General Electric, Boeing, Bombardier, Telus International, Business Wire, PR Newswire, FolioFN, Regal Securities, ChoiceTrade, Cetera Financial Group, Dynamic Trend, Inc., Qtrade Financial, CNW Group, IA Private Wealth, Ally Invest, Inc., Suncor, Virtual Brokers, Leede Jones Gable, Firstrade Securities, Charles Schwab, First Financial, Cirano, Equisolve, Stock-Trak, Mergent, Cision, Day Trade Dash and others. Quotestream®, QModTM and Quotestream ConnectTM are trademarks of QuoteMedia. For more information, please visit www.quotemedia.com .

Statements about QuoteMedia’s future expectations, including future revenue, earnings, and transactions, as well as all other statements in this press release other than historical facts are “forward-looking statements” within the meaning of the Private Securities Litigation Reform Act of 1995. QuoteMedia intends that such forward-looking statements be subject to the safe harbors created thereby. These statements involve risks and uncertainties that are identified from time to time in the Company’s SEC reports and filings and are subject to change at any time. QuoteMedia’s actual results and other corporate developments could differ materially from that which has been anticipated in such statements.

Below are the specific forward-looking statements included in this press release:

  • Based on those new contracts and our other clients currently under contract, we expect our revenue growth in fiscal 2022 to be comparable to the 22% annual revenue growth rate we achieved in 2021; and we expect to significantly improve upon the $212,372 net income figure reported in 2021.
  • Additionally, because of the efforts and investments we made to improve our infrastructure, security, and business continuity management over the last year, we anticipate achieving our SOC2 Type II certification in the coming months. SOC2 certification provides independent assurance that an organization maintains a high level of information security, data integrity and business resiliency. This certification will allow QuoteMedia to make even greater gains in market share, as it is increasingly becoming a requirement for those providing services to large financial institutions.
  • 2021 was a very good year for QuoteMedia, and 2022 looks like it may be even better.

QuoteMedia Investor Relations
Brendan Hopkins
Email: investors@quotemedia.com
Call: (407) 645-5295

Note 1 on Non-GAAP Financial Measures

We believe that Adjusted EBITDA, as a non-GAAP pro forma financial measure, provides meaningful information to investors in terms of enhancing their understanding of our operating performance and results, as it allows investors to more easily compare our financial performance on a consistent basis compared to the prior year periods. This non-GAAP financial measure also corresponds with the way we expect investment analysts to evaluate and compare our results. Any non-GAAP pro forma financial measures should be considered only as supplements to, and not as substitutes for or in isolation from, or superior to, our other measures of financial information prepared in accordance with GAAP, such as net income attributable to QuoteMedia, Inc.

We define and calculate Adjusted EBITDA as net income attributable to QuoteMedia, Inc., plus: 1) depreciation and amortization, 2) stock compensation expense, 3) interest expense, 4) foreign exchange loss (or minus a foreign exchange gain), and 5) income tax expense. We disclose Adjusted EBITDA because we believe it is a useful metric by which to compare the performance of our business from period to period. We understand that measures similar to Adjusted EBITDA are broadly used by analysts, rating agencies, investors and financial institutions in assessing our performance. Accordingly, we believe that the presentation of Adjusted EBITDA provides useful information to investors. The table below provides a reconciliation of Adjusted EBITDA to net income attributable to QuoteMedia, Inc., the most directly comparable GAAP financial measure.

QuoteMedia, Inc. Adjusted EBITDA Reconciliation to Net Loss

2021 2020
Net income (loss) $ 212,372 $ (646,324 )
Depreciation and amortization 1,640,245 1,331,910
Stock-based compensation 31,876 37,872
Interest expense 2,641 4,582
Foreign exchange loss (107,382 ) 3,791
Income tax expense 3,184 2,237
PPP loan forgiveness (133,257 )
Adjusted EBITDA $ 1,649,679 $ 734,068

What is a Stock Split


Why Stocks Split and the Possible Impact to Investors


Reason for a Company to Split its Stock

When stocks split, it is most often a decision by the company to lower its trading price range to a level small enough to attract more investors and enhance the liquidity of trading in its shares.

Variations of Splits

A company’s board of directors may decide to split the stock by any ratio. For example, the most common is 2:1 (the stockholder receives two shares for each one they own), but 3:1, even 5:1 is not uncommon. In a 2:1 split there will be double the amount of shares trading, the price per share will approximate half of what it was before the split.

Impact to Market Cap

Market capitalization is calculated by multiplying the total number of shares outstanding by the price per share. For example, if XYZ Corp. has 10 million shares outstanding and the shares are trading at $20 Its market cap will be 200 million. If the company’s board of directors decides to split the stock 2:1 the number of shares outstanding would double to 20 million, while the share price would be roughly halved to $10.

Reasons for a Stock Split

The decision to go through the administrative expense is usually based on one or two of the following:

First, stocks traditionally traded in “round-lots” of 100 and multiples of 100. Companies often decide on a split when the stock price has reached a level where it is preventing those that the company would most likely want as owners from investing in round-lots.  

Second, the lower priced, higher number of shares outstanding can result in greater liquidity for the stock. This is because it facilitates transactions and could narrow the spread between bid and offer.

Increased liquidity helps owners large and small find buyers when they are looking to sell, and sellers when they are looking to buy. With high liquidity, a large number of shares can be traded without much impact on price levels. While this is positive for all who transact in the shares, companies that may look to repurchase their shares also don’t have as much concern about escalating the price they’re paying. Management can also exercise their ability to sell large amounts they may have acquired as part of their compensation without causing the price to plummet.

Stock Price

While a split, in theory, should have no effect on a stock’s price, it often results in renewed investor interest, which can have a positive effect. Stock splits by large heavily traded companies are often bullish for their market capitalization numbers, and positive for investors.

When You Own Shares

When a stock you own splits, shareholders of record are credited with their additional shares. For instance, in a 2:1 stock split, if you owned 100 shares that were trading at $20 just before the split, you would then own 200 shares at about $10 each. Your broker would handle this automatically, so there is nothing you need to do.

Will a Stock Split Affect My Taxes?

No. The cost basis of each share owned after the stock split will be half of what it was before the split for tax purposes.


Are Stock Splits Good or Bad?

Stock splits are usually done when the share price has risen so high that it might reduce trading. This means investors were driving the company valuation higher. So splits often happen in healthy growing companies. Plus, a stock that has just split may see an uptick in interest as it attracts new investors at the lower price tag per share.


Suggested Reading


What is Fed Tightening?


What is the Yield Curve?


Stay up to date. Follow us:


Are Economic Excesses Creating Investment Opportunity?


Image Credit: Monstera (Pexels)


Tilt Confidently – A Perspective on Financial Markets and the Economy


Tilt Confidently

Economic excesses often create potential investment opportunities. When a key economic factor reaches a ridiculous level, it frequently proves profitable to expect a reversal: Recall the 10-year bond yield at 0.5% in mid-2020 (those who tilted investment bets toward rising-yield beneficiaries have since profited)—or the early-1981 extreme of 16%? Another example was 1995, when the U.S. dollar spiked to levels never seen before—nor since. In the 1990s, the labor participation rate peaked near 68% after having never risen above 60% prior to 1970. And, in the mid-1990s, following a decline of nearly 20% from its 1973 post-war high, the real-wage rate finally bottomed.

Although short-term timing on any economic trend is always a challenge, when something gets severely out of bounds, the favored odds are that it is apt to soon adjust. Today, there are several matters that could be considered remarkably out of the norm, including economic policies, inflation, various commodity prices, and geopolitical turmoil. However, in our view, the greatest economic extreme, at this time, is “confidence.”


Extreme Main-Street Pessimism?

Chart 1 shows a measure of U.S. consumer confidence from the 1950s to date. At present, confidence is lower than 98.5% of the time since 1952! Obviously, pessimism is at an extreme—there have been only a handful of readings as low as today. But what makes this extraordinarily uncommon is, for the last two years, confidence has plummeted while stocks have been in a strong bull market driven by a robust economic recovery. Yes, inflation is currently very high, and there is a war in Ukraine. All the same, inflation was even higher, for longer, in the 1970s when the Vietnam War was ongoing, and, yet, outside of recessions, consumer confidence sustained at much higher levels.

Nearly every significant decay in confidence occurred when the U.S. was in a recession. While an imminent recession is always possible, the likelihood that the U.S. is now in a recession—or even headed for one this year—seems rather remote. Outside of recessions, there was only one other time that confidence was as low as it is today: After a solid recovery in confidence at the start of the 2009 expansion, there was a brief confidence breakdown in mid-2011. Then, renewed fears that the expansion would fail is probably why confidence again declined. Those fears, however, proved unfounded; confidence quickly revived and embarked on a multi-year advance until the 2020 pandemic.

Is confidence about the contemporary expansion following a similar path? It bounced from about 70 to 90 during the first year of this recovery, but since last April, it has again collapsed (like in 2011). Despite strong economic growth and the S&P 500 within 5% of its all-time high, Main Street confidence remains depressed due to a combination of Federal Reserve and interest-rate fears, the highest inflation rate in decades, and Putin’s war.

In our view, even if some or all of these fears continue to fester, confidence will not likely fall much further. Indeed, it would truly be “extreme” if it did. Rather, some of the current nightmares facing the recovery will probably turn out better than feared, causing Main Street sentiment to soon lift, as it did after its 2011 break- down.

According to a Bloomberg survey of private-sector economists, the consensus for U.S. real-GDP growth in 2022 is a robust 3.5%. With Main Street characterized by excessive pessimism and solid real growth, in our view, an opportunity exists for investors to exploit the likelihood that confidence is poised to rise.

Portfolio Tilts For “Rising Confidence?”

Confidence as subdued as today’s is reminiscent of being in a recession that is nearing the start of a new economic expansion. Consequently, many of the investment options highlighted here are typically favored in the infancy of a new economic expansion. It is very odd for conviction to be so low when starting the third year of a recovery.

Nonetheless, if confidence does perk up from today’s extraordinarily low level—whether it is the start of a new expansion or the third year of an ongoing recovery—greater enthusiasm will likely run through both the economy and the stock market in a fashion similar to how it has traditionally done in a fresh recovery.

The following charts illustrate six distinct investments whose relative performance corresponds closely with consumer confidence. Investors may want to consider some of these as possible portfolio tilts.


1. Cyclicals Need Some Confidence!

Chart 2 overlays the relative return of the S&P 500’s major cyclical sectors with the Consumer Confidence Index. At least since 2002, there has been a close relationship between cyclical stock leadership and Main Street confidence. Indeed, cyclicals led after the March 2020 bear-market bottom until May 2021, when confidence rolled over. Could cyclical stocks be nearing a “mini-replay” of 2020, driven by a renewed spike in consumer confidence?


2. Low Quality?

With the S&P 500 Index still trying to recover from a recent correction, and yields rising at an aggressive pace, most are advocating to boost the “quality” in portfolios. However, as illustrated in Chart 3, not only is the relative price of low-quality stocks nearly the same today as at the bottom of the 2009 bear market, but a trend of improved confidence could prompt a period of leadership for low-quality stocks.


3. High-Beta’s Run To Continue?

High-beta stocks have led the stock market throughout most of this bull run (Chart 4) and may continue to be superior investments should Main Street confidence finally improve. Most recently, after confidence peaked last May, high-beta has slightly underperformed but has not suffered as aggressively as other confidence-sensitive investments. Nevertheless, since at least 1990, it has paid to be overweight high-beta stocks during periods of improving confidence.


4. An IPO Leadership Replay?

IPOs and SPACs had a massive run earlier in this bull market, followed by an epic collapse (Chart 5). The pattern is similar to the surge and plunge of Main Street confidence. While far from a perfect relationship, since at least 2009, when confidence improved, IPOs directionally outpaced. Likewise, periods of rising pessimism on Main Street have been associated with underperforming IPOs. Many perceive the IPO run as a speculative frenzy that has now been left for dead. Is it possible, though, if confidence again turns up, IPOs could have another “curtain call” in the balance of this bull market?


5. Smaller Cap For A Confidence Run!

Not surprisingly, as illustrated by Chart 6, smaller-cap stocks do best when consumer confidence rises. The blue line represents the price return of micro-cap stocks relative to mega-caps. The notable periods when consumer confidence surged (2009, 2011, and 2020) were all associated with solid leadership by microcap stocks. As confidence collapsed over the last year, versus the largest stocks, micro caps have relinquished about two-thirds of their cumulative outperformance since this bull market began in March 2020. If consumer confidence is poised for another revival, it may be time to tilt away from your mega-cap winners toward smaller stocks!


6. Tilting Toward EM Debt?

It is not obvious why EM debt tends to outpace when U.S. consumers are confident. As shown in Chart 7, since 2008, EM debt has significantly rewarded investors whenever Main Street sentiment was improving. Currently, the price of EM debt relative to Treasuries is nearly as low as it was at the stock-market bottoms of 2009 and 2020. It is not a coincidence these were periods when consumer confidence had also declined substantially. This chart is a good reminder that if Main Street confidence does soon improve, investors may need to adjust exposure to bonds as well as stocks.


Final Comments


Consumer confidence is now as low—or lower— than it has been in any recession in the post-war era. Considering that economic growth looks healthy and the stock market is near record highs, today’s excessive level of Main Street pessimism is odd.

Understandably, many investments that typically do poorly as pessimism rises have been severe underperformers in the last year. Even if a recession is imminent, neither consumer confidence nor sentiment-sensitive investments are likely to do much worse because both are already priced for a recession. But should today’s economic fears prove overblown, Main Street confidence is likely headed for a substantial recovery that should boost the relative results of a number of investments, including cyclicals, low-quality, high-beta, IPOs, small caps, and EM debt.

If you, too, believe there is simply too much pessimism today, get your shopping list ready and “Tilt Confidently.”


The above was reprinted with permission from Paulsen’s Perspective an institutional newsletter published by THE LEUTHOLD GROUP.

Authored by James W Paulsen, Ph.D.  Chief Investment Strategist of The Leuthold Group, LLC. Jim is a member of the investment committee, authors market and economic commentary, and works with the Leuthold investment team in serving institutional, financial advisor, and investment professional clients.

The Leuthold Group has been producing original analysis for the institutional marketplace for nearly half a century. Driven by the research, its investment management arm is centered on tactical asset allocation and disciplined quantitative methodologies.


Stay up to date. Follow us:


Release – Voyager News Release 20220330


Voyager News Release

Research, News, and Market Data on Voyager Digital


Voyager Digital Ltd. (TSX: VOYG; OTCQX: VYGVF; FRA: UCD2) is at the forefront of the rapidly evolving crypto industry, and is committed to providing the best experience for its customers.

On March 29, 2022, Voyager Digital LLC, Voyager Holdings Inc., and Voyager Digital Ltd. (together “Voyager” or the “Company”) received the following orders from certain state securities divisions that are members of a multistate working group of North American Securities Administrators Association in respect of the Voyager customer accounts that permit customers to earn rewards on their crypto balances (“Voyager Earn Accounts”).  Voyager is aware of or has received cease and desist orders from the state securities divisions of Indiana, Kentucky, New Jersey and Oklahoma, and orders to show cause or similar orders from the state securities divisions of Alabama, Texas, Vermont and Washington.  These state orders generally assert that Voyager was offering and selling securities or investment contracts in the form of Voyager Earn Accounts unregistered with the applicable state.

Voyager is in ongoing communications with these state regulators to better understand the terms in their respective regulatory orders and to clarify certain statements in the orders that Voyager believes are inaccurate.  If, as, and when effective, the orders will generally prohibit Voyager from offering new Voyager Earn Accounts or accepting additional assets into existing Voyager Earn Accounts in the impacted states.  If, as, and when effective, some of these orders will permit existing Voyager Earn Account customers to continue earning rewards on existing balances until Voyager hasresolved such orders.  Three of these orders disclose civil penalties that the applicable state intends to seek upon resolution.  Voyager is seeking clarification of the terms of each of these regulatory orders, including effective dates and how proposed civil penalties in respect of alleged violations are calculated and its due process rights.  It is Voyager’s expectation that most of these state orders will provide a transition period prior to becoming effective.

Voyager is firmly convinced that its Earn Program and the Voyager Earn Accounts are not securities and intends to demonstrate its position and defend it as necessary and appropriate.  Of course, Voyager supports appropriate regulation and will do its best to demonstrate to these regulators that Voyager has complied with the law.

   
About Voyager Digital Ltd.
Publicly traded, Voyager Digital Ltd.’s (TSX: VOYG) (OTCQB: VYGVF) (FRA: UCD2) US subsidiary, Voyager Digital, LLC, is a fast-growing, cryptocurrency platform in the United States founded in 2018 to bring choice, transparency, and cost efficiency to the marketplace. Voyager offers a secure way to trade over 100 different crypto assets using its easy-to-use mobile application. Through its subsidiary Coinify ApS, Voyager provides crypto payment solutions for both consumers and merchants around the globe. To learn more about the company, please visit https://www.investvoyager.com.
 
Forward Looking Statements

Certain information in this press release, including, but not limited to, statements regarding the Company’s interpretation of the state orders received, the intent, terms and effectiveness of the state orders, the expectation of clarification of such orders from the applicable states, future changes in laws and regulations or the interpretation thereof, the Company’s success and legal strategy in response to stat orders, future legislative change, the status and operation of the Voyager Earn Accounts, future growth and performance of the business, momentum in the businesses, future adoption of digital assets, and the Company’s anticipated results may constitute forward looking information (collectively, forward-looking statements), which can be identified by the use of terms such as “may,” “will,” “should,” “expect,” “anticipate,” “project,” “estimate,” “intend,” “continue” or “believe” (or the negatives) or other similar variations. Forward-looking statements involve known and unknown risks, uncertainties and other factors that may cause Voyager’s actual results, performance or achievements to be materially different from any of its future results, performance or achievements expressed or implied by forward-looking statements. Moreover, Voyager operates in a very competitive and rapidly changing environment. New risks emerge from time to time. It is not possible for Company management to predict all risks, the interpretation or application of existing laws by regulators, nor can Voyager assess the impact of all factors on Voyager business or the extent to which any factor, or combination of factors, may cause actual results to differ materially from those contained in any forward-looking statements Voyager may make. In light of these risks, uncertainties, and assumptions, the future events and trends discussed in this press release may not occur and actual results could differ materially and adversely from those anticipated or implied in the forward-looking statements. Forward looking statements are subject to regulatory risks, regulatory actions and claims, the risk of changes of laws or the interpretation or application thereof, the risk that the global economy, industry, or the Company’s businesses and investments do not perform as anticipated, that revenue or expenses estimates may not be met or may be materially less or more than those anticipated, that trading momentum does not continue or the demand for trading solutions declines, customer acquisition does not increase as planned, product and international expansion do not occur as planned, risks of compliance with laws and regulations that currently apply or become applicable to the business or the interpretation or application of laws and regulations by regulatory authorities, and those other risks contained in the Company’s public filings, including in its Management Discussion and Analysis and its Annual Information Form (AIF). Factors that could cause actual results of the Company and its businesses to differ materially from those described in such forward-looking statements include, but are not limited to, the ability of the Company to continue offering Voyager Earn Accounts and to offer products and services consistent with past offerings and continue to offer new and innovative products and services,  a decline in the digital asset market or general economic conditions; changes in laws or approaches to regulation or the interpretation or application thereof, regulatory investigations, enforcement actions or other regulatory action or sanction or proceedings, the failure or delay in the adoption of digital assets and the blockchain ecosystem by institutions; changes in the volatility of crypto currency, changes in demand for Bitcoin and Ethereum, changes in the status or classification of cryptocurrency assets, cybersecurity breaches, a delay or failure in developing infrastructure for the trading businesses or achieving mandates and gaining traction; failure to grow assets under management, an adverse development with respect to an issuer or party to the transaction or failure to obtain a required regulatory approval. In connection with the forward-looking statements contained in this press release, the Company has made assumptions regarding the terms and conditions of the state orders, its ability to seek clarification, its ability to continue with the Voyager Earn Accounts, it success in responding to any state orders or other regulatory enquiries, actions or claims and the applicability, interpretation and application of existing laws and regulations. Forward-looking statements, past and present performance and trends are not guarantees of future performance; accordingly, you should not put undue reliance on forward-looking statements, current or past performance, or current or past trends. Information identifying assumptions, risks, and uncertainties relating to the Company are contained in its filings with the Canadian securities regulators available at www.sedar.com. The forward-looking statements in this press release are applicable only as of the date of this release or as of the date specified in the relevant forward-looking statement and the Company undertakes no obligation to update any forward-looking statement to reflect events or circumstances after that date or to reflect the occurrence of unanticipated events. The Company assumes no obligation to provide operational updates, except as required by law. If the Company does update one or more forward-looking statements, no inference should be drawn that it will make additional updates with respect to those or other forward-looking statements, unless required by law. Readers are cautioned that past performance is not indicative of future performance and current trends in the business and demand for digital assets or in the application or interpretation of laws and regulations may not continue and readers should not put undue reliance on past performance and current trends.   All figures are in U.S. dollars unless otherwise noted.

The TSX has not approved or disapproved of the information contained herein.

SOURCE Voyager Digital, Ltd.

Press Contacts

Voyager Digital, Ltd.

Michael Legg
Chief Communications Officer
(212) 547-8807
mlegg@investvoyager.com

Voyager Public Relations Team
pr@investvoyager.com

Robinhood Launching Extended Hours


Robinhood Continues to Push to Expand Their Users’ Possibilities


Robinhood (HOOD) has taken another step toward users having the ability to trade from their platform around the clock, seven days a week. It announced that the online brokerage service is extending its premarket and after-hours trading to provide a 13-hour window. Robinhood’s stated mission has always been to revolutionize the markets and bring more people into the financial system. Yesterday’s (March 29) announcement is another step toward that goal.

The company said this is an important step toward 24/7 equities investing; their new extended hours will allow users to trade from 7 am until 8pm. This adds four hours for users to transact. Its extended trading hours had been from 9 am to 9:30 am. ET and 4 pm to 6 pm ET.

 In a Blog post the online stockbroker that introduced transaction free trades in 2014, added crypto in 2018, fractional shares in 2019, automatic investments in 2020, and 24/7 customer support in 2021 said about their mission to revolutionize the markets, “Today’s launch is just another step on this journey, and we’re just getting started.”


Robinhood has studied their data and said that they have, “…seen a community of Robinhood early birds and night owls who log in exclusively outside of regular market hours.” They believe the new extended trading hours, leading toward 24/7, will provide more opportunities to more customers to manage their portfolio at a convenient time for them.

The stock jumped 24%, its third-best trading day since the company went public last summer.

A Word of Caution

Trading is typically thinner pre and post-market. While access may be helpful, until there are a large number of transactions taking place, extended-hours trading can be riskier than the regular session. At the same time, it may also provide opportunities or dislocations worth considering. These risks would presumably lessen as extended hours volume increases.

Paul Hoffman

Managing Editor, Channelchek


Suggested Reading


Regulators May Add New Guard Rails to Temper Investment Risk


AMC Entertainment’s Plot Twist Gets Even More Interesting to Investors


Sources

https://robinhood.com/us/en/support/articles/extendedhours-trading/

https://blog.robinhood.com/


Stay up to date. Follow us:


The Yield Curve as a Leading Indicator Has Been Compromised


What is an Inverting Yield Curve and Does it Mean We’re Heading for a Recession?


One key predictor of downturns in the economy is what is known as the yield curve. This typically refers to the market for what the US government borrows, by issuing bonds and other securities that mature over different time horizons ranging from weeks to 30 years.

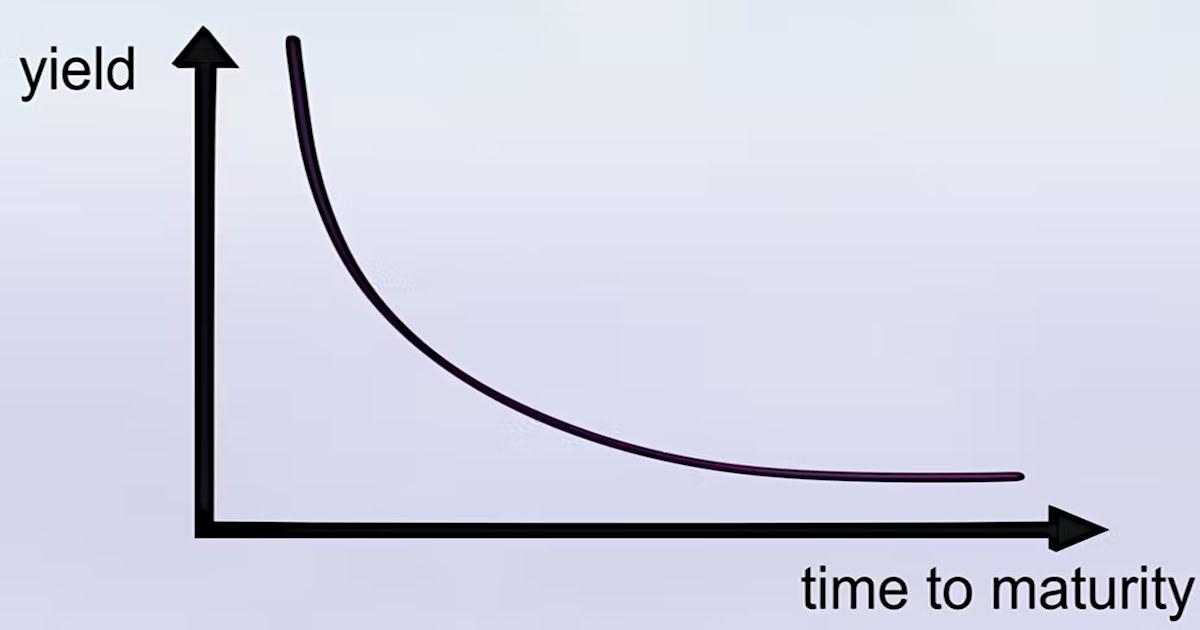
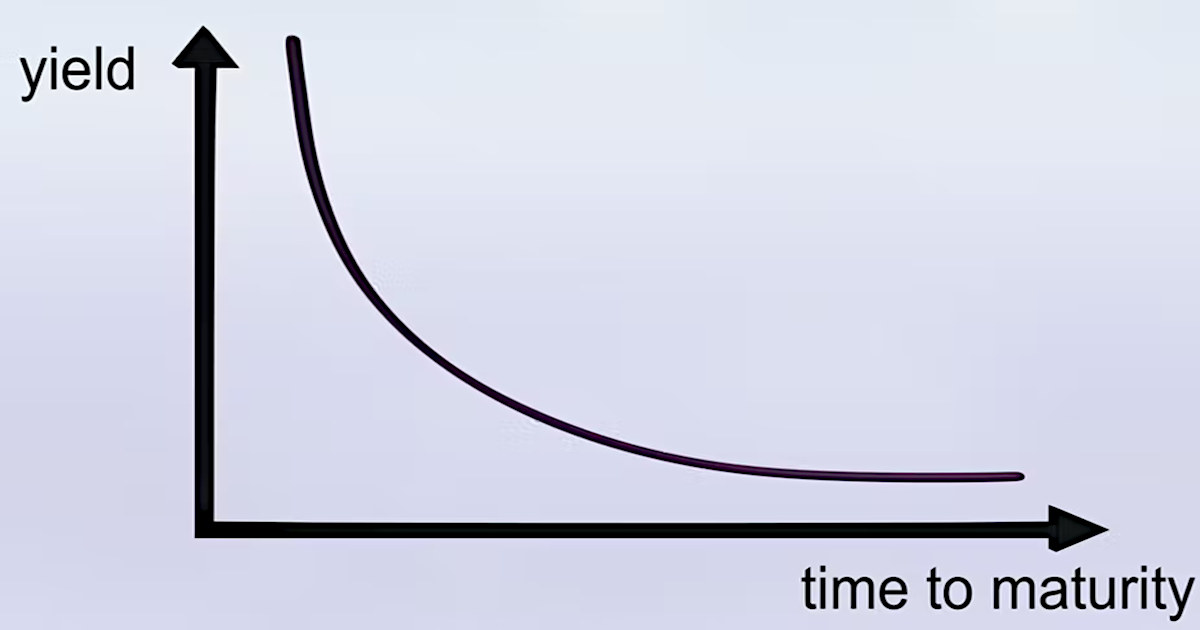
Each of these securities has its own yield (or interest rate), which moves up and down in inverse proportion to the security’s market value – so when bonds are trading at high prices, their yields will be low and vice versa. You can draw a chart that plots the yields of securities at each maturity date to see how they relate to one another, and this is known as the yield curve.

In normal times, as compensation for higher risk, investors expect higher rates of interest for money they lend over a longer time horizon. To reflect this, the yield curve normally slopes up. When it instead slopes down – in other words, when it inverts – it is a sign that investors are more pessimistic about the long term than the short term: they think a downturn or a recession is coming soon.

This is because they expect the Federal Reserve, the US central bank, is going to cut short-term interest rates in the future to stimulate a struggling economy (as opposed to raising rates to cool down an economy that is overheating).

Most closely watched is the relationship between two-year and ten-year US treasury debt. The so-called spread between these two metrics can be seen in the chart below, with the gray areas indicating recessions that have followed shortly after.


Spread Between Two-Year and Ten-Year Treasuries


Source: St Louis Fed


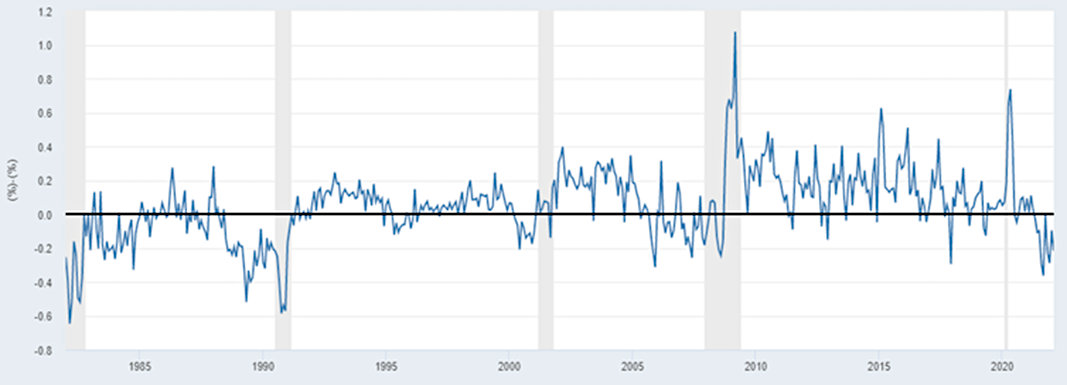
As you can see, the yields of these two securities are getting very close to being the same, and the trend suggests that the two-year could soon have a higher yield – meaning the curve is inverting. The key question is, does an inverted yield curve hint at an upcoming downturn? Not necessarily. Let me explain why.

Inflation Expectations

One complication is that bond yields don’t only reflect what investors think about future economic growth. They also buy or sell debt securities depending on what they think is going to happen to inflation. It’s generally assumed that prices will rise in the years ahead, and investors need to be compensated for bearing that risk since higher inflation will erode their future purchasing power. For this reason, bond yields contain an element of inflation premium, normally with an increasingly higher premium for bonds with longer maturity dates.

The following chart shows the spread between the inflation expectations built into 10-year and 2-year Treasuries. The fact that it is in negative territory suggests the market thinks that inflation may fall, and this may also explain why yields on longer-dated Treasuries are lower than on shorter-dated ones. And although inflation would fall in the event of an economic slowdown or recession, there could be a situation where inflation fell but the economy remained buoyant. Hence a yield curve inversion doesn’t have to mean that we are up against an imminent recession.


Inflation Expectations (Ten-Year vs. Two-Year Treasuries)


Source: St Louis Fed


Quantitative Easing

Another factor that is potentially affecting the yield curve is the Federal Reserve’s moves to buy government debt as part of its quantitative easing program (QE). The idea behind QE is that by buying long-term bonds, the Fed is able to keep long-term interest rates low, which decreases the rates on mortgages and other loans, thereby stimulating the economy. Conversely, when sold, lending rates will go up and economic activity will be reduced.

Earlier in March, the Fed started raising the benchmark US interest rate and stopped the asset purchases under the QE program that it launched in 2020 in response to the COVID pandemic. But it also indicated that it would only start selling these assets after several months of hiking the benchmark rate. Since the benchmark rate is a short-term rate, the yield curve inverting might indicate market expectations that short-term interest rates will be higher than long-term ones for the foreseeable future.


Which Yield Curve Should We Consider?

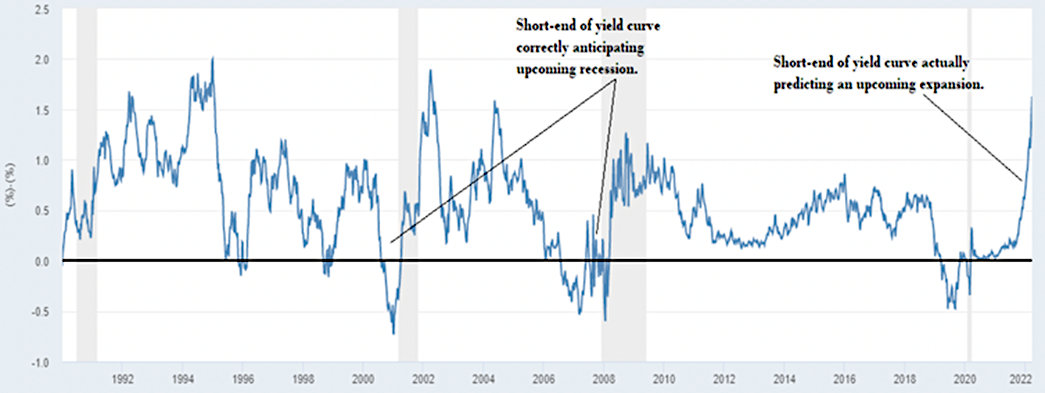
It is also sometimes argued that two-year/ten-year spreads are not the most useful relationships to watch and that instead, one should focus on yields at the shorter end of the yield curve. In this setup, if you look at the difference in yields between two-year and three-month treasuries, it is actually steepening: in other words, it is hinting that economic growth is going to increase in the short term.

Economists sometimes argue that these near-term yield curve movements have stronger predictive power than those further out. At the very least, the fact that these are saying something different shows the need to be careful because different data about treasury yields can depict a different (or even opposite) picture depending on what time horizon you are considering.


Spread Between Two-Year and Three-Month Treasury Yields


Source: St Louis Fed

To summarise, it doesn’t necessarily follow that an inverted yield curve will be followed by a recession. It certainly could mean that, in which case unemployment would likely rise and inflation would potentially come down more quickly than many are expecting. But for now, it’s too early to say. The debt market is certainly signaling that change is coming, though it’s often easier to say in hindsight what it meant in hindsight.


This article was republished with permission from The Conversation, a news site dedicated to sharing ideas from academic experts. It represents the research-based findings and thoughts of Luciano Rispoli Teaching Fellow in Economics, University of Surrey.


Suggested Reading


How Rising Rates Could Make Brokers Like Robinhood More Profitable


The Detrimental Impact of Fed Policy on Savers


Was the Inflation of 1982 Like Today’s?


What is the Yield Curve?


Stay up to date. Follow us:


What is a Stock Split?


Why Stocks Split and the Possible Impact to Investors


Reason for a Company to Split its Stock

When stocks split, it is most often a decision by the company to lower its trading price range to a level small enough to attract more investors and enhance the liquidity of trading in its shares.

Variations of Splits

A company’s board of directors may decide to split the stock by any ratio. For example, the most common is 2:1 (the stockholder receives two shares for each one they own), but 3:1, even 5:1 is not uncommon. In a 2:1 split there will be double the amount of shares trading, the price per share will approximate half of what it was before the split.

Impact to Market Cap

Market capitalization is calculated by multiplying the total number of shares outstanding by the price per share. For example, if XYZ Corp. has 10 million shares outstanding and the shares are trading at $20 Its market cap will be 200 million. If the company’s board of directors decides to split the stock 2:1 the number of shares outstanding would double to 20 million, while the share price would be roughly halved to $10.

Reasons for a Stock Split

The decision to go through the administrative expense is usually based on one or two of the following:

First, stocks traditionally traded in “round-lots” of 100 and multiples of 100. Companies often decide on a split when the stock price has reached a level where it is preventing those that the company would most likely want as owners from investing in round-lots.  

Second, the lower priced, higher number of shares outstanding can result in greater liquidity for the stock. This is because it facilitates transactions and could narrow the spread between bid and offer.

Increased liquidity helps owners large and small find buyers when they are looking to sell, and sellers when they are looking to buy. With high liquidity, a large number of shares can be traded without much impact on price levels. While this is positive for all who transact in the shares, companies that may look to repurchase their shares also don’t have as much concern about escalating the price they’re paying. Management can also exercise their ability to sell large amounts they may have acquired as part of their compensation without causing the price to plummet.

Stock Price

While a split, in theory, should have no effect on a stock’s price, it often results in renewed investor interest, which can have a positive effect. Stock splits by large heavily traded companies are often bullish for their market capitalization numbers, and positive for investors.

When You Own Shares

When a stock you own splits, shareholders of record are credited with their additional shares. For instance, in a 2:1 stock split, if you owned 100 shares that were trading at $20 just before the split, you would then own 200 shares at about $10 each. Your broker would handle this automatically, so there is nothing you need to do.

Will a Stock Split Affect My Taxes?

No. The cost basis of each share owned after the stock split will be half of what it was before the split for tax purposes.


Are Stock Splits Good or Bad?

Stock splits are usually done when the share price has risen so high that it might reduce trading. This means investors were driving the company valuation higher. So splits often happen in healthy growing companies. Plus, a stock that has just split may see an uptick in interest as it attracts new investors at the lower price tag per share.


Suggested Reading


What is Fed Tightening?


What is the Yield Curve?


Stay up to date. Follow us:


Alliance Resource Partners (ARLP) – Cash Flow Above All Else

Wednesday, March 30, 2022

Alliance Resource Partners (ARLP)
Cash Flow Above All Else

Alliance Resource Partners LP operates as a coal mining company based in the United States. It functions through threesegments; Illinois Basin, Appalachia, and and Minerals. The Illinois Basin activity comprises of underground mining complexes in Illinois, Indiana, Kentucky, Maryland and West Virginia and it makes up for most of the company’s revenue-generating operations. The Appalachia segment, on the other hand, consists of multiple operating segments, including the Mettiki mining complex, the Tunnel Ridge mining complex and the MC Mining mining complex. The Minerals segment includes oil & gas mineral interests held by AR Midland and AllDale I & II.

Mark Reichman, Senior Research Analyst of Natural Resources, Noble Capital Markets, Inc.

Refer to the full report for the price target, fundamental analysis, and rating.

    Initiating coverage.  Alliance Resource Partners is a diversified natural resource company that generates revenue from the production and marketing of coal, and royalty income from coal, oil, and gas mineral interests located in favorable producing regions across the United States. Strong cash flows generated by the company’s operations are expected to support continued growth in its oil and natural gas royalty business, along with diversification into green energy sources that may include strategic minerals and metals, electric vehicle charging infrastructure, wind, and/or solar.

    Strong cash flow growth profile.  Demand for coal, oil, and gas remains robust and prices have risen in recent quarters. Free cash flow in 2021 was $302.2 million, well above capital expenditures of $123 million. In 2021, Alliance paid down over $100 million of debt and recently increased its quarterly cash distribution to unitholders by 25% to $0.25 per unit, or $1.00 on an annualized basis …


This Company Sponsored Research is provided by Noble Capital Markets, Inc., a FINRA and S.E.C. registered broker-dealer (B/D).

*Analyst certification and important disclosures included in the full report. NOTE: investment decisions should not be based upon the content of this research summary. Proper due diligence is required before making any investment decision. 


Ayala Pharmaceuticals (AYLA) – Ayala Reports FY21 and Reiterates Trial Data Expectations

Wednesday, March 30, 2022

Ayala Pharmaceuticals (AYLA)
Ayala Reports FY21 and Reiterates Trial Data Expectations

Ayala Pharmaceuticals Inc clinical-stage oncology company focused on developing and commercializing small molecule therapeutics for patients suffering from rare and aggressive cancers, primarily in genetically defined patient populations. The company’s current portfolio of product candidates, AL101 and AL102, targets the aberrant activation of the Notch pathway with gamma secretase inhibitors. Its product candidate, AL101, is being developed as a potent, selective, injectable small molecule gamma secretase inhibitor, or GSI. It is also developing AL101 for the treatment of T-ALL, an aggressive, rare form of T-cell specific leukemia.

Robert LeBoyer, Vice President, Research Analyst, Life Sciences, Noble Capital Markets, Inc.

Refer to the full report for the price target, fundamental analysis, and rating.

    Ayala Reported FY2021 Within Expectations Ayala Reported FY2021 loss of $40.3 million or $(2.80) per share.  This compares with our estimate of a loss of $40.9 million or $(3.00) per share, as both R&D and General Expenses were slightly below our estimates. Cash balance on December 31 was $37.3 million.

    One New Study Testing AL101 Is Underway, Another To Begin In 2H22.  The “Window of Opportunity” study testing AL101 in ACC (adenoid cystic carcinoma) has begun treating patients prior to surgery and radiation therapy. This is intended to reduce recurrence rates and improve long-term survival, as well as to define the mechanism and effects of AL101 on cancer. Separately, the Phase 2 trial in T-ALL …


This Company Sponsored Research is provided by Noble Capital Markets, Inc., a FINRA and S.E.C. registered broker-dealer (B/D).

*Analyst certification and important disclosures included in the full report. NOTE: investment decisions should not be based upon the content of this research summary. Proper due diligence is required before making any investment decision. 


Information Services (III) – Expanding The Platform

Wednesday, March 30, 2022

Information Services (III)
Expanding The Platform

ISG (Information Services Group) (Nasdaq: III) is a leading global technology research and advisory firm. A trusted business partner to more than 700 clients, including more than 70 of the top 100 enterprises in the world, ISG is committed to helping corporations, public sector organizations, and service and technology providers achieve operational excellence and faster growth. The firm specializes in digital transformation services, including automation, cloud and data analytics; sourcing advisory; managed governance and risk services; network carrier services; strategy and operations design; change management; market intelligence and technology research and analysis. Founded in 2006, and based in Stamford, Conn., ISG employs more than 1,300 digital-ready professionals operating in more than 20 countries—a global team known for its innovative thinking, market influence, deep industry and technology expertise, and world-class research and analytical capabilities based on the industry’s most comprehensive marketplace data. For more information, visit www.isg-one.com

Joe Gomes, Senior Research Analyst, Noble Capital Markets, Inc.

Joshua Zoepfel, Research Associate, Noble Capital Markets, Inc.

Refer to the full report for the price target, fundamental analysis, and rating.

    A New Acquisition. ISG’s management announced yesterday the acquisition of privately-held Agreemint, an automated contracting solution company. A partner to ISG since 2021, Agreemint’s AI-powered contracting platform brings important new capabilities to the market-leading ISG GovernX vendor compliance and risk management solution and will be used by ISG to add value to future platform solutions now in development.

    What is Agreemint? As mentioned, Agreemint is a contracting solution company that uses AI to deliver automated contract authoring through a repository of legal positions to speed the process to contract.  Through its AI functionality, it enables users to negotiate better contracts, as it suggests language that is legal, governable, and agreeable to both parties, as well as anticipates language …


This Company Sponsored Research is provided by Noble Capital Markets, Inc., a FINRA and S.E.C. registered broker-dealer (B/D).

*Analyst certification and important disclosures included in the full report. NOTE: investment decisions should not be based upon the content of this research summary. Proper due diligence is required before making any investment decision. 


Voyager News Release


Voyager News Release

Research, News, and Market Data on Voyager Digital


Voyager Digital Ltd. (TSX: VOYG; OTCQX: VYGVF; FRA: UCD2) is at the forefront of the rapidly evolving crypto industry, and is committed to providing the best experience for its customers.

On March 29, 2022, Voyager Digital LLC, Voyager Holdings Inc., and Voyager Digital Ltd. (together “Voyager” or the “Company”) received the following orders from certain state securities divisions that are members of a multistate working group of North American Securities Administrators Association in respect of the Voyager customer accounts that permit customers to earn rewards on their crypto balances (“Voyager Earn Accounts”).  Voyager is aware of or has received cease and desist orders from the state securities divisions of Indiana, Kentucky, New Jersey and Oklahoma, and orders to show cause or similar orders from the state securities divisions of Alabama, Texas, Vermont and Washington.  These state orders generally assert that Voyager was offering and selling securities or investment contracts in the form of Voyager Earn Accounts unregistered with the applicable state.

Voyager is in ongoing communications with these state regulators to better understand the terms in their respective regulatory orders and to clarify certain statements in the orders that Voyager believes are inaccurate.  If, as, and when effective, the orders will generally prohibit Voyager from offering new Voyager Earn Accounts or accepting additional assets into existing Voyager Earn Accounts in the impacted states.  If, as, and when effective, some of these orders will permit existing Voyager Earn Account customers to continue earning rewards on existing balances until Voyager hasresolved such orders.  Three of these orders disclose civil penalties that the applicable state intends to seek upon resolution.  Voyager is seeking clarification of the terms of each of these regulatory orders, including effective dates and how proposed civil penalties in respect of alleged violations are calculated and its due process rights.  It is Voyager’s expectation that most of these state orders will provide a transition period prior to becoming effective.

Voyager is firmly convinced that its Earn Program and the Voyager Earn Accounts are not securities and intends to demonstrate its position and defend it as necessary and appropriate.  Of course, Voyager supports appropriate regulation and will do its best to demonstrate to these regulators that Voyager has complied with the law.

   
About Voyager Digital Ltd.
Publicly traded, Voyager Digital Ltd.’s (TSX: VOYG) (OTCQB: VYGVF) (FRA: UCD2) US subsidiary, Voyager Digital, LLC, is a fast-growing, cryptocurrency platform in the United States founded in 2018 to bring choice, transparency, and cost efficiency to the marketplace. Voyager offers a secure way to trade over 100 different crypto assets using its easy-to-use mobile application. Through its subsidiary Coinify ApS, Voyager provides crypto payment solutions for both consumers and merchants around the globe. To learn more about the company, please visit https://www.investvoyager.com.
 
Forward Looking Statements

Certain information in this press release, including, but not limited to, statements regarding the Company’s interpretation of the state orders received, the intent, terms and effectiveness of the state orders, the expectation of clarification of such orders from the applicable states, future changes in laws and regulations or the interpretation thereof, the Company’s success and legal strategy in response to stat orders, future legislative change, the status and operation of the Voyager Earn Accounts, future growth and performance of the business, momentum in the businesses, future adoption of digital assets, and the Company’s anticipated results may constitute forward looking information (collectively, forward-looking statements), which can be identified by the use of terms such as “may,” “will,” “should,” “expect,” “anticipate,” “project,” “estimate,” “intend,” “continue” or “believe” (or the negatives) or other similar variations. Forward-looking statements involve known and unknown risks, uncertainties and other factors that may cause Voyager’s actual results, performance or achievements to be materially different from any of its future results, performance or achievements expressed or implied by forward-looking statements. Moreover, Voyager operates in a very competitive and rapidly changing environment. New risks emerge from time to time. It is not possible for Company management to predict all risks, the interpretation or application of existing laws by regulators, nor can Voyager assess the impact of all factors on Voyager business or the extent to which any factor, or combination of factors, may cause actual results to differ materially from those contained in any forward-looking statements Voyager may make. In light of these risks, uncertainties, and assumptions, the future events and trends discussed in this press release may not occur and actual results could differ materially and adversely from those anticipated or implied in the forward-looking statements. Forward looking statements are subject to regulatory risks, regulatory actions and claims, the risk of changes of laws or the interpretation or application thereof, the risk that the global economy, industry, or the Company’s businesses and investments do not perform as anticipated, that revenue or expenses estimates may not be met or may be materially less or more than those anticipated, that trading momentum does not continue or the demand for trading solutions declines, customer acquisition does not increase as planned, product and international expansion do not occur as planned, risks of compliance with laws and regulations that currently apply or become applicable to the business or the interpretation or application of laws and regulations by regulatory authorities, and those other risks contained in the Company’s public filings, including in its Management Discussion and Analysis and its Annual Information Form (AIF). Factors that could cause actual results of the Company and its businesses to differ materially from those described in such forward-looking statements include, but are not limited to, the ability of the Company to continue offering Voyager Earn Accounts and to offer products and services consistent with past offerings and continue to offer new and innovative products and services,  a decline in the digital asset market or general economic conditions; changes in laws or approaches to regulation or the interpretation or application thereof, regulatory investigations, enforcement actions or other regulatory action or sanction or proceedings, the failure or delay in the adoption of digital assets and the blockchain ecosystem by institutions; changes in the volatility of crypto currency, changes in demand for Bitcoin and Ethereum, changes in the status or classification of cryptocurrency assets, cybersecurity breaches, a delay or failure in developing infrastructure for the trading businesses or achieving mandates and gaining traction; failure to grow assets under management, an adverse development with respect to an issuer or party to the transaction or failure to obtain a required regulatory approval. In connection with the forward-looking statements contained in this press release, the Company has made assumptions regarding the terms and conditions of the state orders, its ability to seek clarification, its ability to continue with the Voyager Earn Accounts, it success in responding to any state orders or other regulatory enquiries, actions or claims and the applicability, interpretation and application of existing laws and regulations. Forward-looking statements, past and present performance and trends are not guarantees of future performance; accordingly, you should not put undue reliance on forward-looking statements, current or past performance, or current or past trends. Information identifying assumptions, risks, and uncertainties relating to the Company are contained in its filings with the Canadian securities regulators available at www.sedar.com. The forward-looking statements in this press release are applicable only as of the date of this release or as of the date specified in the relevant forward-looking statement and the Company undertakes no obligation to update any forward-looking statement to reflect events or circumstances after that date or to reflect the occurrence of unanticipated events. The Company assumes no obligation to provide operational updates, except as required by law. If the Company does update one or more forward-looking statements, no inference should be drawn that it will make additional updates with respect to those or other forward-looking statements, unless required by law. Readers are cautioned that past performance is not indicative of future performance and current trends in the business and demand for digital assets or in the application or interpretation of laws and regulations may not continue and readers should not put undue reliance on past performance and current trends.   All figures are in U.S. dollars unless otherwise noted.

The TSX has not approved or disapproved of the information contained herein.

SOURCE Voyager Digital, Ltd.

Press Contacts

Voyager Digital, Ltd.

Michael Legg
Chief Communications Officer
(212) 547-8807
mlegg@investvoyager.com

Voyager Public Relations Team
pr@investvoyager.com