TV and Radio Personalities to Moderate Panels at NobleCon18


Eric Bolling and Mike Gallager to Moderate Metaverse, Psychedelics and “The World Is Hot Right Now” Panels at NobleCon18

The 18th annual conference will be “live” again! To celebrate the return to IN PERSON, thanks to our sponsors, investor registration is FREE


We are pleased to announce that these two television and radio veterans will hit the stage to moderate three panels at NobleCon18. Eric Bolling’s 17-year television career includes 11 years at Fox News (The Five, Cashin’ In and more), CNBC’s Fast Money, Sinclair Media’s America This Week, and is currently host of Eric Bolling The Balance on Newsmax. Before television, he was on Wall Street where he was among Trader Monthly’s Top 100 in 2005 and 2006, and received their Man of the Year Award in 2007. All of this after an injury took him away from being a professional baseball player with the Pittsburg Pirates. Mike Gallagher is one of the most listened-to radio talk show hosts in America. Prior to being launched into national syndication in 1998, Mike hosted the morning show on WABC-AM in New York City. Today, Talkers Magazine reports that his show The Mike Gallagher Show on Salem Media is heard by 7 million weekly listeners. In addition to being a two-time best-selling author, Mike is also a Fox News contributor and guest host.

Bolling will moderate the “Metaverse – Is The Future Real” Panel (Wednesday, April 20, 8:00am) and the “Psychedelics: The Next Breakthrough in Mental Health Treatment?” Panel (Thursday, April 21, 8:00am). Gallagher will moderate “The world is HOT Right Now – A Look at Global Economics Since COVID-19 and The War in Ukraine” (Wednesday, April 20, 4:30pm).

ADMISSION IS FREE for institutional to self-directed novice investors, thanks to Noble, Channelchek, Sponsors and The Presenting Companies. Attendance is limited to 1,000.

NobleCon18 – Noble Capital Markets 18th Annual Small and Microcap Investor Conference – April 19-21, 2022 – Hard Rock, Hollywood, FL 100 Public Company Presentations | Scheduled Breakouts | Panel Presentations | High-Profile Keynotes | Educational Sessions | Receptions & Networking Events

REGISTER FREE AS AN INVESTOR  |  PRESENTING COMPANY INQUIRIES  |  NOBLECON INFO PAGE  |  NOBLECON18.COM  |  PRESENTING COMPANIES  |  SCHEDULED SPEAKERS

Waterbury South Uranium Targets Extended in Latest Winter Drill Program


Waterbury South Uranium Targets Extended in Latest Winter Drill Program

Research, News, and Market Data on CanAlaska Uranium


 Strong Clay and Sulfide Alteration Halo Associated With Previously Discovered Polymetallic Uranium Mineralization Extended

 Structurally-Complex Area Identified in Sandstone and Deep Into Basement

 Update on Corporate Activities in the Athabasca Basin and Thompson Nickel Belt

 Vancouver, Canada, March 31, 2022 – CanAlaska Uranium Ltd. (TSX-V: CVV; OTCQB: CVVUF; Frankfurt: DH7N) (“CanAlaska” or the “Company”) is pleased to announce the successful completion of the 2022 drilling program at its 100%-owned Waterbury South uranium project. The project is located approximately 10 km southeast of the producing Cigar Lake uranium mine in the Eastern Athabasca Basin (Figure 1).
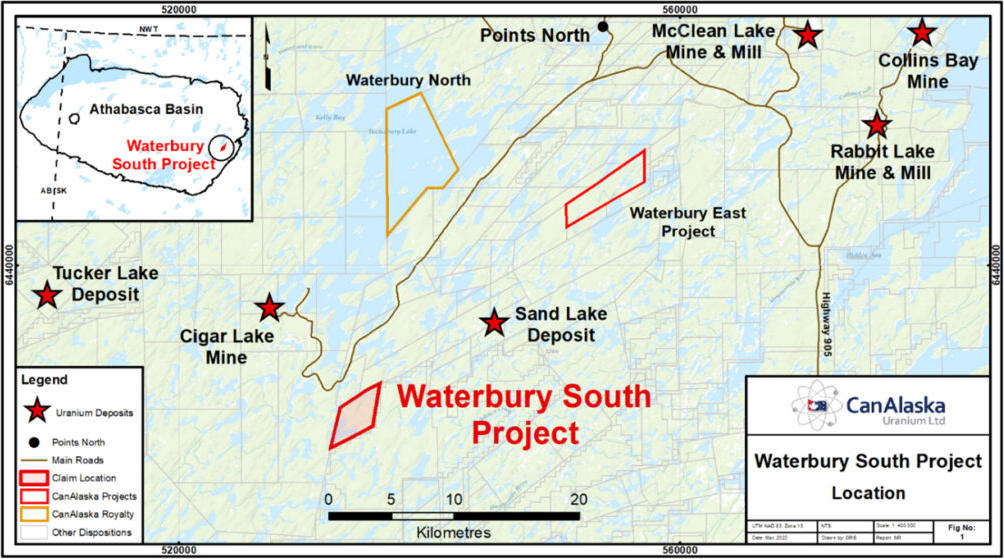
 

Figure 1 – Property location map for the Waterbury South project.

The drill program was focused on extending and understanding the geological controls of the polymetallic unconformity uranium mineralization associated with nickel, arsenic, cobalt, and zinc, intersected during the previous 2021 winter drill program (see News Release dated June 17, 2021). Program objectives were successfully met with the completion of six drill holes totalling 2,787 metres (m). Results indicate a structurally-complex fault system that extends the footprint of previously intersected strong sandstone and deep basement alteration.
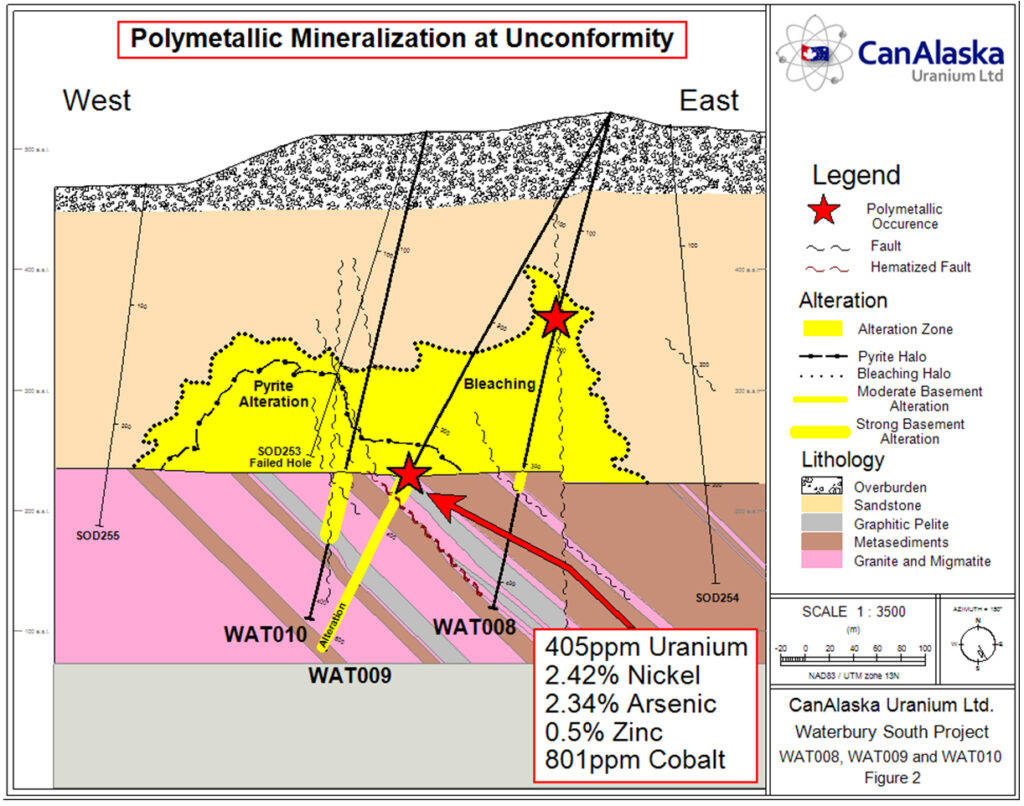
 

Figure 2 – Drillhole section along WAT009 and WAT010 showing the distribution of the strong alteration
and structure in the lower sandstone and basement along the fence.

Drillhole WAT010, drilled along the same fence as WAT009, targeted the unconformity projection of strong faulting intersected in the basement of WAT009. WAT010 intersected the unconformity target approximately 52 m north of WAT009 on section. The drillhole intersected a strongly altered and structured lower sandstone column with strong bleaching, pyrite, clay alteration, secondary hematite, desilicification, and clay-replaced sandstone (Figure 2). Strong bleaching and chlorite alteration extends over 60 m into the basement on WAT 010 and is associated with quartz-carbonate healed breccias that contain brittle reactivation . Based on the intensity of structure and alteration in the sandstone column, WAT010 is interpreted to have overshot the ideal target at the unconformity. The results on this fence from both 2021 and 2022 drilling indicate that strong hydrothermal alteration and fault structures are present above the unconformity and extend deep into the basement indicating the possible presence of a large mineralizing event nearby.

Drillhole WAT012  to the east of WAT010 confirmed the strike extension of strong alteration within WAT009 and WAT010. WAT012 intersected the unconformity approximately 55 m east of WAT009 (Figure 3). The lower sandstone column contains a five metre wide zone of strong hydrothermal alteration including bleaching, patches of strong black sulfide alteration, clay and chlorite, similar to WAT009 and WAT010. The strong bleaching and clay alteration extends into the upper four metres of the basement. Nearly 70 m below the unconformity, a series of 1 to 4 m wide strongly graphitic and re-activated fault zones characterized by broken core and quartz-carbonate healed breccias were intersected indicating further evidence of a major graphitic fault system in the basement. WAT012 is interpreted to have undershot the ideal target at the unconformity. WAT 014 was drilled to test the structural complexity in the area; it intersected bedding-controlled sulfide alteration throughout the lower sandstone column.
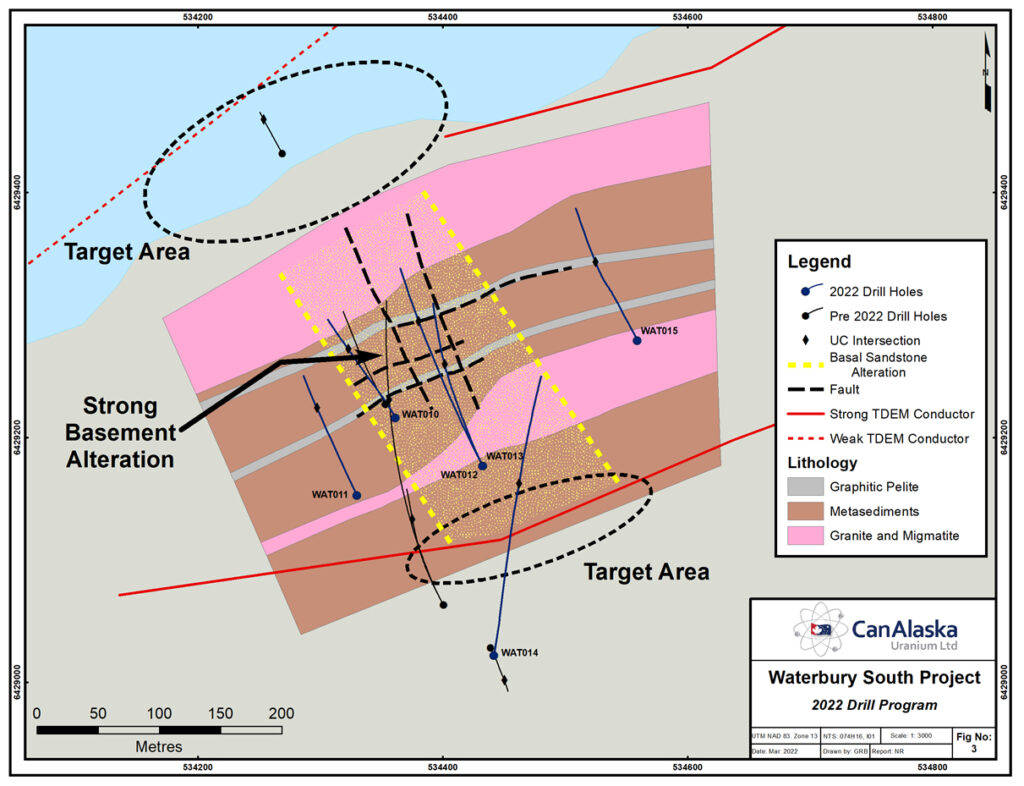
 

Figure 3 – Map of the Waterbury South project shows the complex structural relationship between
the drillholes completed to date and the currently defined sandstone alteration.

The drillholes completed during the program show evidence for multiple orientations of re-activated fault structures. These fault structures are parallel and cross-cutting to the basement stratigraphy in the area. In other uranium deposits such as Eagle Point, cross-cutting and splay faults play a very important role in controlling and localizing fluid movement along the main graphitic strucures. In the case of Eagle Point, these cross-cutting and splay structures can be strongly altered and mineralized for several hundred metres away from the mine area. The sandstone and deep basement faults with strong alteration are indicative of the presence of hydrothermal processes generally associated with a uranium mineralizing event. Given the structural complexity encountered in the 2022 program, the Company is investigating use of high resolution geophysical surveys to plan the next phase of drilling.

Geochemical assay results for the 2022 drilling program are pending.

CanAlaska VP Exploration, Nathan Bridge, comments, “The CanAlaska team set out to understand the controls on the previously discovered polymetallic unconformity uranium mineralization in WAT009. The strong alteration system in WAT009, that is host to high-grade nickel-sulfides and associated uranium mineralization, was extended to the east and remains open in several directions. The Waterbury South area is structurally-complex, with multiple fault orientations and deep basement alteration that suggests multiple periods of reactivation and hydrothermal fluid-movement, key to uranium deposit formation in the Athabasca Basin. The results obtained during this drill season are promising and several kilometers of strike length remain open along this structural corridor.”

 CanAlaska CEO, Cory Belyk, comments, “The 2022 program significantly increased our knowledge of the polymetallic uranium mineralization drilled in 2021. Continuation of strong sandstone and deep basement alteration along major structures is very encouraging and is an important aspect in nearly all uranium deposits in the Basin, specifically basement-hosted uranium deposits such as Eagle Point, where altered and mineralized cross-structures extend for several hundred metres away from the main deposit. The team did a great job of working out the geology and results from this program have generated nearby targets for the next round of drilling.


Corporate Update

West McArthur Drill Preparation:

The Company has nearly completed its detailed Stepwise Moving Loop Time Domain Electromagnetic Survey (TDEM) on its West McArthur Joint Venture project. The geophysical survey is part of the approved $5 million 2022 exploration program. Preliminary survey results show multiple strong conductive responses along the Grid 5 trend that appear to be associated with newly interpreted potential folds and fault structures. The Company anticipates the program will be complete in early April and targets from the survey will be ready for drill testing during the upcoming summer exploration program.

Key Extension Ground Gravity Survey:

A ground gravity survey at the Company’s new Key Extension project is over 50% complete. Preliminary processing of the data has identified a series of gravity low features that are associated with conductors on the property. These initial results are encouraging as this association is common in many basement-hosted uranium deposits. The Company plans to release the results of the survey once the full data set has been received and final processing has been completed in preparation for the inaugural drilling program later in the year.

Manibridge Drill Program

Drilling at the Company’s Manibridge project is ongoing. The drilling program is being fully funded by Metal Energy Corp. as part of a staged earn-in option agreement. Metal Energy have earned a 49% interest in the property and have elected to proceed with the 70% earn-in option. CanAlaska is the current operator on the project and drilling is ongoing.

Hunter Geophysics

In the Thompson Nickel Belt, the Company is preparing for an airborne VTEM survey on it’s 100%-owned Hunter nickel project.


About CanAlaska Uranium

CanAlaska Uranium Ltd. (TSX-V: CVV; OTCQB: CVVUF; Frankfurt: DH7N) holds interests in approximately 300,000 hectares (750,000 acres), in Canada’s Athabasca Basin – the “Saudi Arabia of Uranium.”  CanAlaska’s strategic holdings have attracted major international mining companies. CanAlaska is currently working with Cameco and Denison at two of the Company’s properties in the Eastern Athabasca Basin. CanAlaska is a project generator positioned for discovery success in the world’s richest uranium district. The Company also holds properties prospective for nickel, copper, gold and diamonds.

The qualified technical person for this news release is Nathan Bridge, MSc., P.Geo., CanAlaska’s Vice President, Exploration.

For further information visit www.canalaska.com.

On behalf of the Board of Directors

“Peter Dasler”
Peter Dasler, M.Sc., P.Geo.
President
CanAlaska Uranium Ltd.

Contacts:

Peter Dasler, President
Tel: +1.604.688.3211 x 138
Email: info@canalaska.com

Cory Belyk, CEO and Executive Vice President
Tel: +1.604.688.3211 x 138
Email: cbelyk@canalaska.com

Neither TSX Venture Exchange nor its Regulation Services Provider (as that term is defined in the policies of the TSX Venture Exchange) accepts responsibility for the adequacy or accuracy of this release.

Forward-looking information

All statements included in this press release that address activities, events or developments that the Company expects, believes or anticipates will or may occur in the future are forward-looking statements. These forward-looking statements involve numerous assumptions made by the Company based on its experience, perception of historical trends, current conditions, expected future developments and other factors it believes are appropriate in the circumstances. In addition, these statements involve substantial known and unknown risks and uncertainties that contribute to the possibility that the predictions, forecasts, projections and other forward-looking statements will prove inaccurate, certain of which are beyond the Company’s control. Readers should not place undue reliance on forward-looking statements. Except as required by law, the Company does not intend to revise or update these forward-looking statements after the date hereof or revise them to reflect the occurrence of future unanticipated events.

Forecasting Stocks Disease Weather Sales All Made Easier With a Simple Algorithm


A Tool for Predicting the Future – Helping Nonexperts Make Forecasts Using Data Collected Over Time


Adam Zewe | MIT News Office


Whether someone is trying to predict tomorrow’s weather, forecast future stock prices, identify missed opportunities for sales in retail, or estimate a patient’s risk of developing a disease, they will likely need to interpret time-series data, which are a collection of observations recorded over time.

Making predictions using time-series data typically requires several data-processing steps and the use of complex machine-learning algorithms, which have such a steep learning curve they aren’t readily accessible to nonexperts.

To make these powerful tools more user-friendly, MIT researchers developed a system that directly integrates prediction functionality on top of an existing time-series database. Their simplified interface, which they call tspDB (time series predict database), does all the complex modeling behind the scenes so a nonexpert can easily generate a prediction in only a few seconds.

The new system is more accurate and more efficient than state-of-the-art deep learning methods when performing two tasks: predicting future values and filling in missing data points.

One reason tspDB is so successful is that it incorporates a novel time-series-prediction algorithm, explains electrical engineering and computer science (EECS) graduate student Abdullah Alomar, an author of a recent research paper in which he and his co-authors describe the algorithm. This algorithm is especially effective at making predictions on multivariate time-series data, which are data that have more than one time-dependent variable. In a weather database, for instance, temperature, dew point, and cloud cover each depend on their past values.

The algorithm also estimates the volatility of a multivariate time series to provide the user with a confidence level for its predictions.

“Even as the time-series algorithm can effectively capture any time-series structure out there, data becomes more and more complex. It feels like we have found the right lens to look at the model complexity of time-series data,” says senior author Devavrat Shah, the Andrew and Erna Viterbi Professor in EECS and a member of the Institute for Data, Systems, and Society and of the Laboratory for Information and Decision Systems.

Joining Alomar and Shah on the paper is lead author Anish Agrawal, a former EECS graduate student who is currently a postdoc at the Simons Institute at the University of California at Berkeley. The research will be presented at the ACM SIGMETRICS conference.


Adapting a New Algorithm

Shah and his collaborators have been working on the problem of interpreting time-series data for years, adapting different algorithms and integrating them into tspDB as they built the interface.

About four years ago, they learned about a particularly powerful classical algorithm, called singular spectrum analysis (SSA), that imputes and forecasts single time series. Imputation is the process of replacing missing values or correcting past values. While this algorithm required manual parameter selection, the researchers suspected it could enable their interface to make effective predictions using time series data. In earlier work, they removed this need to manually intervene for algorithmic implementation. 

The algorithm for single time series transformed it into a matrix and utilized matrix estimation procedures. The key intellectual challenge was how to adapt it to utilize multiple time series.  After a few years of struggle, they realized the answer was something very simple: “Stack” the matrices for each individual time series, treat it as a one big matrix, and then apply the single time-series algorithm on it.

This utilizes information across multiple time series naturally — both across the time series and across time, which they describe in their new paper.

This recent publication also discusses interesting alternatives, where instead of transforming the multivariate time series into a big matrix, it is viewed as a three-dimensional tensor. A tensor is a multi-dimensional array, or grid, of numbers. This established a promising connection between the classical field of time series analysis and the growing field of tensor estimation, Alomar says.

“The variant of mSSA that we introduced actually captures all of that beautifully. So, not only does it provide the most likely estimation, but a time-varying confidence interval, as well,” Shah says.


The Simpler, the Better

They tested the adapted mSSA against other state-of-the-art algorithms, including deep-learning methods, on real-world time-series datasets with inputs drawn from the electricity grid, traffic patterns, and financial markets.

Their algorithm outperformed all the others on imputation and it outperformed all but one of the other algorithms when it came to forecasting future values. The researchers also demonstrated that their tweaked version of mSSA can be applied to any kind of time-series data.

“One reason I think this works so well is that the model captures a lot of time series dynamics, but at the end of the day, it is still a simple model. When you are working with something simple like this, instead of a neural network that can easily overfit the data, you can actually perform better,” Alomar says.


The impressive performance of mSSA is what makes tspDB so effective, Shah explains. Now, their goal is to make this algorithm accessible to everyone.

One a user installs tspDB on top of an existing database, they can run a prediction query with just a few keystrokes in about 0.9 milliseconds, as compared to 0.5 milliseconds for a standard search query. The confidence intervals are also designed to help nonexperts to make a more informed decision by incorporating the degree of uncertainty of the predictions into their decision making.

For instance, the system could enable a nonexpert to predict future stock prices with high accuracy in just a few minutes, even if the time-series dataset contains missing values.

Now that the researchers have shown why mSSA works so well, they are targeting new algorithms that can be incorporated into tspDB. One of these algorithms utilizes the same model to automatically enable change point detection, so if the user believes their time series will change its behavior at some point, the system will automatically detect that change and incorporate that into its predictions.

They also want to continue gathering feedback from current tspDB users to see how they can improve the system’s functionality and user-friendliness, Shah says.

“Our interest at the highest level is to make tspDB a success in the form of a broadly utilizable, open-source system. Time-series data are very important, and this is a beautiful concept of actually building prediction functionalities directly into the database. It has never been done before, and so we want to make sure the world uses it,” he says.

“This work is very interesting for a number of reasons. It provides a practical variant of mSSA which requires no hand tuning, they provide the first known analysis of mSSA, and the authors demonstrate the real-world value of their algorithm by being competitive with or out-performing several known algorithms for imputations and predictions in (multivariate) time series for several real-world data sets,” says Vishal Misra, a professor of computer science at Columbia University who was not involved with this research. “At the heart of it all is the beautiful modeling work where they cleverly exploit correlations across time (within a time series) and space (across time series) to create a low-rank spatiotemporal factor representation of a multivariate time series. Importantly this model connects the field of time series analysis to that of the rapidly evolving topic of tensor completion, and I expect a lot of follow-on research spurred by this paper.”


Suggested Reading


Are Economic Excesses Creating Investment Opportunity?


Retail Investors May Soon See More Safety Measures Including Coursework and Testing


How Your Data is Used to Generate Big Returns


What Makes a Country a Tax Haven?


Stay up to date. Follow us:


Chakana Copper (CHKKF) Scheduled to Present at NobleCon18 Investor Conference


Chakana Copper President & CEO David Kelley provides a preview of their upcoming presentation at NobleCon18

NobleCon18 – Noble Capital Markets 18th Annual Small and Microcap Investor Conference – April 19-21, 2022 – Hard Rock, Hollywood, FL 100+ Public Company Presentations | Scheduled Breakouts | Panel Presentations | High-Profile Keynotes | Educational Sessions | Receptions & Networking Events

Free Registration Available – More Info


Research News and Advanced Market Data on CHKKF


NobleCon18 Presenting Companies

About Chakana Copper

Chakana Copper Corp. is a Canadian based minerals exploration company and through its wholly owned Peruvian subsidiary, Chakana Resources S.A.C., is currently advancing the Soledad project near Aija, in the Ancash region of the highly prolific Miocene mineral belt of Peru.

Wesana Health (WSNAF) Scheduled to Present at NobleCon18 Investor Conference


Wesana Health CEO Daniel Carcillo provides a preview of their upcoming presentation at NobleCon18

NobleCon18 – Noble Capital Markets 18th Annual Small and Microcap Investor Conference – April 19-21, 2022 – Hard Rock, Hollywood, FL 100+ Public Company Presentations | Scheduled Breakouts | Panel Presentations | High-Profile Keynotes | Educational Sessions | Receptions & Networking Events

Free Registration Available – More Info


News and Advanced Market Data on WSNAF


NobleCon18 Presenting Companies

About Wesana

Wesana Health?helps people transcend barriers in mental health and performance. We innovate in care development through our therapies and patent-pending protocols, and in care delivery through activating a new multidisciplinary, technology-supported clinical model. Learn more at?www.wesanahealth.com.

Release – Gray Sets Date For First Quarter Earnings Release And Earnings Conference Call


Gray Sets Date For First Quarter Earnings Release And Earnings Conference Call

Research, News, and Market Data on Gray Television


ATLANTA, March 31, 2022 (GLOBE NEWSWIRE) — Gray Television, Inc. (NYSE: GTN) today announced that it will release its earnings results for the quarter ending March 31, 2022 on Friday, May 6, 2022.

 Earnings Conference Call Information
Gray Television, Inc. will host a conference call to discuss its operating results for the quarter ended March 31, 2022, on Friday, May 6, 2022. The call will begin at 11:00 a.m. Eastern Time. The live dial-in number is 1-855-493-3489 and the confirmation code is 8298523. The call will be webcast live and available for replay at www.gray.tv. The taped replay of the conference call will be available at 1-855-859-2056 Confirmation Code: 8298523 until June 6, 2022.

About Gray Television
Gray Television, Inc. is a multimedia company headquartered in Atlanta, Georgia. We are the nation’s largest owner of top-rated local television stations and digital assets in the United States that serve 113 television markets reaching approximately 36 percent of US television households. This portfolio includes 80 markets with the top-rated television station and 100 markets with the first and/or second highest rated television station. We also own video program companies Raycom Sports, Tupelo Honey, and PowerNation Studios, as well as Third Rail Studios.


Contact Data

Gray Contacts:
Website: www.gray.tv
Jim Ryan, Executive Vice President and Chief Financial Officer, 404-504-9828
Kevin P. Latek, Executive Vice President, Chief Legal and Development Officer, 404-266-8333

Voyager Digital (VYGVF)(VOYG:CA) – A Speed Bump in the Road

Thursday, March 31, 2022

Voyager Digital (VYGVF)(VOYG:CA)
A Speed Bump in the Road

Voyager Digital Ltd through its subsidiary, operates as a crypto asset broker that provides retail and institutional investors with a turnkey solution to trade crypto assets. The company offers investors execution, data, wallet and custody services through its institutional-grade open architecture platform.

Joe Gomes, Senior Research Analyst, Noble Capital Markets, Inc.

Joshua Zoepfel, Research Associate, Noble Capital Markets, Inc.

Refer to the full report for the price target, fundamental analysis, and rating.

    In the Cross Hairs. Yesterday, Voyager reported that is aware of or had received cease and desist orders from a number of states in respect to Voyager accounts that permit customers to earn rewards on their crypto balances. The actions by the states appears to be similar to what happened to Blockfi in February this year.

    Voyager Response.  The Company stated, “Voyager is firmly convinced that its Earn Program and the Voyager Earn Accounts are not securities and intends to demonstrate its position and defend it as necessary and appropriate.” Voyager is seeking clarification of the terms of each of these regulatory orders, including effective dates and how proposed civil penalties in respect of alleged violations are …


This Company Sponsored Research is provided by Noble Capital Markets, Inc., a FINRA and S.E.C. registered broker-dealer (B/D).

*Analyst certification and important disclosures included in the full report. NOTE: investment decisions should not be based upon the content of this research summary. Proper due diligence is required before making any investment decision. 


Motorsport Games (MSGM) – Likely To Be A Reset Year

Thursday, March 31, 2022

Motorsport Games (MSGM)
Likely To Be A Reset Year

Motorsport Games, a Motorsport Network company, combines innovative and engaging video games with exciting esports competitions and content for racing fans and gamers around the globe. The Company is the officially licensed video game developer and publisher for iconic motorsport racing series, including NASCAR, INDYCAR, 24 Hours of Le Mans and the British Touring Car Championship (“BTCC”), across PC, PlayStation, Xbox, Nintendo Switch and mobile. Motorsport Games is an award-winning esports partner of choice for 24 Hours of Le Mans, Formula E, BTCC, the FIA World Rallycross Championship and the eNASCAR Heat Pro League, among others. The company’s IPO was in January 2021, and it is headquartered in Miami, FL. For more information about Motorsport Games, visit www.motorsportgames.com.

Michael Kupinski, Director of Research, Noble Capital Markets, Inc.

Patrick McCann, Research Associate, Noble Capital Markets, Inc.

Refer to the full report for the price target, fundamental analysis, and rating.

    Q4 misses, but better than feared. The company reported Q4 revenue of $8.2 million, 41.9% below our forecast of $14.2 million. Adj. EBITDA for the quarter was negative at a loss of $5.433 million compared with our forecast of $1.250 million.

    Slow off the block.  The disappointing Q4 was due largely to an underwhelming launch of the company’s new game, NASCAR 21: Ignition. The game’s 2021 sales trailed that of its predecessor, NASCAR Heat 5 in 2020. We believe that the company is focused on 2023 when the company is expected to have a stable of franchise product offerings …


This Company Sponsored Research is provided by Noble Capital Markets, Inc., a FINRA and S.E.C. registered broker-dealer (B/D).

*Analyst certification and important disclosures included in the full report. NOTE: investment decisions should not be based upon the content of this research summary. Proper due diligence is required before making any investment decision. 


Flotek Industries (FTK) – Results slightly below expectations but story has shifted to new partnership

Thursday, March 31, 2022

Flotek Industries (FTK)
Results slightly below expectations but story has shifted to new partnership

Flotek Industries, Inc. creates solutions to reduce the environmental impact of energy on air, water, land and people. Flotek Industries, Inc. is a technology-driven, specialty chemistry and data company that helps customers across industrial, commercial and consumer markets improve their Environmental, Social and Governance performance. Flotek’s Chemistry Technologies segment develops, manufactures, packages, distributes, delivers, and markets high-quality cleaning, disinfecting and sanitizing products for commercial, governmental and personal consumer use. Additionally, Flotek empowers the energy industry to maximize the value of their hydrocarbon streams and improve return on invested capital through its real-time data platforms and green chemistry technologies. Flotek serves downstream, midstream and upstream customers, both domestic and international. Flotek is a publicly traded company headquartered in Houston, Texas, and its common shares are traded on the New York Stock Exchange under the ticker symbol “FTK.” For additional information, please visit Flotek’s web site at www.flotekind.com.

Michael Heim, Senior Research Analyst, Noble Capital Markets, Inc.

Refer to the full report for the price target, fundamental analysis, and rating.

    Results below expectations. Flotek reported 4Q and 2021 revenues near expectations but higher COGS and SGA costs meant EBITDA and earnings were below our forecasts. Adjusted EBITDA for the fourth quarter and year were $(5.7) million and $(25.1) million respectively versus our estimates of $(4.1) and $(18.4) million. Net income was $(16.2) million and $(30.5) million versus our $(4.4) million and $(18.6) million due mainly to a $8.1 million goodwill impairment charge.

    Energy Chemistry results were good but Data Analytics took a step back.  Energy Chemistry revenues in the December quarter grew 32% quarter over quarter, well above our 15% estimate. Unfortunately, Data Analytics revenues in the most recent quarter declined 27% quarter over quarter and 53% year over year versus our estimate for flat results. We still believe the Data Analytics division is a hidden …


This Company Sponsored Research is provided by Noble Capital Markets, Inc., a FINRA and S.E.C. registered broker-dealer (B/D).

*Analyst certification and important disclosures included in the full report. NOTE: investment decisions should not be based upon the content of this research summary. Proper due diligence is required before making any investment decision. 


Kratos Demonstrates All-Digital Multi-Mission Edge Capability at the 37th Space Symposium


Kratos Demonstrates All-Digital Multi-Mission Edge Capability at the 37th Space Symposium

Research, News, and Market Data on Kratos Defense & Security Solutions


Will Preview the Industry’s First Implementation of DIFI Compliant Digital Terminal Capability Running on COTS Hardware

SAN DIEGO
March 31, 2022 (GLOBE NEWSWIRE) — 
Kratos Defense & Security Solutions, Inc. (Nasdaq: KTOS), a leading National Security Solutions provider, announced today that along with technology partner 
Kymeta, it will provide live demonstrations of an all-digital multi-mission capability at the 37th Annual Space Symposium in 
Colorado Springs, Colorado
April 4-7.

The demonstrations will include Kratos’ OpenSpace™ Satcom and RF Carrier Analysis virtual network functions running on a generic (x86) compute device that is digitally paired with a 
Kymeta electronically steered antenna (ESA) mounted inside a tactical H2 vehicle. This virtual architecture enables a universally deployable solution within a broad range of resilient ground station and cloud environments.

This demonstration highlights the first ever implementation of the industry interoperability standard developed by the 
Digital Intermediate Frequency Interoperability (DIFI) Consortium inside a terminal application. DIFI members include the 
U.S. DoD CIO, 
U.S. Army
U.S. Navy
U.S. Space Force, DISA, as well as key commercial companies, and the standard has already been specified in at least one 
U.S. defense-related RFP. The industry’s growing adoption of the DIFI standard supports the DoD’s digital transformation goals, as well as freeing operators from the vendor lock-in characterized by proprietary systems.

“This demonstration will show that critical satellite network operations can be made increasingly virtual, interoperable and software-defined all the way to the network’s edge,” said  Kevin Tobias, Director of Edge Products at Kratos. “It is another step forward in proving that the ground layer can enable multi-orbit networks and multi-mission operations, for example Satcom, space domain awareness (SDA) and ISR together as dynamic, virtualized applications, and all supporting the DoD’s digital transformation goals and JADC2 principles regarding open-standards and interoperability.”

Attendees at the 37th Annual Space Symposium can view these industry-first capabilities at the Kratos H2 located on site for demonstrations during exhibit hall hours, 
April 4-7, 2022. Visit Kratos booth 1140 in Bartolin Hall to schedule a demo.

About Kratos OpenSpace
Kratos’ OpenSpace family of solutions enables the digital transformation of satellite ground systems to become a more dynamic and powerful part of the space network. The family consists of three product lines: OpenSpace SpectralNet for converting satellite RF signals to be used in digital environments; OpenSpace quantum products, which are virtual versions of traditional hardware components; and the OpenSpace Platform, the first commercially available, fully orchestrated, software-defined ground system. These three OpenSpace lines enable satellite operators and other service providers to implement digital operations at their own pace and in ways that meet their unique mission goals and business models. For more information about the OpenSpace family visit http://KratosDefense.com/OpenSpace.

About Kratos Defense & Security Solutions

Kratos Defense & Security Solutions, Inc. (NASDAQ:KTOS) develops and fields transformative, affordable technology, platforms and systems for United States National Security related customers, allies and commercial enterprises. Kratos is changing the way breakthrough technology for these industries are rapidly brought to market through proven commercial and venture capital backed approaches, including proactive research and streamlined development processes. At Kratos, affordability is a technology and we specialize in unmanned systems, satellite communications, cyber security/warfare, microwave electronics, missile defense, hypersonic systems, training, combat systems and next generation turbo jet and turbo fan engine development. For more information go to www.KratosDefense.com.

Notice Regarding Forward-Looking Statements
Certain statements in this press release may constitute “forward-looking statements” within the meaning of the Private Securities Litigation Reform Act of 1995. These forward-looking statements are made on the basis of the current beliefs, expectations and assumptions of the management of Kratos and are subject to significant risks and uncertainty. Investors are cautioned not to place undue reliance on any such forward-looking statements. All such forward-looking statements speak only as of the date they are made, and Kratos undertakes no obligation to update or revise these statements, whether as a result of new information, future events or otherwise. Although Kratos believes that the expectations reflected in these forward-looking statements are reasonable, these statements involve many risks and uncertainties that may cause actual results to differ materially from what may be expressed or implied in these forward-looking statements. For a further discussion of risks and uncertainties that could cause actual results to differ from those expressed in these forward-looking statements, as well as risks relating to the business of Kratos in general, see the risk disclosures in the Annual Report on Form 10-K of Kratos for the year ended 
December 26, 2021, and in subsequent reports on Forms 10-Q and 8-K and other filings made with the 
SEC by Kratos.

Press Contact:
Yolanda White
858-812-7302 Direct

Investor Information:
877-934-4687
investor@kratosdefense.com

What is the PCE Price Index (In 500 Words or Less)?


The Lesser-Known Inflation Indicator is Preferred By Fed Officials


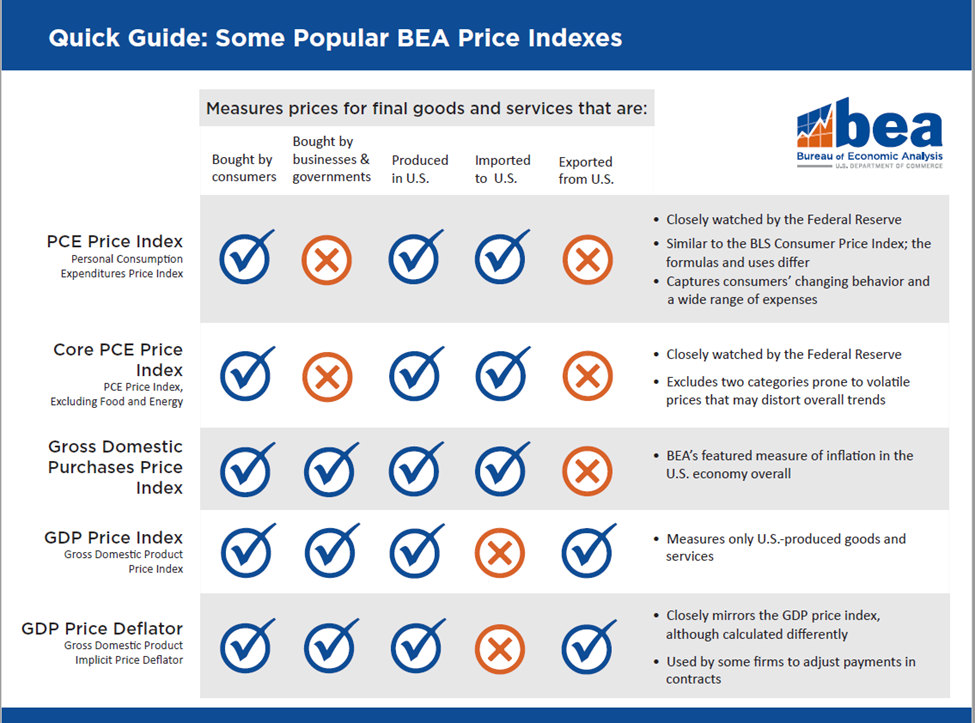
Most people quote inflation based on the Bureau of Labor Statistics Consumer Price Index or CPI.  But the metric the Federal Reserve is said to find more valuable is the Personal Consumption Expenditures Price Index, or PCE Price Index.

What is it that makes this measure considered more relevant to gauge inflation, and economic impact?

First, the number is composed of a very broad range of expenditures far broader than CPI. The PCE Price Index is also weighted by data reported through business surveys. Businesses account for and document transactions far better than households. CPI is consumer or household-based.

While CPI is based on a basket of goods and services that is revised infrequently, The PCE Price Index uses a formula that allows for changes in consumer behavior and changes that occur in the short term. For example, if gas prices rise and consumers drive less or switch to a lower octane fuel, this information is more useful than just noting that gas prices are up. These adjustments in consumer behavior are not made in the CPI calculation. This makes the PSE Price Index a more comprehensive metric for measuring price changes that impact the economy.


Advantages / Disadvantages of PCE Price Data

Personal consumption expenditures provide a glimpse of how the economy is going. When people are spending without any hesitation, it usually means that the economy is doing well. But when they cut back, it points to problems in the overall economic picture. Monitoring whether consumers are increasing spending, decreasing, or finding replacements that are less expensive is meaningful to recognizing and forecasting trends. This helps the Fed assess economic needs that may be assisted through monetary policy.

Source: Bureau of Economic Analysis


Stay up to date. Follow us:


Voyager News Release


Voyager News Release

Research, News, and Market Data on Voyager Digital


Voyager Digital Ltd. (TSX: VOYG; OTCQX: VYGVF; FRA: UCD2) is at the forefront of the rapidly evolving crypto industry, and is committed to providing the best experience for its customers.

On March 29, 2022, Voyager Digital LLC, Voyager Holdings Inc., and Voyager Digital Ltd. (together “Voyager” or the “Company”) received the following orders from certain state securities divisions that are members of a multistate working group of North American Securities Administrators Association in respect of the Voyager customer accounts that permit customers to earn rewards on their crypto balances (“Voyager Earn Accounts”).  Voyager is aware of or has received cease and desist orders from the state securities divisions of Indiana, Kentucky, New Jersey and Oklahoma, and orders to show cause or similar orders from the state securities divisions of Alabama, Texas, Vermont and Washington.  These state orders generally assert that Voyager was offering and selling securities or investment contracts in the form of Voyager Earn Accounts unregistered with the applicable state.

Voyager is in ongoing communications with these state regulators to better understand the terms in their respective regulatory orders and to clarify certain statements in the orders that Voyager believes are inaccurate.  If, as, and when effective, the orders will generally prohibit Voyager from offering new Voyager Earn Accounts or accepting additional assets into existing Voyager Earn Accounts in the impacted states.  If, as, and when effective, some of these orders will permit existing Voyager Earn Account customers to continue earning rewards on existing balances until Voyager hasresolved such orders.  Three of these orders disclose civil penalties that the applicable state intends to seek upon resolution.  Voyager is seeking clarification of the terms of each of these regulatory orders, including effective dates and how proposed civil penalties in respect of alleged violations are calculated and its due process rights.  It is Voyager’s expectation that most of these state orders will provide a transition period prior to becoming effective.

Voyager is firmly convinced that its Earn Program and the Voyager Earn Accounts are not securities and intends to demonstrate its position and defend it as necessary and appropriate.  Of course, Voyager supports appropriate regulation and will do its best to demonstrate to these regulators that Voyager has complied with the law.

   
About Voyager Digital Ltd.
Publicly traded, Voyager Digital Ltd.’s (TSX: VOYG) (OTCQB: VYGVF) (FRA: UCD2) US subsidiary, Voyager Digital, LLC, is a fast-growing, cryptocurrency platform in the United States founded in 2018 to bring choice, transparency, and cost efficiency to the marketplace. Voyager offers a secure way to trade over 100 different crypto assets using its easy-to-use mobile application. Through its subsidiary Coinify ApS, Voyager provides crypto payment solutions for both consumers and merchants around the globe. To learn more about the company, please visit https://www.investvoyager.com.
 
Forward Looking Statements

Certain information in this press release, including, but not limited to, statements regarding the Company’s interpretation of the state orders received, the intent, terms and effectiveness of the state orders, the expectation of clarification of such orders from the applicable states, future changes in laws and regulations or the interpretation thereof, the Company’s success and legal strategy in response to stat orders, future legislative change, the status and operation of the Voyager Earn Accounts, future growth and performance of the business, momentum in the businesses, future adoption of digital assets, and the Company’s anticipated results may constitute forward looking information (collectively, forward-looking statements), which can be identified by the use of terms such as “may,” “will,” “should,” “expect,” “anticipate,” “project,” “estimate,” “intend,” “continue” or “believe” (or the negatives) or other similar variations. Forward-looking statements involve known and unknown risks, uncertainties and other factors that may cause Voyager’s actual results, performance or achievements to be materially different from any of its future results, performance or achievements expressed or implied by forward-looking statements. Moreover, Voyager operates in a very competitive and rapidly changing environment. New risks emerge from time to time. It is not possible for Company management to predict all risks, the interpretation or application of existing laws by regulators, nor can Voyager assess the impact of all factors on Voyager business or the extent to which any factor, or combination of factors, may cause actual results to differ materially from those contained in any forward-looking statements Voyager may make. In light of these risks, uncertainties, and assumptions, the future events and trends discussed in this press release may not occur and actual results could differ materially and adversely from those anticipated or implied in the forward-looking statements. Forward looking statements are subject to regulatory risks, regulatory actions and claims, the risk of changes of laws or the interpretation or application thereof, the risk that the global economy, industry, or the Company’s businesses and investments do not perform as anticipated, that revenue or expenses estimates may not be met or may be materially less or more than those anticipated, that trading momentum does not continue or the demand for trading solutions declines, customer acquisition does not increase as planned, product and international expansion do not occur as planned, risks of compliance with laws and regulations that currently apply or become applicable to the business or the interpretation or application of laws and regulations by regulatory authorities, and those other risks contained in the Company’s public filings, including in its Management Discussion and Analysis and its Annual Information Form (AIF). Factors that could cause actual results of the Company and its businesses to differ materially from those described in such forward-looking statements include, but are not limited to, the ability of the Company to continue offering Voyager Earn Accounts and to offer products and services consistent with past offerings and continue to offer new and innovative products and services,  a decline in the digital asset market or general economic conditions; changes in laws or approaches to regulation or the interpretation or application thereof, regulatory investigations, enforcement actions or other regulatory action or sanction or proceedings, the failure or delay in the adoption of digital assets and the blockchain ecosystem by institutions; changes in the volatility of crypto currency, changes in demand for Bitcoin and Ethereum, changes in the status or classification of cryptocurrency assets, cybersecurity breaches, a delay or failure in developing infrastructure for the trading businesses or achieving mandates and gaining traction; failure to grow assets under management, an adverse development with respect to an issuer or party to the transaction or failure to obtain a required regulatory approval. In connection with the forward-looking statements contained in this press release, the Company has made assumptions regarding the terms and conditions of the state orders, its ability to seek clarification, its ability to continue with the Voyager Earn Accounts, it success in responding to any state orders or other regulatory enquiries, actions or claims and the applicability, interpretation and application of existing laws and regulations. Forward-looking statements, past and present performance and trends are not guarantees of future performance; accordingly, you should not put undue reliance on forward-looking statements, current or past performance, or current or past trends. Information identifying assumptions, risks, and uncertainties relating to the Company are contained in its filings with the Canadian securities regulators available at www.sedar.com. The forward-looking statements in this press release are applicable only as of the date of this release or as of the date specified in the relevant forward-looking statement and the Company undertakes no obligation to update any forward-looking statement to reflect events or circumstances after that date or to reflect the occurrence of unanticipated events. The Company assumes no obligation to provide operational updates, except as required by law. If the Company does update one or more forward-looking statements, no inference should be drawn that it will make additional updates with respect to those or other forward-looking statements, unless required by law. Readers are cautioned that past performance is not indicative of future performance and current trends in the business and demand for digital assets or in the application or interpretation of laws and regulations may not continue and readers should not put undue reliance on past performance and current trends.   All figures are in U.S. dollars unless otherwise noted.

The TSX has not approved or disapproved of the information contained herein.

SOURCE Voyager Digital, Ltd.

Press Contacts

Voyager Digital, Ltd.

Michael Legg
Chief Communications Officer
(212) 547-8807
mlegg@investvoyager.com

Voyager Public Relations Team
pr@investvoyager.com

Are Economic Excesses Creating Investment Opportunity?


Image Credit: Monstera (Pexels)


Tilt Confidently – A Perspective on Financial Markets and the Economy


Tilt Confidently

Economic excesses often create potential investment opportunities. When a key economic factor reaches a ridiculous level, it frequently proves profitable to expect a reversal: Recall the 10-year bond yield at 0.5% in mid-2020 (those who tilted investment bets toward rising-yield beneficiaries have since profited)—or the early-1981 extreme of 16%? Another example was 1995, when the U.S. dollar spiked to levels never seen before—nor since. In the 1990s, the labor participation rate peaked near 68% after having never risen above 60% prior to 1970. And, in the mid-1990s, following a decline of nearly 20% from its 1973 post-war high, the real-wage rate finally bottomed.

Although short-term timing on any economic trend is always a challenge, when something gets severely out of bounds, the favored odds are that it is apt to soon adjust. Today, there are several matters that could be considered remarkably out of the norm, including economic policies, inflation, various commodity prices, and geopolitical turmoil. However, in our view, the greatest economic extreme, at this time, is “confidence.”


Extreme Main-Street Pessimism?

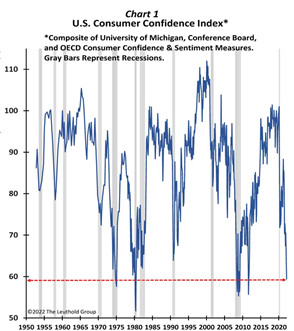
Chart 1 shows a measure of U.S. consumer confidence from the 1950s to date. At present, confidence is lower than 98.5% of the time since 1952! Obviously, pessimism is at an extreme—there have been only a handful of readings as low as today. But what makes this extraordinarily uncommon is, for the last two years, confidence has plummeted while stocks have been in a strong bull market driven by a robust economic recovery. Yes, inflation is currently very high, and there is a war in Ukraine. All the same, inflation was even higher, for longer, in the 1970s when the Vietnam War was ongoing, and, yet, outside of recessions, consumer confidence sustained at much higher levels.

Nearly every significant decay in confidence occurred when the U.S. was in a recession. While an imminent recession is always possible, the likelihood that the U.S. is now in a recession—or even headed for one this year—seems rather remote. Outside of recessions, there was only one other time that confidence was as low as it is today: After a solid recovery in confidence at the start of the 2009 expansion, there was a brief confidence breakdown in mid-2011. Then, renewed fears that the expansion would fail is probably why confidence again declined. Those fears, however, proved unfounded; confidence quickly revived and embarked on a multi-year advance until the 2020 pandemic.

Is confidence about the contemporary expansion following a similar path? It bounced from about 70 to 90 during the first year of this recovery, but since last April, it has again collapsed (like in 2011). Despite strong economic growth and the S&P 500 within 5% of its all-time high, Main Street confidence remains depressed due to a combination of Federal Reserve and interest-rate fears, the highest inflation rate in decades, and Putin’s war.

In our view, even if some or all of these fears continue to fester, confidence will not likely fall much further. Indeed, it would truly be “extreme” if it did. Rather, some of the current nightmares facing the recovery will probably turn out better than feared, causing Main Street sentiment to soon lift, as it did after its 2011 break- down.

According to a Bloomberg survey of private-sector economists, the consensus for U.S. real-GDP growth in 2022 is a robust 3.5%. With Main Street characterized by excessive pessimism and solid real growth, in our view, an opportunity exists for investors to exploit the likelihood that confidence is poised to rise.

Portfolio Tilts For “Rising Confidence?”

Confidence as subdued as today’s is reminiscent of being in a recession that is nearing the start of a new economic expansion. Consequently, many of the investment options highlighted here are typically favored in the infancy of a new economic expansion. It is very odd for conviction to be so low when starting the third year of a recovery.

Nonetheless, if confidence does perk up from today’s extraordinarily low level—whether it is the start of a new expansion or the third year of an ongoing recovery—greater enthusiasm will likely run through both the economy and the stock market in a fashion similar to how it has traditionally done in a fresh recovery.

The following charts illustrate six distinct investments whose relative performance corresponds closely with consumer confidence. Investors may want to consider some of these as possible portfolio tilts.


1. Cyclicals Need Some Confidence!

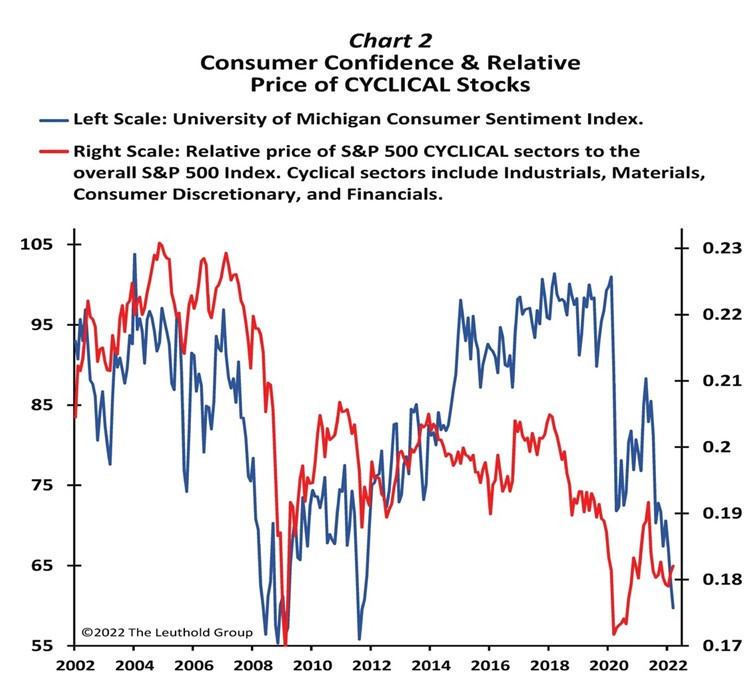
Chart 2 overlays the relative return of the S&P 500’s major cyclical sectors with the Consumer Confidence Index. At least since 2002, there has been a close relationship between cyclical stock leadership and Main Street confidence. Indeed, cyclicals led after the March 2020 bear-market bottom until May 2021, when confidence rolled over. Could cyclical stocks be nearing a “mini-replay” of 2020, driven by a renewed spike in consumer confidence?


2. Low Quality?

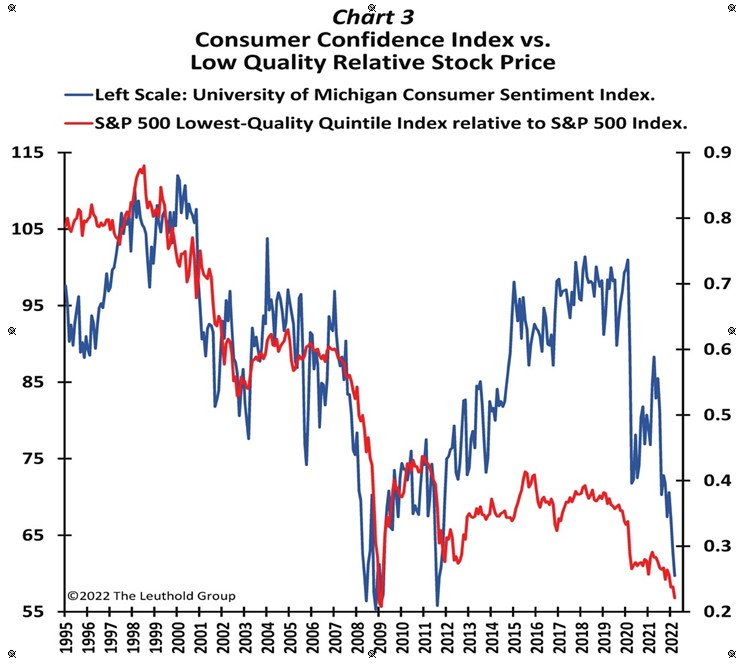
With the S&P 500 Index still trying to recover from a recent correction, and yields rising at an aggressive pace, most are advocating to boost the “quality” in portfolios. However, as illustrated in Chart 3, not only is the relative price of low-quality stocks nearly the same today as at the bottom of the 2009 bear market, but a trend of improved confidence could prompt a period of leadership for low-quality stocks.


3. High-Beta’s Run To Continue?

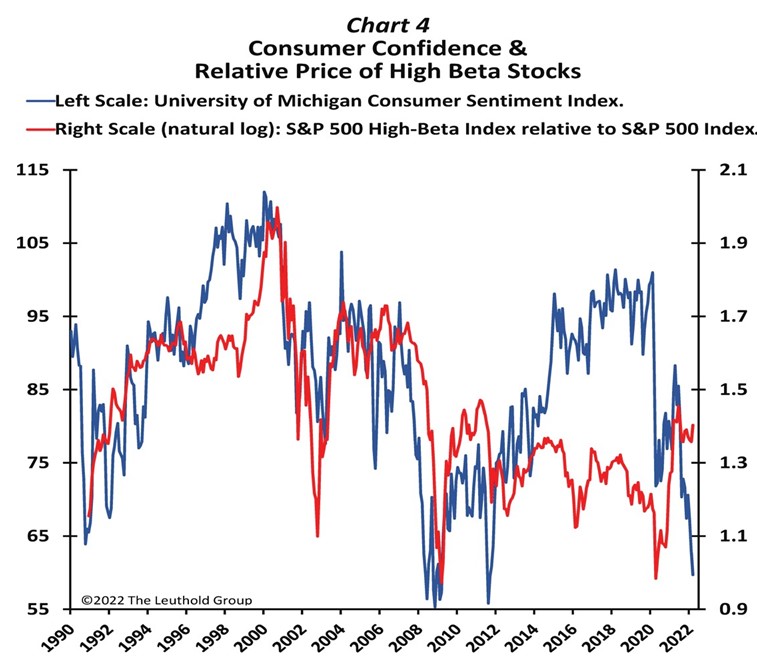
High-beta stocks have led the stock market throughout most of this bull run (Chart 4) and may continue to be superior investments should Main Street confidence finally improve. Most recently, after confidence peaked last May, high-beta has slightly underperformed but has not suffered as aggressively as other confidence-sensitive investments. Nevertheless, since at least 1990, it has paid to be overweight high-beta stocks during periods of improving confidence.


4. An IPO Leadership Replay?

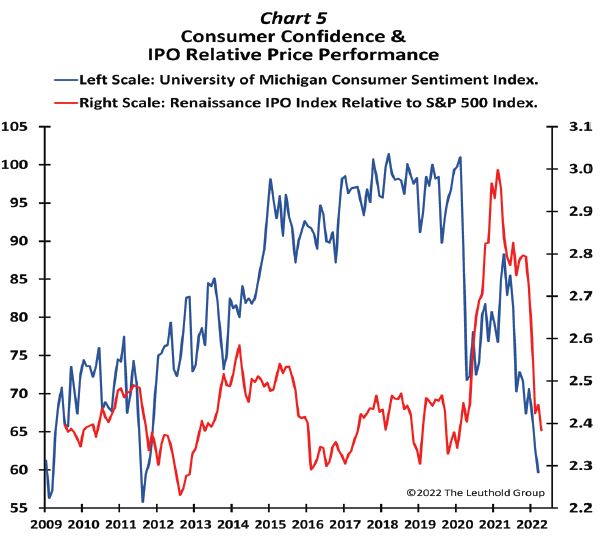
IPOs and SPACs had a massive run earlier in this bull market, followed by an epic collapse (Chart 5). The pattern is similar to the surge and plunge of Main Street confidence. While far from a perfect relationship, since at least 2009, when confidence improved, IPOs directionally outpaced. Likewise, periods of rising pessimism on Main Street have been associated with underperforming IPOs. Many perceive the IPO run as a speculative frenzy that has now been left for dead. Is it possible, though, if confidence again turns up, IPOs could have another “curtain call” in the balance of this bull market?


5. Smaller Cap For A Confidence Run!

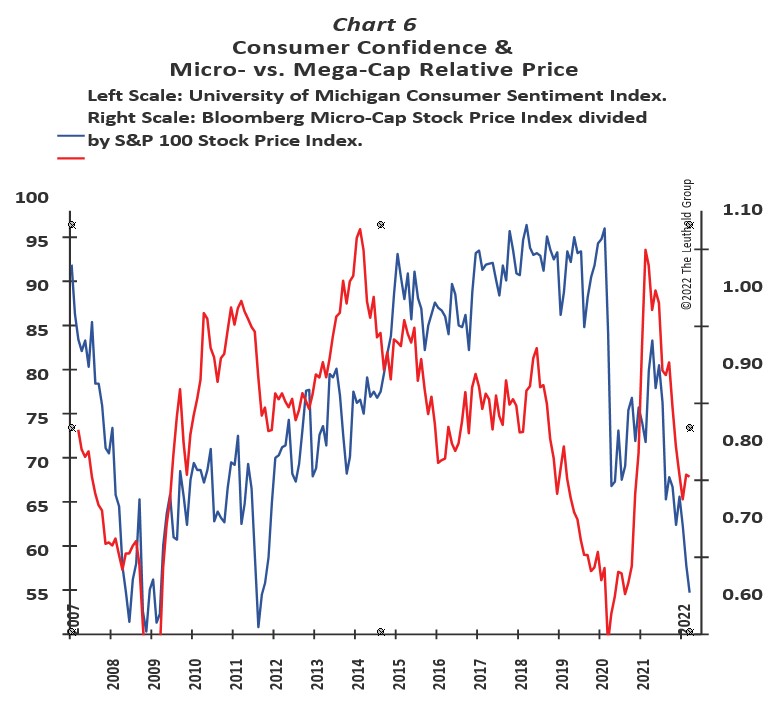
Not surprisingly, as illustrated by Chart 6, smaller-cap stocks do best when consumer confidence rises. The blue line represents the price return of micro-cap stocks relative to mega-caps. The notable periods when consumer confidence surged (2009, 2011, and 2020) were all associated with solid leadership by microcap stocks. As confidence collapsed over the last year, versus the largest stocks, micro caps have relinquished about two-thirds of their cumulative outperformance since this bull market began in March 2020. If consumer confidence is poised for another revival, it may be time to tilt away from your mega-cap winners toward smaller stocks!


6. Tilting Toward EM Debt?

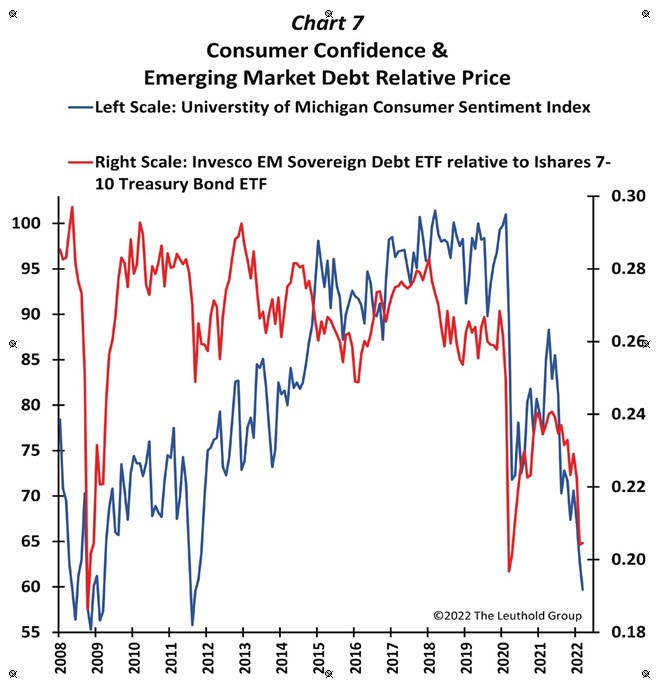
It is not obvious why EM debt tends to outpace when U.S. consumers are confident. As shown in Chart 7, since 2008, EM debt has significantly rewarded investors whenever Main Street sentiment was improving. Currently, the price of EM debt relative to Treasuries is nearly as low as it was at the stock-market bottoms of 2009 and 2020. It is not a coincidence these were periods when consumer confidence had also declined substantially. This chart is a good reminder that if Main Street confidence does soon improve, investors may need to adjust exposure to bonds as well as stocks.


Final Comments


Consumer confidence is now as low—or lower— than it has been in any recession in the post-war era. Considering that economic growth looks healthy and the stock market is near record highs, today’s excessive level of Main Street pessimism is odd.

Understandably, many investments that typically do poorly as pessimism rises have been severe underperformers in the last year. Even if a recession is imminent, neither consumer confidence nor sentiment-sensitive investments are likely to do much worse because both are already priced for a recession. But should today’s economic fears prove overblown, Main Street confidence is likely headed for a substantial recovery that should boost the relative results of a number of investments, including cyclicals, low-quality, high-beta, IPOs, small caps, and EM debt.

If you, too, believe there is simply too much pessimism today, get your shopping list ready and “Tilt Confidently.”


The above was reprinted with permission from Paulsen’s Perspective an institutional newsletter published by THE LEUTHOLD GROUP.

Authored by James W Paulsen, Ph.D.  Chief Investment Strategist of The Leuthold Group, LLC. Jim is a member of the investment committee, authors market and economic commentary, and works with the Leuthold investment team in serving institutional, financial advisor, and investment professional clients.
The Leuthold Group has been producing original analysis for the institutional marketplace for nearly half a century. Driven by the research, its investment management arm is centered on tactical asset allocation and disciplined quantitative methodologies.


Stay up to date. Follow us: