Comstock Mining (LODE) – Aligning Business Plans with the EPAs Renewable Fuels Standards

Monday, February 14, 2022

Comstock Mining (LODE)
Aligning Business Plans with the EPA’s Renewable Fuels Standards

Comstock Mining Inc. is an emerging innovator and leader in the sustainable extraction, valorization, and production of scarce natural resources, with a focus on high value strategic materials that are essential to meeting the rapidly increasing global demand for clean energy, carbon-neutrality, and natural products.

Mark Reichman, Senior Research Analyst of Natural Resources, Noble Capital Markets, Inc.

Refer to the full report for the price target, fundamental analysis, and rating.

    Laying the groundwork. Comstock Mining released comments submitted to the U.S. Environmental Protection Agency (EPA) proposing changes to renewable fuel standard rules governing the use of biomass-derived intermediates in the production of renewable fuels that qualify for federal incentives under the EPA’s Renewable Fuel Standard (RFS) program. Recall the company’s cellulosic fuels extraction and processing technologies are designed to convert woody biomass into renewable energy products, including carbon-neutral bio-intermediates and other precursors for renewable fuels.

    Proposed changes to RFS rules.  Comstock proposes that the EPA: 1) expand definitions of biocrude, bio-intermediates, and renewable biomass to include bio-intermediates produced by thermal, chemical, and biological processes, 2) add qualifying feedstocks for use in generating renewable identification numbers (RINs), 3) remove limits on multi-facility bio-intermediate transfers, 4) add new RIN …


This Company Sponsored Research is provided by Noble Capital Markets, Inc., a FINRA and S.E.C. registered broker-dealer (B/D).

*Analyst certification and important disclosures included in the full report. NOTE: investment decisions should not be based upon the content of this research summary.  Proper due diligence is required before making any investment decision. 

How Last Year’s Retail Traders Have Transformed


Image Credit: Diverse Stock Photos (Flickr)


Individual Investors are Finding Investment Styles to Match Today’s Market Landscape


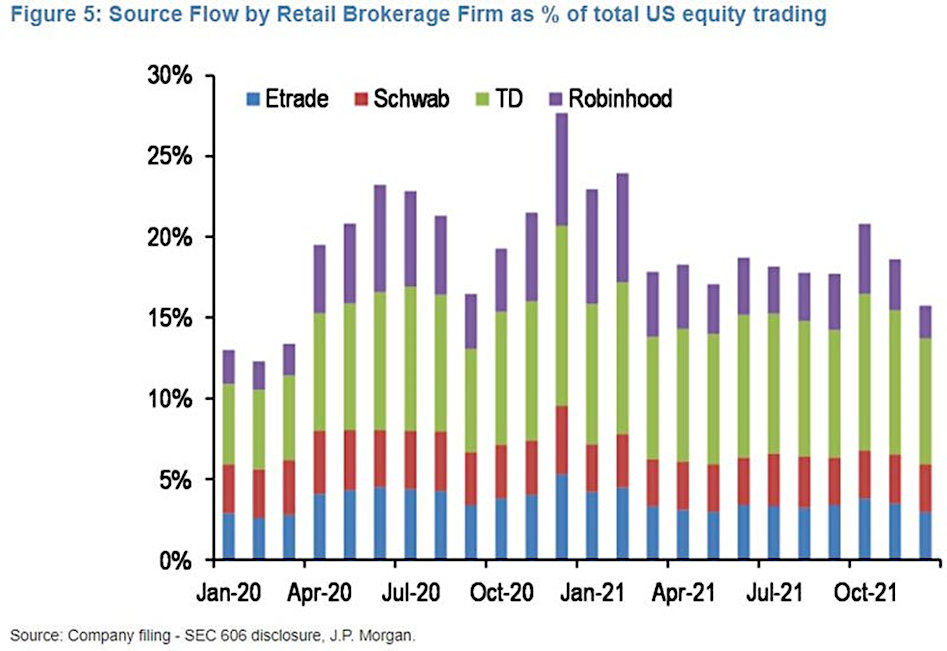
In a research note last week, JP Morgan (JPM) wrote that Self Directed Investors influence over the direction of stocks, and the overall market is declining. A decline in trading activity was confirmed by the number of transactions at Robinhood and other brokers and even r/wallstreetbets activity. The accounts are still exposed to the stock market according to JPM, their exposure however has shifted.

Past Circumstance

While other venues of “entertainment” or “past times” were idle, the stock market never closed in response to the reality of coronavirus. This helped create over a year of focused retail trading. The booming stock market rewarded its participants and even became a source of entertainment for some.  Many who had free time at home with their stimulus checks, perhaps deferring their mortgage or rent payments, joined the online trading craze that included social media interaction, and meme stock potential riches. This set of circumstances is now unwinding, and retail investors are doing less “me too” trading and investing their assets using more hands-off, long-term methods.

The JPM research note reported that the online trading app Robinhood experienced a decline in stock market transactions in December. The level of trading approached the pre-pandemic activity level. While Robinhood is a focus of many newer market participants, a decline in trading activity was also observed at other retail brokerage firms, including E*Trade and Charles Schwab.


The note also points to reduced activity on popular stock market social media forums like those on Reddit. The Reddit WallStreetBets community boomed from about 1.5 million Redditors in 2020 to more than 11 million current subscribers. JPM says that growth has plateaued, and the daily number of comments has fallen well below the peak one year ago.

The decline in trading and sharing stock ideas (and memes) coincides with the decline in value of high-flying stocks that drew the attention of investors with their spectacular growth in 2020/21. Many of these stocks that retail investors helped drive to dizzying levels have since given up all of their gains. These include Netflix, Peloton, and PayPal. “Whether one looks at the proportion of retail investors in total US stock trading or the number of stocks traded by retail investors, it is clear that US retail activity had peaked at the beginning of 2021 with diminishing peaks since then,” JPMorgan said.

Take-Away

While retail investors are abandoning the type of trades they put on in 2020 and 2021, they are still sticking with equity funds, with strong 2021 inflows into equity ETFs and mutual funds continuing into 2022, the JPM said. It’s unclear if this is due to less time to be involved, or market softness providing fewer hyped stocks. At Channelchek we have noticed a surge in traffic to our research and articles. In January 2022 we experienced a record number of visitors to our sight, presumably searching for more fundamental analysis and actionable opportunities.

Channelchek is a no-cost distribution platform for small and microcap equity research. These are the stocks that have the potential to reward investors that have a longer time horizon. Given the information provided by JPM, it is no wonder Reddit WSB traffic which has been more short-term trading oriented has declined, while Channelchek continues to see new sign-ups and is breaking records with the pace of visitors.

Paul Hoffman

Managing Editor, Channelchek


Suggested Reading


Super Bowl is Set to Become the Biggest Legal Gambling Event in Football History


Analyst Sees Evidence these Sectors are Just Beginning to Benefit from Reduced Mandates


How Much is Spent Saying ‘I Love You’ on Valentine’s?


The Big Challenges for Supply Chains in 2022


Sources

https://am.jpmorgan.com/content/dam/jpm-am-aem/global/en/insights/portfolio-insights/ltcma/ltcma-full-report.pdf

https://www.thestreet.com/investing/jp-morgan-stocks-far-from-over

https://markets.businessinsider.com/news/stocks/retail-investors-influence-over-stock-market-declining-meme-stock-mania-2022-2?utm_medium=ingest&utm_source=markets


Stay up to date. Follow us:


Encore Energy Receives Uranium Production License For Dewey Burdock, South Dakota


Encore Energy Receives Uranium Production License For Dewey Burdock, South Dakota

Research, News, and Market Data on enCore Energy


CORPUS CHRISTI, TexasFeb. 14, 2022 /PRNewswire/ – enCore Energy Corp. (“enCore” or the “Company“) (TSXV: EU) (OTCQB: ENCUF) is pleased to announce the U.S. Nuclear Regulatory Commission (“NRC“)  has accepted the change of control, to enCore, of the Dewey Burdock Source and By-Product Materials License.     

Chief Executive Officer Paul Goranson stated “enCore appreciates the speed of the NRC in handling our license transfer from the Azarga acquisition. This license, issued in 2014 by the NRC, authorizes the production of uranium using in-situ recovery technologies at the Company’s Dewey-Burdock Project located in South Dakota, a key component in enCore Energy’s mid and long term production objective.  Our immediate production focus remains our South Texas Rosita ISR uranium project, now under development, with a planned production date of 2023.

The Company also announces that it has granted incentive stock options (the “Options”) to certain of its directors, officers, employees and consultants to purchase an aggregate of up to 7,090,000 common shares in the capital of the Company at a price of $1.40 per share for a five year period, in accordance with its Stock Option Plan.  Vesting will occur over a period of twenty-four months, with an initial 25% of the Options vesting six months following the date of grant, followed by an additional 25% of the Options every six months thereafter until fully vested.

The Company also announces it has terminated the previously announced capital market advisory contract with Red Cloud Securities Inc. and Red Cloud Financial Services Inc. The Company also thanks Red Cloud for their support and contributions.

About enCore Energy Corp.

With approximately 90 million pounds of U3O8 estimated in the measured and indicated categories and 9 million pounds of U3O8 estimated in the inferred category1 enCore is the most diversified in-situ recovery uranium development company in the United States. enCore is focused on becoming the next uranium producer from its licensed and past-producing South Texas Rosita Processing Plant by 2023. The South Dakota-based Dewey Burdock project and the Wyoming Gas Hills project offer mid-term production opportunities with significant New Mexico uranium resource endowments providing long term opportunities. The enCore team is led by industry experts with extensive knowledge and experience in all aspects of ISR uranium operations and the nuclear fuel cycle.

Dr. Douglas H. Underhill, CPG, the Company’s Chief Geologist and a Qualified Person under NI 43- 101, has approved the technical disclosure in this news release.

Mineral resource estimates are based on technical reports prepared pursuant toNI43-101 and available on SEDAR as well as company websites at www.encoreuranium.com and www.azargauranium.com.

www.encoreuranium.com

Certain information contained herein constitutes forward-looking information or statements under applicable securities legislation and rules. All statements, other than statements of historical fact, are forward-looking statements. Forward-looking statements are frequently identified by such words as may, will, plan, expect, anticipate, estimate, intend, indicate, scheduled, target, goal, potential, subject, efforts, option and similar words, or the negative connotations thereof, referring to future events and results. There can be no assurance that such statements will prove to be accurate.  Readers should not place undue reliance on forward-looking statements. This press release shall not constitute an offer to sell or the solicitation of an offer to buy the enCore common shares, nor shall there be any offer or sale of the enCore common shares in any jurisdiction in which such offer, solicitation or sale would be unlawful.

Neither the TSX, the TSX Venture Exchange nor its Regulation Services Provider (as that term is defined in the policies of the TSX and TSX Venture Exchange) accepts responsibility for the adequacy or accuracy of this release.

SOURCE enCore Energy Corp.

Comstock Mining (LODE) – Aligning Business Plans with the EPA’s Renewable Fuels Standards

Monday, February 14, 2022

Comstock Mining (LODE)
Aligning Business Plans with the EPA’s Renewable Fuels Standards

Comstock Mining Inc. is an emerging innovator and leader in the sustainable extraction, valorization, and production of scarce natural resources, with a focus on high value strategic materials that are essential to meeting the rapidly increasing global demand for clean energy, carbon-neutrality, and natural products.

Mark Reichman, Senior Research Analyst of Natural Resources, Noble Capital Markets, Inc.

Refer to the full report for the price target, fundamental analysis, and rating.

    Laying the groundwork. Comstock Mining released comments submitted to the U.S. Environmental Protection Agency (EPA) proposing changes to renewable fuel standard rules governing the use of biomass-derived intermediates in the production of renewable fuels that qualify for federal incentives under the EPA’s Renewable Fuel Standard (RFS) program. Recall the company’s cellulosic fuels extraction and processing technologies are designed to convert woody biomass into renewable energy products, including carbon-neutral bio-intermediates and other precursors for renewable fuels.

    Proposed changes to RFS rules.  Comstock proposes that the EPA: 1) expand definitions of biocrude, bio-intermediates, and renewable biomass to include bio-intermediates produced by thermal, chemical, and biological processes, 2) add qualifying feedstocks for use in generating renewable identification numbers (RINs), 3) remove limits on multi-facility bio-intermediate transfers, 4) add new RIN …


This Company Sponsored Research is provided by Noble Capital Markets, Inc., a FINRA and S.E.C. registered broker-dealer (B/D).

*Analyst certification and important disclosures included in the full report. NOTE: investment decisions should not be based upon the content of this research summary.  Proper due diligence is required before making any investment decision. 

EuroDry (EDRY) – Looking Beyond Seasonal Volatility

Monday, February 14, 2022

EuroDry (EDRY)
Looking Beyond Seasonal Volatility

EuroDry Ltd. was formed on January 8, 2018 under the laws of the Republic of the Marshall Islands and trades on the NASDAQ Capital Market under the ticker EDRY. EDRY is the product of a spin-off of the dry bulk fleet by Euroseas (ESEA) completed in May 2018. For every five ESEA shares, ESEA shareholders received one EDRY share. There are currently ~2.2 million EDRY shares outstanding. EuroDry operates in the dry bulk shipping markets. EuroDry’s operations are managed by Eurobulk Ltd., an affiliated ship management company, and Eurobulk FE (Far East) Ltd, which are responsible for the day-to-day commercial and technical management and operation of the fleet. EuroDry employs the fleet on spot and period charters and through pool arrangements.

Poe Fratt, Senior Research Analyst, Noble Capital Markets, Inc.

Refer to the full report for the price target, fundamental analysis, and rating.

    A solid quarter caps a strong year. Reported adjusted 4Q2021 EBITDA of $16.0 million included minimal dry dock expenses, which was ~$3.0 million higher than 3Q2021. TCE rates averaged $29,157/day. Reported adjusted 2021 EBITDA of $42.3 million included minimal dry dock expenses, which was well above 2020 adjusted EBITDA of $6.2 million. TCE rates averaged $24,222/day.

    Adjusting 2022 EBITDA estimate to $59.4 million based on TCE rates of $25.8k/day.  Visibility is limited with forward cover of 19% and seasonality is expected, but acquisitions and a well balanced dry bulk market set a good tone for this year. While visibility is low, operating leverage is very high; each $1.0k/day change in the BKI/BPI/BSI indices impacts cash flow by +/- $1.4 million, or …


This research is provided by Noble Capital Markets, Inc., a FINRA and S.E.C. registered broker-dealer (B/D).

*Analyst certification and important disclosures included in the full report. NOTE: investment decisions should not be based upon the content of this research summary.  Proper due diligence is required before making any investment decision. 

Grindrod Shipping (GRIN) – Results Out This Week – On Track for Strong 2022

Monday, February 14, 2022

Grindrod Shipping (GRIN)
Results Out This Week – On Track for Strong 2022

Grindrod Shipping, originated in South Africa with roots dating back to 1910. The company is based in Singapore, with offices around the world including, London, Durban, Cape Town, Tokyo and Rotterdam. Its primary listing is on Nasdaq and secondary listing on the JSE.

Grindrod Shipping owns and operates a diversified fleet of owned, long-term chartered and joint-venture dry-bulk and liquid-bulk vessels across the globe.

Poe Fratt, Senior Research Analyst, Noble Capital Markets, Inc.

Refer to the full report for the price target, fundamental analysis, and rating.

    2021 Results out this week — AMC on Wednesday February 16th. Management will host a 8:00am EST call on Thursday, February 17th. The number is 877-553-9962 and the code is Grindrod. With a larger owned fleet, a consistent cargo focused strategy and solid financial position, GRIN is well positioned to benefit from attractive dry bulk market fundamentals in 2022. In addition, options to acquire five chartered-in vessels represent built in growth opportunities.

    Expect strong finish to year.  No change to 4Q2021 and 2021 EBITDA estimates. Looking for 4Q2021 EBITDA of $67.3 million based on TCE rates of $30.3k/day for Supras/Ultras and $27.3k/day for Handys. The 4Q2021 forward cover of ~70% looked good with 1,579 Supra/Ultra operating days booked at $33.1k/day and 1,205 Handy days booked at $30.3k/day. Less days booked than 3Q2021, but at higher rates. Full …


This Company Sponsored Research is provided by Noble Capital Markets, Inc., a FINRA and S.E.C. registered broker-dealer (B/D).

*Analyst certification and important disclosures included in the full report. NOTE: investment decisions should not be based upon the content of this research summary.  Proper due diligence is required before making any investment decision. 

Kratos Defense & Security (KTOS) – Redeeming Secured Notes; Another UAV Contract

Monday, February 14, 2022

Kratos Defense & Security (KTOS)
Redeeming Secured Notes; Another UAV Contract

Kratos Defense & Security Solutions is a National Security technology provider with proprietary expertise in the area of unmanned aerial vehicles, electronics for missile defense systems, electronic warfare systems, satellite control and management systems and support services for emerging naval weapon systems. Commercial and state and local government revenues are about 25% of the total and comprise primarily of critical infrastructure monitoring and protection systems.

Joe Gomes, Senior Research Analyst, Noble Capital Markets, Inc.

Joshua Zoepfel, Research Associate, Noble Capital Markets, Inc.

Refer to the full report for the price target, fundamental analysis, and rating.

    Redemption. Late last week, Kratos announced an offer to redeem all of its outstanding $300 million 6.5% Senior Secured Notes due November 2025 on March 14, 2022. Simultaneous with the redemption offer, Kratos is refinancing its credit facility to pay for the redemption. The Company will provide additional details related to the refinancing transaction once it has been completed.

    Details.  The Notes will be redeemed for 103.25% of the principal amount plus accrued and unpaid interest. The redemption is expected to save the Company $10-$13 million in cash interest payments annually, based on current interest rates. Kratos will retain its significant cash position, $370 million as of the end of the third quarter, to support future growth, including potential future large …


This research is provided by Noble Capital Markets, Inc., a FINRA and S.E.C. registered broker-dealer (B/D).

*Analyst certification and important disclosures included in the full report. NOTE: investment decisions should not be based upon the content of this research summary.  Proper due diligence is required before making any investment decision. 

Allegiant to Commence 12,000+ Metres of Drilling at Eastside, Including Deep Drilling of High-Grade Zone


Allegiant to Commence 12,000+ Metres of Drilling at Eastside, Including Deep Drilling of High-Grade Zone

Research, News, and Market Data on Allegiant Gold


Completes Over 6 Km of Roadbuilding

RENO, Nevada, Feb. 14, 2022 (GLOBE NEWSWIRE) — Allegiant Gold Ltd. (“Allegiant” or the “Company”) (AUAU: TSX-V) (AUXXF: OTCQX) is pleased to announce the completion of additional road building at Eastside and the commencement of drilling to occur in March 2022.

Allegiant has recently built over 6 kilometres of additional roads over the past few months allowing direct access to the High-Grade Zone (“HGZ”) recently discovered in our last drilling program. The roads will also provide better access to the upcoming drill program at both the East Pediment and the Western Anomaly.

Allegiant plans to drill approximately 35 reverse circulation (“RC”) holes and 7 diamond core (“Core”) holes at Eastside in the upcoming drill program set to commence in March 2022 (see map below). Approximately 25 RC holes are planned at the East Pediment with an average depth of 200 metres per hole. At the Western Anomaly, Allegiant plans to drill 10 RC holes with an average depth of 300 metres per hole. The East Pediment drilling targets resistivity highs under shallow, alluvial cover (2-20 m.). The resistors have the same geophysical signatures as the rhyolite domes hosting most of the gold and silver in the area of past drilling at the Original Pit Zone (“OPZ”) Target. The West Anomaly drilling is targeting geochemical anomalies detected by surface sampling where gold values range from 0.5 g/t – 24 g/t gold with attendant pathfinder trace element signatures. To date, there has been no previous drilling on the East Pediment or the West Anomaly.

The 7 Core holes will have an average depth of 600 metres and are designed to test the recently discovered HGZ within the OPZ that yielded the following results:

  • Hole 243 included 2.55 g/t Au over 147.8 metres (3.17 g/t Au over 117.3m)
  • Hole 239 included 111.3m of 1.45 g/t Au including 3.1 metres of 39 g/t at the bottom of the hole.
  • Hole 244 included 76 metres of mineralization with best intercept being 6.1m of 1.48 g/t Au
  • Hole 245 included 15.2 metres of 3.4 g/t Au from relatively shallow depths (177m)

Allegiant anticipates the core drilling program to commence in May 2022. For further information, please see the following news release dated May 26, 2021 (https://allegiantgold.com/en/news/2021/allegiant-discovers-bonanza-gold-and-silver-grades-at-eastside/).

MAP 1: DRILL TARGETS

https://allegiantgold.com/en/projects/eastside/maps/

Peter Gianulis, CEO of Allegiant Gold, commented: “We are very excited to commence our much-anticipated follow-up drill program at Eastside. The building of these roads was crucial to allow us access to our drill targets around the HGZ at the Original Pit Zone at Eastside. We are now able to test and drill new prospective targets in and around the Original Pit Zone at Eastside with our recently amended Plan-of-Operations that greatly expands our permitted area by 500% to approximately 3,600 acres. We look forward to sharing the results with shareholders.”

QUALIFIED PERSON

Andy Wallace is a Certified Professional Geologist (CPG) with the American Institute of Professional Geologists and is the Qualified Person under NI 43-101, Standards of Disclosure for Mineral Projects, who has reviewed and approved the scientific and technical content of this press release.

ABOUT ALLEGIANT

Allegiant owns 100% of 10 highly-prospective gold projects in the United States, seven of which are located in the mining-friendly jurisdiction of Nevada. Four of Allegiant’s projects are farmed-out, providing for cost reductions and cash-flow. Allegiant’s flagship, district-scale Eastside project hosts a large and expanding gold resource and is located in an area of excellent infrastructure. Preliminary metallurgical testing indicates that both oxide and sulphide gold mineralization at Eastside is amenable to heap leaching.

ON BEHALF OF THE BOARD

Peter Gianulis
CEO

For more information contact:

Investor Relations
(604) 634-0970 or
1-888-818-1364
ir@allegiantgold.com

Neither TSX Venture Exchange nor its Regulation Services Provider (as that term is defined in policies of the TSX Venture Exchange) accepts responsibility for the adequacy or accuracy of this release.

Certain statements and information contained in this press release constitute “forward-looking statements” within the meaning of applicable U.S. securities laws and “forward-looking information” within the meaning of applicable Canadian securities laws, which are referred to collectively as “forward-looking statements”. The United States Private Securities Litigation Reform Act of 1995 provides a “safe harbor” for certain forward-looking statements. Allegiant Gold Ltd.’s (“Allegiant”) exploration plans for its gold exploration properties, the drill program at Allegiant’s Eastside project, the preparation and publication of an updated resource estimate in respect of the Original Zone at the Eastside project, Allegiant’s future exploration and development plans, including anticipated costs and timing thereof; Allegiant’s plans for growth through exploration activities, acquisitions or otherwise; and expectations regarding future maintenance and capital expenditures, and working capital requirements. Forward-looking statements are statements and information regarding possible events, conditions or results of operations that are based upon assumptions about future economic conditions and courses of action. All statements and information other than statements of historical fact may be forward-looking statements. In some cases, forward-looking statements can be identified by the use of words such as “seek”, “expect”, “anticipate”, “budget”, “plan”, “estimate”, “continue”, “forecast”, “intend”, “believe”, “predict”, “potential”, “target”, “may”, “could”, “would”, “might”, “will” and similar words or phrases (including negative variations) suggesting future outcomes or statements regarding an outlook. Such forward-looking statements are based on a number of material factors and assumptions and involve known and unknown risks, uncertainties and other factors which may cause actual results, performance or achievements, or industry results, to differ materially from those anticipated in such forward-looking information. You are cautioned not to place undue reliance on forward-looking statements contained in this press release. Some of the known risks and other factors which could cause actual results to differ materially from those expressed in the forward-looking statements are described in the sections entitled “Risk Factors” in Allegiant’s Listing Application, dated January 24, 2018, as filed with the TSX Venture Exchange and available on SEDAR under Allegiant’s profile at www.sedar.com. Actual results and future events could differ materially from those anticipated in such statements. Allegiant undertakes no obligation to update or revise any forward-looking statements included in this press release if these beliefs, estimates and opinions or other circumstances should change, except as otherwise required by applicable law. 

Kelly® Reports Fourth-Quarter and Full-Year Earnings 2021


Kelly® Reports Fourth-Quarter and Full-Year Earnings 2021

Research, News, and Market Data on Kelly


– Q4 revenue increased 0.7%, or 6% as adjusted

– Q4 gross profit rate of 19.7%, improved 160 bps

– Q4 operating earnings of $15.3 million, or earnings of $19.4 million as adjusted, compared to earnings of $13.9 million in the corresponding quarter of 2020 as adjusted, up 40% on an adjusted basis

– Full year 2021 operating earnings of $48.6 million, or earnings of $52.6 million as adjusted, compared to adjusted earnings of $44.3 million last year, up 19% on an adjusted basis

– To unlock capital to accelerate Kelly’s specialty strategy, Kelly and Persol Holdings will unwind cross-ownership and Kelly will reduce its ownership interest in PersolKelly, the companies’ joint venture in the APAC region, in Q1 2022


TROY, Mich.
Feb. 14, 2022 /PRNewswire/ — Kelly® (Nasdaq: KELYA, KELYB), a leading specialty talent solutions provider, today announced results for the fourth quarter and full year of 2021. The company’s 2021 fiscal year is a 52-week year, and the fourth quarter of 2021 includes 13 weeks. The company’s 2020 fiscal year was a 53-week year, and the fourth quarter of 2020 included 14 weeks.

Peter Quigley, president and chief executive officer, announced revenue for the fourth quarter of 2021 totaled 
$1.3 billion, a 0.7% increase compared to the corresponding quarter of 2020. Year-over-year revenue trends were negatively impacted by the additional week in the 2020 period. Adjusted for the impact of the additional week in 2020, revenue for the fourth quarter of 2021 increased 6.0%. Improving year-over-year revenues in the quarter reflect increasing customer demand compared to the COVID-19-impacted prior year period. 

Earnings from operations in the fourth quarter of 2021 totaled 
$15.3 million, compared to earnings of 
$9.5 million reported in the fourth quarter of 2020. The 2021 fourth-quarter results include a 
$4.1 million restructuring charge. The 2020 fourth-quarter results included a 
$4.4 million restructuring charge. On an adjusted basis, earnings from operations were 
$19.4 million compared to 
$13.9 million in the corresponding quarter of 2020.

Diluted earnings per share in the fourth quarter of 2021 were 
$1.80 compared to 
$0.59 per share in the fourth quarter of 2020. Included in the earnings per share in the fourth quarter of 2021 is a non-cash gain, net of tax, on Kelly’s investment in Persol Holdings common stock of 
$0.87 and a gain on insurance settlement, net of tax, of 
$0.36, partially offset by a loss of 
$0.08 related to restructuring charges, net of tax. Included in the earnings per share in the fourth quarter of 2020 is 
$0.26 from a non-cash gain per share on Kelly’s investment in Persol Holdings common stock, net of tax, partially offset by a loss of 
$0.08 related to restructuring charges, net of tax. On an adjusted basis, earnings per share were 
$0.65 in the fourth quarter of 2021 compared to 
$0.41 in the corresponding quarter of 2020.

“Our fourth-quarter results reflect that the economic recovery continues. While our revenue growth in the quarter was affected by talent supply, we are pleased with our ability to leverage growth into solid gross profit and earnings improvements,” said Quigley.

Operating earnings for the full year of 2021 totaled 
$48.6 million, compared to a loss of 
$93.6 million reported for the full year of 2020. The 2021 full-year results included a 
$4.0 million restructuring charge. The 2020 full-year results include a 
$147.7 million goodwill impairment charge, 
$12.8 million of restructuring charges, a 
$9.5 million customer dispute charge and a 
$32.1 million gain on sale of assets. On an adjusted basis, earnings from operations for the full year of 2021 were 
$52.6 million compared to 
$44.3 million for the full year of 2020.

Diluted earnings per share for the full year of 2021 were 
$3.91 compared to a loss per share of 
$1.83 for the full year of 2020. Included in the earnings per share for the full year of 2021 is 
$2.12 from a non-cash gain on Kelly’s investment in Persol Holdings common stock, net of tax, and a 
$0.36 gain on insurance settlement, net of tax, partially offset by a 
$0.07 per share restructuring charge, net of tax. Included in the loss per share for the full year of 2020 is a non-cash goodwill impairment charge, net of tax, of 
$3.17; restructuring charges, net of tax, of 
$0.24; a 
$0.17 customer dispute charge, net of tax; and a non-cash loss, net of tax, on Kelly’s investment in Persol Holdings common stock of 
$0.29, partially offset by a gain of 
$0.61 related to the gain on sale of assets, net of tax. On an adjusted basis, earnings per share were 
$1.51 for the full year of 2021 compared to 
$1.44 for the full year of 2020.

In other actions taken today, Persol Holdings and Kelly have agreed to changes in their relationship in the APAC region.  

First, Kelly will reduce its ownership interest in 
PersolKelly Pte. Ltd., the staffing joint venture established between Kelly and Persol in 2016, from 49% to 2.5%. Persol will acquire 46.5% of the shares held by Kelly through a Persol subsidiary. These changes will have no impact on the operations of PersolKelly, which remains a premier staffing supplier across the region. PersolKelly will continue to use the brand name, PersolKelly, for a period of time.

Second, Kelly and Persol will discontinue their cross-shareholding. Kelly holds 9,106,800 shares of Persol Holdings common stock, and Persol owns 1,576,169 shares of Kelly’s Class A common stock and 1,475 shares of its Class B common stock. Kelly will monetize its equity holdings in Persol by selling all its shares in an open market transaction. Kelly will also buy back from Persol its equity position in Kelly. These actions will allow Kelly to realize the appreciation of its equity investment in Persol and enable the company to reinvest in Kelly’s specialty growth strategy. Both stock transactions are expected to be completed within two business days.

Persol Holdings continues to be a valued partner to Kelly, and the companies’ senior leaders will continue to regularly meet as part of this valued business partnership. PersolKelly, under the leadership of CEO  Francis Koh, will continue to provide workforce solutions to customers across 13 markets in the 
Asia Pacific market and Kelly, under the leadership of  Pete Hamilton, will continue to operate KellyOCG in the region.

“Kelly is already building on our momentum from 2021, which included 
Softworld, our largest acquisition to date, the creation of a strong, diverse leadership team, and the introduction of new solutions and products in our specialty businesses,” said Quigley. “With the additional transactions announced today, Kelly will free up significant capital to invest in our specialty strategy, positioning us to elevate growth and profitability in 2022 and beyond.”

In conjunction with its fourth-quarter earnings release, Kelly has published a financial presentation on the Investor Relations page of its public website and will host a conference call at 
9 a.m. ET on February 14 to review the results and answer questions. The call may be accessed in one of the following ways:

Via the Internet:
Kellyservices.com

Via the Telephone
(877) 692-8955 (toll free) or (234) 720-6979 (caller paid)
Enter access code 5728672
After the prompt, please enter ”#”

A recording of the conference call will be available after 
1:30 p.m. ET on 
February 14, 2022, at (866) 207-1041 (toll-free) and (402) 970-0847 (caller-paid). The access code is 7976390#. The recording will also be available at kellyservices.com during this period.

This release contains statements that are forward looking in nature and, accordingly, are subject to risks and uncertainties. These factors include, but are not limited to, changing market and economic conditions, the impact of the novel coronavirus (COVID-19) outbreak, competitive market pressures including pricing and technology introductions and disruptions, disruption in the labor market and weakened demand for human capital resulting from technological advances, competition law risks, the impact of changes in laws and regulations (including federal, state and international tax laws), unexpected changes in claim trends on workers’ compensation, unemployment, disability and medical benefit plans, or the risk of additional tax liabilities in excess of our estimates, our ability to achieve our business strategy, our ability to successfully develop new service offerings, material changes in demand from or loss of large corporate customers as well as changes in their buying practices, risks particular to doing business with government or government contractors, the risk of damage to our brand, our exposure to risks associated with services outside traditional staffing, including business process outsourcing, services of licensed professionals and services connecting talent to independent work, our increasing dependency on third parties for the execution of critical functions, our ability to effectively implement and manage our information technology strategy, the risks associated with past and future acquisitions, including risk of related impairment of goodwill and intangible assets, exposure to risks associated with investments in equity affiliates including 
PersolKelly Pte. Ltd., risks associated with conducting business in foreign countries, including foreign currency fluctuations, the exposure to potential market and currency exchange risks relating to our investment in Persol Holdings, risks associated with violations of anti-corruption, trade protection and other laws and regulations, availability of qualified full-time employees, availability of temporary workers with appropriate skills required by customers, liabilities for employment-related claims and losses, including class action lawsuits and collective actions, our ability to sustain critical business applications through our key data centers, risks arising from failure to preserve the privacy of information entrusted to us or to meet our obligations under global privacy laws, the risk of cyberattacks or other breaches of network or information technology security, our ability to realize value from our tax credit and net operating loss carryforwards, our ability to maintain specified financial covenants in our bank facilities to continue to access credit markets, and other risks, uncertainties and factors discussed in this release and in the Company’s filings with the 
Securities and Exchange Commission.  Actual results may differ materially from any forward-looking statements contained herein, and we undertake no duty to update any forward-looking statement to conform the statement to actual results or changes in the Company’s expectations.

About Kelly®

Kelly Services, Inc. (Nasdaq: KELYA, KELYB) connects talented people to companies in need of their skills in areas including Science, Engineering, Education, Office, Contact Center, 
Light Industrial, and more. We’re always thinking about what’s next in the evolving world of work, and we help people ditch the script on old ways of thinking and embrace the value of all workstyles in the workplace. We directly employ more than 350,000 people around the world, and we connect thousands more with work through our global network of talent suppliers and partners in our outsourcing and consulting practice. Revenue in 2021 was 
$4.9 billion. Visit kellyservices.com and let us help with what’s next for you.

MEDIA CONTACT:

ANALYST CONTACT:

Jane Stehney

James Polehna

(248) 765-6864

(248) 244-4586

stehnja@kellyservices.com

polehjm@kellyservices.com

KELLY SERVICES, INC. AND SUBSIDIARIES

CONSOLIDATED STATEMENTS OF EARNINGS

FOR THE 13 WEEKS ENDED JANUARY 2, 2022 AND 14 WEEKS ENDED JANUARY 3, 2021

(UNAUDITED)

(In millions of dollars except per share data)

%

CC %

2021

2020

Change

Change

Change

Revenue from services

$

1,250.3

$

1,241.4

$

8.9

0.7

%

1.1

%

Cost of services

1,004.3

1,017.3

(13.0)

(1.3)

Gross profit

246.0

224.1

21.9

9.8

10.1

Selling, general and administrative expenses

230.7

214.6

16.1

7.5

7.9

Earnings from operations

15.3

9.5

5.8

60.7

Gain (loss) on investment in Persol Holdings

50.0

14.8

35.2

236.8

Gain on insurance settlement

19.0

19.0

NM

Other income (expense), net

0.4

(0.2)

0.6

277.9

Earnings before taxes and equity in net earnings (loss) of affiliate

84.7

24.1

60.6

251.5

Income tax expense (benefit)

16.1

2.5

13.6

NM

Net earnings before equity in net earnings (loss) of affiliate

68.6

21.6

47.0

218.4

Equity in net earnings (loss) of affiliate

3.1

1.8

1.3

72.2

Net earnings

$

71.7

$

23.4

$

48.3

207.1

%

Basic earnings per share

$

1.80

$

0.59

$

1.21

205.1

%

Diluted earnings per share

$

1.80

$

0.59

$

1.21

205.1

%

STATISTICS:

Permanent placement income (included in revenue from services)

$

21.1

$

10.8

$

10.3

94.7

%

95.0

%

Gross profit rate

19.7

%

18.1

%

1.6

pts.

Conversion rate

6.2

4.2

2.0

Adjusted EBITDA

$

27.7

$

20.4

$

7.3

Adjusted EBITDA margin

2.2

%

1.6

%

0.6

pts.

Effective income tax rate

19.0

%

10.6

%

8.4

pts.

Average number of shares outstanding (millions):

     Basic

39.4

39.3

     Diluted

39.6

39.4

KELLY SERVICES, INC. AND SUBSIDIARIES

CONSOLIDATED STATEMENTS OF EARNINGS

FOR THE 52 WEEKS ENDED JANUARY 2, 2022 AND 53 WEEKS ENDED JANUARY 3, 2021

(UNAUDITED)

(In millions of dollars except per share data)

%

CC %

2021

2020

Change

Change

Change

Revenue from services

$

4,909.7

$

4,516.0

$

393.7

8.7

%

7.8

%

Cost of services

3,990.5

3,688.4

302.1

8.2

Gross profit

919.2

827.6

91.6

11.1

10.1

Selling, general and administrative expenses

870.6

805.6

65.0

8.1

7.3

Goodwill impairment charge

147.7

(147.7)

NM

Gain on sale of assets

(32.1)

32.1

NM

Earnings (loss) from operations

48.6

(93.6)

142.2

NM

Gain (loss) on investment in Persol Holdings

121.8

(16.6)

138.4

NM

Gain on insurance settlement

19.0

19.0

NM

Other income (expense), net

(3.6)

3.4

(7.0)

(206.5)

Earnings (loss) before taxes and equity in net earnings (loss) of affiliate

185.8

(106.8)

292.6

NM

Income tax expense (benefit)

35.1

(34.0)

69.1

203.4

Net earnings (loss) before equity in net earnings (loss) of affiliate

150.7

(72.8)

223.5

NM

Equity in net earnings (loss) of affiliate

5.4

0.8

4.6

NM

Net earnings (loss)

$

156.1

$

(72.0)

$

228.1

NM

%

Basic earnings (loss) per share

$

3.93

$

(1.83)

$

5.76

NM

%

Diluted earnings (loss) per share

$

3.91

$

(1.83)

$

5.74

NM

%

STATISTICS:

Permanent placement income (included in revenue from services)

$

75.4

$

39.7

$

35.7

89.7

%

87.4

%

Gross profit rate

18.7

%

18.3

%

0.4

pts.

Conversion rate

5.3

(11.3)

16.6

Adjusted EBITDA

$

84.1

$

69.0

$

15.1

Adjusted EBITDA margin

1.7

%

1.5

%

0.2

pts.

Effective income tax rate

18.9

%

31.8

%

(12.9)

pts.

Average number of shares outstanding (millions):

     Basic

39.4

39.3

     Diluted

39.5

39.3

KELLY SERVICES, INC. AND SUBSIDIARIES

RESULTS OF OPERATIONS BY SEGMENT

(UNAUDITED)

(In millions of dollars)

Fourth Quarter

2021
(13 Wks)

2020
(14 Wks)

%
Change

CC %
Change

Professional & Industrial

  Revenue from services

$

450.7

$

511.7

(11.9)

%

(12.1)

%

  Gross profit

82.3

89.1

(7.7)

(7.9)

  SG&A expenses excluding restructuring charges

70.8

76.5

(7.4)

(7.6)

  Restructuring charges

1.7

NM

NM

  Total SG&A expenses

70.8

78.2

(9.5)

(9.6)

  Earnings (loss) from operations

11.5

10.9

5.3

  Earnings (loss) from operations excluding restructuring charges

11.5

12.6

(9.2)

  Gross profit rate

18.2

%

17.4

%

0.8

pts.

Science, Engineering & Technology

  Revenue from services

$

297.7

$

257.6

15.5

%

15.5

%

  Gross profit

66.1

53.4

23.7

23.7

  SG&A expenses excluding restructuring charges

49.2

35.2

39.7

39.6

  Restructuring charges

0.1

NM

NM

  Total SG&A expenses

49.2

35.3

39.3

39.3

  Earnings (loss) from operations

16.9

18.1

(6.7)

  Earnings (loss) from operations excluding restructuring charges

16.9

18.2

(7.1)

  Gross profit rate

22.2

%

20.7

%

1.5

pts.

Education

  Revenue from services

$

132.4

$

91.8

44.3

%

44.3

%

  Gross profit

21.1

13.4

57.6

57.6

  SG&A expenses excluding restructuring charges

15.6

13.3

17.1

17.1

  Restructuring charges

0.2

NM

NM

  Total SG&A expenses

15.6

13.5

15.3

15.3

  Earnings (loss) from operations

5.5

(0.1)

NM

  Earnings (loss) from operations excluding restructuring charges

5.5

0.1

NM

  Gross profit rate

15.9

%

14.6

%

1.3

pts.

Outsourcing & Consulting

Revenue from services

$

112.1

$

102.5

9.3

%

9.4

%

Gross profit

38.0

32.7

16.3

16.5

SG&A expenses excluding restructuring charges

33.5

28.9

16.2

16.4

Restructuring charges

0.3

NM

NM

Total SG&A expenses

33.5

29.2

15.1

15.4

Earnings (loss) from operations

4.5

3.5

26.2

Earnings (loss) from operations excluding restructuring charges

4.5

3.8

17.6

Gross profit rate

34.0

%

31.9

%

2.1

pts.

International

  Revenue from services

$

257.7

$

278.0

(7.2)

%

(5.4)

%

  Gross profit

38.5

35.5

8.6

11.0

  SG&A expenses excluding restructuring charges

35.5

33.2

6.9

9.2

  Restructuring charges

1.2

0.3

365.5

384.5

  Total SG&A expenses

36.7

33.5

9.6

12.1

  Earnings (loss) from operations

1.8

2.0

(7.7)

  Earnings (loss) from operations excluding restructuring charges

3.0

2.3

35.1

  Gross profit rate

15.0

%

12.8

%

2.2

pts.

KELLY SERVICES, INC. AND SUBSIDIARIES

RESULTS OF OPERATIONS BY SEGMENT

(UNAUDITED)

(In millions of dollars)

December Year to Date

2021
(52 Wks)

2020
(53 Wks)

%
Change

CC %
Change

Professional & Industrial

  Revenue from services

$

1,837.4

$

1,858.4

(1.1)

%

(1.5)

%

  Gross profit

310.0

330.2

(6.1)

(6.5)

  SG&A expenses excluding restructuring charges

278.6

282.6

(1.4)

(1.7)

  Restructuring charges

6.0

NM

NM

  Total SG&A expenses

278.6

288.6

(3.5)

(3.8)

  Earnings (loss) from operations

31.4

41.6

(24.4)

  Earnings (loss) from operations excluding restructuring charges

31.4

47.6

(34.0)

  Gross profit rate

16.9

%

17.8

%

(0.9)

pts.

Science, Engineering & Technology

  Revenue from services

$

1,156.8

$

1,019.1

13.5

%

13.3

%

  Gross profit

253.9

209.4

21.3

21.1

  SG&A expenses excluding restructuring charges

180.2

133.8

34.7

34.5

  Restructuring charges

0.6

NM

NM

  Total SG&A expenses

180.2

134.4

34.1

33.9

  Earnings (loss) from operations

73.7

75.0

(1.7)

  Earnings (loss) from operations excluding restructuring charges

73.7

75.6

(2.5)

  Gross profit rate

21.9

%

20.5

%

1.4

pts.

Education

  Revenue from services

$

416.5

$

286.9

45.2

%

45.2

%

  Gross profit

65.1

42.2

54.1

54.1

  SG&A expenses excluding restructuring charges

62.1

50.2

23.6

23.6

  Restructuring charges

1.0

NM

NM

  Total SG&A expenses

62.1

51.2

21.1

21.1

  Earnings (loss) from operations

3.0

(9.0)

NM

  Earnings (loss) from operations excluding restructuring charges

3.0

(8.0)

NM

  Gross profit rate

15.6

%

14.7

%

0.9

pts.

Outsourcing & Consulting

  Revenue from services

$

432.1

$

363.5

18.9

%

17.9

%

  Gross profit

141.4

119.8

18.0

16.3

  SG&A expenses excluding restructuring charges

122.7

108.0

13.6

12.4

  Restructuring charges

0.3

NM

NM

  Total SG&A expenses

122.7

108.3

13.3

12.0

  Earnings (loss) from operations

18.7

11.5

62.7

  Earnings (loss) from operations excluding restructuring charges

18.7

11.8

58.3

  Gross profit rate

32.7

%

33.0

%

(0.3)

pts.

International

  Revenue from services

$

1067.8

$

988.6

8.0

%

4.9

%

  Gross profit

148.8

126.0

18.1

14.8

  SG&A expenses excluding restructuring charges

137.7

133.5

3.1

0.2

  Restructuring charges

1.2

1.4

(10.2)

(6.6)

  Total SG&A expenses

138.9

134.9

2.9

0.1

  Earnings (loss) from operations

9.9

(8.9)

NM

  Earnings (loss) from operations excluding restructuring charges

11.1

(7.5)

NM

  Gross profit rate

13.9

%

12.7

%

1.2

pts.

KELLY SERVICES, INC. AND SUBSIDIARIES

CONSOLIDATED BALANCE SHEETS

(UNAUDITED)

(In millions of dollars)

Jan.  2, 2022

Jan.  3, 2021

Current Assets

  Cash and equivalents

$

112.7

$

223.0

  Trade accounts receivable, less allowances of

    $12.6 and $13.3, respectively

1,423.2

1,265.2

  Prepaid expenses and other current assets

52.8

61.4

Total current assets

1,588.7

1,549.6

Noncurrent Assets

Property and equipment, net

35.3

41.0

Operating lease right-of-use assets

75.8

83.2

Deferred taxes

302.8

282.0

Goodwill, net

114.8

3.5

Investment in Persol Holdings

264.3

164.2

Investment in equity affiliate

123.4

118.5

Other assets

389.1

319.9

Total noncurrent assets

1,305.5

1,012.3

Total Assets

$

2,894.2

$

2,561.9

Current Liabilities

  Short-term borrowings

$

$

0.3

  Accounts payable and accrued liabilities

687.2

536.8

Operating lease liabilities

17.5

19.6

  Accrued payroll and related taxes

318.4

293.0

  Accrued workers’ compensation and other claims

20.8

22.7

  Income and other taxes

51.3

53.2

Total current liabilities

1,095.2

925.6

Noncurrent Liabilities

Operating lease liabilities

61.4

67.5

Accrued payroll and related taxes

57.6

58.5

  Accrued workers’ compensation and other claims

37.0

42.2

  Accrued retirement benefits

220.0

205.8

  Other long-term liabilities

86.8

59.3

Total noncurrent liabilities

462.8

433.3

Stockholders’ Equity

  Common stock

40.1

40.1

  Treasury stock

(15.1)

(17.1)

  Paid-in capital

23.9

21.3

  Earnings invested in the business

1,315.0

1,162.9

  Accumulated other comprehensive income (loss)

(27.7)

(4.2)

Total stockholders’ equity

1,336.2

1,203.0

Total Liabilities and Stockholders’ Equity

$

2,894.2

$

2,561.9

Statistics:

 Working Capital

$

493.5

$

624.0

 Current Ratio

1.5

1.7

 Debt-to-capital %

0.0

%

0.0

%

 Global Days Sales Outstanding

60

64

 Year-to-Date Free Cash Flow

$

73.8

$

170.5

KELLY SERVICES, INC. AND SUBSIDIARIES

CONSOLIDATED STATEMENTS OF CASH FLOWS

FOR THE 52 WEEKS ENDED JANUARY 2, 2022 AND 53 WEEKS ENDED JANUARY 3, 2021

(UNAUDITED)

(In millions of dollars)

2021

2020

Cash flows from operating activities:

  Net earnings (loss)

$

156.1

$

(72.0)

  Adjustments to reconcile net earnings to net cash from operating activities:

    Goodwill impairment charge

147.7

    Deferred income taxes

21.6

(57.1)

    Depreciation and amortization

29.8

24.2

    Operating lease asset amortization

21.2

21.1

    Provision for credit losses and sales allowances

1.6

12.8

    Stock-based compensation

5.1

3.9

    (Gain) loss on investment in Persol Holdings

(121.8)

16.6

    Gain on insurance settlement

(19.0)

    Gain on sale of assets

(32.1)

    Equity in net (earnings) loss of PersolKelly Pte. Ltd.

(5.4)

(0.8)

    Other, net

6.0

1.4

  Changes in operating assets and liabilities, net of acquisitions

(10.2)

120.3

  Net cash from operating activities

85.0

186.0

Cash flows from investing activities:

  Capital expenditures

(11.2)

(15.5)

  Proceeds from sale of assets

55.5

  Acquisition of companies, net of cash received

(213.0)

(39.2)

  Proceeds from company-owned life insurance

12.2

2.3

  Proceeds from insurance settlement

19.0

  Proceeds from sale of Brazil, net of cash disposed

1.2

  Proceeds (payments) related to loans to equity affiliate

5.9

5.6

  Proceeds from (investment in) equity securities

5.0

(0.2)

  Other investing activities

1.4

0.1

    Net cash (used in) from investing activities

(180.7)

9.8

Cash flows from financing activities:

  Net change in short-term borrowings

(0.2)

(1.7)

  Financing lease payments

(1.5)

(2.0)

  Dividend payments

(4.0)

(3.0)

  Payments of tax withholding for stock awards

(0.6)

(1.2)

  Contingent consideration payments

(1.6)

  Other financing activities

(0.2)

(0.2)

    Net cash used in financing activities

(8.1)

(8.1)

Effect of exchange rates on cash, cash equivalents and restricted cash

(4.8)

9.4

Net change in cash, cash equivalents and restricted cash

(108.6)

197.1

Cash, cash equivalents and restricted cash at beginning of year

228.1

31.0

Cash, cash equivalents and restricted cash at end of year

$

119.5

$

228.1

KELLY SERVICES, INC. AND SUBSIDIARIES

REVENUE FROM SERVICES

(UNAUDITED)

(In millions of dollars)

Fourth Quarter

2021

2020

%

CC %

(13 Wks)

(14 Wks)

Change

Change

Americas

  United States

$

908.6

$

891.0

2.0

%

2.0

%

  Canada

38.1

33.8

12.6

8.6

  Puerto Rico

25.5

20.9

21.6

21.6

  Mexico

10.6

35.8

(70.5)

(70.1)

Total Americas Region

982.8

981.5

0.1

Europe

  Switzerland

61.0

59.2

3.1

4.9

  France

55.0

57.0

(3.5)

0.5

  Portugal

37.3

42.6

(12.4)

(8.6)

  Russia

32.9

29.9

9.8

4.9

  Italy

18.2

15.7

15.8

20.7

  United Kingdom

16.4

17.2

(4.5)

(6.7)

  Germany

9.4

8.0

17.4

22.3

  Ireland

8.0

5.9

36.9

42.4

  Other

18.1

15.9

13.5

17.4

Total Europe Region

256.3

251.4

2.0

4.0

Total Asia-Pacific Region

11.2

8.5

33.3

34.5

Total Kelly Services, Inc.

$

1,250.3

$

1,241.4

0.7

%

1.1

%

KELLY SERVICES, INC. AND SUBSIDIARIES

REVENUE FROM SERVICES

(UNAUDITED)

(In millions of dollars)

December Year to Date

2021

2020

%

CC %

(52 Wks)

(53 Wks)

Change

Change

Americas

  United States

$

3,513.4

$

3,260.2

7.8

%

7.8

%

  Canada

155.0

122.5

26.5

18.2

  Puerto Rico

102.1

77.0

32.5

32.5

  Mexico

92.7

114.4

(19.0)

(23.2)

  Brazil

17.0

NM

NM

Total Americas Region

3,863.2

3,591.1

7.6

7.2

Europe

  France

223.1

198.2

12.5

8.6

  Switzerland

222.2

200.4

10.9

8.2

  Portugal

158.2

141.7

11.7

7.6

  Russia

132.2

118.5

11.5

14.3

  Italy

74.2

58.2

27.4

23.0

  United Kingdom

68.3

73.7

(7.4)

(13.7)

  Germany

34.0

30.1

13.0

9.7

  Ireland

26.8

19.9

34.9

31.4

  Other

68.0

54.6

24.5

20.4

Total Europe Region

1,007.0

895.3

12.5

9.5

Total Asia-Pacific Region

39.5

29.6

33.8

27.7

Total Kelly Services, Inc.

$

4,909.7

$

4,516.0

8.7

%

7.8

%

 KELLY SERVICES, INC. AND SUBSIDIARIES

 RECONCILIATION OF NON-GAAP MEASURES

FOURTH QUARTER

 (UNAUDITED)

 (In millions of dollars)

2021

2020

SG&A Expenses:

As Reported

Restructuring(5)

Adjusted

Adjusted

Professional & Industrial

$                    70.8

$                       —

$               70.8

$               76.5

Science, Engineering & Technology

49.2

49.2

35.2

Education

15.6

15.6

13.3

Outsourcing & Consulting

33.5

33.5

28.9

International

36.7

(1.2)

35.5

33.2

Corporate

24.9

(2.9)

22.0

23.1

Total Company

$                  230.7

$                     (4.1)

$            226.6

$            210.2

2021

2020

Earnings (Loss) from Operations:

As Reported

Restructuring(5)

Adjusted

Adjusted

Professional & Industrial

$                    11.5

$                       —

$               11.5

$               12.6

Science, Engineering & Technology

16.9

16.9

18.2

Education

5.5

5.5

0.1

Outsourcing & Consulting

4.5

4.5

3.8

International

1.8

1.2

3.0

2.3

Corporate

(24.9)

2.9

(22.0)

(23.1)

Total Company

$                    15.3

$                      4.1

$               19.4

$               13.9

 KELLY SERVICES, INC. AND SUBSIDIARIES

 RECONCILIATION OF NON-GAAP MEASURES

FOURTH QUARTER

 (UNAUDITED)

 (In millions of dollars)

2020

SG&A Expenses:

As Reported

Restructuring(5)

Adjusted

Professional & Industrial

$                    78.2

$                     (1.7)

$               76.5

Science, Engineering & Technology

35.3

(0.1)

35.2

Education

13.5

(0.2)

13.3

Outsourcing & Consulting

29.2

(0.3)

28.9

International

33.5

(0.3)

33.2

Corporate

24.9

(1.8)

23.1

Total Company

$                  214.6

$                     (4.4)

$            210.2

2020

Earnings (Loss) from Operations:

As Reported

Restructuring(5)

Adjusted

Professional & Industrial

$                    10.9

$                      1.7

$               12.6

Science, Engineering & Technology

18.1

0.1

18.2

Education

(0.1)

0.2

0.1

Outsourcing & Consulting

3.5

0.3

3.8

International

2.0

0.3

2.3

Corporate

(24.9)

1.8

(23.1)

Total Company

$                      9.5

$                      4.4

$               13.9

KELLY SERVICES, INC. AND SUBSIDIARIES

RECONCILIATION OF NON-GAAP MEASURES

DECEMBER YEAR TO DATE

(UNAUDITED)

(In millions of dollars)

2021

2020

SG&A Expenses:

As Reported

Restructuring(5)

Adjusted

Adjusted

Professional & Industrial

$                  278.6

$                       —

$            278.6

$            282.6

Science, Engineering & Technology

180.2

180.2

133.8

Education

62.1

62.1

50.2

Outsourcing & Consulting

122.7

122.7

108.0

International

138.9

(1.2)

137.7

124.0

Corporate

88.1

(2.8)

85.3

84.7

Total Company

$                  870.6

$                     (4.0)

$            866.6

$            783.3

2021

2020

Earnings (Loss) from Operations:

As Reported

Restructuring(5)

Adjusted

Adjusted

Professional & Industrial

$                    31.4

$                       —

$               31.4

$               47.6

Science, Engineering & Technology

73.7

73.7

75.6

Education

3.0

3.0

(8.0)

Outsourcing & Consulting

18.7

18.7

11.8

International

9.9

1.2

11.1

2.0

Corporate

(88.1)

2.8

(85.3)

(84.7)

Total Company

$                    48.6

$                      4.0

$               52.6

$               44.3

 KELLY SERVICES, INC. AND SUBSIDIARIES

 RECONCILIATION OF NON-GAAP MEASURES

DECEMBER YEAR TO DATE

 (UNAUDITED)

 (In millions of dollars)

2020

SG&A Expenses:

As Reported

Customer Dispute(4)

Restructuring(5)

Adjusted

Professional & Industrial

$                  288.6

$                       —

$                     (6.0)

$            282.6

Science, Engineering & Technology

134.4

(0.6)

133.8

Education

51.2

(1.0)

50.2

Outsourcing & Consulting

108.3

(0.3)

108.0

International

134.9

(9.5)

(1.4)

124.0

Corporate

88.2

(3.5)

84.7

Total Company

$                  805.6

$                     (9.5)

$                  (12.8)

$            783.3

2020

Earnings (Loss) from Operations:

As Reported

Goodwill Impairment(1)

Gain on sale of assets(3)

Customer Dispute(4)

Restructuring(5)

Adjusted

Professional & Industrial

$               41.6

$                     —

$                  —

$                  —

$                      6.0

$               47.6

Science, Engineering & Technology

75.0

0.6

75.6

Education

(9.0)

1.0

(8.0)

Outsourcing & Consulting

11.5

0.3

11.8

International

(8.9)

9.5

1.4

2.0

Corporate

(203.8)

147.7

(32.1)

3.5

(84.7)

Total Company

$             (93.6)

$               147.7

$             (32.1)

$                 9.5

$                    12.8

$               44.3

KELLY SERVICES, INC. AND SUBSIDIARIES

RECONCILIATION OF NON-GAAP MEASURES

(UNAUDITED)

(In millions of dollars except per share data)

Fourth Quarter

December Year to Date

2021

2020

2021

2020

Income tax expense (benefit)

$             16.1

$               2.5

$             35.1

$           (34.0)

Taxes on goodwill impairment charge(1)

23.0

Taxes on investment in Persol Holdings(2)

(15.3)

(4.5)

(37.3)

5.1

Taxes on gain on sale of assets(3)

(8.1)

Taxes on customer dispute(4)

2.8

Taxes on restructuring charges(5)

1.0

1.0

1.0

3.2

Taxes on gain on insurance settlement(6)

(4.8)

(4.8)

Adjusted income tax expense (benefit)

$             (3.0)

$             (1.0)

$             (6.0)

$             (8.0)

Fourth Quarter

December Year to Date

2021

2020

2021

2020

Net earnings (loss)

$             71.7

$             23.4

$          156.1

$           (72.0)

Goodwill impairment charge, net of taxes(1)

124.7

(Gain) loss on investment in Persol Holdings, net of taxes(2)

(34.7)

(10.3)

(84.5)

11.5

(Gain) loss on sale of assets, net of taxes(3)

(23.9)

Customer dispute, net of taxes(4)

6.7

Restructuring charges, net of taxes(5)

3.1

3.4

3.0

9.6

Gain on insurance settlement, net of taxes(6)

(14.2)

(14.2)

Adjusted net earnings

$             25.9

$             16.5

$             60.4

$             56.6

Fourth Quarter

December Year to Date

2021

2020

2021

2020

Per Share

Per Share

Net earnings (loss)

$             1.80

$             0.59

$             3.91

$           (1.83)

Goodwill impairment charge, net of taxes(1)

3.17

(Gain) loss on investment in Persol Holdings, net of taxes(2)

(0.87)

(0.26)

(2.12)

0.29

Gain on sale of assets, net of taxes(3)

(0.61)

Customer dispute, net of taxes(4)

0.17

Restructuring charges, net of taxes(5)

0.08

0.08

0.07

0.24

Gain on insurance settlement, net of taxes(6)

(0.36)

(0.36)

Adjusted net earnings

$             0.65

$             0.41

$             1.51

$             1.44

Note: Earnings per share amounts for each quarter are required to be computed independently and may not equal the amounts computed for the total year.

KELLY SERVICES, INC. AND SUBSIDIARIES

RECONCILIATION OF NON-GAAP MEASURES

(UNAUDITED)

(In millions of dollars)

Fourth Quarter

December Year to Date

2021

2020

2021

2020

Net earnings (loss)

$                71.7

$                23.4

$              156.1

$               (72.0)

Other (income) expense, net

(0.4)

0.2

3.6

(3.4)

Income tax expense (benefit)

16.1

2.5

35.1

(34.0)

Depreciation and amortization

8.3

6.5

31.5

24.7

EBITDA

95.7

32.6

226.3

(84.7)

Equity in net (earnings) loss of affiliate

(3.1)

(1.8)

(5.4)

(0.8)

Goodwill impairment charge(1)

147.7

(Gain) loss on investment in Persol Holdings(2)

(50.0)

(14.8)

(121.8)

16.6

Gain on sale of assets(3)

(32.1)

Customer dispute(4)

9.5

Restructuring(5)

4.1

4.4

4.0

12.8

Gain on insurance settlement(6)

(19.0)

(19.0)

Adjusted EBITDA

$                27.7

$                20.4

$                84.1

$                69.0

Adjusted EBITDA margin

2.2   %

1.6   %

1.7   %

1.5   %

KELLY SERVICES, INC. AND SUBSIDIARIES
RECONCILIATION OF NON-GAAP MEASURES
(UNAUDITED)

Management believes that the non-GAAP (Generally Accepted Accounting Principles) information excluding the 2020 goodwill impairment charge, the 2021 and 2020 gains and losses on the investment in Persol Holdings, the 2020 gain on sale of assets, the 2020 customer dispute, the 2021 and 2020 restructuring charges and the 2021 gain on insurance settlement are useful to understand the Company’s fiscal 2021 financial performance and increases comparability.  Specifically, Management believes that removing the impact of these items allows for a meaningful comparison of current period operating performance with the operating results of prior periods.  Management also believes that such measures are used by those analyzing performance of companies in the staffing industry to compare current performance to prior periods and to assess future performance.

Management uses Adjusted EBITDA (adjusted earnings before interest, taxes, depreciation and amortization) and Adjusted EBITDA Margin (percent of total GAAP revenue) which Management believes is useful to compare operating performance compared to prior periods and uses it in conjunction with GAAP measures to assess performance. Our calculation of Adjusted EBITDA may not be consistent with similarly titled measures of other companies and should be used in conjunction with GAAP measurements.

These non-GAAP measures may have limitations as analytical tools because they exclude items which can have a material impact on cash flow and earnings per share.  As a result, Management considers these measures, along with reported results, when it reviews and evaluates the Company’s financial performance.  Management believes that these measures provide greater transparency to investors and provide insight into how Management is evaluating the Company’s financial performance.  Non-GAAP measures should not be considered a substitute for, or superior to, measures of financial performance prepared in accordance with GAAP.

(1)

The goodwill impairment charge is the result of an interim impairment test the Company performed during the first quarter of 2020, due to a triggering event caused by a decline in the Company’s common stock price.

(2)

The gains and losses on the investment in Persol Holdings represent the change in fair value of the investment during the period presented and the related tax expense and benefit.

(3)

Gain on sale of assets in 2020 primarily represents the excess of the proceeds over the cost of the headquarters properties sold during the first quarter of 2020.

(4)

Customer dispute in 2020 represents a non-cash charge in Mexico to increase the reserve against a long-term receivable from a former customer based on an updated probability of loss assessment.

(5)

Restructuring charges in 2021 represent severance costs as part of cost management actions designed to increase operational efficiencies within enterprise functions that provide centralized support to operating units.  Restructuring charges in 2020 represent severance costs and lease terminations in preparation for the new operating model adopted in the third quarter of 2020.

(6)

Gain on insurance settlement represents a payment received in the fourth quarter of 2021 related to the settlement of claims under a representations and warranties insurance policy purchased by the Company in connection with the acquisition of Softworld.

SOURCE Kelly Services, Inc.

Motorsport Games And Adam Breeden Announce Global Agreement With Formula 1® To Create Next-Level Competitive Socialising Experience, Launching In London In 2022


Motorsport Games And Adam Breeden Announce Global Agreement With Formula 1® To Create Next-Level Competitive Socialising Experience, Launching In London In 2022

Research, News, and Market Data on Motorsport Games


MIAMI, Feb. 14, 2022 (GLOBE NEWSWIRE) — Adam Breeden, the pioneer of competitive socialising in the UK and entrepreneurial force behind some of the sector’s most successful concepts, has announced plans for his most ambitious and exciting project yet – an immersive, state of the art F1® racing simulation experience, gamified for a mass audience, in a unique global licence agreement with Formula 1®.

Formula 1’s commitment to the partnership is reflected in the fact that the global sporting brand has chosen to take a meaningful equity position in the new company. Through the exclusive, long-term partnership, as many as 30 venues will be rolled out worldwide in the next five years, and Kindred Concepts have agreed a conditional lease with Landsec to launch the new concept at One New Change, the premier retail and leisure destination in the City of London, in Q4 2022.

Kindred Concepts, a new company founded by Adam Breeden, co-founder of Puttshack, Flight Club, Bounce, All Star Lanes and Hijingo, and backed by leisure and entertainment sector investor Imbiba, together with Formula 1®, will operate the new concept, taking competitive socialising to the next level with a premium offering promising best-in-class hospitality and design.

Fusing racing and gaming, with the fun of competitive socialising, and the glamour and spirit of F1®, the concept will cater to a wide range of groups and occasions, from fun-filled nights out, to family experiences, corporate events and everything in between, boasting an impressive feature bar with an extensive offering, surrounded by dining and drinks areas with elevated food menus.

Adam Breeden, Founder and Chief Executive Officer of Kindred Concepts, said: “When people come to one of our venues, we have to wow them, and this new concept is going to take people’s breath away. With our knowledge of creating best-in-class concepts and operations, and the strength of the Formula One brand, we are going to break barriers in competitive socialising, marrying cutting edge technology, a premium F&B offering, and a visually stimulating setting, with the unrivalled glamour and excitement of F1, to create an unforgettable, adrenaline-fuelled experience.”

Ben Pincus, Director of Commercial Partnerships, Formula 1®, said: “We’re thrilled to partner with best-in-class operators on this global opportunity, which will create an incredible entertainment experience for a worldwide audience, and a go-to hospitality venue for Formula 1 fans and non-fans alike. The racing simulators will bring to life the experience of driving a Formula 1 car in a high-octane, stylish and fun environment, giving more people the opportunity to enjoy and get closer to the world of F1.”

An in-house tech team is working with Studio 397, part of Motorsport Games (NASDAQ: MSGM), a leading racing game developer, publisher and esports ecosystem provider, and Formula 1®, to create a new gaming experience leveraging Studio 397’s racing simulation platform rFactor 2 for this groundbreaking concept.

Dmitry Kozko, CEO, Motorsport Games, said: “We’re honoured to work with Kindred Concepts and Formula 1 to help successfully launch this cutting-edge gaming experience. Motorsport Games prides itself on the authenticity and realism brought to each of our games and the simulators at this venue will be no different. We look forward to each guest getting a true to life feel of driving a Formula 1 car in these state-of-the-art simulators in this unique setting.”

For the site at One New Change, up to sixty bespoke, cutting-edge motion racing simulators are being designed by a leading simulator design company, in collaboration with F1®. Guests will choose from a variety of racing modes to compete against each other individually, in team-based groups or as part of all-venue racing formats, with different car modes for all ages and abilities making it competitive and exciting for all who race, regardless of skill. The venue will also provide enhanced experiences on Grands Prix weekends.

Marcus Geddes, Managing Director – Central London at Landsec, said: “The growing popularity of leisure across our retail destinations is driven by unique, one-of-a-kind experiences that can’t be had anywhere else – and this world-first with Formula 1 goes above and beyond. The scale of this exciting new concept is a valuable addition to the City and its surrounding communities, and will provide guests at One New Change with an unforgettable day or night out.”

Kindred Concepts aims to roll out at pace from launch, with a mixture of owned and operated venues, joint ventures, and franchise partnerships. Target locations include the UK, the US, key western European Cities, the Middle East and Asia.  

The new concept will be operated by Kindred Concepts, a new venture formed of a senior team that comprises many of Breeden’s long-term business partners, including Diane Jervis, Chief Development Officer.

Further information about the launch of the concept at One New Change will be revealed later this year.

About Kindred Concepts:

Kindred Concepts was founded by Adam Breeden, the pre-eminent figure in competitive socialising in the UK. Breeden co-founded Puttshack, Flight Club, Bounce, All Star Lanes and Hijingo, and was also the founder of multi-award winning cocktail bar and restaurant, The Lonsdale.

The senior management team includes chairman Stephen Murphy, former Group CEO of Virgin Group; CFO Jonathan Peters, formerly CFO for Caprice Holdings, Ivy Collection, Bill’s Restaurant, Birley Clubs and Everyman Cinemas; Chief Development Officer, Diane Jervis, who launched Bounce and brought Puttshack and Hijingo concepts to market, and COO Roberto Moretti, former UK COO of Puttshack and of Bills Restaurants.

Chief Technology Officer, Gavin Williams, was the Founder and CEO of Quander.io, delivering multi-sensory and measurable digital brand experiences for the likes of Sky, BMW and the NBA; Oliver Raison, Creative Product Director and Jonique Izidoro, Projects & Systems Director, both founding members of Adam’s core team as part of Bounce and creating and delivering Puttshack, Hijingo and AceBounce.

About Formula 1®:

Formula 1® racing began in 1950 and is the world’s most prestigious motor racing competition, as well as the world’s most popular annual sporting series. Formula One World Championship Limited is part of Formula 1® and holds the exclusive commercial rights to the FIA Formula One World Championship™. Formula 1® is a subsidiary of Liberty Media Corporation (NASDAQ: LSXMA, LSXMB, LSXMK, BATRA, BATRK, FWONA, FWONK) attributed to the Formula One Group tracking stock. The F1 logo, F1 FORMULA 1 logo, FORMULA 1, F1, FIA FORMULA ONE WORLD CHAMPIONSHIP, GRAND PRIX, PADDOCK CLUB and related marks are trademarks of Formula One Licensing BV, a Formula 1 company. All rights reserved.

About Landsec

At Landsec, we build and invest in buildings, spaces and partnerships to create sustainable places, connect communities and realise potential. We are one of the largest real estate companies in Europe, with a £11 billion portfolio of retail, leisure, workspace and residential hubs. Landsec is shaping a better future by leading our industry on environmental and social sustainability while delivering value for our shareholders, great experiences for our guests and positive change for our communities. Find out more at landsec.com

About Motorsport Games:

Motorsport Games, a Motorsport Network company, combines innovative and engaging video games with exciting esports competitions and content for racing fans and gamers around the globe. The Company is the officially licensed video game developer and publisher for iconic motorsport racing series, including NASCAR, INDYCAR, 24 Hours of Le Mans and the British Touring Car Championship (“BTCC”), across PC, PlayStation, Xbox, Nintendo Switch and mobile. Motorsport Games is an award-winning esports partner of choice for 24 Hours of Le Mans, Formula E, BTCC, the FIA World Rallycross Championship and the eNASCAR Heat Pro League, among others. For more information about Motorsport Games, visit www.motorsportgames.com.

Press:
ASTRSK PR
motorsportgames@astrskpr.com

Great Lakes Dredge & Dock (GLDD) – 2021 Results Out This Week – Expect Constructive 2022 Outlook

Monday, February 14, 2022

Great Lakes Dredge & Dock (GLDD)
2021 Results Out This Week – Expect Constructive 2022 Outlook

Great Lakes Dredge & Dock Corp is a provider of dredging services in the United States. The company only’s operating segments is Dredging. Dredging involves the enhancement or preservation of navigability of waterways or the protection of shorelines through the removal or replenishment of soil, sand or rock. Its projects portfolio includes Coastal Restoration, Coastal Protection, Port expansion, and others.

Poe Fratt, Senior Research Analyst, Noble Capital Markets, Inc.

Refer to the full report for the price target, fundamental analysis, and rating.

    2021 Results out this week — BMO on Wednesday February 16th. Management will host a 10:00am EST call on Wednesday, February 16th to discuss the operating results and the 2022 outlook. The number is 877-377-7552 and the code is 5544504. Looking for 4Q2021 EBITDA of $42.4 million and 2021 EBITDA of $121.6 million.

    Big news of 4Q2021 was final investment decision (FID) and shipyard engagement to build first Jones Act qualified incline fallpipe rock installation barge.  A contract for $197 million was awarded to Philly Shipyard, a publicly traded Norwegian company that is majority owned by Aker Capital. The goal is to construct the first Jones Act complaint vessel to assist in the installation of the wind …


This Company Sponsored Research is provided by Noble Capital Markets, Inc., a FINRA and S.E.C. registered broker-dealer (B/D).

*Analyst certification and important disclosures included in the full report. NOTE: investment decisions should not be based upon the content of this research summary.  Proper due diligence is required before making any investment decision. 

How Reliable is the Super Bowl Indicator


Image Credit: Fabricio Trujillo (Pexels)


The Super Bowl Indicator, If You’re Long You May Want to Root For the Rams


If you’re choosing between watching
the Olympics or the Super Bowl, this may help. Sunday night around 6pm ET, the
women’s 300M speedskating relay will be competing head-to-head against Bengals
versus Rams. While the Winter Olympics only comes around once every four years
and includes countries from around the world, for investors the annual big football game between the top two cities is considered to be a remarkable harbinger for
market moves.

So if you’re concerned about what the market may do Monday morning and throughout the rest of the year, you may not want to pass up on what’s going on in Los Angeles. Many say the big game has statistical significance to the market returns for the year, and if you’re long stocks, you should be cheering for the Rams, here’s why. The Super Bowl Indicator is considered one of the most consistent market predictors of the stock market. And as most investors today will tell you, the stock market could stand to gain a few yards this year.  After all, even the Dow has returned a negative 2.91% since the beginning of the year.

Football to the Rescue?

In the late 1970s, sportswriter Leonard Koppett discovered a connection between who won the National Football League’s (NFL) championship game and how the stock market did over the following 11 months. Since then, market strategist Robert H. Stovall kept tracking it. Stovall passed away in 2020, but the tradition is alive and well.

At its most basic level, the Super Bowl Indicator predicts that if the winning team is from the National Football Conference (NFC) or was part of the NFL prior to the 1970 merger with the AFL, then stocks will be bullish for the year. If victory instead goes to the team that comes from the AFC, then the market will be bearish over the remainder of the year.

From 1967-2015, the indicator was accurate 40 times out of 49 years. That’s an accuracy rate of 82%. Hard to beat that however, over the past six years, the indicator has given some false readings. As of the 2021 Super Bowl, the indicator lost some of its magic and has been right 41 out of 55 games, that’s a 75% win rate.

During the years 2016 and 2017, when two AFC teams won, the Denver Broncos and the New England Patriots, the market defied the indicator and rose. Then in 2018, when the Philadelphia Eagles won, an NFC team, the market fell.

During the 2019 and 2020 Super Bowls, two more AFC teams won, the Patriots and the Kansas City Chiefs, and we experienced strong markets.

Finally, in 2021 after a five-year stretch where the indicator kept followers out of the market, it sent the correct signal. The Buccaneers, an NFC team, won, and the market rose about 27%.

2022 Super Bowl

The Rams are the team to pick if you’re long, whereas a Bengal win would indicate the market closes in negative territory.

It’s science, right? Sure, the same quality of science as the Santa Claus Rally that didn’t come last year. Or the sell in May folks that walked away and missed the double-digit rally that occurred through October. Or the more recent “January effect” that forgot it was supposed to lift stocks – the Superbowl indicator may be remarkable, but it probably isn’t useful.

The truth is the ability to predict market direction based on the classification of the team that spills the most Gatorade at the end is more fun than functional. What is functional is a portfolio built with solid blocking and tackling using fundamentals. There is no substitute for lining up the right players for your portfolio, then putting them in play when you think they will contribute best to your holdings. Fundamental analysis combined with any number of entry methods is what builds winning portfolios.

When choosing stocks to add to your line-up this year, let Channelchek do some of your blocking and tackling.  Sign-up for research and articles sent to your inbox throughout the day. And if you want to do some more serious scouting, the NobleCon18 Conference in April is free
to investors
.

Paul Hoffman

Managing Editor, Channelchek


Suggested Reading


Does the Fed’s Digital Currency Report Indicate They’re Dropping the Ball?


How Lovers Spend Money on Valentine’s Day


Esports: Show me the Money!


Toilet Paper Sales Unravel as Households are Flush with Paper Goods

Sources

https://en.wikipedia.org/wiki/Leonard_Koppett

https://en.wikipedia.org/wiki/Super_Bowl_indicator


Stay up to date. Follow us:


Is Online Sports Gambling the Overlooked Growth Industry


Image Credit: Joey Zanotti


Super Bowl is Set to Become the Biggest Legal Gambling Event in Football History


A record 31.4 million Americans plan to bet on Super Bowl LVI; that’s almost 10% of the population.

Expanded legalization of sports betting across the U.S., coupled with the ease of smartphone and online wagering, has made gaming a large growth industry. For investors, the sector offers tremendous expansion, high-tech innovations, increased adoption, and consolidation. Combined, this makes electronic sports wagering and related businesses something to pay attention to.

Take a look at how the numbers are expected to play out for just one big football game.

Super Bowl 2022

The 31.4 million expected to be wagered on the game is a 35% increase from last year. According to estimates by the American Gaming Association (AGA) bettors expect to wager $7.61 billion on this year’s game. In terms of dollars, they estimate a 78% spike over 2021s game.

The key driver for the growth in online gaming has been the surge in legal availability of sports betting.  This is a direct result of the 2018 U.S. Supreme Court ruling that allows states beyond Nevada to legalize gambling on sports. Presently, 30 states plus Washington, D.C. feature live, legal sports betting markets, with three additional legal markets waiting to launch.


Americans’ Super
Bowl Wager Plans

  • 18.5 million plan to bet casually with friends or as part of a pool or squares contest, up 23 percent from 2021
  • 76 percent say it is important for themselves personally to bet through a legal operator, up 11 percent from 2021
  • 55 percent of bettors plan to wager on the Los Angeles Rams compared to 45 percent on the Cincinnati Bengals
  • 18.2 million American adults will place traditional sports wagers online, at a retail sportsbook or with a bookie, up 78 percent from 2021
  • Mobile bets make up about 86% of legal sports wagers


Aside from Super Bowl LVI

Revenue for sports betting in the U.S. reached $4.29 billion in 2021, up from $1.55 billion in the prior year, according to the AGA. Before the Supreme Court ruling, in 2017, the industry produced only $266.5 million in revenue.

Only a month ago New York made its debut allowing sports gambling on January 8, 2022. The state quickly became the top market in the U.S. About $1.63 billion in bets were placed over cellphones during the month in New York, according to the AGA. In New Jersey, the second-biggest market, there were $1.11 billion in mobile wagers in December; January’s figures are expected to be released soon.

Sports-betting operators have sought to acquire rival companies to scale up their businesses in the increasingly competitive industry. The companies are also spending billions of dollars to promote their brands to find an edge.

Take-Away

According to Bill Miller, AGA President and CEO, “We will see increased growth and increased opportunity for Americans to legally bet on sports.”

The ability to wager on a sport could include esports competitions, individual plays on the fly in televised major league events, professional bowling, and almost any other game that exists where there is a willingness to wager on an outcome. This industry is expected to not only expand as new states open, but it should also increase revenue as more spectators gamble on the outcome of individual plays, or periods, quarters, or innings within an event.

Paul Hoffman

Managing Editor, Channelchek

Suggested Content


Digital, Media & Entertainment Industry – Industry Report (Jan. 2022)


Engine Media Holdings C-Suite Interview (Video)


eSports Entertainment Group C-Suite Interview (Video)


Why Zoom Meetings Can Leave You Fatigued


Sources

https://www.americangaming.org/new/record-31-4-million-americans-to-wager-on-super-bowl-lvi/

https://cheddar.com/media/video-games-m-and-a-battleground-heating-up-between-industry-giants

https://www.empirestakes.com/ny-sports-bettings


Stay up to date. Follow us: