Euroseas (ESEA) – Stock Price Weakness Doesn’t Match Slight Miss

Wednesday, November 17, 2021

Euroseas (ESEA)
Stock Price Weakness Doesn’t Match Slight Miss

Euroseas Ltd. provides ocean-going transportation services worldwide. The company owns and operates containerships that transport dry and refrigerated containerized cargoes, including manufactured products and perishables; and drybulk carriers that transport iron ore, coal, grains, bauxite, phosphate, and fertilizers. As of March 31, 2017, it had a fleet of seven containerships; and six drybulk carriers, including three Panamax drybulk carriers, one Handymax drybulk carrier, one Kamsarmax drybulk carrier, and one Ultramax drybulk carrier. The company was founded in 2005 and is based in Maroussi, Greece.

Poe Fratt, Senior Research Analyst, Noble Capital Markets, Inc.

Refer to the full report for the price target, fundamental analysis, and rating.

    A Slight Miss. Adjusted 3Q2021 EBITDA of $10.6 million included dry dock expenses of $2.7 million. After adding back dry dock expenses, our adjusted 3Q2021 EBITDA of $13.3 million was slightly below expectations of $13.8 million due to higher opex costs.

    Adjusting 2021 EBITDA estimate to incorporate 3Q2021 results.  Fine tuning our 2021 EBITDA estimate to $53.9 million based on TCE rates of $18.6k/day to reflect 3Q2021 operating results and slightly higher opex. As discussed in our most recent note, forward cover is full and the Corfu is repositioning toward China on a short charter prior to dry docking …


This research is provided by Noble Capital Markets, Inc., a FINRA and S.E.C. registered broker-dealer (B/D).

*Analyst certification and important disclosures included in the full report. NOTE: investment decisions should not be based upon the content of this research summary.  Proper due diligence is required before making any investment decision. 

Cancers Predator-Prey Relationship with New Treatments and the Immune System


Image Credit: Jean van der Meulen (Pexels)

Cancers Are in an Evolutionary Battle with Treatments – Evolutionary Game Theory Could Tip the Advantage to Medicine


Cancer was the second leading cause of death in the U.S. in 2020. Although billions of dollars have been poured into cancer research, the results are still disappointing for many patients who pay hundreds of thousands of dollars to extend their lives for just a few more months. But why do cancer therapies fail?


This article was republished with permission from The Conversation, a news site dedicated to sharing ideas from academic experts. It was written by and represents the research-based opinions of, Anuraag Bukkuri, PhD Student in Integrated Mathematical Oncology, University of South Florida


I’m a doctoral student at the Moffitt Cancer Center and the University of South Florida who develops and applies mathematical and evolutionary theories to understand how cancer works and how to best treat it. And I believe that approaching cancer treatment through the lens of ecology and evolution may help doctors and researchers grapple with this question and fight more effectively against cancer.

Cancer can be seen as being in a predator-prey relationship with the immune system of the body, where cancer is the prey and the immune system is the predator.


Standard Treatment Protocols

For decades, standard treatment for cancer involved bombarding patients with the maximum tolerable dose of a drug, attempting to kill as many cancer cells as possible while minimizing adverse side effects.

However, the cancer cells that make up a tumor are not all the same. By random chance, some of these cells develop mutations, or alterations in the cell’s genetic material, that make them immune to a drug. These cells can then proliferate and repopulate the tumor, leading to therapeutic resistance that renders the drug ineffective.

When this occurs, physicians typically switch to another drug that targets a different aspect of the cancer cells. This continues until a therapy is able to effectively control the cancer or no more drugs are available, at which point patients are provided hospice care to make their last days as comfortable as possible.

This protocol has led to the development of a plethora of drugs that target specific features of the tumor’s biology, from boosting the body’s natural defense system to blocking chemical signals on the cancer cells to prevent them from growing. Though some of these drugs have proved to be incredibly effective in a subset of patients, this approach does not work for everyone.


The Role of Evolutionary Game Theory

To improve long-term outcomes for all patients, cancer researchers ask two critical questions: How do tumors grow, and how do they become resistant? Looking at cancer through the lens of ecology and evolution, or how the environment of the body molds and is molded by evolving cancer cells over time, can help answer these questions.

One way to think through this is with evolutionary game theory, which uses rigorous mathematics to try to predict how something will react to changes in its environment in a way that maximizes its fitness, or its ability to reproduce.

Evolutionary game theory can help
researchers understand the effect of selective pressures, which are external
factors that affect an organism’s survival. In the case of cancer, selective
pressures can be therapies, and EGT helps researchers understand their effects
on how cancer cells interact with one another and their environment.

For example, consider the principle of the double bind. In nature, this refers to how a prey’s tactic for avoiding one predator results in an increase in the prey’s susceptibility to another. For example, gerbils seek refuge from owls by hiding in bushes scattered across a desert. But snakes are waiting to strike under some of these bushes. The gerbil’s tactics to avoid one predator make it more vulnerable to the other.

Similarly, in cancer, therapies can be administered in a way that leads to a double bind by which the cancer’s growing resistance to one therapy leaves it more susceptible to other therapies. This puts the cancer in an evolutionary trap created from its own adaptations.

These mathematical models have paved the way for the development of therapies using principles from ecology and evolution to better treat and manage cancer. For example, one lung cancer clinical trial gave patients an immunotherapy, which teaches the body’s immune system to recognize and destroy cancer cells, followed by a chemotherapy, which kills cancer cells directly. Exposure to the first treatment sensitized the cancer cells to the second, making the combined treatments more effective than they would have been by themselves.


Looking Ahead

Evolutionary game theory can help researchers and oncologists more effectively predict how cancers will respond to different treatments and potentially control the evolutionary trajectory of cancer. This could help ensure optimal outcomes for patients.

While there has been a lot of progress in treating cancer, there’s still a long way to go to make all forms of cancer manageable diseases. One promising path to that goal is harnessing the power of evolution to keep the pressure on cancer.


Suggested Reading:


For Stem Cells, Bigger Doesn’t Mean Better


Pros and Cons of FDA Funded in Part by Companies


Attacking Tumors by Returning Cancer Cells to the Body


CPI and PPI Both Suggests Persistent Inflation


Stay up to date. Follow us:


Cancer’s Predator-Prey Relationship with New Treatments and the Immune System


Image Credit: Jean van der Meulen (Pexels)

Cancers Are in an Evolutionary Battle with Treatments – Evolutionary Game Theory Could Tip the Advantage to Medicine


Cancer was the second leading cause of death in the U.S. in 2020. Although billions of dollars have been poured into cancer research, the results are still disappointing for many patients who pay hundreds of thousands of dollars to extend their lives for just a few more months. But why do cancer therapies fail?


This article was republished with permission from The Conversation, a news site dedicated to sharing ideas from academic experts. It was written by and represents the research-based opinions of, Anuraag Bukkuri, PhD Student in Integrated Mathematical Oncology, University of South Florida


I’m a doctoral student at the Moffitt Cancer Center and the University of South Florida who develops and applies mathematical and evolutionary theories to understand how cancer works and how to best treat it. And I believe that approaching cancer treatment through the lens of ecology and evolution may help doctors and researchers grapple with this question and fight more effectively against cancer.

Cancer can be seen as being in a predator-prey relationship with the immune system of the body, where cancer is the prey and the immune system is the predator.


Standard Treatment Protocols

For decades, standard treatment for cancer involved bombarding patients with the maximum tolerable dose of a drug, attempting to kill as many cancer cells as possible while minimizing adverse side effects.

However, the cancer cells that make up a tumor are not all the same. By random chance, some of these cells develop mutations, or alterations in the cell’s genetic material, that make them immune to a drug. These cells can then proliferate and repopulate the tumor, leading to therapeutic resistance that renders the drug ineffective.

When this occurs, physicians typically switch to another drug that targets a different aspect of the cancer cells. This continues until a therapy is able to effectively control the cancer or no more drugs are available, at which point patients are provided hospice care to make their last days as comfortable as possible.

This protocol has led to the development of a plethora of drugs that target specific features of the tumor’s biology, from boosting the body’s natural defense system to blocking chemical signals on the cancer cells to prevent them from growing. Though some of these drugs have proved to be incredibly effective in a subset of patients, this approach does not work for everyone.


The Role of Evolutionary Game Theory

To improve long-term outcomes for all patients, cancer researchers ask two critical questions: How do tumors grow, and how do they become resistant? Looking at cancer through the lens of ecology and evolution, or how the environment of the body molds and is molded by evolving cancer cells over time, can help answer these questions.

One way to think through this is with evolutionary game theory, which uses rigorous mathematics to try to predict how something will react to changes in its environment in a way that maximizes its fitness, or its ability to reproduce.

Evolutionary game theory can help
researchers understand the effect of selective pressures, which are external
factors that affect an organism’s survival. In the case of cancer, selective
pressures can be therapies, and EGT helps researchers understand their effects
on how cancer cells interact with one another and their environment.

For example, consider the principle of the double bind. In nature, this refers to how a prey’s tactic for avoiding one predator results in an increase in the prey’s susceptibility to another. For example, gerbils seek refuge from owls by hiding in bushes scattered across a desert. But snakes are waiting to strike under some of these bushes. The gerbil’s tactics to avoid one predator make it more vulnerable to the other.

Similarly, in cancer, therapies can be administered in a way that leads to a double bind by which the cancer’s growing resistance to one therapy leaves it more susceptible to other therapies. This puts the cancer in an evolutionary trap created from its own adaptations.

These mathematical models have paved the way for the development of therapies using principles from ecology and evolution to better treat and manage cancer. For example, one lung cancer clinical trial gave patients an immunotherapy, which teaches the body’s immune system to recognize and destroy cancer cells, followed by a chemotherapy, which kills cancer cells directly. Exposure to the first treatment sensitized the cancer cells to the second, making the combined treatments more effective than they would have been by themselves.


Looking Ahead

Evolutionary game theory can help researchers and oncologists more effectively predict how cancers will respond to different treatments and potentially control the evolutionary trajectory of cancer. This could help ensure optimal outcomes for patients.

While there has been a lot of progress in treating cancer, there’s still a long way to go to make all forms of cancer manageable diseases. One promising path to that goal is harnessing the power of evolution to keep the pressure on cancer.


Suggested Reading:


For Stem Cells, Bigger Doesn’t Mean Better


Pros and Cons of FDA Funded in Part by Companies


Attacking Tumors by Returning Cancer Cells to the Body


CPI and PPI Both Suggests Persistent Inflation


Stay up to date. Follow us:


Stocks that May Benefit from the $7.5b Spending on EV Charging Stations


Image Credit: DennisM2 (Flickr)

Pure Plays in EV Charging Infrastructure


Which came first, the charging station or the EV?

The infrastructure act just signed into law set aside $7.5 billion in federal grant money to build out a network of electric vehicle charging stations. Earlier goals out of Washington call for all new vehicles sold in the U.S. to be electric by 2030. According to Pew Research, about four-in-ten Americans say the next time they purchase a vehicle, they will consider electric. While this may create investment opportunities in new and existing car companies, the infrastructure needed to support this growth is arguably more important.

Below we highlight three electric car charging station companies that are near 100% focused on this business and may benefit from the grant money, as well as growing natural demand. The companies have uniquely different financial characteristics and, therefore, may appeal to different investors.

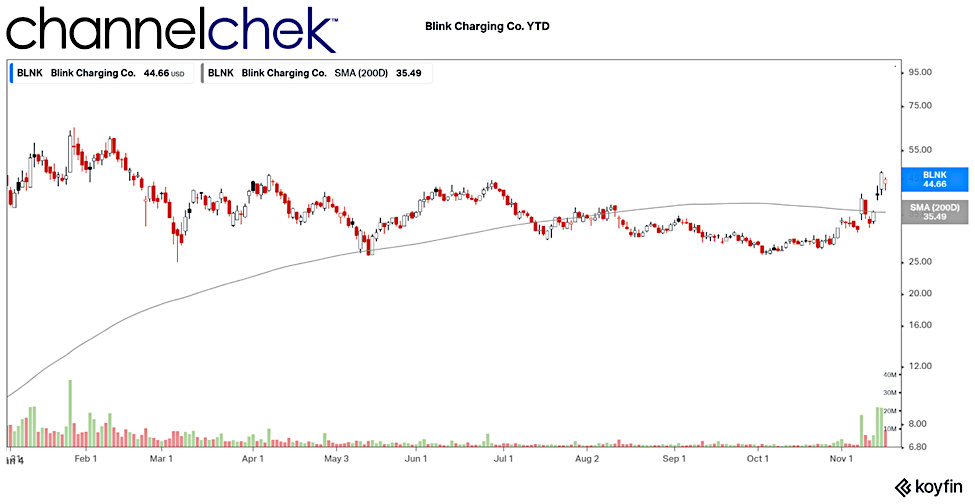
Blink Charging Co. (BLNK) is a single segment business that owns and operates charging stations for electric vehicles. The company is building out a network of both residential and commercial charging equipment to provide EV owners access to power at various types of locations.

Blink stock has been trading sideways since the beginning of the year. The signing of the infrastructure bill this week helped drive Blink above its 200 day moving average. Blink is headquartered in the USA and operates out of Miami, FL.  The stock is currently trading in the mid-40s and has a market cap of $1.96 billion.


Source: Koyfin


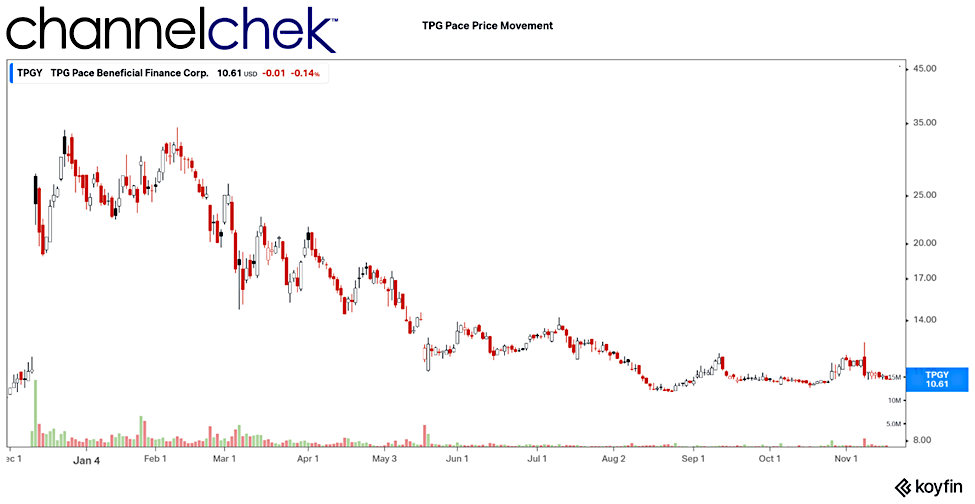
TSG Group (
TPGY) is a SPAC that is moving toward an agreed-upon merger with EVBox. The intention is to list on the New York Stock Exchange through a merger with investment firm TPG Pace Beneficial Finance. Dutch-owned EVBox has a large footprint throughout Europe. The funds from the SPAC merger would be used to expand the global focus to include North America, and to expand their technology. The final SPAC merger has yet to be completed (or scheduled). TSG Group stock is trading closer to its $10 SPAC IPO price than it has since the announced merger late last year. The market cap is currently $465 million.


Source: Koyfin


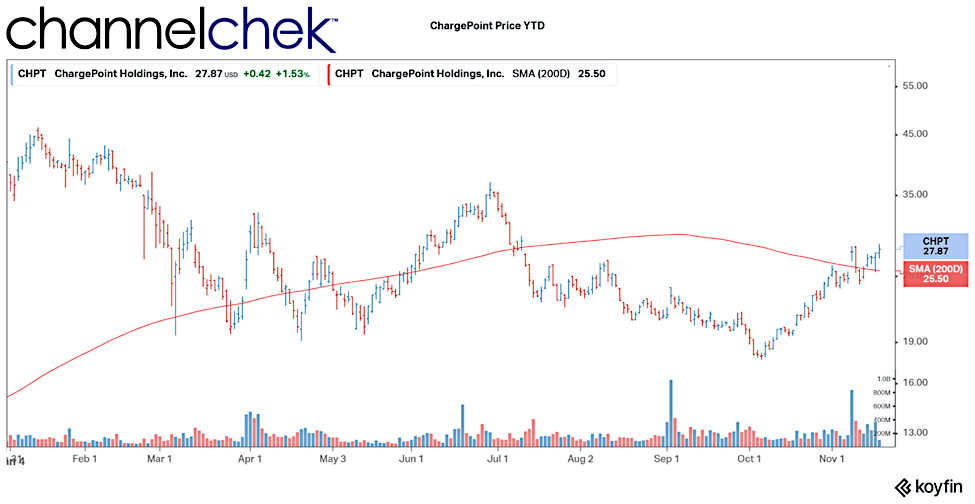
ChargePoint Holdings, Inc. (CHPT) is a U.S.-based company operating exclusively in North America out of Campbell, CA. Founded in 2007, ChargePoint provides charging networks and solutions for residential, commercial and fleet vehicle power. They are the largest charging network in the world with over 20,000 locations.

As the largest of the EV charging stocks on this list, CHPT has a market cap of approximately $9 billion. Since the beginning of 2021, the stock has traded in a wide range with a high of $46.50 (January) and a low of $17.51 (October). The trend has been upward since just before the signed infrastructure act, the stock is currently trading closer to the bottom of the range at $27.50.


Image Credit: Koyfin


Take-Away

It would be tough for the electric vehicle revolution to continue its momentum without the ability for drivers to be confident they can power up en route. This is why the original infrastructure bill committed twice as much to EV charging stations than the final version.

Large traditional energy companies like Shell and BP, and car companies like Hyundai and Tesla are not pure-plays in charging station infrastructure, although they are also building them. Among those companies that are near 100% focused and could benefit the most from the new spending plans, the company size, country of origin, current footprint, and even M&A situation should be reviewed before an investor takes aim.

Channelchek provides data, news stories, and research on small and microcap stocks. Be sure to insert the ticker you’re interested in on our company data section to supplement your due diligence.

Paul Hoffman

Managing Editor, Channelchek


Suggested Reading:


The Far-Reaching Impact of the Signed $1.2 Trillion Infrastructure Law


How Does the Government Go About Spending the Infrastructure Money?


Lithium Recycling Market Expected to Boom 20% Per Year with Battery Demand


Will U.S. Car Companies be Handed Different EV Advantages?


Sources:

https://www.pewresearch.org/fact-tank/2021/06/03/electric-vehicles-get-mixed-reception-from-american-consumers/

https://www.electrive.com/2020/12/13/evbox-aiming-for-ipo-on-nyse-in-spring-2021/

https://energydigital.com/top10/10-largest-electric-charger-companies-world

www.koyfin.com


Stay up to date. Follow us:


Euroseas (ESEA) – Stock Price Weakness Doesnt Match Slight Miss

Wednesday, November 17, 2021

Euroseas (ESEA)
Stock Price Weakness Doesn’t Match Slight Miss

Euroseas Ltd. provides ocean-going transportation services worldwide. The company owns and operates containerships that transport dry and refrigerated containerized cargoes, including manufactured products and perishables; and drybulk carriers that transport iron ore, coal, grains, bauxite, phosphate, and fertilizers. As of March 31, 2017, it had a fleet of seven containerships; and six drybulk carriers, including three Panamax drybulk carriers, one Handymax drybulk carrier, one Kamsarmax drybulk carrier, and one Ultramax drybulk carrier. The company was founded in 2005 and is based in Maroussi, Greece.

Poe Fratt, Senior Research Analyst, Noble Capital Markets, Inc.

Refer to the full report for the price target, fundamental analysis, and rating.

    A Slight Miss. Adjusted 3Q2021 EBITDA of $10.6 million included dry dock expenses of $2.7 million. After adding back dry dock expenses, our adjusted 3Q2021 EBITDA of $13.3 million was slightly below expectations of $13.8 million due to higher opex costs.

    Adjusting 2021 EBITDA estimate to incorporate 3Q2021 results.  Fine tuning our 2021 EBITDA estimate to $53.9 million based on TCE rates of $18.6k/day to reflect 3Q2021 operating results and slightly higher opex. As discussed in our most recent note, forward cover is full and the Corfu is repositioning toward China on a short charter prior to dry docking …


This research is provided by Noble Capital Markets, Inc., a FINRA and S.E.C. registered broker-dealer (B/D).

*Analyst certification and important disclosures included in the full report. NOTE: investment decisions should not be based upon the content of this research summary.  Proper due diligence is required before making any investment decision. 

Ceapro Inc. Reports 2021 Third Quarter and Nine-Month Financial Results and Operational Highlights


Ceapro Inc. Reports 2021 Third Quarter and Nine-Month Financial Results and Operational Highlights


– Increased R&D activities focused on the completion of a clinical trial for oat beta glucan as a potential cholesterol reducer and on the development of yeast beta glucan as a potential inhalable therapeutic for COVID-19 –

 Q3 2021 record sales of $4,523,000 compared to $3,476,000 for Q3 2020, representing a 30% increase –

– Net profit of $875,000 for Q3 2021 vs. net profit of $192,000 for Q3 2020, a 356% increase –

 Achieved record production levels despite COVID-19 pandemic situation –

EDMONTON, Alberta, Nov. 17, 2021 (GLOBE NEWSWIRE) — Ceapro Inc. (TSX-V: CZO; OTCQX: CRPOF) (“Ceapro” or the “Company”), a growth-stage biotechnology company focused on the development and commercialization of active ingredients for healthcare and cosmetic industries, today announced financial results and operational highlights for the third quarter and the first nine months ended September 30, 2021.

“Progress continues on all fronts from production operations to research and development, allowing us to advance our pipeline while expanding our business model. We are extremely proud of our employees who worked tirelessly since the beginning of the year to maintain operations and deliver these very solid results despite the COVID-19 pandemic. As we continue to move forward, our focus remains on the health and safety of our associates, followed by business continuity,” stated Gilles Gagnon, M.Sc., MBA, President and CEO.

Corporate and Operational Highlights

Pipeline Development:

  • Pursued the development of new PGX-dried chemical complexes for potential applications under various forms like pills, capsules, fast dissolving strips and face masks. Alginate and yeast beta glucan to become key products of Ceapro’s portfolio.
  • Resumed bioavailability studies with University of Alberta for new chemical complexes yeast beta glucan-CoQ10, alginate-CoQ10 and newly formed alginate yeast beta glucan-CoQ10.
  • Announced research agreement with Boston-based Angiogenesis Foundation to assess in vivo bioefficacy of oat beta glucan and avenanthramides in angiogenesis, blood vessel repairs, wound healing and tissue regeneration in various inflammation-based diseases and conditions like COVID-19 presenting damages of the lung blood vessels.
  • Expanded collaboration with Montreal Heart Institute to initiate a Phase 1 clinical trial to assess safety and tolerability of pharmaceutical grade avenanthramides powder formulation.
  • Conducting in vivo studies with McMaster University with yeast beta glucan as a potential inhalable therapeutic.

Technology:

  • Pursued installment in Edmonton of a commercial scale unit for impregnation of bioactives with PGX-processed biopolymers.
  • Ongoing engineering design for PGX processing commercial unit.

Production Operations:

  • Achieved record levels with production of over 70 MT of finished products during the last quarter reliably providing our customers essential high quality products.

Subsequent to Quarter:

  • Announced discovery of a new mechanism of action for PGX processed yeast beta glucan (PGX-YBG) as a potential inhalable therapeutic for lung fibrotic diseases including COVID-19 patients.
    • PGX-YBG binds to specific receptors (Dectin 1) located on macrophages responsible for the cascade of immunomodulating events when activated.
    • McMaster’s research team demonstrates ability of PGX-YBG to reprogram macrophages on its own.
  • Reported preliminary results from clinical trial evaluating oat beta glucan in patients with high cholesterol levels. The study did not achieve the expected primary endpoint related to a decrease of low-density lipoproteins cholesterol when using Ceapro’s pill dosage form. While there was no statistically significant difference between the placebo group and the different dosages of beta glucan, there were positive signals that beta glucan nutraceutical formulation may offer appreciable health benefits as indicated with approved Health Canada’s beta glucan monograph (Natural Product Division)

Financial Highlights for the Third Quarter and Nine-Month Period Ended September 30, 2021

  • Total sales of $4,523,000 for the third quarter of 2021 and $13,633,000 for the first nine months of 2021 compared to $3,476,000 and $12,415,000 for the comparative periods in 2020. The 10% increase in sales for the first nine months is mainly due to a significant increase in sales of avenanthramides in the USA compared to the same period in 2020.
  • Net profit of $875,000 for the third quarter of 2021 and $2,067,000 for the first nine months of 2021 compared to a net profit of $192,000 and $2,395,000 for the comparative periods in 2020. Increased net profit for the third quarter of 2021 comes from improved margin of 65.2% as compared to 47.8% in 2020. Improved margins in 2021 result from the buying of excellent source material and from the diligent work of highly skilled personnel operating in only one site as compared to two sites in 2020.
  • R&D investments were $1,400,000 for Q3 2021 compared to $479,000 for the same period in 2020. The significant increase being due to payments made to Montreal Heart Institute for a clinical trial for the assessment of oat beta glucan as a potential cholesterol reducer by almost $1.0 million during Q3 2021.
  • Cash flows generated from operations of $2,837,000for the first nine months in 2021 vs $4,777,000 in 2020.
  • Positive working capital balance of $10,367,000 as of September 30, 2021.

“Looking ahead, while considering the ongoing potential economic impact related to COVID-19, evolving consumption trends and escalating inflationary levels we believe Ceapro is well-positioned to once again deliver a strong growth in sales well in line with the positive trend achieved over the last years. While we have experienced a “bump in the road” with the beta glucan trial, our solid base business and expanded pipeline will enable us to pursue the expansion of our business model to the nutraceutical sector with avenanthramides and yeast beta glucan for which we are going to conduct more preclinical assays before investing at large scale levels. With a strong balance sheet, a group of dedicated people, and a solid base business, coupled with the innovative technologies and products that we have developed to enable us to expand, Ceapro is poised to emerge as a successful life science company,” concluded Mr. Gagnon.

         
CEAPRO INC.        
Condensed Interim Consolidated Balance Sheets        
Unaudited        
         
  September 30,   December 31,  
  2021   2020  
  $   $  
         
ASSETS        
Current Assets        
Cash and cash equivalents 7,410,214   5,369,029  
Trade receivables 2,716,058   2,019,723  
Other receivables 39,522   102,224  
Inventories (note 3) 1,532,271   1,210,079  
Prepaid expenses and deposits 133,760   348,845  
         
Total Current Assets 11,831,825   9,049,900  
         
Non-Current Assets        
Investment tax credits receivable 607,700   607,700  
Deposits 82,124   82,124  
Licences (note 4) 16,292   18,514  
Property and equipment (note 5) 17,776,791   18,591,189  
Deferred tax assets 874,304   874,304  
         
Total Non-Current Assets 19,357,211   20,173,831  
         
TOTAL ASSETS 31,189,036   29,223,731  
         
LIABILITIES AND EQUITY        
Current Liabilities        
Accounts payable and accrued liabilities 1,097,645   1,067,622  
Current portion of lease liabilities (note 6) 286,608   250,658  
Current portion of CAAP loan (note 8) 80,811   72,263  
         
Total Current Liabilities 1,465,064   1,390,543  
         
Non-Current Liabilities        
Long-term lease liabilities (note 6) 2,432,682   2,648,917  
Deferred tax liabilities 874,304   874,304  
         
Total Non-Current Liabilities 3,306,986   3,523,221  
         
TOTAL LIABILITIES 4,772,050   4,913,764  
         
Equity        
Share capital (note 7 (b)) 16,557,401   16,511,067  
Contributed surplus (note 7 (e)) 4,676,456   4,682,393  
Retained earnings 5,183,129   3,116,507  
         
Total Equity 26,416,986   24,309,967  
         
TOTAL LIABILITIES AND EQUITY 31,189,036   29,223,731  


CEAPRO INC.
Condensed Interim Consolidated Statements of Net Income and Comprehensive Income
Unaudited
     
  Quarters   Nine Months  
  Ended September 30,   Ended September 30,  
  2021   2020   2021   2020  
  $   $   $   $  
           
Revenue (note 14) 4,522,980   3,475,625   13,633,354   12,414,970  
Cost of goods sold 1,573,655   1,814,080   5,787,608   5,794,573  
           
Gross margin 2,949,325   1,661,545   7,845,746   6,620,397  
           
Research and product development 1,403,186   478,993   3,050,544   1,381,332  
General and administration 766,605   791,217   2,431,659   2,494,514  
Sales and marketing 4,957   12,395   34,557   89,830  
Finance costs (note 11) 37,684   43,066   169,938   189,258  
           
Income from operations 736,893   335,874   2,159,048   2,465,463  
           
Other (expenses) income (note 10) 138,381   (144,251 ) (92,426 ) (70,746 )
           
Income before tax 875,274   191,623   2,066,622   2,394,717  
           
Income taxes        
           
Total comprehensive income for the period 875,274   191,623   2,066,622   2,394,717  
           
Net income per common share (note 17):          
Basic 0.01   0.00   0.03   0.03  
Diluted 0.01   0.00   0.03   0.03  
           
Weighted average number of common shares outstanding (note 17):          
Basic 77,684,017   77,610,113   77,669,747   77,585,679  
Diluted 78,740,532   78,700,415   78,694,469   78,039,105  


CEAPRO INC.
Condensed Interim Consolidated Statements of Cash Flows
Unaudited
     
  2021   2020  
Nine Months Ended September 30, $   $  
OPERATING ACTIVITIES    
Net income for the period 2,066,622   2,394,717  
Adjustments for items not involving cash    
Finance costs 106,390   117,237  
Transaction costs   1,108  
Depreciation and amortization 1,408,392   1,382,838  
Gain on disposal of equipment (5,000 )  
Accretion 8,548   15,913  
Share-based payments 13,672   122,902  
Net income for the period adjusted for non-cash items 3,598,624   4,034,715  
CHANGES IN NON-CASH WORKING CAPITAL ITEMS    
Trade receivables (696,335 ) 1,821,449  
Other receivables 62,702   (96,375 )
Inventories (322,192 ) (522,670 )
Prepaid expenses and deposits 137,618   12,471  
Accounts payable and accrued liabilities relating to operating activities 163,017   (355,552 )
Total changes in non-cash working capital items (655,190 ) 859,323  
Net income for the period adjusted for non-cash and working capital items 2,943,434   4,894,038  
Interest paid (106,390 ) (117,237 )
CASH GENERATED FROM OPERATIONS 2,837,044   4,776,801  
INVESTING ACTIVITIES    
Purchase of property and equipment (494,833 ) (222,610 )
Purchase of leasehold improvements (19,472 )  
Proceeds from sale of equipment 5,000   353  
Accounts payable and accrued liabilities relating to investing activities (132,994 ) 14,161  
CASH USED IN INVESTING ACTIVITIES (642,299 ) (208,096 )
FINANCING ACTIVITIES    
Stock options exercised 26,725   3,013  
Repayment of long-term debt   (112,973 )
Repayment of lease liabilities (180,285 ) (197,537 )
CASH USED IN FINANCING ACTIVITIES (153,560 ) (307,497 )
Increase in cash and cash equivalents 2,041,185   4,261,208  
     
Cash and cash equivalents at beginning of the period 5,369,029   1,857,195  
     
Cash and cash equivalents at end of the period 7,410,214   6,118,403  
     

The complete financial statements are available for review on SEDAR at https://sedar.com/Ceapro and on the Company’s website at www.ceapro.com.

About Ceapro Inc.

Ceapro Inc. is a Canadian biotechnology company involved in the development of proprietary extraction technology and the application of this technology to the production of extracts and “active ingredients” from oats and other renewable plant resources. Ceapro adds further value to its extracts by supporting their use in cosmeceutical, nutraceutical, and therapeutics products for humans and animals. The Company has a broad range of expertise in natural product chemistry, microbiology, biochemistry, immunology and process engineering. These skills merge in the fields of active ingredients, biopharmaceuticals and drug-delivery solutions. For more information on Ceapro, please visit the Company’s website at www.ceapro.com.

For more information contact:

Jenene Thomas
JTC Team, LLC
Investor Relations and Corporate Communications Advisor
T (US): +1 (833) 475-8247
E: czo@jtcir.com

This press release does not express or imply that the Company claims its product has the ability to eliminate, cure or contain the SARS-2-CoV-2 (COVID-19) at this time.

Neither TSX Venture Exchange nor its Regulation Services Provider (as that term is defined in the policies of the TSX Venture Exchange) accepts responsibility for the adequacy or accuracy of this release.

Source: Ceapro Inc.

QuickChek – November 17, 2021


Azarga Uranium Shareholders Approve Merger with enCore Energy

enCore Energy announced that the shareholders of Azarga Uranium Corp. have approved the plan of arrangement with enCore previously announced on September 7th, 2021

Research, News & Market Data on enCore Energy

Watch recent presentation from enCore Energy


Ceapro Inc. Reports 2021 Third Quarter and Nine-Month Financial Results and Operational Highlights

Ceapro Inc. announced financial results and operational highlights for the third quarter and the first nine months ended September 30, 2021

Ceapro Inc. Reports Preliminary Results from Clinical Trial Evaluating Oat Beta Glucan in Patients with High Cholesterol Levels

Ceapro Inc. announced preliminary results from the clinical study entitled “A Multicenter, Randomized, Double-Blind, Parallel Group, Placebo-Controlled Study to Compare the Efficacy and Safety of High-Medium Molecular Weight Beta-Glucan as Add-On to Statin Therapy in Subjects with Hyperlipidemia”

Research, News & Market Data on Ceapro


Comtech Telecommunications Corp. Awarded $1.8 Million Contract for High-Power Solid-State Amplifiers

Comtech Telecommunications announced that during its first quarter of fiscal 2022, it was awarded an additional contract valued at $1.8 million for RF microwave solid-state amplifiers from a major domestic prime contractor

Research, News & Market Data on Comtech

Watch recent presentation from Comtech


Schwazze Signs Definitive Agreement to Acquire MCG, LLC

Schwazze announced that it has signed definitive documents to acquire MCG, LLC (“Emerald Fields”)

Research, News & Market Data on Schwazze

Watch recent presentation from Schwazze


Stay up to date. Follow us:


Schwazze Signs Definitive Agreement to Acquire MCG, LLC


Schwazze Signs Definitive Agreement to Acquire MCG, LLC


Schwazze Continues its Colorado Expansion Strategy with Emerald Fields Cannaboutique Dispensaries in Manitou Springs & Glendale, CO


DENVER, Nov. 16, 2021 /CNW/ – Schwazze, (OTCQX: SHWZ) (“Schwazze” or the “Company”), announced that it has signed definitive documents to acquire MCG, LLC (“Emerald Fields”).  Emerald Fields owns and operates two retail cannabis dispensaries, located in Manitou Springs and Glendale, Colorado.  This acquisition is part of the Company’s continuing retail expansion plan in Colorado bringing the total number of dispensaries including announced acquisitions to 22.

Total consideration for the acquisition will be $29 million and will be paid as 60% cash and 40% Schwazze common stock upon closing.  The acquisition is targeted to close in the next 75 days, subject to closing conditions and covenants customary for this type of transaction, including, without limitation, obtaining Colorado Marijuana Enforcement Division and local licensing approval.

“Our team is delighted to add the Emerald Fields Cannaboutiques to our growing portfolio of dispensaries and are eager to welcome the team to Schwazze. Manitou Springs and Glendale are attractive locations and are valuable assets to our overall acquisitions plans as we continue to build out Colorado.  Our team is excited to add another store brand to our house of brands.”  said Justin Dye, Schwazze’s CEO.

About Schwazze
Schwazze (OTCQX: SHWZ) is building the premier vertically integrated cannabis company in Colorado and plans to take its operating system to other states where it can develop a differentiated leadership position.  Schwazze is the parent company of a portfolio of leading cannabis businesses and brands spanning seed to sale.  The Company is committed to unlocking the full potential of the cannabis plant to improve the human condition.  Schwazze is anchored by a high-performance culture that combines customer-centric thinking and data science to test, measure, and drive decisions and outcomes.  The Company’s leadership team has deep expertise in retailing, wholesaling, and building consumer brands at Fortune 500 companies as well as in the cannabis sector.  Schwazze is passionate about making a difference in our communities, promoting diversity and inclusion, and doing our part to incorporate climate-conscious best practices.  Medicine Man Technologies, Inc. was Schwazze’s former operating trade name.  The corporate entity continues to be named Medicine Man Technologies, Inc.

Schwazze derives its name from the pruning technique of a cannabis plant to enhance plant structure and promote healthy growth.

Forward-Looking Statements

This press release contains “forward-looking statements.” Such statements may be preceded by the words “plan,” “will,” “may,”, “predicts,” or similar words. Forward-looking statements are not guarantees of future events or performance, are based on certain assumptions, and are subject to various known and unknown risks and uncertainties, many of which are beyond the Company’s control and cannot be predicted or quantified. Consequently, actual events and results may differ materially from those expressed or implied by such forward-looking statements. Such risks and uncertainties include, without limitation, risks and uncertainties associated with (i) our inability to manufacture our products and product candidates on a commercial scale on our own or in collaboration with third parties; (ii) difficulties in obtaining financing on commercially reasonable terms; (iii) changes in the size and nature of our competition; (iv) loss of one or more key executives or scientists; (v) difficulties in securing regulatory approval to market our products and product candidates; (vi) our ability to successfully execute our growth strategy in Colorado and outside the state, (vii) our ability to consummate the acquisition described in this press release or to identify and consummate future acquisitions that meet our criteria, (viii) our ability to successfully integrate acquired businesses and realize synergies therefrom, (ix) the ongoing COVID-19 pandemic, * the timing and extent of governmental stimulus programs, and (xi) the uncertainty in the application of federal, state and local laws to our business, and any changes in such laws. More detailed information about the Company and the risk factors that may affect the realization of forward-looking statements is set forth in the Company’s filings with the Securities and Exchange Commission (SEC), including the Company’s Annual Report on Form 10-K and its Quarterly Reports on Form 10-Q. Investors and security holders are urged to read these documents free of charge on the SEC’s website at http://www.sec.gov. The Company assumes no obligation to publicly update or revise its forward-looking statements as a result of new information, future events or otherwise except as required by law.

SOURCE Schwazze


Ceapro Inc. Reports Preliminary Results from Clinical Trial Evaluating Oat Beta Glucan in Patients with High Cholesterol Levels


Ceapro Inc. Reports Preliminary Results from Clinical Trial Evaluating Oat Beta Glucan in Patients with High Cholesterol Levels


EDMONTON, Alberta, Nov. 17, 2021 (GLOBE NEWSWIRE) — Ceapro Inc. (TSX-V: CZO; OTCQX: CRPOF) (“Ceapro” or the “Company”), a growth-stage biotechnology company focused on the development and commercialization of active ingredients for healthcare and cosmetic industries, today reported preliminary results from the clinical study entitled “A Multicenter, Randomized, Double-Blind, Parallel Group, Placebo-Controlled Study to Compare the Efficacy and Safety of High-Medium Molecular Weight Beta-Glucan as Add-On to Statin Therapy in Subjects with Hyperlipidemia”. Following a protocol amendment, patients not treated with a statin were also eligible to enter the study.  

This clinical trial assessed the safety and efficacy of three dosages of oat beta glucan administered as 500 mg pills (1.5 g, 3 g and 6 g per day) compared to placebo. A total of 263 patients (169 females and 94 males) were enrolled in the study. The majority of patients did not receive a statin. The overall compliance to study pill intake was greater than 80%. From a safety perspective, there was no death and beta glucan was generally well tolerated.

The effect of oat beta glucan on the study primary endpoint of change in low-density lipoprotein cholesterol (LDL-C) was not statistically significant compared to placebo. Of note, amongst some positive findings observed with different parameters, there were dosage-related responses in weight and body-mass index at 12 weeks, but they also did not reach statistical significance.

“While we had hoped for a more definitive statistically significant outcome, many observations send some positive signals. They are in accordance with recent data by Cicero et al.1 on another beta glucan nutraceutical formulation and reinforce the hypothesis that oat beta glucan may offer appreciable health benefits, as indicated in Health Canada’s oat beta glucan approved monograph. While Ceapro’s oat beta glucan product complies with requirements for market authorization for a natural product and seeks to surpass marketed products, continued efforts may be warranted to explore its effect on weight and body-mass index with prolonged exposure and possibly higher dosage. The current study has been conducted under best clinical research practices by the expert team of the Montreal Heart Institute. I am very grateful for their great work, resilience, professionalism and competencies during this pandemic period,” commented Gilles R. Gagnon, Chief Executive Officer of Ceapro.

About Ceapro Inc.

Ceapro Inc. is a Canadian biotechnology company involved in the development of proprietary extraction technology and the application of this technology to the production of extracts and “active ingredients” from oats and other renewable plant resources. Ceapro adds further value to its extracts by supporting their use in cosmeceutical, nutraceutical, and therapeutics products for humans and animals. The Company has a broad range of expertise in natural product chemistry, microbiology, biochemistry, immunology and process engineering. These skills merge in the fields of active ingredients, biopharmaceuticals and drug-delivery solutions. For more information on Ceapro, please visit the Company’s website at www.ceapro.com.

For more information contact:

Jenene Thomas
JTC Team, LLC
Investor Relations and Corporate Communications Advisor
T (US): +1 (833) 475-8247
E: czo@jtcir.com

Neither TSX Venture Exchange nor its Regulation Services Provider (as that term is defined in the policies of the TSX Venture Exchange) accepts responsibility for the adequacy or accuracy of this release

1 Arrigo F. G. Cicero et al., « A Randomized Placebo-Controlled Clinical Trial to Evaluate the Medium-Term Effects of Oat Fibers on Human Health: The Beta-Glucan Effects on Lipid Profile, Glycemia and InTestinal Health (BELT) Study », Nutrients 12, no 3 (3 mars 2020): E686, https://doi.org/10.3390/nu12030686.

Comtech Telecommunications Corp. Awarded $1.8 Million Contract for High-Power Solid-State Amplifiers


Comtech Telecommunications Corp. Awarded $1.8 Million Contract for High-Power Solid-State Amplifiers


MELVILLE, N.Y.–(BUSINESS WIRE)–Nov. 17, 2021– 
November 17, 2021— 
Comtech Telecommunications Corp. (NASDAQ: CMTL), a leading global provider of next-generation 911 emergency systems and secure wireless communications technologies, announced today, that during its first quarter of fiscal 2022, it was awarded an additional contract valued at 
$1.8 million for RF microwave solid-state amplifiers from a major domestic prime contractor.

These very high-power solid-state amplifiers, which utilize the latest in GaN transistor technology, were developed in close cooperation with the prime contractor and are part of a complex RF microwave transmission system used by the 
U.S. military.

“This additional contract award is another example of Comtech’s technical strength in delivering high-power solid-state transmitter solutions for military applications and the ongoing demand for our high-power solid-state amplifier products,” said  Fred Kornberg, Chairman of the Board and Chief Executive Officer of 
Comtech Telecommunications Corp.

The contract was awarded to 
Comtech PST Corp. (www.comtechpst.com) which is a leading independent supplier of high-power, high performance RF microwave amplifiers, transmitters and control components for use in a broad spectrum of applications including defense, medical, satellite communications systems and instrumentation.

Comtech Telecommunications Corp. is a leading global provider of next-generation 911 emergency systems and secure wireless communications technologies to commercial and government customers around the world. Headquartered in 
Melville, New York and with a passion for customer success, 
Comtech designs, produces and markets advanced and secure wireless solutions. For more information, please visit www.comtechtel.com.

Certain information in this press release contains statements that are forward-looking in nature and involve certain significant risks and uncertainties. Actual results could differ materially from such forward-looking information. The Company’s 
Securities and Exchange Commission filings identify many such risks and uncertainties. Any forward-looking information in this press release is qualified in its entirety by the risks and uncertainties described in such 
Securities and Exchange Commission filings.

Comtech Investor Relations:
631-962-7005
investors@comtech.com

Source: 
Comtech Telecommunications Corp.

SPACtrac Report – ISOS Acquisition Corp: Bowlero: Hits the Mark

Wednesday, November 17, 2021

ISOS Acquisition Corp: Bowlero: Hits the Mark

Michael Kupinski, Director of Research, Noble Capital Markets, Inc.

Patrick McCann, Research Associate, Noble Capital Markets, Inc.

Refer to end of report for Analyst Certification & Disclosures

Strong quarterly results. Bowlero reported strong Q1 2022 results with total bowling center revenue of $176 million, making it the 4th highest grossing quarter in Bowlero’s history. Revenue topped the company’s target revenue of $167 million by 5%, a good start towards its FY 2022 revenue target of $817 million. Impressively, margins improved, with adj. EBITDA margin of 33.4% versus 17% in fiscal Q1 2020 (pre-pandemic). It is noteworthy that the 33.4% EBITDA margin meets the company’s Fiscal Year 2022 EBITDA margin goal of 33%.

Moving beyond the pandemic. Bowlero’s latest quarterly revenue topped Q1 fiscal 2020 (pre-pandemic) revenue by 22%. The revenue growth, coupled with improving margins, lead to adj. EBITDA growth of 140% compared with Q1 2020. In absolute terms, adj. EBITDA was $59 million in Q1 2022 versus $25 million in Q1 2020.

Roll-up continuation. In the quarter, Bowlero completed its acquisition of Bowl America, for roughly $44 million. By doing so, Bowlero added 17 bowling centers in the eastern United States. Additionally, the company added 5 other bowling centers in the quarter. The total outlay required for acquisitions in Q1 was roughly $79 million.

Right down the alley. The company beat its revenue expectations for the quarter across all three primary segments, Bowling & Shoe, Food & Beverage, and Amusement. Notably, the strong performance was in spite of historically soft seasonal lull. Moreover, the additions of nearly two dozen centers in the quarter sets up the company for attractive revenue growth for the balance of the year.

Compelling stock valuation. The implied post-merger EV/2022E EBITDA multiple for Bowlero is near 10.5x, near current levels. By comparison to a broad peer group comprised of industries such as Live Events, Leisure, Amusement, and Experiential, Bowlero shares may offer as much as 40%-60% upside. The average EV/2022E EBITDA multiple for the broad peer group is 14.1x, suggesting a $14 price target for Bowlero shares. On the other hand, when excluding the Amusement industry peer group (due to its lower growth rate compared to Bowlero), the blended multiple is 15.7x EV/2022E EBITDA, implying a $16 price target. Therefore, in taking into account both implied target multiples, a $15 price target appears reasonable.

Investment Summary

Bowlero, which plans to go public through the merger with ISOS Acquisition Corp., announced favorable fiscal first quarter results.  Q1 2022  total bowling center revenue was $176 million, making it the 4th highest grossing quarter in Bowlero’s history. Notably, this is seasonally one of the weakest quarters for the company, indicating that the fiscal year is off to a strong start. Revenue topped the company’s target revenue of $167 million by 5%, solid progress towards its FY 2022 revenue target of $817 million. Impressively, margins improved, with adj. EBITDA margin of 33.4% versus 17% in fiscal Q1 2020 (pre-pandemic). It is noteworthy that the 33.4% EBITDA margin meets the company’s Fiscal Year 2022 EBITDA margin goal of 33%. Figure #1 Fiscal Q1 illustrates the company’s strong performance with the year earlier quarter. 

Highlighting that the Covid pandemic appears largely behind the company, Bowlero’s latest quarterly revenue topped Q1 fiscal 2020 (pre-pandemic) revenue by 22%. The revenue growth, coupled with improving margins, lead to adj. EBITDA growth of 140% compared with Q1 2020. In absolute terms, adj. EBITDA was $59 million in Q1 2022 versus $25 million in Q1 2020.

Importantly, the company appears to be operating on all cylinders, beating revenue expectations across all three primary segments, Bowling & Shoe, Food & Beverage, and Amusement. Notably, the strong performance was in spite of historically soft seasonal lull. Moreover, the additions of nearly two dozen centers in the quarter sets up the company for attractive revenue growth for the balance of the year. In the quarter, Bowlero completed its acquisition of Bowl America, for roughly $44 million. By doing so, Bowlero added 17 bowling centers in the eastern United States. Additionally, the company added 5 other bowling centers in the quarter. The total outlay required for acquisitions in Q1 was roughly $79 million. 

In spite of the strong fundamentals, the ISOS shares have not reacted to the positive results. The implied post-merger EV/2022E EBITDA multiple for Bowlero is near 10.5x. As illustrated in Figure #2 Comparables, the ISOS shares trade at a steep discount to its peer gorup. By comparison to a broad peer group comprised of industries such as Live Events, Leisure, Amusement, and Experiential, Bowlero shares may offer as much as 40%-60% upside. The average EV/2022E EBITDA multiple for the broad peer group is 14.1x, suggesting a $14 price target for Bowlero shares. On the other hand, when excluding the Amusement industry peer group (due to its lower growth rate compared to Bowlero), the blended multiple is 15.7x EV/2022E EBITDA, implying a $16 price target. Therefore, in taking into account both implied target multiples, a $15 price target appears reasonable. 

Figure #1 Fiscal Q1

Figure #2 Comparables


GENERAL DISCLAIMERS

All statements or opinions contained herein that include the words “we”, “us”, or “our” are solely the responsibility of Noble Capital Markets, Inc.(“Noble”) and do not necessarily reflect statements or opinions expressed by any person or party affiliated with the company mentioned in this report. Any opinions expressed herein are subject to change without notice. All information provided herein is based on public and non-public information believed to be accurate and reliable, but is not necessarily complete and cannot be guaranteed. No judgment is hereby expressed or should be implied as to the suitability of any security described herein for any specific investor or any specific investment portfolio. The decision to undertake any investment regarding the security mentioned herein should be made by each reader of this publication based on its own appraisal of the implications and risks of such decision.

This publication is intended for information purposes only and shall not constitute an offer to buy/sell or the solicitation of an offer to buy/sell any security mentioned in this report, nor shall there be any sale of the security herein in any state or domicile in which said offer, solicitation or sale would be unlawful prior to registration or qualification under the securities laws of any such state or domicile. This publication and all information, comments, statements or opinions contained or expressed herein are applicable only as of the date of this publication and subject to change without prior notice. Past performance is not indicative of future results.

Noble accepts no liability for loss arising from the use of the material in this report, except that this exclusion of liability does not apply to the extent that such liability arises under specific statutes or regulations applicable to Noble. This report is not to be relied upon as a substitute for the exercising of independent judgement. Noble may have published, and may in the future publish, other research reports that are inconsistent with, and reach different conclusions from, the information provided in this report. Noble is under no obligation to bring to the attention of any recipient of this report, any past or future reports. Investors should only consider this report as single factor in making an investment decision.

IMPORTANT DISCLOSURES

This publication is confidential for the information of the addressee only and may not be reproduced in whole or in part, copies circulated, or discussed to another party, without the written consent of Noble Capital Markets, Inc. (“Noble”). Noble seeks to update its research as appropriate, but may be unable to do so based upon various regulatory constraints. Research reports are not published at regular intervals; publication times and dates are based upon the analyst’s judgement. Noble professionals including traders, salespeople and investment bankers may provide written or oral market commentary, or discuss trading strategies to Noble clients and the Noble proprietary trading desk that reflect opinions that are contrary to the opinions expressed in this research report.

The majority of companies that Noble follows are emerging growth companies. Securities in these companies involve a higher degree of risk and more volatility than the securities of more established companies. The securities discussed in Noble research reports may not be suitable for some investors and as such, investors must take extra care and make their own determination of the appropriateness of an investment based upon risk tolerance, investment objectives and financial status.

Company Specific Disclosures

The following disclosures relate to relationships between Noble and the company (the “Company”) covered by the Noble Research Division and referred to in this research report.

Company Specific Disclosures

The following disclosures relate to relationships between Noble and the company (the “Company”) covered by the Noble Research Division and referred to in this research report.

The SPAC Company in this report is a participant in the Company Sponsored Research Program (CSRP); Noble receives compensation from the Company for such participation. No part of the CSRP compensation was, is, or will be directly or indirectly related to any specific recommendations or views expressed by the analyst in this research report.

Noble is not a market maker in any of the companies mentioned in this report. Noble intends to seek compensation for investment banking services and non-investment banking services (securities and non-securities related) with any or all of the companies mentioned in this report within the next 3 months

ANALYST CREDENTIALS, PROFESSIONAL DESIGNATIONS, AND EXPERIENCE

Director of Research. Senior Equity Analyst specializing in Media & Entertainment. 34 years of experience as an analyst. Member of the National Cable Television Society Foundation and the National Association of Broadcasters. BS in Management Science, Computer Science Certificate and MBA specializing in Finance from St. Louis University.
Named WSJ ‘Best on the Street’ Analyst six times.
FINRA licenses 7, 24, 66, 86, 87

WARNING

This report is intended to provide general securities advice, and does not purport to make any recommendation that any securities transaction is appropriate for any recipient particular investment objectives, financial situation or particular needs. Prior to making any investment decision, recipients should assess, or seek advice from their advisors, on whether any relevant part of this report is appropriate to their individual circumstances. If a recipient was referred to Noble Capital Markets, Inc. by an investment advisor, that advisor may receive a benefit in respect of transactions effected on the recipients behalf, details of which will be available on request in regard to a transaction that involves a personalized securities recommendation. Additional risks associated with the security mentioned in this report that might impede achievement of the target can be found in its initial report issued by Noble Capital Markets, Inc.. This report may not be reproduced, distributed or published for any purpose unless authorized by Noble Capital Markets, Inc.

RESEARCH ANALYST CERTIFICATION

Independence Of View
All views expressed in this report accurately reflect my personal views about the subject securities or issuers.

Receipt of Compensation
No part of my compensation was, is, or will be directly or indirectly related to any specific recommendations or views expressed in the public
appearance and/or research report.

Ownership and Material Conflicts of Interest
Neither I nor anybody in my household has a financial interest in the securities of the subject company or any other company mentioned in this report.

NOBLE RATINGS DEFINITIONS % OF SECURITIES COVERED % IB CLIENTS
Outperform: potential return is >15% above the current price 94% 33%
Market Perform: potential return is -15% to 15% of the current price 6% 2%
Underperform: potential return is >15% below the current price 0% 0%

NOTE: On August 20, 2018, Noble Capital Markets, Inc. changed the terminology of its ratings (as shown above) from “Buy” to “Outperform”, from “Hold” to “Market Perform” and from “Sell” to “Underperform.” The percentage relationships, as compared to current price (definitions), have remained the same.

Additional information is available upon request. Any recipient of this report that wishes further information regarding the subject company or the disclosure information mentioned herein, should contact Noble Capital Markets, Inc. by mail or phone.

Noble Capital Markets, Inc.
150 East Palmetto Park Rd., Suite 110
Boca Raton, FL 33432
561-994-1191

Noble Capital Markets, Inc. is a FINRA (Financial Industry Regulatory Authority) registered broker/dealer.
Noble Capital Markets, Inc. is an MSRB (Municipal Securities Rulemaking Board) registered broker/dealer.
Member – SIPC (Securities Investor Protection Corporation)

Report ID: 24264

Azarga Uranium Shareholders Approve Merger with enCore Energy


Azarga Uranium Shareholders Approve Merger with enCore Energy


VANCOUVER, BCNov. 17, 2021 /CNW/ – enCore Energy Corp. (TSXV: EU) (OTCQB: ENCUF) (the “Company” or “enCore”) is pleased to announce that the shareholders of Azarga Uranium Corp. (TSX: AZZ) (OTCQB: AZZUF) (FRA: P8AA) (“Azarga Uranium”) have approved the plan of arrangement (the “Plan of Arrangement”) with enCore previously announced on September 7th, 2021. The Plan of Arrangement was approved by 99.8% of the votes cast by holders of common shares of Azarga Uranium. enCore Energy will host an information session, via webinar, on Thursday, November 18, 2021 at 11 AM EST. Please register at: 

https://attendee.gotowebinar.com/register/5708536147519920651.

“enCore is very pleased with the results of the Azarga Uranium shareholder vote and will be working closely with Azarga to complete the next steps to close this transaction,” said William M. Sheriff, Executive Chairman. “Upon closing of this transaction, enCore Energy will have established itself as one of the leading in-situ recovery uranium development companies in the United States. The two licensed Texas production plants, now under revitalization, combined with over 90 million 43-101 compliant pounds of uranium resources across WyomingSouth Dakota and New Mexico1 ideally position enCore to advance clean energy sources in the nuclear renaissance.”

In addition, the Plan of Arrangement was approved by a simple majority of the votes cast by Azarga Uranium shareholders, excluding the votes cast in respect of the Azarga Uranium shares held by certain related parties (as defined by Multilateral Instrument 61-101 – Protection of Minority Security Holders in Special Transactions).

The British Columbia Supreme Court hearing for the final order to approve the Plan of Arrangement is expected to occur on November 19, 2021. Closing of the Plan of Arrangement is subject to the receipt of applicable regulatory approvals and the satisfaction of certain other closing conditions customary in transactions of this nature, including, without limitation, the final stock exchange approval. enCore Energy and Azarga Uranium are working together to complete these regulatory approvals in order to close the transaction.

In connection with the Plan of Arrangement, the Azarga Uranium shareholders will receive 0.375 common shares of enCore for each Azarga Uranium common share held (the “Exchange Ratio”). Additionally, the Exchange Ratio will be subject to an adjustment mechanism at the closing of the transaction (the “Closing Exchange Ratio”). The Closing Exchange Ratio shall be equal to the greater of: (i) the Exchange Ratio; or (ii) an exchange ratio calculated as $0.54 divided by enCore’s 15-day volume-weighted average price prior to the closing of the transaction, subject to a maximum Closing Exchange Ratio of 0.49 common shares of enCore for each share of Azarga Uranium outstanding.

None of the securities to be issued pursuant to the transaction have been or will be registered under the United States Securities Act of 1933, as amended (the “U.S. Securities Act”), or any state securities laws, and any securities issuable in the transaction are anticipated to be issued in reliance upon available exemptions from such registration requirements pursuant to Section 3(a)(10) of the U.S. Securities Act and applicable exemptions under state securities laws. This press release does not constitute an offer to sell or the solicitation of an offer to buy any securities.

For further information, please see Azarga Uranium’s Report of Voting Results, which is filed on SEDAR at www.sedar.com

About Azarga Uranium Corp.

Azarga Uranium is an integrated uranium exploration and development company that controls ten uranium projects and prospects in the United States of America (“USA”) (South DakotaWyomingUtah and Colorado), with a primary focus of developing in-situ recovery uranium projects. The Dewey Burdock in-situ recovery uranium project in South Dakota, USA (the “Dewey Burdock Project”), which is the Company’s initial development priority, has been issued its Nuclear Regulatory Commission License and Class III and Class V Underground Injection Control permits from the Environmental Protection Agency and the Company is in the process of completing other major regulatory permit approvals necessary for the construction of the Dewey Burdock Project. For more information, please visit www.azargauranium.com.

About enCore Energy Corp.

enCore Energy Corp., a U.S. domestic uranium developer focused on becoming a leading in-situ recovery (“ISR”) uranium producer, is led by a team of industry experts with extensive knowledge and experience in all aspects of ISR uranium operations. enCore Energy’s initial opportunities are created from the Company’s South Texas licensed and past-producing Rosita and Kingsville Dome ISR production facilities, under development, and multiple satellite projects in South Texas plus the changing global uranium supply/demand outlook and opportunities for industry consolidation. Large uranium resource endowments in New Mexico add to the asset base for long term growth and development opportunities.

1. enCore Energy Corp. and Azarga Uranium Corp. News Release dated September 7, 2021.

SOURCE enCore Energy Corp

Release – Voyager Digital Announces the Voyager Debit Mastercard


Voyager Digital Announces the Voyager Debit Mastercard®


The Voyager Debit Mastercard is the first crypto-based debit card that pays up to 9% annual rewards, and even more for Voyager Loyalty Program members

Voyager Digital Ltd. (“Voyager” or the “Company”) (TSX: VOYG; OTCQX: VYGVF; FRA: UCD2), one of the fastest-growing, publicly traded cryptocurrency platforms in the United States, today announced the launch of the Voyager Debit Mastercard, the first crypto-based debit card that pays up to 9% annual rewards to Voyager customers, as well as additional rewards for Voyager Loyalty Program members.

“With the Voyager Debit Mastercard, we continue to lead the future of finance by giving Voyager customers the benefit of earning rewards while instantly being able to spend their crypto on everyday purchases with the convenience of a debit card,” said Steve Ehrlich, CEO and co-founder of Voyager. “By basing our debit card on the USD Coin (USDC), a stable coin priced 1-to-1 to the US dollar, we are offering customers a predictable and rewarding way to hold and easily convert crypto for payments, while offering Voyager Loyalty Program members additional rewards.”

The Voyager Mastercard enables cardholders to instantly spend their crypto assets, seamlessly and automatically converting USDC to fiat currency in order to transact on the Mastercard network. Additional features include:

  • no annual fees and no lock up of assets to earn rewards.
  • annual rewards of up to 9% on all USDC holdings of $100 or more, paid monthly—this means USDC holders receive crypto back (additional USDC) in their Voyager accounts, based on their average monthly balance.
  • seamless integration of debit card balances and transactions within the Voyager app.
  • a personal routing and account number for direct deposit and bill pay, for each card.
  • anytime access to assets via ATMs.
  • additional rewards totaling up to 10.5% annually on USDC for Voyager Loyalty Program members, depending on the tier, as well as additional crypto back on debit card purchases.

Starting today, consumers can pre-register for the Voyager Debit Mastercard through www.investvoyager.com/debitcard

Launch of the Voyager Debit Mastercard follows the announcement on November 10, 2021 that the company surpassed 1 million funded accounts, increasing funded accounts by 2,225% in just over ten months. In addition, Voyager announced registered users at 2.7 million, up from 1 million announced on April 6, 2021. This strong momentum demonstrates that consumers in the US are drawn to Voyager’s expanding crypto finance platform and that the company is the well positioned for continued growth.

Metropolitan Commercial Bank (NYSE: MCB) is the issuing bank and Usio (NASDAQ: USIO) will act at the program manager and processor for the Voyager Debit Mastercard.


About Voyager Digital Ltd.
Voyager Digital Ltd. (TSX: VOYG; OTCQX: VYGVF; FRA: UCD2) is a fast-growing, publicly traded cryptocurrency platform in the United States founded in 2018 to bring choice, transparency, and cost efficiency to the marketplace. Voyager offers a secure way to trade over 60 different crypto assets using its easy-to-use mobile application, and earn rewards up to 12 percent annually on more than 30 cryptocurrencies. Through its subsidiary Coinify ApS, Voyager provides crypto payment solutions for both consumers and merchants around the globe. To learn more about the company, please visit https://www.investvoyager.com.

About Metropolitan Commercial Bank
Metropolitan Bank Holding Corp. (NYSE: MCB) is the holding company for Metropolitan Commercial Bank. The Bank provides a broad range of business, commercial and personal banking products and services to small and middle-market businesses, public entities and affluent individuals in the New York metropolitan area. Founded in 1999, the Bank is headquartered in New York City and operates six locations in Manhattan, Brooklyn and Great Neck, Long Island. The Bank provides banking-as-a-service to its fintech partners, which includes serving as an issuing bank for third-party debit card programs nationwide. The Bank is a New York State chartered commercial bank and a Federal Reserve System member bank whose deposits are insured up to applicable limits by the Federal Deposit Insurance Corporation, and an equal opportunity lender. For more information, please visit www.mcbankny.com

About Usio, Inc.
Usio, Inc. (Nasdaq: USIO), a leading FinTech integrated payment solutions provider, offers a wide range of payment solutions to merchants, billers, banks, service bureaus, crypto exchanges and card issuers. The Company operates credit, debit/prepaid, and ACH payment processing platforms to deliver convenient, world-class payment solutions and services to its clients. The strength of the Company lies in its ability to provide tailored solutions for card issuance, payment acceptance, and bill payments as well as its unique technology in the prepaid sector. Usio is headquartered in San Antonio, Texas, and has offices in Austin, Texas and Franklin, Tennessee, just outside of Nashville.  Websites: www.usio.com, www.payfacinabox.com, www.akimbocard.com and www.usiooutput.com.  Find us on Facebook® and Twitter.  Usio Press and Investor Contact: Joe Hassett, Investor Relations joeh@gregoryfca.com, 484-686-6600
 
The TSX has not approved or disapproved of the information contained herein.
 
SOURCE Voyager Digital, Ltd.

Press Contacts
 
Voyager Digital Ltd.
Michael Legg
Chief Communications Officer
(212) 547-8807
mlegg@investvoyager.com

Voyager Public Relations Team
pr@investvoyager.com