The Recent Halloween Investment Strategy Results


Image Credit: Pixabay (Pexels)

Is the Halloween Investment Strategy a Trick or a Treat?


What Is the Halloween Strategy? Is it statistically reliable? What have the results been?

The directive, “Always remember to buy in November,” has a few different names; the Halloween effect, the Halloween indicator, are among the more common. It answers the question, If I sell in May and walk away, when do I come back? This is because the “Halloween Strategy” and the “Sell in May” strategies are related — they are different ways of suggesting the same action. The results should be identical.

What Is It?

The Halloween strategy is over a century old. Buying when October ends is essentially a market-timing strategy based on the thought that the overall stock market performs better between Oct. 31st (Halloween) and May 1st than it performs from May through the end of October. The directive suggests first that market timing yields better results than buy and hold. Secondly, it says the probability of better results compared to buying and holding is increased, over this period. Those who subscribe to this approach recommend not investing at all during the off “season.”

Evidence suggests this strategy does perform well over time, but despite many theories, there is no clear or agreed-upon reason. A famous study was done by Sven Bouman (AEGON Asset Mgmt.) and Ben Jacobsen (Erasmus University Rotterdam) and published in the American Economic Review, December 2002. The study documents the existence of a strong seasonal effect in stock returns based on the Halloween indicator. They found the “inherited wisdom” to be true globally and useful in 36 of the 37 developed and emerging markets they studied. They reported the Sell in May effect tends to be particularly strong in European countries and is amplified over time. Their sample evidence shows that in the UK the effect has been noticeable since 1694. They also reported, “While we have examined a number of possible explanations, none of these appears to explain the puzzle convincingly.”

Is it Reliable?

I didn’t go back as far as 1694 the way Sven and Ben did. And, I didn’t collect data from emerging and developed markets around the globe. More pertinent to Channelchek readers is whether this strategy used on the U.S. markets has been worthwhile. The evaluation of this is found below.


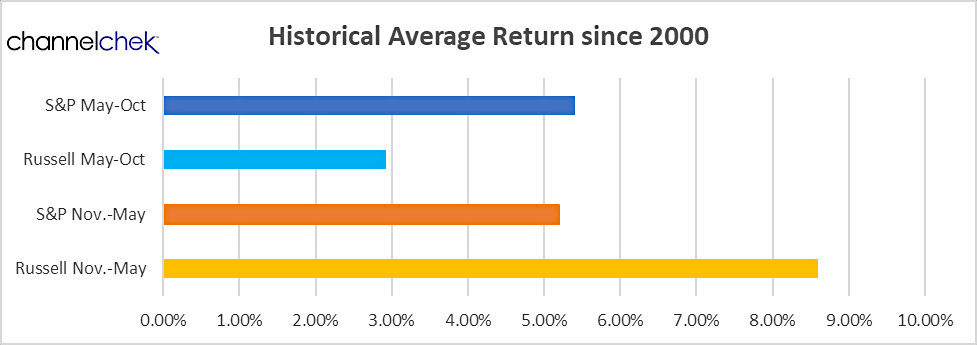
The above chart is a compilation of average results for two six-month periods, May through October and November through April. It also looks at two different indexes, the largest stocks in the S&P 500 (blues) index and smallcap stocks of the Russell 2000 (orange shades).

What was discovered is that during the period, investors in either of these indexes would have had positive earnings during either “season.” So it supports “buy and hold” wisdom or, at least, staying invested. During the Halloween through May period, the smallcap Russell returned 8.60% while during the other six months, performance was a weaker 2.92%. The S&P 500 maintained consistent averages in the low 5% area for either period.


What Have the Results Been?

Since the turn of the century, investors would have fared better if they bought stocks represented in the smallcap average, after Halloween, then moved to S&P 500 stocks in May. Below are the results of the 21 periods. The highest returns of either index occurred during the latest Halloween to May cycle. It was the smallcap index that measured a 45.76% gain. The index also measured the second-highest gain during the Sell in May 2004 measurement period. The Sell in May smallcap index also can claim the two lowest performance numbers.


Take-Away

The Halloween strategy says that investors should be fully invested in stocks from November through April, and out of stocks from May through October. Variations of this strategy and its accompanying axioms have been around for over a century. Looking at the last 21 years, a move from larger stocks to smaller may have been the move that could have paid off best as smallcaps after Halloween have outperformed over the past two decades.

Both “seasons,” for both measured indexes had positive average earnings. So the notion of staying fully invested is supported using recent data.

Paul Hoffman

Managing Editor, Channelchek


Suggested Reading:


Does the Russell Reconstitution Impact Small-Cap Performance During June?


Was There Ever a Market Crash on Good Friday?


Additional Balance in 60-40 Asset Mixes


How Good are Experts at Predicting the Market?


Sources:

https://pubs.aeaweb.org/doi/pdfplus/10.1257/000282802762024683

www.koyfin.com


Stay up to date. Follow us:


The FDA’s CBD and CDP Data Acceleration Program


Hemp and the FDA’s CDP DAP


The Food and Drug Administration (FDA) says it’s falling behind monitoring all that is new with Cannabis Derived Products (CDP). The regulator will soon ramp up its collection of data on CDPs. The plan to catch up is outlined in Cannabis-Derived
Products Data Acceleration Plan
, an FDA release made public this month (October 2021). There are a number of points throughout the six-page report that could have implications for investors.

Background

“Overall, the growth of the CDP market continues to outpace the growth in the science and our understanding of the public health implications of these products,” wrote the FDA in the release. It notes the size and complexity of the CDP market, along with CDP public health concerns, require a broad effort from many entities and stakeholders. The stakeholders mentioned by the FDA are federal, state, local, territorial, and tribal government entities, academia, and industry. The involvement is needed to “identify new ways of detecting safety signals and accelerating appropriate research studies, including but not limited to rigorous toxicology studies,” according to the FDA. To advance this work, it has developed a CDP Data Acceleration Plan (DAP). The FDA’s CDP DAP is a mix of new attempts to improve data-driven safety signal detection and use technology to uncover more quickly problems should they arise.

FDA Cannabis History

The FDA Administration has been collecting information on hemp products, emphasizing cannabidiol (CBD) since the passage of the 2018 Farm Bill, which legalized hemp, defined as cannabis plants with .3% THC or less. The use of CBD skyrocketed as it became legal, available, and better known by consumers. It’s been the FDA’s job to develop regulations for CBD products.  This would include, as a food additive, for cosmetic use, and even provisions for animals. Unregulated CBD products can already be found in stores and online throughout the U.S., the growth and uses have outpaced the FDA’s oversight.

Updated FDA Plan

The new plan lays out a series of pilot initiatives and partnerships with an emphasis on data and technology. These include novel methods for the FDA to achieve a better understanding of how “safety misinformation” plays into consumer behavior, and where educational needs could benefit consumers.  The FDA also wants to measure to what extent cannabis consumers are replacing prescribed medications with cannabis products, and the “role of human and animal healthcare providers” in “promoting or preventing [cannabis-derived product] consumption.” 

As far as partnerships, the FDA is “developing an inter-Agency scientific agenda for [cannabis-derived products] through a new National Toxicology Program pilot initiative.” 

As far as “Data Gaps” are concerned, the FDA highlighted it is “proactively conducting research in key areas to inform data gaps, including several toxicology, safety, and quality initiatives.” These areas include how CBD impacts male reproduction, and neurological development, how CBD plays in in vivo and vitro toxicity, how transdermal CBD products work, more work on potential risk of liver injury due to CBD use, “characterization of chemical constituents for smoked hemp flower and vaped cannabis products,” and whether labels accurately note ingredients.

The Administration reminded, “FDA continues to encourage industry and remind them of their responsibility to develop the needed data, aligned with FDA’s current data standards, to ensure products are safe.”

To say that the cannabis industry has been tapping its feet waiting for FDA rules on products containing CBD and other cannabinoids is an understatement. 

But in addition to lacking data, there is another complication: Epidiolex, a cannabis plant-derived CBD extract, which in 2018 

Take-Away

The cannabis industry, perhaps more than any other, needs to know where the guard rails will be, what rules will be put in place. This is important on the finance and investment front, the legal and banking side, and consumer protection regulation. When it comes to regulations, sooner is often better than later when strategies for businesses and products are ongoing, and there’s a lot on the line. Ramping up information gathering and informed rule-setting will be welcomed by the industry and its investors.

There remain many unknowns surrounding cannabis products. Combining technology, the broad user, and various data-gathering entities will help the FDA speed understanding and judgment on the use of the many products and uses that are expected to come from this plant family.

Suggested Reading:


Cannabis Vape Distribution Limited Under New Law


Marijuana Dispensaries and the Impact on Marijuana Use


Cannabis Fundamentals Not Hype Important to Investors


Cannabis Related Businesses (CRB) New Access to Banking Services


Sources:

https://www.fda.gov/media/153183/download

https://www.fda.gov/news-events/public-health-focus/fda-regulation-cannabis-and-cannabis-derived-products-including-cannabidiol-cbd

https://cannabiswire.com/2021/10/20/fda-launches-biggest-cannabis-data-collection-plan-yet/

https://www.regulations.gov/docket/FDA-2019-N-1482/document


Stay up to date. Follow us:


Capstone Green Energy (NASDAQ:CGRN) to Announce Its Second Quarter Fiscal Year 2022 Financial Results on Wednesday, November 10, 2021


Capstone Green Energy (NASDAQ:CGRN) to Announce Its Second Quarter Fiscal Year 2022 Financial Results on Wednesday, November 10, 2021


Webcast Scheduled for 1:45 PM PT/4:45 PM ET November 10, 2021

VAN NUYS, CA / ACCESSWIRE / October 29, 2021 / Capstone Green Energy Corporation (www.CapstoneGreenEnergy.com) (NASDAQ:CGRN), a global leader in carbon reduction and on-site resilient green energy solutions, announced today that on Wednesday, November 10, 2021, after market close, it expects to release full financial results for its second quarter of fiscal year 2022, ended September 30, 2021. Later that same day, at 1:45 p.m. Pacific Time (4:45 p.m. Eastern Time), Capstone will host a live webcast to discuss those results.

At the end of the conference call, Capstone will host a question-and-answer session to provide an opportunity for financial analysts to ask questions. Investors and interested individuals are invited to listen to the webcast by logging on to the Company’s investor relations webpage at www.capstonegreenenergy.com. A replay of the webcast will be available on the site for 30 days.

About Capstone Green Energy

Capstone Green Energy (www.CapstoneGreenEnergy.com) (NASDAQ:CGRN) is a leading provider of customized microgrid solutions and on-site energy technology systems focused on helping customers around the globe meet their environmental, energy savings, and resiliency goals. Capstone Green Energy focuses on four key business lines. Through its Energy as a Service (EaaS) business, it offers rental solutions utilizing its microturbine energy systems and battery storage systems, comprehensive Factory Protection Plan (FPP) service contracts that guarantee life-cycle costs, as well as aftermarket parts. Energy Conversion Products are driven by the Company’s industry-leading, highly efficient, low-emission, resilient microturbine energy systems offering scalable solutions in addition to a broad range of customer-tailored solutions, including hybrid energy systems and larger frame industrial turbines. The Energy Storage Products business line designs and installs microgrid storage systems creating customized solutions using a combination of battery technologies and monitoring software. Through Hydrogen Energy Solutions, Capstone Green Energy offers customers a variety of hydrogen products, including the Company’s microturbine energy systems.

For customers with limited capital or short-term needs, Capstone offers rental systems; for more information, contact: rentals@CGRNenergy.com. To date, Capstone has shipped over 10,000 units to 83 countries and estimates that, in FY21, it saved customers over $217 million in annual energy costs and approximately 397,000 tons of carbon. Total savings over the last three years are estimated at 1,115,100 tons of carbon and $698 million in annual energy savings.

For more information about the Company, please visit: www.CapstoneGreenEnergy.com. Follow Capstone Green Energy on TwitterLinkedInInstagramFacebook, and YouTube.

CONTACT:
Capstone Green Energy
Investor and investment media inquiries:
818-407-3628
ir@CGRNenergy.com

SOURCE: Capstone Green Energy Corporation

Voyager Digital (VYGVF)(VOYG:CA) – Strategic Investment from Alameda Research

Friday, October 29, 2021

Voyager Digital (VYGVF)(VOYG:CA)
Strategic Investment from Alameda Research

Voyager Digital Ltd through its subsidiary, operates as a crypto asset broker that provides retail and institutional investors with a turnkey solution to trade crypto assets. The company offers investors execution, data, wallet and custody services through its institutional-grade open architecture platform.

Joe Gomes, Senior Research Analyst, Noble Capital Markets, Inc.

Joshua Zoepfel, Research Associate, Noble Capital Markets, Inc.

Refer to the full report for the price target, fundamental analysis, and rating.

    Strategic Alliance. Yesterday, Voyager announced a strategic alliance with Alameda Research, one of the largest crypto market makers in the world. Alameda purchased $75 million of VGYVF common shares in a private placement of about 7.7 million shares. The additional investment will enable Voyager to continue to grow its business, in our view.

    Why Important? Outside of the additional capital, the Alameda investment is a coup for Voyager, in our view.  Alameda was founded by Sam Bankman-Fried, the crypto wunderkind, with a net worth estimated at north of $22 billion. Immediate opportunity exists on the order flow and asset management front, with longer term potential in such markets as NFTs and crypto derivatives. Alameda trades over …


This Company Sponsored Research is provided by Noble Capital Markets, Inc., a FINRA and S.E.C. registered broker-dealer (B/D).

*Analyst certification and important disclosures included in the full report. NOTE: investment decisions should not be based upon the content of this research summary.  Proper due diligence is required before making any investment decision. 

Travelzoo Reports Third Quarter 2021 Results


Travelzoo Reports Third Quarter 2021 Results


NEW YORK
Oct. 29, 2021 (GLOBE NEWSWIRE) — 
Travelzoo® (NASDAQ: TZOO):

  • Consolidated revenue of 
    $15.7 million, up 14% year-over-year
  • Non-GAAP consolidated operating profit of 
    $1.1 million
  • Earnings per share (EPS) of 
    $0.22 attributable to 
    Travelzoo from continuing operations

Travelzoo, a global Internet media company that provides exclusive offers and experiences for members, today announced financial results for the third quarter ended 
September 30, 2021.
Consolidated revenue was 
$15.7 million, up 14% from 
$13.8 million year-over-year and down 18%
from the prior quarter. Reported revenue excludes revenue from discontinued operations in 
Asia Pacific
Travelzoo’s reported revenue consists of advertising revenues and commissions, derived
from and generated in connection with purchases made by 
Travelzoo members.

The reported net income attributable to 
Travelzoo from continuing operations was 
$2.8 million for Q3 2021. At the consolidated level, including minority interests, the reported net income from continuing operations was 
$2.9 million. EPS from continuing operations was 
$0.22, compared to a loss per share of (
$0.10) in the prior-year period. GAAP operating loss was 
$261,000.

Non-GAAP operating profit was 
$1.1 million. The calculation of non-GAAP operating profit excludes amortization of intangibles (
$0.3 million), stock option expenses (
$1.0 million), and severance-related expenses (
$0.1 million). See section “Non-GAAP Financial Measures” below.

“We saw robust growth in our revenue and operating profit from 
Travelzoo in Europe,” said  Holger Bartel, Global CEO. “Unfortunately, revenue from 
Travelzoo in 
North America was negatively impacted by press coverage about the 
COVID-19 Delta variant and 
Do Not Travel advisories for nearly 100 countries. We believe this to be a short-term effect. We see strong pent-up demand from 
Travelzoo members to get away as soon as possible.”

Cash Position
As of 
September 30, 2021, consolidated cash, cash equivalents, and restricted cash were 
$66.4 million. Net cash used in operations was 
$12.7 million. Cash was used primarily in connection with the switch to a more efficient merchant payment processing solution. There were no significant capital expenditures.

Reserve
Reported revenues include a reserve of 
$3.1 million related to commissions to be earned from refundable vouchers sold. The reserve is booked as contra revenue.

Travelzoo North America

North America business segment revenue increased 6% year-over-year to 
$9.7 million. Operating loss for Q3 2021 was 
$918,000, compared to an operating loss of 
$696,000 in the prior-year period.

Travelzoo Europe

Europe business segment revenue increased 43% year-over-year to 
$5.2 million. Operating profit for Q3 2021 was 
$600,000, or 11% of revenue, compared to an operating loss of 
$757,000 in the prior-year period.

Jack’s Flight Club 
On 
January 13, 2020
Travelzoo acquired 60% of Jack’s 
Flight Club, a membership subscription service. Jack’s 
Flight Club revenue decreased 19% year-over-year to 
$796,000. Operating income for Q3 2021 was 
$57,000, compared to an operating income of 
$250,000 in the prior-year period. After consolidation with 
Travelzoo, Jack’s 
Flight Club’s net income was 
$20,000 with 
$12,000 attributable to 
Travelzoo as a result of recording 
$274,000 of amortization of intangible assets related to the acquisition.

Licensing
In June of 2020, 
Travelzoo entered into a royalty-bearing licensing agreement with a local licensee in 
Japan for the exclusive use of Travelzoo’s brand, business model, and members in 
Japan. In August of 2020, 
Travelzoo entered into a royalty-bearing licensing agreement with a local licensee in 
Australia for the exclusive use of Travelzoo’s brand, business models, and members in 
Australia
New Zealand and 
Singapore. Under these arrangements, Travelzoo’s existing members in 
Australia
Japan
New Zealand, and 
Singapore will continue to be owned by 
Travelzoo as the licensor. Licensing revenue is booked with a lag of one quarter. 
Travelzoo recorded 
$2,000 in licensing revenue from the licensee in 
Australia
New Zealand and 
Singapore in Q3 2021. Licensing revenue is expected to increase as the licensees develop their business and effects of the pandemic subside.

Members and Subscribers
As of 
September 30, 2021, we had 30.7 million members worldwide. In 
North America, the unduplicated number of 
Travelzoo members was 17.2 million as of 
September 30, 2021, up 5% from 
September 30, 2020. In 
Europe, the unduplicated number of 
Travelzoo members was 8.4 million as of 
September 30, 2021, down 5% from 
September 30, 2020. Jack’s 
Flight Club had 1.7 million subscribers as of 
September 30, 2021, consistent with 1.7 million subscribers as of 
September 30, 2020.

Discontinued Operations
As announced in a press release on 
March 10, 2020
Travelzoo decided to exit its 
Asia Pacific business and operate it as a licensing business going forward. Consequently, the 
Asia Pacific business has been classified as discontinued operations since 
March 31, 2020. Prior periods have been reclassified to conform with the current presentation. Certain reclassifications have been made for current and prior periods between the continued operations and the discontinued operations in accordance with 
U.S. GAAP.

Income Taxes
Income tax expense was 
$233,000 in Q3 2021, compared to an income tax benefit of 
$244,000 in the prior-year period.

Non-GAAP Financial Measures
Management calculates non-GAAP operating income when evaluating the financial performance of the business. Travelzoo’s calculation of non-GAAP operating income, also called “non-GAAP operating profit” in this press release and today’s earnings conference call, excludes the following items: impairment of intangibles and goodwill, amortization of intangibles, stock option expenses, and severance-related expenses. This press release includes a table which reconciles GAAP operating income to the calculation of non-GAAP operating income. Non-GAAP operating income is not required by, or presented in accordance with, generally accepted accounting principles in 
the United States of America (“GAAP”). This information should be considered as supplemental in nature and should not be considered in isolation or as a substitute for the financial information prepared in accordance with GAAP. In addition, these non-GAAP financial measures may not be the same as similarly titled measures reported by other companies.

Looking Ahead
We currently expect to achieve profitability in Q4 2021. We continue to see a trend of recovery of our revenue. However, there could be unexpected fluctuations in the short-term. We have been able to reduce our operating expenses, and we believe we can continue the trend of lower fixed costs in the foreseeable future.

Conference Call

Travelzoo will host a conference call to discuss third quarter results today at 
11:00 a.m. ET. Please visit http://ir.travelzoo.com/events-presentations to download the management presentation (PDF format) to be discussed in the conference call; and access the webcast.

About Travelzoo

Travelzoo® provides its 30 million members exclusive offers and one-of-a-kind experiences personally reviewed by our deal experts around the globe. We have our finger on the pulse of outstanding travel, entertainment, and lifestyle experiences. We work in partnership with more than 5,000 top travel suppliers—our long-standing relationships give 
Travelzoo members access to irresistible deals.

Certain statements contained in this press release that are not historical facts may be forward-looking statements within the meaning of Section 27A of the Securities Act of 1933 and Section 21E of the Securities and Exchange Act of 1934. These forward-looking statements may include, but are not limited to, statements about our plans, objectives, expectations, prospects and intentions, markets in which we participate and other statements contained in this press release that are not historical facts. When used in this press release, the words “expect”, “predict”, “project”, “anticipate”, “believe”, “estimate”, “intend”, “plan”, “seek” and similar expressions are generally intended to identify forward-looking statements. Because these forward-looking statements involve risks and uncertainties, there are important factors that could cause actual results to differ materially from those expressed or implied by these forward-looking statements, including changes in our plans, objectives, expectations, prospects and intentions and other factors discussed in our filings with the 
SEC. We cannot guarantee any future levels of activity, performance or achievements. 
Travelzoo undertakes no obligation to update forward-looking statements to reflect events or circumstances occurring after the date of this press release.

Travelzoo, Top 20, and 
Jack’s Flight Club are registered trademarks of 
Travelzoo.


Travelzoo
Condensed Consolidated Statements of Operations
(Unaudited)
(In thousands, except per share amounts)

  Three months ended   Nine months ended
  September 30,   September 30,
  2021   2020   2021   2020
Revenues $ 15,688        $ 13,787        $ 49,051        $ 41,118     
Cost of revenues 2,992        2,924        8,532        7,768     
Gross profit 12,696        10,863        40,519        33,350     
Operating expenses:              
Sales and marketing 7,709        6,929        21,839        24,311     
Product development 684        592        2,052        2,586     
General and administrative 4,564        4,545        14,180        16,709     
Impairment of intangible asset and goodwill —        —        —        2,920     
Total operating expenses 12,957        12,066        38,071        46,526     
Operating income (loss) (261 )     (1,203 )     2,448        (13,176 )  
Other income (loss), net 3,344        (37 )     3,862        (222 )  
Income (loss) from continuing operations before
income taxes
3,083        (1,240 )     6,310        (13,398 )  
Income tax expense (benefit) 233        (244 )     2,111        (2,070 )  
Income (loss) from continuing operations 2,850        (996 )     4,199        (11,328 )  
Income (loss) from discontinued operations,
net of tax
(19 )     (230 )     (5 )     (3,944 )  
Net income (loss) 2,831        (1,226 )     4,194        (15,272 )  
Net income (loss) attributable to non-controlling
interest
      125        (1 )     (1,122 )  
Net income (loss) attributable to 
Travelzoo
$ 2,823        $ (1,351 )     $ 4,195        $ (14,150 )  
               
Net income (loss) attributable to Travelzoo—
continuing operations
$ 2,842        $ (1,121 )     $ 4,200        $ (10,206 )  
Net income (loss) attributable to Travelzoo—
discontinued operations
$ (19 )     $ (230 )     $ (5 )     $ (3,944 )  
               
Income (Loss) per share—basic              
Continuing operations $ 0.24        $ (0.10 )     $ 0.36        $ (0.90 )  
Discontinued operations $ —        $ (0.02 )     $ —        $ (0.35 )  
Net income (loss) per share —basic $ 0.24        $ (0.12 )     $ 0.36        $ (1.25 )  
               
Income (Loss) per share—diluted              
Continuing operations $ 0.22        $ (0.10 )     $ 0.32        $ (0.90 )  
Discontinued operations $ —        $ (0.02 )     $ —        $ (0.35 )  
Net income (loss) per share—diluted $ 0.22        $ (0.12 )     $ 0.32        $ (1.25 )  
Shares used in per share calculation from continuing
operations—basic
11,648        11,310        11,510        11,353     
Shares used in per share calculation from
discontinued operations—basic
11,648        11,310        11,510        11,353     
Shares used in per share calculation from continuing
operations—diluted
12,904        11,310        13,132        11,353     
Shares used in per share calculation from
discontinued operations—diluted
11,648        11,310        11,510        11,353     


Travelzoo
Condensed Consolidated Balance Sheets
(Unaudited)
(In thousands)

  September 30,
2021
  December 31,
2020
Assets      
Current assets:      
Cash and cash equivalents $ 65,204        $ 63,061     
Accounts receivable, net 9,084        4,519     
Prepaid income taxes 2,882        931     
Deposits 104        137     
Prepaid expenses and other 3,080        1,166     
Assets from discontinued operations 63        230     
Total current assets 80,417        70,044     
Deposits and other 8,219        745     
Deferred tax assets 3,637        5,067     
Restricted cash 1,154        1,178     
Operating lease right-of-use assets 8,005        8,541     
Property and equipment, net 794        1,347     
Intangible assets, net 3,700        4,534     
Goodwill 10,944        10,944     
Total assets $ 116,870        $ 102,400     
Liabilities and Stockholders’ Equity      
Current liabilities:      
Accounts payable $ 11,875        $ 6,996     
Merchant payables 73,183        57,104     
Accrued expenses and other 7,546        8,649     
Deferred revenue 1,805        2,688     
Operating lease liabilities 3,482        3,587     
PPP notes payable (current portion) —        2,849     
Income tax payable 61        326     
Liabilities from discontinued operations 469        671     
Total current liabilities 98,421        82,870     
PPP notes payables —        814     
Deferred tax liabilities —        357     
Long-term operating lease liabilities 9,721        10,774     
Other long-term liabilities 2,249        1,085     
Total liabilities 110,391        95,900     
Non-controlling interest 4,608        4,609     
Common stock 118        114     
Treasury stock (at cost) (1,583 )     —     
Additional paid-in capital 3,432        6,239     
Retained earnings (accumulated deficit) 3,792        (403 )  
Accumulated other comprehensive loss (3,888 )     (4,059 )  
Total stockholders’ equity 1,871        1,891     
Total liabilities and stockholders’ equity $ 116,870        $ 102,400     


Travelzoo
Condensed Consolidated Statements of Cash Flows
(Unaudited)
(In thousands)

  Three months ended   Nine months ended
  September 30,   September 30,
  2021   2020   2021   2020
Cash flows from operating activities:              
Net income (loss) $ 2,831        $ (1,226 )     $ 4,194        $ (15,272 )  
Adjustments to reconcile net income (loss) to net cash provided by
(used in) operating activities:
             
Depreciation and amortization 448        588        1,408        1,806     
Stock-based compensation 971        1,189        2,788        5,243     
Deferred income tax (68 )     14        1,073        (1,747 )  
Impairment of intangible assets and goodwill —        —        —        2,920     
Gain on notes payable settlement —        —        —        (1,500 )  
Loss on long-lived assets —        —        —        437     
Loss on equity investment in WeGo —        138        —        474     
Gain on PPP notes payable forgiveness (3,159 )     —        (3,588 )     —     
Net foreign currency effects (45 )     (86 )     (300 )     (542 )  
Provision (reversal) of loss on accounts receivable and
other reserves
(854 )     1,496        (1,725 )     3,923     
Changes in operating assets and liabilities, net of acquisitions:              
Accounts receivable 933        63        (3,848 )     6,246     
Prepaid income taxes (1,294 )     (304 )     (2,007 )     685     
Prepaid expenses and other (6,698 )     206        (9,473 )     1,626     
Accounts payable 3,610        10,560        5,025        12,709     
Merchant payables (8,699 )     12,372        16,486        20,532     
Accrued expenses and other (132 )     (1 )     (452 )     (1,381 )  
Income tax payable (35 )     (412 )     (263 )     (479 )  
Other liabilities (476 )     (436 )     (34 )     1,904     
Net cash provided by (used in) operating activities (12,667 )     24,161        9,283        37,584     
Cash flows from investing activities:              
Acquisition of business, net of cash acquired —        —        —        (679 )  
Other investment —        —        —        (430 )  
Purchases of property and equipment 60        (49 )     (24 )     (252 )  
Net cash provided by (used in) investing activities 60        (49 )     (24 )     (1,361 )  
Cash flows from financing activities:              
Repurchase of common stock —        —        (1,583 )     (1,205 )  
Payment of promissory notes —        —        (110 )     (7,800 )  
Proceeds from notes payable —        —        —        3,663     
Exercise of stock options and taxes paid for net share
settlement
(2,357 )     —        (5,424 )     —     
Net cash used in financing activities (2,357 )     —        (7,117 )     (5,342 )  
Effect of exchange rate on cash, cash equivalents and
restricted cash
(823 )     904        (126 )     393     
Net increase (decrease) in cash, cash equivalents and
restricted cash
(15,787 )     25,016        2,016        31,274     
Cash, cash equivalents and restricted cash at beginning of period 82,188        26,968        64,385        20,710     
Cash, cash equivalents and restricted cash at end of period $ 66,401        $ 51,984        $ 66,401        $ 51,984     


Travelzoo
Segment Information from Continuing Operations
(Unaudited)
(In thousands)

Three months ended September 30, 2021 Travelzoo North
America
  Travelzoo Europe   Jack’s Flight Club   Elimination   Consolidated
Revenue from unaffiliated
customers
$ 9,527        $ 5,365        $ 796      $ —      $ 15,688     
Intersegment revenue 136        (136 )     —      —      —     
Total net revenues 9,663        5,229        796      —      15,688     
Operating income (loss) $ (918 )     $ 600

 
      $ 57      $ —      $ (261  )  
                   
Three months ended September 30, 2020 Travelzoo North
America
  Travelzoo Europe   Jack’s Flight Club   Elimination   Consolidated
Revenue from unaffiliated
customers
$ 9,002        $ 3,798        $ 987      $ —      $ 13,787     
Intersegment revenue 141        (141 )     —      —      —     
Total net revenues 9,143        3,657        987      —      13,787     
Operating income (loss) $ (696 )     $ (757 )     $ 250      $ —      $ (1,203 )  


Nine months ended September 30, 2021 Travelzoo North
America
  Travelzoo Europe   Jack’s Flight Club   Elimination   Consolidated
Revenue from unaffiliated
customers
$ 33,005       $ 13,503        $ 2,543        $ —        $ 49,051     
Intersegment revenue 462        (462 )     —        —        —     
Total net revenues 33,467        13,041        2,543        —        49,051     
Operating income (loss) $ 2,654        $ (323 )     $ 117        $ —        $ 2,448     
                   
Nine months ended September 30, 2020 Travelzoo North
America
  Travelzoo Europe   Jack’s Flight Club   Elimination   Consolidated
Revenue from unaffiliated
customers
$ 25,805        $ 12,706        $ 2,615        $ (8 )     $ 41,118     
Intersegment revenue 237        (245 )     —              —     
Total net revenues 26,042        12,461        2,615        —        41,118     
Operating income (loss) $ (6,374 )     $ (3,781 )     $ (3,013 )     $ (8 )     $ (13,176 )  


Travelzoo
Reconciliation of GAAP to Non-GAAP Information
(Unaudited)
(In thousands, except per share amounts)

  Three months ended   Nine months ended
  September 30,   September 30,
  2021   2020   2021   2020
GAAP operating expense $ 12,957        $ 12,066        $ 38,071      $ 46,526     
Non-GAAP adjustments:              
Impairment of intangible and goodwill (A) —        —        —      2,920     
Amortization of intangibles (B) 274        333        833      944     
Stock option expenses (C) 971        1,189        2,788      5,243     
Severance-related expenses (D) 95        855        493      1,139     
Non-GAAP operating expense 11,617        9,689        33,957      36,280     
               
GAAP operating income (loss) (261 )     (1,203 )     2,448      (13,176 )  
Non-GAAP adjustments (A through D) 1,340        2,377        4,114      10,246     
Non-GAAP operating income (loss) 1,079        1,174        6,562      (2,930 )  


Investor Relations:
Almira Pusch
ir@travelzoo.com

Source: Travelzoo
Great Lakes Dredge & Dock (GLDD) – Low Bid Awarded – Updating Awards and Low Bids

Friday, October 29, 2021

Great Lakes Dredge & Dock (GLDD)
Low Bid Awarded – Updating Awards and Low Bids

Great Lakes Dredge & Dock Corp is a provider of dredging services in the United States. The company only’s operating segments is Dredging. Dredging involves the enhancement or preservation of navigability of waterways or the protection of shorelines through the removal or replenishment of soil, sand or rock. Its projects portfolio includes Coastal Restoration, Coastal Protection, Port expansion, and others.

Poe Fratt, Senior Research Analyst, Noble Capital Markets, Inc.

Refer to the full report for the price target, fundamental analysis, and rating.

    Final award on Regional Atlantic Harbor totals $25.8 million. The final award of $25.8 million on South Atlantic Regional Harbor Dredging (W912PM21B0008) was posted after the market closed. The project, which includes work at five harbors along the east coast, is attractive since it fits environmental windows and hopper dredge availability. When bids were opened on October 5th, GLDD was the low bid at $29.4 million so we estimate that there are options of $3.6 million.

    4Q2021 Bidding off to good start.  Recent awards to be added to 4Q2021 backlog include the South Atlantic Regional Harbor for $25.7 million (excluding options of $3.7 million) and the Oak Island Renourishment Project 2021/2022 of $17.1 million. Per a recent note, the Port Houston pending award of $95.4 million should be final shortly and add to 4Q2021 backlog …


This Company Sponsored Research is provided by Noble Capital Markets, Inc., a FINRA and S.E.C. registered broker-dealer (B/D).

*Analyst certification and important disclosures included in the full report. NOTE: investment decisions should not be based upon the content of this research summary.  Proper due diligence is required before making any investment decision. 

The FDAs CBD and CDP Data Acceleration Program


Hemp and the FDA’s CDP DAP


The Food and Drug Administration (FDA) says it’s falling behind monitoring all that is new with Cannabis Derived Products (CDP). The regulator will soon ramp up its collection of data on CDPs. The plan to catch up is outlined in Cannabis-Derived
Products Data Acceleration Plan
, an FDA release made public this month (October 2021). There are a number of points throughout the six-page report that could have implications for investors.

Background

“Overall, the growth of the CDP market continues to outpace the growth in the science and our understanding of the public health implications of these products,” wrote the FDA in the release. It notes the size and complexity of the CDP market, along with CDP public health concerns, require a broad effort from many entities and stakeholders. The stakeholders mentioned by the FDA are federal, state, local, territorial, and tribal government entities, academia, and industry. The involvement is needed to “identify new ways of detecting safety signals and accelerating appropriate research studies, including but not limited to rigorous toxicology studies,” according to the FDA. To advance this work, it has developed a CDP Data Acceleration Plan (DAP). The FDA’s CDP DAP is a mix of new attempts to improve data-driven safety signal detection and use technology to uncover more quickly problems should they arise.

FDA Cannabis History

The FDA Administration has been collecting information on hemp products, emphasizing cannabidiol (CBD) since the passage of the 2018 Farm Bill, which legalized hemp, defined as cannabis plants with .3% THC or less. The use of CBD skyrocketed as it became legal, available, and better known by consumers. It’s been the FDA’s job to develop regulations for CBD products.  This would include, as a food additive, for cosmetic use, and even provisions for animals. Unregulated CBD products can already be found in stores and online throughout the U.S., the growth and uses have outpaced the FDA’s oversight.

Updated FDA Plan

The new plan lays out a series of pilot initiatives and partnerships with an emphasis on data and technology. These include novel methods for the FDA to achieve a better understanding of how “safety misinformation” plays into consumer behavior, and where educational needs could benefit consumers.  The FDA also wants to measure to what extent cannabis consumers are replacing prescribed medications with cannabis products, and the “role of human and animal healthcare providers” in “promoting or preventing [cannabis-derived product] consumption.” 

As far as partnerships, the FDA is “developing an inter-Agency scientific agenda for [cannabis-derived products] through a new National Toxicology Program pilot initiative.” 

As far as “Data Gaps” are concerned, the FDA highlighted it is “proactively conducting research in key areas to inform data gaps, including several toxicology, safety, and quality initiatives.” These areas include how CBD impacts male reproduction, and neurological development, how CBD plays in in vivo and vitro toxicity, how transdermal CBD products work, more work on potential risk of liver injury due to CBD use, “characterization of chemical constituents for smoked hemp flower and vaped cannabis products,” and whether labels accurately note ingredients.

The Administration reminded, “FDA continues to encourage industry and remind them of their responsibility to develop the needed data, aligned with FDA’s current data standards, to ensure products are safe.”

To say that the cannabis industry has been tapping its feet waiting for FDA rules on products containing CBD and other cannabinoids is an understatement. 

But in addition to lacking data, there is another complication: Epidiolex, a cannabis plant-derived CBD extract, which in 2018 

Take-Away

The cannabis industry, perhaps more than any other, needs to know where the guard rails will be, what rules will be put in place. This is important on the finance and investment front, the legal and banking side, and consumer protection regulation. When it comes to regulations, sooner is often better than later when strategies for businesses and products are ongoing, and there’s a lot on the line. Ramping up information gathering and informed rule-setting will be welcomed by the industry and its investors.

There remain many unknowns surrounding cannabis products. Combining technology, the broad user, and various data-gathering entities will help the FDA speed understanding and judgment on the use of the many products and uses that are expected to come from this plant family.

Suggested Reading:


Cannabis Vape Distribution Limited Under New Law


Marijuana Dispensaries and the Impact on Marijuana Use


Cannabis Fundamentals Not Hype Important to Investors


Cannabis Related Businesses (CRB) New Access to Banking Services


Sources:

https://www.fda.gov/media/153183/download

https://www.fda.gov/news-events/public-health-focus/fda-regulation-cannabis-and-cannabis-derived-products-including-cannabidiol-cbd

https://cannabiswire.com/2021/10/20/fda-launches-biggest-cannabis-data-collection-plan-yet/

https://www.regulations.gov/docket/FDA-2019-N-1482/document


Stay up to date. Follow us:


QuickChek – October 29, 2021


Voyager Digital Reports Revenue of US$175 Million for Fiscal 2021 and Provides Business Update

Voyager Digital announced it has filed its full-year consolidated financials for the fiscal year ended June 30, 2021 and is pleased to provide shareholders with a business and operational update

See today’s research report on Voyager Digital from Joe Gomes, Senior Research Analyst at Noble Capital Markets

Research, News & Market Data on Voyager Digital

Watch recent presentation from Voyager Digital


Travelzoo Reports Third Quarter 2021 Results

Travelzoo announced financial results for the third quarter ended September 30, 2021

Research, News & Market Data on Travelzoo


Capstone Green Energy (NASDAQ:CGRN) to Announce Its Second Quarter Fiscal Year 2022 Financial Results on Wednesday, November 10, 2021

Capstone Green Energy announced that on Wednesday, November 10, 2021, after market close, it expects to release full financial results for its second quarter of fiscal year 2022, ended September 30, 2021

Research, News & Market Data on Capstone Green Energy

Watch recent presentation from Capstone Green Energy


Stay up to date. Follow us:


Voyager Digital Reports Revenue of US$175 Million for Fiscal 2021 and Provides Business Update


Voyager Digital Reports Revenue of US$175 Million for Fiscal 2021 and Provides Business Update


Voyager Digital Ltd. (“Voyager” or the “Company”) (TSX: VOYG; OTCQX: VYGVF; FRA: UCD2), one of the fastest-growing, publicly traded cryptocurrency platforms in the United States, today announced it has filed its full-year consolidated financials for the fiscal year ended June 30, 2021 and is pleased to provide shareholders with a business and operational update.
 
“Fiscal 2021 was a breakout year for Voyager, positioning our platform to be a leading player in the digital asset arena as crypto and related blockchain technologies are increasingly embraced by the mainstream,” said Steve Ehrlich, Voyager’s CEO and Co-founder. “Voyager continues to deliver noteworthy performance through verified user and funded account growth punctuated by providing users with a transparent, safe, secure and trusted personal cryptocurrency platform. We continued to see significant net new funded accounts and net new asset inflows on the platform and as we add more product extensions, we believe the ability to leverage our growing user base will accelerate our revenue growth and provide diversification to our revenue mix.”
 
Fiscal Year 2021 Financial and Business Milestones:
All figures are in U.S. dollars unless otherwise noted.

  • Total revenue increased to $175 million, from $1 million in FY20
  • Operating Income of $56 million, compared to an Operating Loss of $11 million in FY20
  • Total Verified Users grew to 1.75 million, up from 86,000 at June 30, 2020
  • Total Funded Accounts grew to 665,000 from 23,000 at June 30, 2020
  • Total Assets Under Management grew to $2.6 billion from $35 million at June 30, 2020
  • Added to our leadership team in key areas
  • Increased our headcount to 141 at June 30, 2021, from 36 at June 30, 2020
  • Invested in and developed a strategic partnership with Blockdaemon to deliver enhanced staking capabilities

 
“We are seeing industry volumes rebound off extreme midsummer weakness, and are excited about the prospects ahead,” continued Ehrlich. “As we started to see lower than expected volumes in the summer months, we turned our attention to enhancing our rewards programs as a customer acquisition and retention tool. In the September quarter, we started focusing on account acquisition as our key performance metric.  Voyager remains dedicated to growth in funded accounts and deposits and you can expect we will be more aggressive with both our marketing spend as well as our rewards offerings to accelerate growth. As we diversify our revenue streams to enhance the long-term value of each customer and expand our market opportunity internationally, we believe the best is yet to come for the Voyager platform.”
 
Voyager will be announcing the results of its first quarter ending September 30th on or about November 15th, and will provide further commentary on its second quarter ending December 31st based on current trends and a very robust October which validates its strategy of total focus on account and deposit growth.
 
For more detailed information, the Company encourages investors to read its audited financial statements and related Management Discussion & Analysis (“MD&A”) for the three and twelve months ended June 30, 2021, which were filed with SEDAR yesterday.
 
The Company also wishes to provide an update on the US$75 million Private Placement of common shares with Alameda Research announced on October 28, 2021. The Company is issuing a total of 7,723,996 common shares to Alameda Research at a price of US$9.71 per common shares. The newly issued shares are subject to a statutory hold period of 4 months and one day from the date of closing and are subject to a lock-up agreement of one year from the closing date.
 
The TSX has not approved or disapproved of the information contained herein. The Private Placement with Alameda Research is subject to the satisfaction of certain customary closing conditions, including the receipt of all necessary regulatory and stock exchange approvals, including the approval of the Toronto Stock Exchange.
 
Conference Call Details
Voyager will discuss its fiscal 2021 results today, October 29, 2021, via a conference call at 8:00 a.m. Eastern Time. To access the webcast, please register by clicking here. A live webcast and a replay will be available on the Investor Relations section of the Company’s website at investvoyager.com/investorrelations/events.
 
About Voyager Digital Ltd.
Voyager Digital Ltd. (TSX: VOYG; OTCQX: VYGVF; FRA: UCD2) is a fast-growing, publicly traded cryptocurrency platform in the United States founded in 2018 to bring choice, transparency, and cost efficiency to the marketplace. Voyager offers a secure way to trade over 60 different crypto assets, with zero commissions, using its easy-to-use mobile application, and earn rewards up to 12 percent annually on more than 30 cryptocurrencies. Through its subsidiary Coinify ApS, Voyager provides crypto payment solutions for both consumers and merchants around the globe. To learn more about the company, please visit https://www.investvoyager.com.
 
Forward Looking Statements
Certain information in this press release, including, but not limited to, statements regarding future growth and performance of the business, momentum in the businesses, future adoption of digital assets, and the Company‘s anticipated results may constitute forward looking information (collectively, forward-looking statements), which can be identified by the use of terms such as “may,” “will,” “should,” “expect,” “anticipate,” “project,” “estimate,” “intend,” “continue” or “believe” (or the negatives) or other similar variations. Forward-looking statements involve known and unknown risks, uncertainties and other factors that may cause Voyager’s actual results, performance or achievements to be materially different from any of its future results, performance or achievements expressed or implied by forward-looking statements. Moreover, we operate in a very competitive and rapidly changing environment. New risks emerge from time to time. It is not possible for our management to predict all risks, nor can we assess the impact of all factors on our business or the extent to which any factor, or combination of factors, may cause actual results to differ materially from those contained in any forward-looking statements we may make. In light of these risks, uncertainties, and assumptions, the future events and trends discussed in this press release may not occur and actual results could differ materially and adversely from those anticipated or implied in the forward-looking statements. Forward looking statements are subject to the risk that the global economy, industry, or the Company’s businesses and investments do not perform as anticipated, that revenue or expenses estimates may not be met or may be materially less or more than those anticipated, that trading momentum does not continue or the demand for trading solutions declines, customer acquisition does not increase as planned, product and international expansion do not occur as planned, risks of compliance with laws and regulations that currently apply or become applicable to the business and those other risks contained in the Company’s public filings, including in its Management Discussion and Analysis and its Annual Information Form (AIF). Factors that could cause actual results of the Company and its businesses to differ materially from those described in such forward-looking statements include, but are not limited to, a decline in the digital asset market or general economic conditions; changes in laws or approaches to regulation, the failure or delay in the adoption of digital assets and the blockchain ecosystem by institutions; changes in the volatility of crypto currency, changes in demand for Bitcoin and Ethereum, changes in the status or classification of cryptocurrency assets, cybersecurity breaches, a delay or failure in developing infrastructure for the trading businesses or achieving mandates and gaining traction; failure to grow assets under management, an adverse development with respect to an issuer or party to the transaction or failure to obtain a required regulatory approval. In connection with the forward-looking statements contained in this press release, the Company has made assumptions that no significant events occur outside of the Company’s normal course of business and that current trends in respect of digital assets continue. Readers are cautioned that Assets Under Management and trading volumes fluctuate and may increase and decrease from time to time and that such fluctuations are beyond the Company’s control. Forward-looking statements, past and present performance and trends are not guarantees of future performance, accordingly, you should not put undue reliance on forward-looking statements, current or past performance, or current or past trends. Information identifying assumptions, risks, and uncertainties relating to the Company are contained in its filings with the Canadian securities regulators available at www.sedar.com. The forward-looking statements in this press release are applicable only as of the date of this release or as of the date specified in the relevant forward-looking statement and the Company undertakes no obligation to update any forward-looking statement to reflect events or circumstances after that date or to reflect the occurrence of unanticipated events. The Company assumes no obligation to provide operational updates, except as required by law. If the Company does update one or more forward-looking statements, no inference should be drawn that it will make additional updates with respect to those or other forward-looking statements, unless required by law.Readers are cautioned that past performance is not indicative of future performance and current trends in the business and demand for digital assets may not continue and readers should not put undue reliance on past performance and current trends.  Refer to definition of certain Non-IFRS terms in Management’s Discussion and Analysis including Assets Under Management, Adjusted EBITDA and Adjusted Working Capital. All figures are in U.S. dollars unless otherwise noted.

The TSX has not approved or disapproved of the information contained herein.

Voyager Digital Ltd.
Consolidated Statements of Financial Position
(USD, in thousands)


June 30, 2021


June 30, 2020

Assets


Current assets


Cash and cash equivalents


$

193,933


$

3,629

Cash held for customers


162,852


1,495

Crypto assets held


2,286,399


13,107

Crypto assets loaned


393,561


19,104

Investments


31,359


Other current assets


5,839


519

Total current assets


3,073,943


37,854

Intangible assets


559


757

Other non-current assets


2,860


160

Total assets


$

3,077,362


$

38,771

Liabilities


Current liabilities


Crypto assets and fiat payable to customers


$

2,807,015


$

33,616

Crypto assets borrowed


36,832


Warrant liability


23,810


2,197

Other current liabilities


22,644


1,792

Total current liabilities


2,890,301


37,605

Other non-current liabilities


739


615

Total liabilities


2,891,040


38,220

Equity


Share capital


265,704


37,708

Share-based payments reserve


15,125


2,913

Warrant reserve


3,457


2,610

Treasury shares


(3,796)


Retained deficit


(94,168)


(42,680)

Total equity


186,322


551

Total liabilities and equity


$

3,077,362


$

38,771

Voyager Digital Ltd.
Consolidated Statements of Loss
(USD, in thousands except for shares data)


Year Ended June 30,


2021


2020

Revenues


Transaction revenue


$

154,047


$

859

Fees from crypto assets loaned


21,009


291

Total revenues


175,056


1,150

Expenses


Rewards paid to customers


47,102


242

Marketing and sales


23,609


275

Share-based payments


12,864


1,399

Compensation and employee benefits


7,917


3,250

Total compensation and employee benefits


20,781


4,649

Trade expenses


7,985


346

Customer onboarding and service


7,390


196

Professional and consulting


4,495


1,332

General and administrative


7,847


5,295

Total expenses


119,209


12,335

Income (loss) before other income (loss)


55,847


(11,185)

Other income (loss)


Change in fair value of crypto assets held


(318)


(476)

Change in fair value of investments


8,289


Change in fair value of crypto assets borrowed


(11,809)


Change in fair value of warrant liability


(89,827)


1,419

Fees on crypto assets borrowed


(2,528)


Loss on issuance of warrants


(1,157)

Gain on acquisitions, net


1,229

Total other income (loss)


(96,193)


1,015

Net loss before provision for income tax


(40,346)


(10,170)

Provision for incomes tax


11,142


Net loss


$

(51,488)


$

(10,170)


Basic and diluted net loss per share


$

(0.39)


$

(0.13)

Basic and diluted weighted average number of common shares outstanding


131,588,580


79,356,838


SOURCE Voyager Digital, Ltd.


Press Contacts

 
Voyager Digital, Ltd.
Michael Legg
Chief Communications Officer
(212) 547-8807
mlegg@investvoyager.com

Voyager Public Relations Team
pr@investvoyager.com

Structure-based Subgroups Could Provide More Effective Cancer Therapies


Image Credit: Yale Rosen (Flickr)

A New Way to Organize Cancer Mutations Could Lead to Better Treatment Matches for Patients


There are many types of cancer treatments. But which ones work best varies from patient to patient. Currently, doctors determine which treatment to try for a patient based on where in their DNA, or genetic code, the error that caused the cancer is located.

But a new approach that groups patients by the changes in protein structure and function caused by that error, rather than by the location of the changes in DNA, could lead to both more inclusive clinical trials and better treatment matches for patients.


This article was
republished with permission from 
The
Conversation
, a news site dedicated to sharing ideas
from academic experts.  It was written by and represents the
research-based opinions of
Jacqulyne Robichaux Assistant Professor of Thoracic &
Head and Neck Oncology, The University of Texas MD Anderson Cancer Center


I am part of a team that researches targeted therapies for cancer and ways to make treatment more patient-specific. A recent study by our research team determined that grouping DNA errors by structure may better personalize cancer therapies.

Targeted Therapies
Hone in on Cancer Cells

Mutations are errors made during cell replication when the genetic material of that cell, or DNA, makes a new copy of itself. These mutations are usually harmless and caught by the cell’s proofreading machinery.

However, the proofreader occasionally fails. And on rare instances, these mutations occur in parts of the DNA called oncogenes. Under normal conditions, oncogenes are essential to normal growth and development, such as fetal organ development and general tissue repair and maintenance. But when mutations cause oncogenes to signal for unregulated growth, cancer can form.

One way to kill these tumor cells is to use targeted therapy. Cancer-targeted therapies bind specifically to the defective proteins produced by mutated oncogenes and prevent them from sending a “grow” signal.

Because targeted therapies bind directly to the cancerous protein, they spare most noncancerous cells from being harmed. This results in more specific cancer cell killing and less overall treatment toxicity. In contrast, chemotherapy attacks all actively dividing cells, which includes not just cancer but also hair follicles, the digestive tract, and other parts of the body.

To make targeted therapies more specific, scientists often study the physical or structural changes that mutations cause in proteins. They design drugs that preferentially bind to these particular changes to prevent the defective protein from causing uncontrolled growth.

However, because mutations can occur in many different areas of a protein, multiple targeted therapies are often necessary to bind all the different mutations that occur across cancer types. This leads to a difficult clinical problem: How do physicians match patients to the most effective targeted therapy for their mutations?

Traditional Treatments Use Mutation Location

To attempt to answer this question, our research team chose to focus on one oncogene in lung cancer, EGFR, or epidermal growth factor receptor. We did this for two reasons. First, lung cancer remains the No. 1 cause of cancer-related deaths worldwide. Second, EGFR mutations are among the most common forms of lung cancer – they occur in approximately a third of non-small-cell lung cancers worldwide, amounting to over 550,000 patients annually.

EGFR has many different mutations that cause unregulated growth. Multiple generations of targeted therapies are available for this population of patients.

Clinical trials and treatment options for patients with oncogene-driven lung cancer, particularly with EGFR, are currently based on the type and location of the mutation in the DNA.

However, mutation location is not the best approach to predict how well patients will respond to a drug. Because mutations change the shape of a protein, they can alter the way targeted therapies interact with the protein.

Regrouping cancer mutations

By examining the mutated structures of different EGFR proteins, our team found that they could be categorized into distinct subgroups.

For example, we found that mutations that form away from the areas of the protein that drugs target don’t noticeably affect how well the drug binds to the protein. Cells with this kind of protein mutation were thus killed by all types of EGFR inhibitors. Although these mutations occurred across many locations in the DNA, they shared the same overall structural and functional effect on proteins.

Conversely, mutations that form near typical drug target areas compress this region and prevent certain EGFR inhibitors from attaching to the protein. These mutations also occurred in several different DNA locations.

Based on these findings, our team hypothesized that structural changes in similar protein regions, not DNA location, would cause similar changes in how well a drug works.

To test our hypothesis, we retrospectively analyzed public and hospital data on how well patients responded to cancer treatments. We sorted patients into traditional DNA location-based groups and our newly defined structure/function-based subgroups to determine whether one group had more patients who responded better than the other to different drugs.

We found that the structure/function-based subgroups identified nearly twice as many patients that benefited from a particular drug compared with the DNA location-based groups. Grouping patients by structure/function also identified which EGFR inhibitor provided the longest clinical benefit for patients.

More Inclusive Clinical Trials

In
addition to potentially matching patients to more effective treatments,
clinical trials using structure-based subgroups may lead to broader access to
therapies.

Current clinical trials exclude up to a fifth of patients with EGFR mutant non-small-cell lung cancer because each clinical trial typically focuses on only a handful of specific mutation types. Reframing clinical studies to be based on the changes that mutations cause to protein structure and function, as opposed to their location on DNA, could expand treatment options to include patients with more rare EGFR mutant cancers.

This approach provides a framework that clinical trials could use to make studies more inclusive of all types of mutations. And it may also identify previously ignored or hidden mutation subgroups that can lead to additional drug development and ultimately improve patient care.


Suggested Reading:


Measuring Cancer Cells to Tailor Treatments


Biologists Identify New Targets for Cancer Vaccines


Stem Cells Role in the Anti-Aging Business


Therapeutic Research Advanced by Stem Cell Science


Stay up to date. Follow us:


Release – Capstone Green Energy to Announce Its Second Quarter Fiscal Year 2022 Financial Results on Wednesday November 10 2021


Capstone Green Energy (NASDAQ:CGRN) to Announce Its Second Quarter Fiscal Year 2022 Financial Results on Wednesday, November 10, 2021


Webcast Scheduled for 1:45 PM PT/4:45 PM ET November 10, 2021

VAN NUYS, CA / ACCESSWIRE / October 29, 2021 / Capstone Green Energy Corporation (www.CapstoneGreenEnergy.com) (NASDAQ:CGRN), a global leader in carbon reduction and on-site resilient green energy solutions, announced today that on Wednesday, November 10, 2021, after market close, it expects to release full financial results for its second quarter of fiscal year 2022, ended September 30, 2021. Later that same day, at 1:45 p.m. Pacific Time (4:45 p.m. Eastern Time), Capstone will host a live webcast to discuss those results.

At the end of the conference call, Capstone will host a question-and-answer session to provide an opportunity for financial analysts to ask questions. Investors and interested individuals are invited to listen to the webcast by logging on to the Company’s investor relations webpage at www.capstonegreenenergy.com. A replay of the webcast will be available on the site for 30 days.

About Capstone Green Energy

Capstone Green Energy (www.CapstoneGreenEnergy.com) (NASDAQ:CGRN) is a leading provider of customized microgrid solutions and on-site energy technology systems focused on helping customers around the globe meet their environmental, energy savings, and resiliency goals. Capstone Green Energy focuses on four key business lines. Through its Energy as a Service (EaaS) business, it offers rental solutions utilizing its microturbine energy systems and battery storage systems, comprehensive Factory Protection Plan (FPP) service contracts that guarantee life-cycle costs, as well as aftermarket parts. Energy Conversion Products are driven by the Company’s industry-leading, highly efficient, low-emission, resilient microturbine energy systems offering scalable solutions in addition to a broad range of customer-tailored solutions, including hybrid energy systems and larger frame industrial turbines. The Energy Storage Products business line designs and installs microgrid storage systems creating customized solutions using a combination of battery technologies and monitoring software. Through Hydrogen Energy Solutions, Capstone Green Energy offers customers a variety of hydrogen products, including the Company’s microturbine energy systems.

For customers with limited capital or short-term needs, Capstone offers rental systems; for more information, contact: rentals@CGRNenergy.com. To date, Capstone has shipped over 10,000 units to 83 countries and estimates that, in FY21, it saved customers over $217 million in annual energy costs and approximately 397,000 tons of carbon. Total savings over the last three years are estimated at 1,115,100 tons of carbon and $698 million in annual energy savings.

For more information about the Company, please visit: www.CapstoneGreenEnergy.com. Follow Capstone Green Energy on TwitterLinkedInInstagramFacebook, and YouTube.

CONTACT:
Capstone Green Energy
Investor and investment media inquiries:
818-407-3628
ir@CGRNenergy.com

SOURCE: Capstone Green Energy Corporation

Release – Travelzoo Reports Third Quarter 2021 Results


Travelzoo Reports Third Quarter 2021 Results


NEW YORK
Oct. 29, 2021 (GLOBE NEWSWIRE) — 
Travelzoo® (NASDAQ: TZOO):

  • Consolidated revenue of 
    $15.7 million, up 14% year-over-year
  • Non-GAAP consolidated operating profit of 
    $1.1 million
  • Earnings per share (EPS) of 
    $0.22 attributable to 
    Travelzoo from continuing operations

Travelzoo, a global Internet media company that provides exclusive offers and experiences for members, today announced financial results for the third quarter ended 
September 30, 2021.
Consolidated revenue was 
$15.7 million, up 14% from 
$13.8 million year-over-year and down 18%
from the prior quarter. Reported revenue excludes revenue from discontinued operations in 
Asia Pacific
Travelzoo’s reported revenue consists of advertising revenues and commissions, derived
from and generated in connection with purchases made by 
Travelzoo members.

The reported net income attributable to 
Travelzoo from continuing operations was 
$2.8 million for Q3 2021. At the consolidated level, including minority interests, the reported net income from continuing operations was 
$2.9 million. EPS from continuing operations was 
$0.22, compared to a loss per share of (
$0.10) in the prior-year period. GAAP operating loss was 
$261,000.

Non-GAAP operating profit was 
$1.1 million. The calculation of non-GAAP operating profit excludes amortization of intangibles (
$0.3 million), stock option expenses (
$1.0 million), and severance-related expenses (
$0.1 million). See section “Non-GAAP Financial Measures” below.

“We saw robust growth in our revenue and operating profit from 
Travelzoo in Europe,” said  Holger Bartel, Global CEO. “Unfortunately, revenue from 
Travelzoo in 
North America was negatively impacted by press coverage about the 
COVID-19 Delta variant and 
Do Not Travel advisories for nearly 100 countries. We believe this to be a short-term effect. We see strong pent-up demand from 
Travelzoo members to get away as soon as possible.”

Cash Position
As of 
September 30, 2021, consolidated cash, cash equivalents, and restricted cash were 
$66.4 million. Net cash used in operations was 
$12.7 million. Cash was used primarily in connection with the switch to a more efficient merchant payment processing solution. There were no significant capital expenditures.

Reserve
Reported revenues include a reserve of 
$3.1 million related to commissions to be earned from refundable vouchers sold. The reserve is booked as contra revenue.

Travelzoo North America

North America business segment revenue increased 6% year-over-year to 
$9.7 million. Operating loss for Q3 2021 was 
$918,000, compared to an operating loss of 
$696,000 in the prior-year period.

Travelzoo Europe

Europe business segment revenue increased 43% year-over-year to 
$5.2 million. Operating profit for Q3 2021 was 
$600,000, or 11% of revenue, compared to an operating loss of 
$757,000 in the prior-year period.

Jack’s Flight Club 
On 
January 13, 2020
Travelzoo acquired 60% of Jack’s 
Flight Club, a membership subscription service. Jack’s 
Flight Club revenue decreased 19% year-over-year to 
$796,000. Operating income for Q3 2021 was 
$57,000, compared to an operating income of 
$250,000 in the prior-year period. After consolidation with 
Travelzoo, Jack’s 
Flight Club’s net income was 
$20,000 with 
$12,000 attributable to 
Travelzoo as a result of recording 
$274,000 of amortization of intangible assets related to the acquisition.

Licensing
In June of 2020, 
Travelzoo entered into a royalty-bearing licensing agreement with a local licensee in 
Japan for the exclusive use of Travelzoo’s brand, business model, and members in 
Japan. In August of 2020, 
Travelzoo entered into a royalty-bearing licensing agreement with a local licensee in 
Australia for the exclusive use of Travelzoo’s brand, business models, and members in 
Australia
New Zealand and 
Singapore. Under these arrangements, Travelzoo’s existing members in 
Australia
Japan
New Zealand, and 
Singapore will continue to be owned by 
Travelzoo as the licensor. Licensing revenue is booked with a lag of one quarter. 
Travelzoo recorded 
$2,000 in licensing revenue from the licensee in 
Australia
New Zealand and 
Singapore in Q3 2021. Licensing revenue is expected to increase as the licensees develop their business and effects of the pandemic subside.

Members and Subscribers
As of 
September 30, 2021, we had 30.7 million members worldwide. In 
North America, the unduplicated number of 
Travelzoo members was 17.2 million as of 
September 30, 2021, up 5% from 
September 30, 2020. In 
Europe, the unduplicated number of 
Travelzoo members was 8.4 million as of 
September 30, 2021, down 5% from 
September 30, 2020. Jack’s 
Flight Club had 1.7 million subscribers as of 
September 30, 2021, consistent with 1.7 million subscribers as of 
September 30, 2020.

Discontinued Operations
As announced in a press release on 
March 10, 2020
Travelzoo decided to exit its 
Asia Pacific business and operate it as a licensing business going forward. Consequently, the 
Asia Pacific business has been classified as discontinued operations since 
March 31, 2020. Prior periods have been reclassified to conform with the current presentation. Certain reclassifications have been made for current and prior periods between the continued operations and the discontinued operations in accordance with 
U.S. GAAP.

Income Taxes
Income tax expense was 
$233,000 in Q3 2021, compared to an income tax benefit of 
$244,000 in the prior-year period.

Non-GAAP Financial Measures
Management calculates non-GAAP operating income when evaluating the financial performance of the business. Travelzoo’s calculation of non-GAAP operating income, also called “non-GAAP operating profit” in this press release and today’s earnings conference call, excludes the following items: impairment of intangibles and goodwill, amortization of intangibles, stock option expenses, and severance-related expenses. This press release includes a table which reconciles GAAP operating income to the calculation of non-GAAP operating income. Non-GAAP operating income is not required by, or presented in accordance with, generally accepted accounting principles in 
the United States of America (“GAAP”). This information should be considered as supplemental in nature and should not be considered in isolation or as a substitute for the financial information prepared in accordance with GAAP. In addition, these non-GAAP financial measures may not be the same as similarly titled measures reported by other companies.

Looking Ahead
We currently expect to achieve profitability in Q4 2021. We continue to see a trend of recovery of our revenue. However, there could be unexpected fluctuations in the short-term. We have been able to reduce our operating expenses, and we believe we can continue the trend of lower fixed costs in the foreseeable future.

Conference Call

Travelzoo will host a conference call to discuss third quarter results today at 
11:00 a.m. ET. Please visit http://ir.travelzoo.com/events-presentations to download the management presentation (PDF format) to be discussed in the conference call; and access the webcast.

About Travelzoo

Travelzoo® provides its 30 million members exclusive offers and one-of-a-kind experiences personally reviewed by our deal experts around the globe. We have our finger on the pulse of outstanding travel, entertainment, and lifestyle experiences. We work in partnership with more than 5,000 top travel suppliers—our long-standing relationships give 
Travelzoo members access to irresistible deals.

Certain statements contained in this press release that are not historical facts may be forward-looking statements within the meaning of Section 27A of the Securities Act of 1933 and Section 21E of the Securities and Exchange Act of 1934. These forward-looking statements may include, but are not limited to, statements about our plans, objectives, expectations, prospects and intentions, markets in which we participate and other statements contained in this press release that are not historical facts. When used in this press release, the words “expect”, “predict”, “project”, “anticipate”, “believe”, “estimate”, “intend”, “plan”, “seek” and similar expressions are generally intended to identify forward-looking statements. Because these forward-looking statements involve risks and uncertainties, there are important factors that could cause actual results to differ materially from those expressed or implied by these forward-looking statements, including changes in our plans, objectives, expectations, prospects and intentions and other factors discussed in our filings with the 
SEC. We cannot guarantee any future levels of activity, performance or achievements. 
Travelzoo undertakes no obligation to update forward-looking statements to reflect events or circumstances occurring after the date of this press release.

Travelzoo, Top 20, and 
Jack’s Flight Club are registered trademarks of 
Travelzoo.


Travelzoo
Condensed Consolidated Statements of Operations
(Unaudited)
(In thousands, except per share amounts)

  Three months ended   Nine months ended
  September 30,   September 30,
  2021   2020   2021   2020
Revenues $ 15,688        $ 13,787        $ 49,051        $ 41,118     
Cost of revenues 2,992        2,924        8,532        7,768     
Gross profit 12,696        10,863        40,519        33,350     
Operating expenses:              
Sales and marketing 7,709        6,929        21,839        24,311     
Product development 684        592        2,052        2,586     
General and administrative 4,564        4,545        14,180        16,709     
Impairment of intangible asset and goodwill —        —        —        2,920     
Total operating expenses 12,957        12,066        38,071        46,526     
Operating income (loss) (261 )     (1,203 )     2,448        (13,176 )  
Other income (loss), net 3,344        (37 )     3,862        (222 )  
Income (loss) from continuing operations before
income taxes
3,083        (1,240 )     6,310        (13,398 )  
Income tax expense (benefit) 233        (244 )     2,111        (2,070 )  
Income (loss) from continuing operations 2,850        (996 )     4,199        (11,328 )  
Income (loss) from discontinued operations,
net of tax
(19 )     (230 )     (5 )     (3,944 )  
Net income (loss) 2,831        (1,226 )     4,194        (15,272 )  
Net income (loss) attributable to non-controlling
interest
      125        (1 )     (1,122 )  
Net income (loss) attributable to 
Travelzoo
$ 2,823        $ (1,351 )     $ 4,195        $ (14,150 )  
               
Net income (loss) attributable to Travelzoo—
continuing operations
$ 2,842        $ (1,121 )     $ 4,200        $ (10,206 )  
Net income (loss) attributable to Travelzoo—
discontinued operations
$ (19 )     $ (230 )     $ (5 )     $ (3,944 )  
               
Income (Loss) per share—basic              
Continuing operations $ 0.24        $ (0.10 )     $ 0.36        $ (0.90 )  
Discontinued operations $ —        $ (0.02 )     $ —        $ (0.35 )  
Net income (loss) per share —basic $ 0.24        $ (0.12 )     $ 0.36        $ (1.25 )  
               
Income (Loss) per share—diluted              
Continuing operations $ 0.22        $ (0.10 )     $ 0.32        $ (0.90 )  
Discontinued operations $ —        $ (0.02 )     $ —        $ (0.35 )  
Net income (loss) per share—diluted $ 0.22        $ (0.12 )     $ 0.32        $ (1.25 )  
Shares used in per share calculation from continuing
operations—basic
11,648        11,310        11,510        11,353     
Shares used in per share calculation from
discontinued operations—basic
11,648        11,310        11,510        11,353     
Shares used in per share calculation from continuing
operations—diluted
12,904        11,310        13,132        11,353     
Shares used in per share calculation from
discontinued operations—diluted
11,648        11,310        11,510        11,353     


Travelzoo
Condensed Consolidated Balance Sheets
(Unaudited)
(In thousands)

  September 30,
2021
  December 31,
2020
Assets      
Current assets:      
Cash and cash equivalents $ 65,204        $ 63,061     
Accounts receivable, net 9,084        4,519     
Prepaid income taxes 2,882        931     
Deposits 104        137     
Prepaid expenses and other 3,080        1,166     
Assets from discontinued operations 63        230     
Total current assets 80,417        70,044     
Deposits and other 8,219        745     
Deferred tax assets 3,637        5,067     
Restricted cash 1,154        1,178     
Operating lease right-of-use assets 8,005        8,541     
Property and equipment, net 794        1,347     
Intangible assets, net 3,700        4,534     
Goodwill 10,944        10,944     
Total assets $ 116,870        $ 102,400     
Liabilities and Stockholders’ Equity      
Current liabilities:      
Accounts payable $ 11,875        $ 6,996     
Merchant payables 73,183        57,104     
Accrued expenses and other 7,546        8,649     
Deferred revenue 1,805        2,688     
Operating lease liabilities 3,482        3,587     
PPP notes payable (current portion) —        2,849     
Income tax payable 61        326     
Liabilities from discontinued operations 469        671     
Total current liabilities 98,421        82,870     
PPP notes payables —        814     
Deferred tax liabilities —        357     
Long-term operating lease liabilities 9,721        10,774     
Other long-term liabilities 2,249        1,085     
Total liabilities 110,391        95,900     
Non-controlling interest 4,608        4,609     
Common stock 118        114     
Treasury stock (at cost) (1,583 )     —     
Additional paid-in capital 3,432        6,239     
Retained earnings (accumulated deficit) 3,792        (403 )  
Accumulated other comprehensive loss (3,888 )     (4,059 )  
Total stockholders’ equity 1,871        1,891     
Total liabilities and stockholders’ equity $ 116,870        $ 102,400     


Travelzoo
Condensed Consolidated Statements of Cash Flows
(Unaudited)
(In thousands)

  Three months ended   Nine months ended
  September 30,   September 30,
  2021   2020   2021   2020
Cash flows from operating activities:              
Net income (loss) $ 2,831        $ (1,226 )     $ 4,194        $ (15,272 )  
Adjustments to reconcile net income (loss) to net cash provided by
(used in) operating activities:
             
Depreciation and amortization 448        588        1,408        1,806     
Stock-based compensation 971        1,189        2,788        5,243     
Deferred income tax (68 )     14        1,073        (1,747 )  
Impairment of intangible assets and goodwill —        —        —        2,920     
Gain on notes payable settlement —        —        —        (1,500 )  
Loss on long-lived assets —        —        —        437     
Loss on equity investment in WeGo —        138        —        474     
Gain on PPP notes payable forgiveness (3,159 )     —        (3,588 )     —     
Net foreign currency effects (45 )     (86 )     (300 )     (542 )  
Provision (reversal) of loss on accounts receivable and
other reserves
(854 )     1,496        (1,725 )     3,923     
Changes in operating assets and liabilities, net of acquisitions:              
Accounts receivable 933        63        (3,848 )     6,246     
Prepaid income taxes (1,294 )     (304 )     (2,007 )     685     
Prepaid expenses and other (6,698 )     206        (9,473 )     1,626     
Accounts payable 3,610        10,560        5,025        12,709     
Merchant payables (8,699 )     12,372        16,486        20,532     
Accrued expenses and other (132 )     (1 )     (452 )     (1,381 )  
Income tax payable (35 )     (412 )     (263 )     (479 )  
Other liabilities (476 )     (436 )     (34 )     1,904     
Net cash provided by (used in) operating activities (12,667 )     24,161        9,283        37,584     
Cash flows from investing activities:              
Acquisition of business, net of cash acquired —        —        —        (679 )  
Other investment —        —        —        (430 )  
Purchases of property and equipment 60        (49 )     (24 )     (252 )  
Net cash provided by (used in) investing activities 60        (49 )     (24 )     (1,361 )  
Cash flows from financing activities:              
Repurchase of common stock —        —        (1,583 )     (1,205 )  
Payment of promissory notes —        —        (110 )     (7,800 )  
Proceeds from notes payable —        —        —        3,663     
Exercise of stock options and taxes paid for net share
settlement
(2,357 )     —        (5,424 )     —     
Net cash used in financing activities (2,357 )     —        (7,117 )     (5,342 )  
Effect of exchange rate on cash, cash equivalents and
restricted cash
(823 )     904        (126 )     393     
Net increase (decrease) in cash, cash equivalents and
restricted cash
(15,787 )     25,016        2,016        31,274     
Cash, cash equivalents and restricted cash at beginning of period 82,188        26,968        64,385        20,710     
Cash, cash equivalents and restricted cash at end of period $ 66,401        $ 51,984        $ 66,401        $ 51,984     


Travelzoo
Segment Information from Continuing Operations
(Unaudited)
(In thousands)

Three months ended September 30, 2021 Travelzoo North
America
  Travelzoo Europe   Jack’s Flight Club   Elimination   Consolidated
Revenue from unaffiliated
customers
$ 9,527        $ 5,365        $ 796      $ —      $ 15,688     
Intersegment revenue 136        (136 )     —      —      —     
Total net revenues 9,663        5,229        796      —      15,688     
Operating income (loss) $ (918 )     $ 600

 
      $ 57      $ —      $ (261  )  
                   
Three months ended September 30, 2020 Travelzoo North
America
  Travelzoo Europe   Jack’s Flight Club   Elimination   Consolidated
Revenue from unaffiliated
customers
$ 9,002        $ 3,798        $ 987      $ —      $ 13,787     
Intersegment revenue 141        (141 )     —      —      —     
Total net revenues 9,143        3,657        987      —      13,787     
Operating income (loss) $ (696 )     $ (757 )     $ 250      $ —      $ (1,203 )  


Nine months ended September 30, 2021 Travelzoo North
America
  Travelzoo Europe   Jack’s Flight Club   Elimination   Consolidated
Revenue from unaffiliated
customers
$ 33,005       $ 13,503        $ 2,543        $ —        $ 49,051     
Intersegment revenue 462        (462 )     —        —        —     
Total net revenues 33,467        13,041        2,543        —        49,051     
Operating income (loss) $ 2,654        $ (323 )     $ 117        $ —        $ 2,448     
                   
Nine months ended September 30, 2020 Travelzoo North
America
  Travelzoo Europe   Jack’s Flight Club   Elimination   Consolidated
Revenue from unaffiliated
customers
$ 25,805        $ 12,706        $ 2,615        $ (8 )     $ 41,118     
Intersegment revenue 237        (245 )     —              —     
Total net revenues 26,042        12,461        2,615        —        41,118     
Operating income (loss) $ (6,374 )     $ (3,781 )     $ (3,013 )     $ (8 )     $ (13,176 )  


Travelzoo
Reconciliation of GAAP to Non-GAAP Information
(Unaudited)
(In thousands, except per share amounts)

  Three months ended   Nine months ended
  September 30,   September 30,
  2021   2020   2021   2020
GAAP operating expense $ 12,957        $ 12,066        $ 38,071      $ 46,526     
Non-GAAP adjustments:              
Impairment of intangible and goodwill (A) —        —        —      2,920     
Amortization of intangibles (B) 274        333        833      944     
Stock option expenses (C) 971        1,189        2,788      5,243     
Severance-related expenses (D) 95        855        493      1,139     
Non-GAAP operating expense 11,617        9,689        33,957      36,280     
               
GAAP operating income (loss) (261 )     (1,203 )     2,448      (13,176 )  
Non-GAAP adjustments (A through D) 1,340        2,377        4,114      10,246     
Non-GAAP operating income (loss) 1,079        1,174        6,562      (2,930 )  


Investor Relations:
Almira Pusch
ir@travelzoo.com

Source: Travelzoo
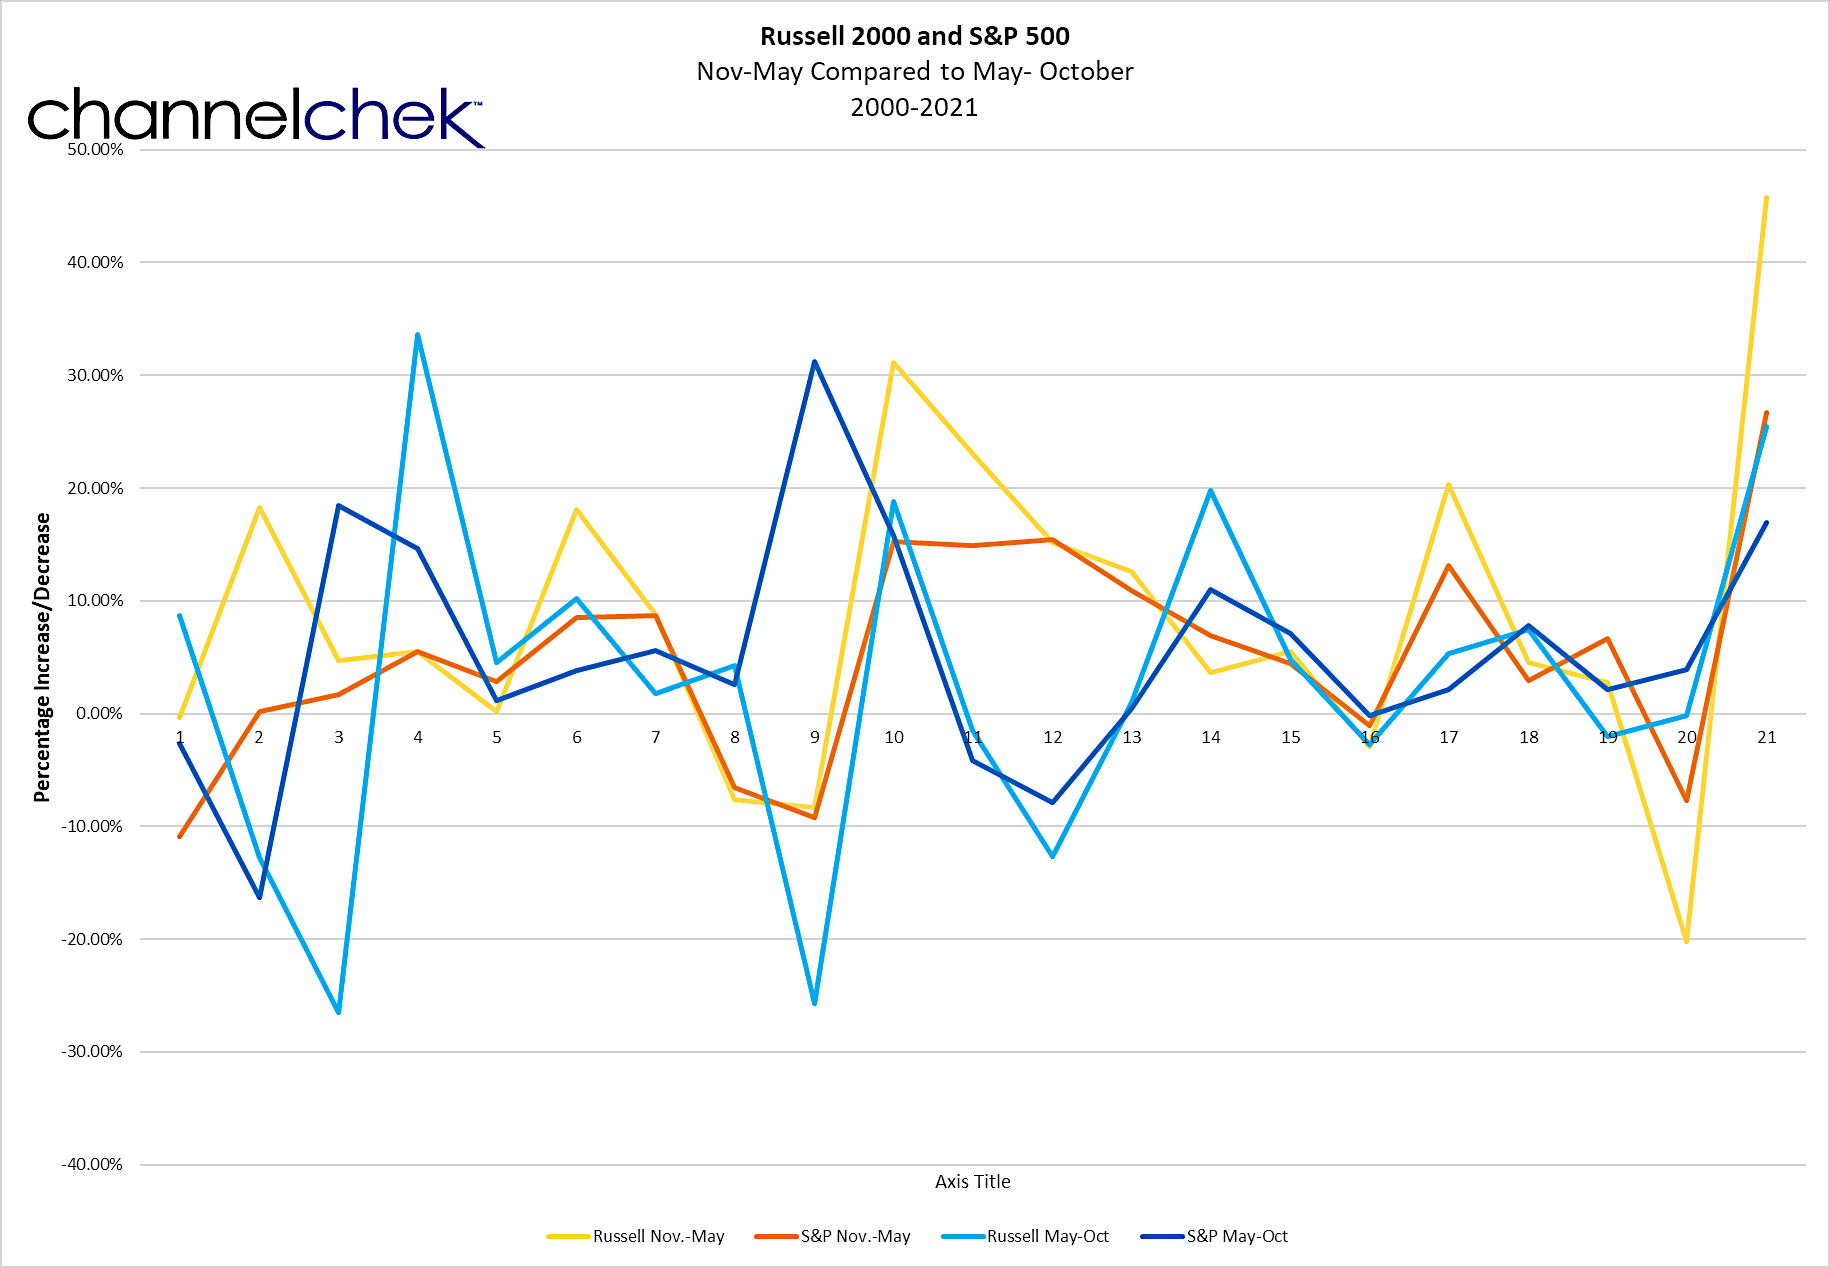
Cumulus Media (CMLS) – Quarterly Preview: Throttling Back Expectations Somewhat

Friday, October 29, 2021

Cumulus Media (CMLS)
Quarterly Preview: Throttling Back Expectations Somewhat

CUMULUS MEDIA, Inc. (NASDAQ: CMLS) is a leading audio-first media and entertainment company delivering premium content to over a quarter billion people every month — wherever and whenever they want it. CUMULUS MEDIA engages listeners with high-quality local programming through 428 owned-and-operated stations across 87 markets; delivers nationally-syndicated sports, news, talk, and entertainment programming from iconic brands including the NFL, the NCAA, the Masters, the Olympics, the GRAMMYS, the American Country Music Awards, and many other world-class partners across nearly 8,000 affiliated stations through Westwood One, the largest audio network in America; and inspires listeners through its rapidly growing network of original podcasts that are smart, entertaining and thought-provoking. CUMULUS MEDIA provides advertisers with local impact and national reach through on-air, digital, mobile, and voice-activated media solutions, as well as access to integrated digital marketing services, powerful influencers, and live event experiences. CUMULUS MEDIA is the only audio media company to provide marketers with local and national advertising performance guarantees.

Michael Kupinski, Director of Research, Noble Capital Markets, Inc.

Refer to the full report for the price target, fundamental analysis, and rating.

    2021-Q3 appears in line. The upcoming third quarter results are expected to reflect a a continuation of the advertising rebound reflected in the second quarter. Total company revenues are expected to be up roughly 20% to $237.0 million, with adj. EBITDA of $36.0 million, up 15%. The company is expected to report its third quarter end September 30 results on November 3rd.

    Feeling the pinch.  We believe that supply chain issues and labor shortages are beginning to affect the overall health of the U.S. economy, which is more evident in the larger markets than the smaller. In addition, chip shortages continue to plague the important auto category. As such, we are throttling back our fourth quarter revenue and adj. EBITDA estimate. We are lowering our Q4 revenue estimate …


This research is provided by Noble Capital Markets, Inc., a FINRA and S.E.C. registered broker-dealer (B/D).

*Analyst certification and important disclosures included in the full report. NOTE: investment decisions should not be based upon the content of this research summary.  Proper due diligence is required before making any investment decision.