Release – The U.S. Department of Energys Argonne National Laboratory Team Up with Gevo


The U.S. Department of Energy’s (DOE) Argonne National Laboratory Team Up with Gevo to Apply Argonne’s GREET Model to its Net-Zero Project


ENGLEWOOD, Colo., Sept. 20, 2021 (GLOBE NEWSWIRE) — Gevo, Inc. (NASDAQ: GEVO) The U.S. Department of Energy’s (DOE) Argonne National Laboratory recently partnered with Gevo, Inc., a Colorado-based producer of energy-dense liquid hydrocarbons such as sustainable aviation fuel (SAF) and renewable premium gasoline, to perform a critical lifecycle analysis of its next-generation technology.

Using data provided by Gevo, Argonne’s Greenhouse gases, Regulated Emissions, and Energy use in Technologies (GREET) Model is expected to yield results regarding carbon footprints of these fuels within a few months. The effort is funded by the DOE’s Bioenergy Technologies Office, which is part of the Office of Energy Efficiency and Renewable Energy (EERE).

“I am thrilled by this partnership and by the DOE’s investment in this project,” said Michael Wang, an Argonne Distinguished Fellow, Senior Scientist, and the Director of the Systems Assessment Center of the Energy Systems division at the laboratory. “This is the type of real-world application GREET was made for.”

GREET’s pioneering lifecycle analysis considers a host of different fuel production pathways. Results include energy use, emissions of greenhouse gases and air pollutants, and water consumption related to the production processes. The analysis also includes results across the whole of the fuel pathway system, from capturing carbon via photosynthesis to the final burning of the fuel.

Uisung Lee, an energy systems analyst in the Systems Assessment Center of the Energy Systems Division at Argonne, said that “Gevo’s commitment to reach net-zero carbon emissions with advanced renewable hydrocarbon fuels, including SAF and renewable premium gasoline made from field corn—not only in relation to the final product but in every stage of the production along the entire supply chain—will show how deep decarbonization of biofuels can be achieved holistically.”

“Biofuels are low carbon already,” Lee said. “But Gevo wants it to be net-zero carbon. That’s an ambitious goal and one that would be a game-changer in the biofuel industry.”

Argonne will examine emissions at every stage of the supply chain: This “field to aircraft wake” analysis will include each possible step from production to combustion. “While it might be impossible to reach zero carbon emissions at every stage, sustainable farming practices and carbon capture from biofuel plants and re-use might help the company reach its goal when measured across the whole biofuel supply chain system,” Wang said. GREET is unique; it is based on well-developed science and it allows for adaptation, and, in this way, can accommodate changes and incorporate new ideas, including those arising in agriculture and forestry, which are so important to innovation.

“We believe in radical transparency when it comes to sustainability. It’s incredibly important to have good data, good models, and use them for decision making, especially when making choices about technologies across the business system. When we find a process where we can reduce our carbon intensity, we have to analyze it, and if it moves us further down the path to our goals, we try to implement it,” says Dr. Patrick Gruber, Chief Executive Officer of Gevo, Inc. “The tools that the GREET model provides are key to our business model. We have used the GREET model as a guidepost for our process because those benefits are realized in the resulting analysis. It’s why our plants are expected to operate on renewable energy, including wind turbines, and why we chose to integrate renewable biogas into our production system. I expect that, as we work through the analysis with Argonne’s team, we will come up with additional great ideas to get our carbon footprint down even further.”

GREET is constantly being improved: The GREET software provides users with a ready-use life cycle analysis tool to perform simulations of alternative transportation fuels and vehicle technologies in just a few minutes. At present, there are more than 48,000 registered GREET users worldwide.

Wang said that Argonne plans on releasing its findings from this collaboration soon.

The Office of Energy Efficiency and Renewable Energy supports early-stage research and development of energy efficiency and renewable energy technologies to strengthen U.S. economic growth, energy security, and environmental quality.

About Gevo

Gevo’s mission is to transform renewable energy and carbon into energy-dense liquid hydrocarbons. These liquid hydrocarbons can be used for drop-in transportation fuels such as gasoline, jet fuel and diesel fuel, that when burned have potential to yield net-zero greenhouse gas emissions when measured across the full life cycle of the products. Gevo uses low-carbon renewable resource-based carbohydrates as raw materials, and is in an advanced state of developing renewable electricity and renewable natural gas for use in production processes, resulting in low-carbon fuels with substantially reduced carbon intensity (the level of greenhouse gas emissions compared to standard petroleum fossil-based fuels across their life cycle). Gevo’s products perform as well or better than traditional fossil-based fuels in infrastructure and engines, but with substantially reduced greenhouse gas emissions. In addition to addressing the problems of fuels, Gevo’s technology also enables certain plastics, such as polyester, to be made with more sustainable ingredients. Gevo’s ability to penetrate the growing low-carbon fuels market depends on the price of oil and the value of abating carbon emissions that would otherwise increase greenhouse gas emissions. Gevo believes that its proven, patented technology enabling the use of a variety of low-carbon sustainable feedstocks to produce price-competitive low-carbon products such as gasoline components, jet fuel and diesel fuel yields the potential to generate project and corporate returns that justify the build-out of a multi-billion-dollar business.

Gevo believes that the Argonne National Laboratory GREET model is the best available standard of scientific-based measurement for life cycle inventory or LCI. Learn more at Gevo’s website: www.gevo.com

Argonne National Laboratory seeks solutions to pressing national problems in science and technology. The nation’s first national laboratory, Argonne conducts leading-edge basic and applied scientific research in virtually every scientific discipline. Argonne researchers work closely with researchers from hundreds of companies, universities, and federal, state and municipal agencies to help them solve their specific problems, advance America’s scientific leadership and prepare the nation for a better future. With employees from more than 60 nations, Argonne is managed by UChicago Argonne, LLC for the U.S. Department of Energy’s Office of Science .

The U.S. Department of Energy’s Office of Science is the single largest supporter of basic research in the physical sciences in the United States and is working to address some of the most pressing challenges of our time. For more information, visit https://www.energy.gov/science.

Forward-Looking Statements

Certain statements in this press release may constitute “forward-looking statements” within the meaning of the Private Securities Litigation Reform Act of 1995. These forward-looking statements relate to a variety of matters, without limitation, including Gevo’s technology, the Department of Energy’s Argonne GREET model, the production of SAF, the attributes of Gevo’s products, Gevo’s Net-Zero Project and other statements that are not purely statements of historical fact. These forward-looking statements are made on the basis of the current beliefs, expectations and assumptions of the management of Gevo and are subject to significant risks and uncertainty. Investors are cautioned not to place undue reliance on any such forward-looking statements. All such forward-looking statements speak only as of the date they are made, and Gevo undertakes no obligation to update or revise these statements, whether as a result of new information, future events or otherwise. Although Gevo believes that the expectations reflected in these forward-looking statements are reasonable, these statements involve many risks and uncertainties that may cause actual results to differ materially from what may be expressed or implied in these forward-looking statements. For a further discussion of risks and uncertainties that could cause actual results to differ from those expressed in these forward-looking statements, as well as risks relating to the business of Gevo in general, see the risk disclosures in the Annual Report on Form 10-K of Gevo for the year ended December 31, 2020, and in subsequent reports on Forms 10-Q and 8-K and other filings made with the U.S. Securities and Exchange Commission by Gevo.

Investor and Media Contact

+1 720-647-9605

IR@gevo.com

Release – Bunker Hill Announces Updated PEA


Bunker Hill Announces Updated PEA: 42% Increase in NPV to $143M, 29% Decrease in AISC, 41% Increase in FCF Over Extended 11 Year Mine Life


HIGHLIGHTS:

  • Materially improved financial returns: 143M NPV (+42% increase), 35% IRR, 2.6 year payback, $25M annual average FCF (+28% increase) at $1.15/lb Zn, $0.90/lb Pb, $20/oz Ag (metal prices unchanged from April 2021 PEA )
  • Increased use of Long-Hole Open Stoping mining drives a 29% reduction in AISC to $0.47 per pound of payable zinc
  • Nearly 1 billion zinc equivalent pounds (including over 8 million ounces of silver) produced over an extended 11 year mine life.  The mine’s significant high-grade silver potential outside the current resource is not included
  • CEO Sam Ash and CFO David Wiens to host live interactive 6ix virtual investor event on Tuesday, September 21st at 11:00AM ET / 8:00AM PT.  Investors are invited to register for this event at: [LINK]

TORONTO, Sept. 20, 2021 (GLOBE NEWSWIRE) — Bunker Hill Mining Corp. (the “Company”) (CSE: BNKR, OTCQB: BHLL) is pleased to announce an updated Preliminary Economic Assessment (the “PEA” or the “updated PEA”) for the Bunker Hill Mine, showing materially improved financial returns, free cash flow, and unit costs.

The updated PEA contemplates a $44 million initial capital cost (including 20% contingency) to rapidly restart the mine over an 18-month period, generating approximately $25 million of annual average free cash flow over an extended 11-year mine life while producing nearly 1 billion zinc equivalent pounds of metal, including over 8 million ounces of silver. Metal price assumptions in the updated PEA remain unchanged from the PEA announced in April 2021 and published in June 2021 (the “June PEA”), thereby not reflecting significant increases in zinc and lead prices since that time.

Sam Ash, CEO of Bunker Hill Mining, stated: “We are very pleased to report the results of this summer’s mine plan optimization work and its significant positive effect on estimated financial returns, free cash flow, and cost position relative to April’s PEA. This is an important development milestone and affirms further the significant value to be realized from the rapid restart of the Bunker Hill Mine for our shareholders as well as our local partners and stakeholders.”

Concurrent with engineering studies designed to further enhance the project’s economics, the Company and its advisors are actively engaged with capital providers that have expressed an interest in financing the rapid restart of the mine.
 

The PEA was prepared in accordance with National Instrument 43-101 – Standards of Disclosure for Mineral Projects (“NI 43-101”). MineTech USA, LLC (“MineTech”) developed the mine infrastructure, capital expenditures and operating expenditures related portions of the updated PEA as well as the mine plan and operating schedules. Certain assumptions developed in coordination with Resource Development Associates Inc. (“RDA”) and Pro Solv Consulting, LLC., including metallurgical assumptions, remain unchanged from the June PEA. The Company plans to file the completed updated PEA technical report on SEDAR within 45 days of this press release and make it available on the Company’s website. All “t” references in this press release are to short tons and “$” references are in U.S. dollars.

Table 1 summarizes the key findings of the updated PEA relative to those in the June PEA.

Table 1: Updated PEA vs. June PEA

  Updated

PEA
  June

PEA
    % increase/

(decrease)
 
         
Metal Prices        
Zinc ($/lb) 1.15   1.15      
Lead ($/lb) 0.90   0.90      
Silver ($/lb) 20.00   20.00      
         
Financial returns        
After-tax NPV (5%) ($000) 143,471   100,737     42 %
After-tax NPV (8%) ($000) 107,790   78,355     38 %
After-tax IRR (%) 35.2 % 46.2 %   -24 %
Payback (years) 2.6   2.5     4 %
         
Total Cash Flow ($’000)        
EBITDA (3) (4) 383,378   298,018     29 %
Pre-tax free cash flow (3) 284,999   190,944     49 %
Free cash flow (3) 233,310   154,144     51 %
         
Average Annual Cash Flow ($’000)        
EBITDA (3) (4) 34,853   29,802     17 %
Pre-tax free cash flow (3) (4) 29,886
 
  23,298     28 %
Free cash flow (3) (4) 25,187
 
  19,618     28 %
         
Mine Plan        
Mine life (years) 11   10     10 %
         
Total mineralized material mined (kt) 6,377   5,460     17 %
Average zinc grade (%) 5.0 % 5.5 %   -9 %
Average lead grade (%) 2.8 % 2.9 %   -5 %
Average silver grade (oz/t) 1.5   1.5     -3 %
Average zinc equivalent grade (%) (1) 8.7 % 9.3 %   -7 %
         
Total Production over LOM (2)        
Zinc produced (klbs) 591,140   555,977     6 %
Lead produced (klbs) 323,116   290,157     11 %
Silver produced (koz) 8,418   7,401     14 %
Zinc equivalent produced (klbs) (1) 990,416   911,773     9 %
         
Average Unit Costs over LOM        
Opex – total ($/t) 62   78     -21 %
Sustaining capex ($/t) 10   14     -26 %
Cash costs ($/lb Zn payable) (3) 0.33   0.49     -33 %
AISC ($/lb Zn payable) (3) 0.47   0.65     -29 %

(1) Zinc equivalency calculated using metal prices utilized in PEA: $1.15/lb Zn, $0.90/lb Pb, $20/oz Ag

(2) Includes zinc produced in zinc concentrate, lead produced in lead concentrate, silver produced in lead concentrate

(3) Cash costs and AISC per payable pound of zinc sold, earnings before interest, taxes, depreciation and amortization(“EBITDA”), pre-tax free cash flow and free cash flow are non-GAAP financial measures. Please see “Cautionary Note Regarding Non-GAAP Measures”

(4) Life of mine (“LOM”) data post initial capital expenditures

The PEA is preliminary in nature and includes Inferred mineral resources that are considered too speculative geologically to have the economic considerations applied to them that would enable them to be categorized as mineral reserves. There is no certainty that the project described in the PEA will be realized. Mineral resources that are not mineral reserves do not have demonstrated economic viability.

Mineral Resource Inventory

As with the June PEA, the updated PEA is based on the Bunker Hill Mineral Resource, which was published on March 22, 2021, following the drilling program conducted in 2020 and early 2021 to validate the historical reserves. The PEA includes a mining inventory of 6.4Mt, which represents a portion of the 4.4Mt Indicated mineral resource and 5.6Mt Inferred mineral resource. Given the 11-year mine life, the mine plan has been based on prioritizing higher grade material. The mine production schedule is based on an $80 per ton NSR cut-off value, representing a more refined optimization approach relative to the June PEA in which a 5.0% zinc operating cut-off grade was utilized.

Initial Capital Costs

The majority of initial capital costs, including the process plant, shaft and tunnel rehabilitation, remain unchanged from the June 2021 PEA. The marginal increase in total initial capital costs from $42 million (June PEA) to $44 million (updated PEA) primarily reflects higher required up-front investment for waste development to enable the use of long-hole open stoping (“LHOS”) as the predominant mining method in the mine plan, as opposed to the cut and fill method in the June PEA. All initial capital expenditures continue to include a 20% contingency.

Further capital cost optimization initiatives are ongoing, including the potential purchase of used process plant equipment. If successful, these have the potential to accelerate ramp up and reduce initial capital costs.

Mine Plan

For the updated PEA, the Newgard/Quill resource was optimized and scheduled utilizing the long-hole open stoping mining method, whereby stopes are accessed via lateral drifts driven off of a decline ramp connecting the levels vertically. The ramp provides ventilation, utilities, and secondary escapeway, as well as connecting the entire mine with rubber tire access. The LHOS areas are accessed through a combination of existing excavations rehabilitated to modern mining standards, and new excavation. Backfill requirements are provided via an underground paste plant and distribution system.   The LHOS mining results in a step change downwards in mine operating costs from $58 to $41 per ton.

Production commences approximately six months following the start of construction, targeting 200 tons/day (“tpd”) ramping up to 1,000 tpd over the following six months. This ramp up allows for infrastructure components to be completed and commissioned to ensure the mine is adequately developed to maintain consistent production while taking advantage of toll milling for pre-production revenue generation. Initially, production will be targeted above the 9-level as the hoists and first 200-foot section of shaft rehabilitation are completed. The mine plan is developed to allow sequential water draw down and shaft rehabilitation between levels as new production horizons are required. This sequencing is continued to the 26-level.

Table 2: Mine Schedule

Year (1) Pre-prod Year 1 Year 2 Year 3 Year 4 Year 5 Year 6 Year 7 Year 8 Year 9 Year 10 Year 11 Year 12 LOM

Total
June

PEA
                               
Mineralized material mined (kt) 135   396   548   548   548   548   548   548   548   548   548   548   372   6,377   5,460  
                               
Zinc grade (%) 6.9 % 6.6 % 5.2 % 6.3 % 5.8 % 5.1 % 4.7 % 5.7 % 4.7 % 5.2 % 3.4 % 2.1 % 5.7 % 5.0 % 5.5 %
Lead grade (%) 2.3 % 2.3 % 2.8 % 2.1 % 1.8 % 2.2 % 1.3 % 2.2 % 2.3 % 1.8 % 4.3 % 6.5 % 4.3 % 2.8 % 2.9 %
Silver grade (oz/t) 0.3   0.7   1.2   1.1   0.5   1.2   1.0   1.4   1.4   1.2   2.7   3.7   2.0   1.5   1.5  
                               
Zinc eq grade (%) (2) 9.0 % 9.1 % 8.6 % 9.0 % 7.7 % 8.1 % 6.8 % 8.9 % 7.8 % 7.8 % 9.5 % 10.9 % 11.0 % 8.7 % 9.3 %

(1) Pre-production represents the first 12 months of the initial capex period; Years 1-11 represent 12-month periods, Year 12 represents 6-month period

(2) Zinc equivalency calculated using metal prices utilized in PEA: $1.15/lb Zn, $0.90/lb Pb, $20/oz Ag

Processing

The processing flowsheet and metallurgical assumptions as envisaged in the June PEA remain unchanged, with a crushing and milling plant to be centrally located on the 9-level, and milled material to be pumped in slurry to the flotation and paste plant on the 5-level. The flotation plant will generate concentrates which will be transported to surface for shipment. The paste plant will generate paste for geotechnical fill and tailings disposal in open drifts and stopes in the mine. This approach optimizes material transport costs while eliminating the need for surface tailings disposal.

Historical metallurgical results have been used for concentrate recoveries and grade. The results were averaged for the last five years of operation. The lead concentrate, assaying an average 67% Pb and 34 oz/t Ag, is estimated to recover 91% Pb and 89% Ag. The zinc concentrate, assaying 58% Zn, is estimated to recover 92% Zn. Metallurgical test work remains ongoing at RDI, with preliminary results received supporting assumptions used in the PEA.

The production schedule is presented in the Table below.

Table 3: Production Schedule

Year (1) Pre-prod Year 1 Year 2 Year 3 Year 4 Year 5 Year 6 Year 7 Year 8 Year 9 Year 10 Year 11 Year 12 LOM

Total
June

PEA
                               
Zn conc. (t) 14,674 41,556 45,549 54,838 50,395 44,634 41,221 49,781 40,461 44,755 29,735 18,366 33,638 509,603 479,290
Pb conc. (t) 4,159 12,314 20,953 15,440 13,052 16,000 9,842 16,183 17,228 13,493 32,319 48,674 21,474 241,131 216,535
                               
Zn prod. (klbs) 17,022 48,204 52,837 63,613 58,459 51,776 47,816 57,745 46,935 51,916 34,492 21,304 39,020 591,140 555,977
Pb prod. (klbs) 5,573 16,500 28,077 20,690 17,489 21,441 13,188 21,686 23,086 18,080 43,308 65,223 28,776 323,116 290,157
Ag prod. (koz) 38 238 575 515 249 603 479 700 668 576 1,320 1,792 663 8,418 7,401
                               
Zn eq. prod. (klbs) 2) 22,052 65,261 84,803 88,755 76,484 79,049 66,470 86,886 76,621 76,089 91,347 103,520 73,079 990,416 911,773

(1) Pre-production represents the first 12 months of the initial capex period; Years 1-11 represent 12-month periods, Year 12 represents 6-month period

(2) Zinc equivalency calculated using metal prices utilized in PEA: $1.15/lb Zn, $0.90/lb Pb, $20/oz Ag

Operating and Sustaining Capital Costs

Cash costs and AISC per payable pound of zinc sold are non-GAAP financial measures. Please see “Cautionary Note Regarding Non-GAAP Measures”.

Mine operating costs are based on experienced local contract labor and equipment for mining operations. A zero-based efficiency and cost estimate was completed based on current underground contractors’ rates and guidance benchmarked against other like operations. Electrical power costs are based on scheduled projected loads applying an estimated power factor correction and applicable Avista Utilities rates for all projected mine, milling and site operations.

Mill operating costs are within guidance resulting from bench marking similar mill operations in north Idaho. Mine site general and administrative (G&A) costs are determined based on anticipated staffing levels and similar compensation compatible with area salaries.

All sustaining capital costs include a 20% contingency.

Annual and LOM cost metrics are presented in the Table below.

Table 4: Operating and Sustaining Capital Costs

Year (1) Year 1 Year 2 Year 3 Year 4 Year 5 Year 6 Year 7 Year 8 Year 9 Year 10 Year 11 Year 12 LOM

Total
June

PEA
                             
Mining ($/t) 65 54 47 40 39 40 39 39 38 38   35   41 41 58
Processing ($/t) 15 15 15 15 15 15 15 15 15 15   15   15 15 15
G&A ($/t) 11 6 6 6 6 6 6 6 6 6   5   4 6 6
Opex – total ($/t) 90
 
74 68 61 60 60 60 60 59 59   54   59 62 78
                             
Sustain capex ($/t) 29 12 13 12 12 9 20 9 8 7   1   0 10 14
                             
Cash costs ($/lb Zn) 0.76 0.54 0.54 0.62 0.45 0.66 0.40 0.42 0.50 (0.40 ) (2.18 ) 0.02 0.33 0.49
AISC ($/lb Zn) 1.04 0.69 0.67 0.76 0.60 0.78 0.63 0.54 0.60 (0.27 ) (2.14 ) 0.02 0.47 0.65

(1) “Year 1” and “Year 12” are expressed on a 6-month basis; all other years on a 12-month basis

Cash Flow & Valuation

EBITDA, pre-tax free cash flow and free cash flow are non-GAAP financial measures. Please see “Cautionary Note Regarding Non-GAAP Measures”.

Post initial capital expenditures, the project is expected to generate pre-tax free cash flow of $329 million (41% increase relative to the June PEA) over its 11-year mine life and after-tax free cash flow of $275 million (41% increase relative to the June PEA). The Company expects to reinvest a portion of its pre-tax cash flows on high-grade silver targets in the existing mine footprint and those delineated by its geophysics program, which may reduce the tax assumptions accounted for in the project economics. Annual free cash flow increases in later years of the mine plan due to higher silver grades at deeper elevations.

The financial summary is presented in the Table below.

Table 5: Cash Flow & Valuation

Year in $’000 (1) Initial

Capex
Year 1 Year 2 Year 3 Year 4 Year 5 Year 6 Year 7 Year 8 Year 9 Year 10 Year 11 Year 12 LOM

Total
June

PEA
                               
Zinc revenue   24,664   51,649   62,181   57,143   50,611   46,740   56,446   45,878   50,748   33,716   20,825   38,143   538,744   521,583  
Lead revenue   7,870   24,005   17,690   14,953   18,332   11,276   18,541   19,738   15,459   37,028   55,766   24,603   265,262   241,311  
Silver revenue   3,110   10,917   9,778   4,740   11,464   9,103   13,295   12,694   10,950   25,085   34,055   12,605   157,797   137,286  
Gross revenue   35,643   86,571   89,649   76,836   80,407   67,120   88,283   78,311   77,157   95,830   110,646   75,351   961,803   900,181  
TC/RC & freight   (7,917 ) (18,615 ) (19,577 ) (17,421 ) (17,074 ) (14,352 ) (18,629 ) (16,352 ) (16,402 ) (18,273 ) (20,146 ) (15,640 ) (200,398 ) (189,419 )
NSR   27,727   67,955   70,072   59,416   63,333   52,767   69,654   61,960   60,754   77,557   90,500   59,711   761,405   710,762  
Mining   (13,873 ) (29,336 ) (25,979 ) (22,103 ) (21,527 ) (21,732 ) (21,576 ) (21,503 ) (20,949 ) (20,949 ) (19,115 ) (15,216 ) (253,858 ) (304,887 )
Processing   (3,136 ) (8,004 ) (8,004 ) (8,004 ) (8,004 ) (8,004 ) (8,004 ) (8,004 ) (8,004 ) (8,004 ) (8,004 ) (5,435 ) (88,616 ) (77,011 )
G&A   (2,255 ) (3,167 ) (3,167 ) (3,167 ) (3,167 ) (3,167 ) (3,167 ) (3,167 ) (3,167 ) (3,167 ) (3,167 ) (1,630 ) (35,553 ) (30,845 )
EBITDA   8,463   27,448   32,922   26,141   30,634   19,864   36,907   29,286   28,634   45,437   60,213   37,429   383,378   298,018  
Sustain capex   (6,190 ) (6,725 ) (6,876 ) (6,832 ) (6,507 ) (4,834 ) (11,215 ) (4,811 ) (4,440 ) (3,931 ) (685 ) (54 ) (63,098 ) (73,503 )
Initial capex (43,743 )                         (43,743 ) (42,034 )
Salvage                                               8,463   8,463   8,463  
Pre-tax FCF (43,743 ) 2,273   20,723   26,046   19,310   24,127   15,030   25,692   24,475   24,195   41,506   59,529   45,838   284,999   190,944  
Taxes (517 ) (268 ) (2,500 ) (4,706 ) (3,003 ) (4,112 ) (1,446 ) (4,964 ) (3,749 ) (3,316 ) (6,999 ) (9,789 ) (6,323 ) (51,690 ) (36,800 )
FCF (44,260 ) 2,006   18,223   21,340   16,307   20,016   13,584   20,728   20,726   20,879   34,507   49,740   39,515   233,310   154,144  
                               
Annual metrics – post initial capex (2)                          
Gross revenue   79,402   88,793   82,917   77,791   73,763   77,701   83,297   77,734   86,493   103,238   130,674     961,803   900,181  
EBITDA   22,252   30,837   29,515   27,687   25,249   28,385   33,096   28,960   37,035   52,825   67,535     383,378   298,018  
Pre-tax FCF   12,882   24,088   21,897   21,548   19,578   20,361   25,083   24,335   32,850   50,517   75,602     328,742   232,978  
FCF   11,365   20,485   18,042   17,991   16,800   17,156   20,727   20,803   27,693   42,124   64,385     277,570   196,498  
                               
NPV (5%) 143,471                              
NPV (8%) 107,790                              
                               
IRR (%) 35.2 %                            
Payback (years) 2.6                              

(1) Initial capex period is expressed on an 18-month basis; “Year 1” and “Year 12” are expressed on a 6-month basis; all other years on a 12-month basis

(2) All metrics expressed on a 12-month basis, beginning after the 18-month initial capex period

Sensitivities

The tables below summarize the after-tax sensitivities of NPV and IRR, with respect to metal prices and costs.

Table 6: Sensitivities

    Metal Prices   Operating & Capital Costs
                                 
NPV (5%)

($M)
 
      Zinc Price ($/lb)       Operating Costs (+/- %)
      0.85   1.00   1.15   1.30   1.45           -20 % -10 % 0 % 10 % 20 %
  Lead

Price

($/lb)
 
0.70 19   66   110   154   198     Total

Capital

Costs

(+/-

%)
 
-20 % 210   185   159   133   107  
  0.80 37   83   127   171   215     -10 % 203   177   151   125   100  
  0.90 55   99   143   187   232     0 % 195   169   143   118   92  
  1.00 72   116   160   204   249     10 % 187   162   136   110   84  
  1.10 89   133   177   221   266     20 % 180   154   128   102   77  
                                 
IRR (%)
 
      Zinc Price ($/lb)       Operating Costs (+/- %)
      0.85   1.00   1.15   1.30   1.45           -20 % -10 % 0 % 10 % 20 %
  Lead

Price

($/lb)
 
0.70 8 % 18 % 28 % 40 % 53 %   Total

Capital

Costs

(+/-

%)
 
-20 % 63 % 53 % 43 % 35 % 28 %
  0.80 11 % 21 % 32 % 44 % 57 %   -10 % 56 % 47 % 39 % 32 % 25 %
  0.90 14 % 24 % 35 % 47 % 61 %   0 % 51 % 43 % 35 % 29 % 23 %
  1.00 18 % 27 % 39 % 51 % 65 %   10 % 46 % 39 % 32 % 26 % 20 %
  1.10 21 % 31 % 42 % 55 % 70 %   20 % 42 % 35 % 29 % 23 % 18 %

QUALIFIED PERSON
 

Mr. Scott E. Wilson, CPG, President of Resource Development Associates Inc. and a consultant to the Company, is an Independent “Qualified Person” as defined by NI 43-101 and is acting at the Qualified Person for the Company. He has reviewed and approved the technical information summarized in this news release.

UPCOMING EVENTS

6ix Investor Event

September 21, 2021 @ 11:00am ET / 8:00am PT

Join Us: [LINK]

StockPulse Silver Symposium

September 27-28, 2021

Join Us: REGISTER NOW

ABOUT BUNKER HILL MINING CORP.

Under new Idaho-based leadership, Bunker Hill Mining Corp. intends to sustainably restart and develop the Bunker Hill Mine as the first step in consolidating a portfolio of North American precious-metal assets with a focus on silver. Information about the Company is available on its website, www.bunkerhillmining.com, or within the SEDAR and EDGAR databases.

For additional information contact: ir@bunkerhillmining.com

CAUTIONARY STATEMENTS

Certain statements in this news release are forward-looking and involve a number of risks and uncertainties. Such forward-looking statements are within the meaning of that term in Section 27A of the Securities Act of 1933, as amended, and Section 21E of the Securities Exchange Act of 1934, as amended, as well as within the meaning of the phrase ‘forward-looking information’ in the Canadian Securities Administrators’ National Instrument 51-102 – Continuous Disclosure Obligations. Forward-looking statements are not comprised of historical facts. Forward-looking statements include estimates and statements that describe the Company’s future plans, objectives or goals, including words to the effect that the Company or management expects a stated condition or result to occur. Forward-looking statements may be identified by terminology such as “may”, “will”, “could”, “should”, “expect”, “plan”, “anticipate”, “believe”, “intend”, “estimate”, “projects”, “predict”, “potential”, “continue” or other similar expressions concerning matters that are not historical facts. Since forward-looking statements are based on assumptions and address future events and conditions, by their very nature they involve inherent risks and uncertainties. Although these statements are based on information currently available to the Company, the Company provides no assurance that actual results will meet management’s expectations. Risks, uncertainties and other factors involved with forward-looking information could cause actual events, results, performance, prospects and opportunities to differ materially from those expressed or implied by such forward-looking information. The key risks and uncertainties include, but are not limited to: local and global political and economic conditions; governmental and regulatory requirements and actions by governmental authorities, including changes in government policy, government ownership requirements, changes in environmental, tax and other laws or regulations and the interpretation thereof; developments with respect to the coronavirus disease 2019 (“COVID-19”) pandemic, including the duration, severity and scope of the pandemic and potential impacts on mining operations; and other risk factors detailed from time to time in the Company’s reports filed on SEDAR and EDGAR. Forward-looking information and statements in this news release include statements concerning, among other things: the potential of the Bunker Hill Mine to be re-started rapidly as a low-cost, long life, sustainable operation based on the results of the PEA; the PEA representing robust financial returns; the potential of the restart plan to create jobs, ensure long-term environmental-management partnerships, and drive the long-term development of the Bunker Hill Mine’s resources; the timing for filing the PEA technical report; the timing, amount and duration of future production; future cash costs and AISC; commodity prices; the estimated capital and operating costs; the Company’s ability to discover new mineralization; the Company’s ability to self-fund high-grade silver exploration efforts to further increase cash flow margins; the timing for the Company’s progression of further technical studies and project finance discussions; potential sustainability impacts based on the results of the PEA, including the Bunker Hill Mine’s development and operations generating new jobs in Shoshone County, with such job creation having the potential to reduce unemployment in the county, procurement by the Bunker Hill Mine injecting additional funds into the local economy annually, and the Bunker Hill Mine achieving carbon neutrality in year one of operations and maintaining a minimal environmental footprint for the LOM; the potential for a reduction in the production of acid rock drainage; the potential for a reduction in the challenge and cost of water management; LOM capital improvements; metal recoveries; the Company’s plans to reinvest a portion of its pre-tax cash flows on its high-grade silver program; the Company’s goal to significantly increase free cash flow in the earlier years of the PEA based on its ongoing high-grade silver exploration program; the estimates of free cash flow, net present value and economic returns from the Bunker Hill Mine based on the results of the PEA; opportunities to increase the economics of the Bunker Hill Mine; our plans and expectations for the Bunker Hill Mine; and the Company’s intentions regarding its objectives, goals or future plans and statements. Factors that could cause actual results to differ materially from such forward-looking information include, but are not limited to: the ability to predict and counteract the effects of COVID-19 on the business of the Company, including but not limited to the effects of COVID19 on the price of commodities, capital market conditions, restriction on labor and international travel and supply chains; failure to identify mineral resources; failure to convert estimated mineral resources to reserves; the inability to complete a feasibility study which recommends a production decision; the preliminary nature of metallurgical test results; delays in obtaining or failures to obtain required governmental, environmental or other project approvals; political risks; changes in equity markets; uncertainties relating to the availability and costs of financing needed in the future; the inability of the Company to budget and manage its liquidity in light of the failure to obtain additional financing, including the ability of the Company to complete the payments pursuant to the terms of the agreement to acquire the Bunker Hill Mine Complex; inflation; changes in exchange rates; fluctuations in commodity prices; delays in the development of projects; capital, operating and reclamation costs varying significantly from estimates and the other risks involved in the mineral exploration and development industry; and those risks set out in the Company’s public documents filed on SEDAR and EDGAR. Although the Company believes that the assumptions and factors used in preparing the forward-looking information in this news release are reasonable, undue reliance should not be placed on such information, which only applies as of the date of this news release, and no assurance can be given that such events will occur in the disclosed time frames or at all. The Company disclaims any intention or obligation to update or revise any forward-looking information, whether as a result of new information, future events or otherwise, other than as required by law. No stock exchange, securities commission or other regulatory authority has approved or disapproved the information contained herein.

Cautionary Note to United States Investors

This press release has been prepared in accordance with the requirements of the securities laws in effect in Canada, which differ from the requirements of U.S. securities laws. Unless otherwise indicated, all resource and reserve estimates included in this press release have been disclosed in accordance with NI 43-101 and the Canadian Institute of Mining, Metallurgy, and Petroleum Definition Standards on Mineral Resources and Mineral Reserves. NI 43-101 is a rule developed by the Canadian Securities Administrators which establishes standards for all public disclosure an issuer makes of scientific and technical information concerning mineral projects. Canadian disclosure standards, including NI 43-101, differ significantly from the requirements of the United States Securities and Exchange Commission (“SEC”), and resource and reserve information contained in this press release may not be comparable to similar information disclosed by U.S. companies. In particular, and without limiting the generality of the foregoing, the term “resource” does not equate to the term “reserves”. Under U.S. standards, mineralization may not be classified as a “reserve” unless the determination has been made that the mineralization could be economically and legally produced or extracted at the time the reserve determination is made. The SEC’s disclosure standards normally do not permit the inclusion of information concerning “measured mineral resources”, “indicated mineral resources” or “inferred mineral resources” or other descriptions of the amount of mineralization in mineral deposits that do not constitute “reserves” by U.S. standards in documents filed with the SEC. Investors are cautioned not to assume that any part or all of mineral deposits in these categories will ever be converted into reserves. U.S. investors should also understand that “inferred mineral resources” have a great amount of uncertainty as to their existence and great uncertainty as to their economic and legal feasibility. It cannot be assumed that all or any part of an “inferred mineral resource” will ever be upgraded to a higher category. Investors are cautioned not to assume that all or any part of an “inferred mineral resource” exists or is economically or legally mineable. Disclosure of “contained ounces” in a resource is permitted disclosure under Canadian regulations; however, the SEC normally only permits issuers to report mineralization that does not constitute “reserves” by SEC standards as in-place tonnage and grade without reference to unit measures. The requirements of NI 43-101 for disclosure of “reserves” are also not the same as those of the SEC, and reserves disclosed by the Company in accordance with NI 43-101 may not qualify as “reserves” under SEC standards. Accordingly, information concerning mineral deposits may not be comparable with information made public by companies that report in accordance with U.S. standards.

Cautionary Note Regarding Non-GAAP Measures

This news release includes certain terms or performance measures commonly used in the mining industry that are not defined under International Financial Reporting Standards (“IFRS”) or U.S. GAAP, including cash costs and AISC per payable pound of zinc sold, EBITDA, pre-tax cash flow and free cash flow. Non-GAAP measures do not have any standardized meaning prescribed under IFRS or U.S. GAAP and, therefore, they may not be comparable to similar measures employed by other companies. The Company believes that, in addition to conventional measures prepared in accordance with IFRS and U.S. GAAP, certain investors use this information to evaluate its performance. The data presented is intended to provide additional information and should not be considered in isolation or as a substitute for measures of performance prepared in accordance with IFRS or U.S. GAAP.

Release – Mining Veteran Tom Obradovich Joins FenixOro Advisory Committee


Mining Veteran Tom Obradovich Joins FenixOro Advisory Committee


TORONTO, Sept. 20, 2021 (GLOBE NEWSWIRE) — FenixOro Gold Corp (CSE:FENX) (OTCQB:FDVXF) (Frankfurt:8FD) is pleased to announce that Tom Obradovich, a notably successful and experienced mining investor and entrepreneur, has joined the Fenix Oro Advisory Committee.

Born and raised into a mining family in Kirkland Lake, OntarioMr. Obradovich is a graduate of the Haileybury School of Mines in Mining Technology and Advanced Field Geophysics. He has a wide range of experience in mining exploration, development and financing. Over a career of thirty-eight years he has enjoyed significant success as a number of projects he has been involved in have gone onto become producing mines acquired by major mining companies.

Tom cofounded Canadian Royalties Inc. which discovered and developed the Raglan South Nickel Belt. He then acquired most of the Matachewan Gold Camp and through a reverse takeover of Young-Davidson Mines, upgraded and doubled the resource. The company was subsequently acquired by Northgate Minerals and the project is currently producing over 200,000 oz of gold per year for Alamos Gold Inc. (TSX:AGI).

He was also one of the founders of Aurelian Resources Inc. which discovered the Fruta Del Norte gold deposit in Ecuador and was subsequently acquired by Kinross Gold (TSX:K) for $1.2 Billion. The project is now producing approximately 400,000 oz of gold per year for Lundin Gold (TSX:LUG).

Mr. Obradovich became President and CEO of Barkerville Gold Mines in January of 2015 and led the management team to turn the company into a debt free mining and exploration vehicle with a market capital in excess of $200 million and $60 million in treasury when he resigned in July 2016. Barkerville was subsequently acquired by Osisko Mining (TSX:OSK). He was also Lead Director of Dalradian Resources, a company that developed a multi-million ounce gold deposit in Northern Ireland and was subsequently sold for $560 million to Orion Mine Finance.

Tom is currently the Chairman of Sable Resources, a pure greenfields exploration company developing the Don Julio Project through a joint venture in San Juan Province, Argentina.

FenixOro CEO John Carlesso commented: “Tom Obradovich is a seasoned and highly respected veteran in the mining industry and we are very fortunate to have his support on the Advisory Committee. As we continue to grow and develop the Abriaqui gold deposit, Tom’s vast knowledge and experience will bring tremendous value to our decision-making process.”

The Company has granted 1,200,000 stock options to advisors and consultants. The options have an exercise price of 32 cents and expire 5 years from the grant date.

About FenixOro Gold Corp.

FenixOro Gold Corp is a Canadian company focused on acquiring and exploring gold projects with world class exploration potential in the most prolific gold producing regions of Colombia. FenixOro’s flagship property, the Abriaqui project, is the closest project to Continental Gold’s Buritica project. It is located 15 km to the west in Antioquia State at the northern end of the Mid-Cauca gold belt, a geological trend which has seen multiple large gold discoveries in the past 10 years including Buritica and Anglo Gold’s Nuevo Chaquiro and La Colosa. As documented in “NI 43-101 Technical Report on the Abriaqui project Antioquia State, Colombia” (December 5, 2019), the geological characteristics of Abriaqui and Buritica are similar. Since the preparation of this report a Phase 1 drilling program has been completed at Abriaqui resulting in a significant discovery of a high grade, “Buritica style” gold deposit. A Phase 2 drilling program has recently commenced.

FenixOro’s VP of Exploration, Stuart Moller, led the discovery team at Buritica for Continental Gold in 2007-2011. At the time of its latest public report, the Buritica Mine contains measured plus indicated resources of 5.32 million ounces of gold (16.02 Mt grading 10.32 g/t) plus a 6.02 million ounce inferred resource (21.87 Mt grading 8.56 g/t) for a total of 11.34 million ounces of gold resources Buritica began formal production in November 2020 and has expected annual average production of 250,000 ounces at an all-in sustaining cost of approximately US$600 per ounce. Resources, cost and production data are taken from Continental Gold’s “NI 43-101 Buritica Mineral Resource 2019-01, Antioquia, Colombia, 18 March, 2019”). Continental Gold was recently the subject of a takeover by Zijin Mining in an all-cash transaction valued at C$1.4 billion.

FenixOro Gold Corp
John Carlesso, CEO
Email: info@FenixOro.com
Website: www.FenixOro.com
Telephone: 1-833-ORO-GOLD

Release – electroCore Announces Peter Cuneo as Board Chairman


electroCore Announces Peter Cuneo as Board Chairman


ROCKAWAY, NJ
Sept. 20, 2021 (GLOBE NEWSWIRE) — 
electroCore, Inc. (Nasdaq: ECOR), a commercial-stage bioelectronic medicine company, today announced that the Board of Directors has appointed  Peter Cuneo as Chairman of the Board of Directors effective 
October 1, 2021Mr. Cuneo was appointed to the Board of Directors in 
April 2020. He succeeds  Mike Atieh, who served as Chairman since 
April 2020 and who will remain on the Board as an independent director and member of the audit committee. 

Over the past 35 years,  Mr. Cuneo has reshaped the operations of seven companies in the global media and consumer products sector and has been identified by 
Business Insider as one of the 10 greatest turnaround CEOs.  Mr. Cuneo’s prior experience includes serving as Chief Executive Officer of 
Marvel Entertainment until its sale to Disney in 2009, President and Chief Executive Officer of 
Remington Products Company until facilitating its sale to private equity investors, President of the 
Security Hardware Group of the 
Black & Decker Corporation, President of 
Bristol-Myers Squibb Pharmaceutical Group in 
Canada, and President of the Clairol Personal Care Division.

Mr. Cuneo currently serves as Non-Executive Chairman of Arrival Group (Nasdaq: ARVL), a global technology company creating electric vehicles, and serves as Chairman and Chief Executive Officer of CIIC Capital Partners II (Nasdaq: CIIGU), which raised approximately 
$287.5 million in it is initial public offering earlier this month.

Mr. Cuneo serves as Chairman of 
BeyondView LLC, a digital technology company. He is the Managing Principal of 
Cuneo & Company, LLC, a private investment and management company that he founded. He currently serves as Chairman emeritus of the Alfred University 
Board of Trustees and on the Board of the 
National Archives Foundation in 
Washington, D.C and holds an MBA from 
Harvard Business School.

“Peter brings a wealth of executive leadership and experience, particularly in successfully executing direct to end-user sales strategies, and we are very fortunate to have a leader of his caliber in the Chairman’s role” said  Dan Goldberger, CEO of electroCore. “We are greatly appreciative of Mr. Atieh’s service as the Chairman of the Board of Directors and it’s important to note that he will continue as an independent member of the Board and member of the audit committee.”

“It has been an honor to serve on electroCore’s Board since April 2020,” said  Mr. Cuneo. “As Board Chairman, I look forward to working with our Board members and management team to realize the company’s plans for the future. We hope to achieve continued progress in expanding the commercial availability of gammaCore and exploring gammaCore’s full potential.”

About electroCore, Inc.
electroCore, Inc. is a commercial stage bioelectronic medicine company dedicated to improving patient outcomes through its non-invasive vagus nerve stimulation therapy platform, initially focused on the treatment of multiple conditions in neurology. The company’s current indications are the preventive treatment of cluster headache and migraine, the acute treatment of migraine and episodic cluster headache, and paroxysmal hemicrania and hemicrania continua in adults.
For more information, visit www.electrocore.com.

About gammaCore
gammaCore™ (nVNS) is the first non-invasive, hand-held medical therapy applied at the neck as an adjunctive therapy to treat migraine and cluster headache through the utilization of a mild electrical stimulation to the vagus nerve that passes through the skin. Designed as a portable, easy-to-use technology, gammaCore can be self-administered by patients, as needed, without the potential side effects associated with commonly prescribed drugs. When placed on a patient’s neck over the vagus nerve, gammaCore stimulates the nerve’s afferent fibers, which may lead to a reduction of pain in patients.

gammaCore (nVNS) is FDA cleared in 
the United States for adjunctive use for the preventive treatment of cluster headache in adult patients, the acute treatment of pain associated with episodic cluster headache in adult patients, the treatment of paroxysmal hemicrania and hemicrania continua in adults, and the acute and preventive treatment of migraine in adolescent (ages 12 and older) and adult patients. gammaCore is CE-marked in the 
European Union for the acute and/or prophylactic treatment of primary headache (Migraine, Cluster Headache, Trigeminal Autonomic Cephalalgias and Hemicrania Continua) and Medication Overuse Headache in adults.
gammaCore is contraindicated for patients if they:

  • Have an active implantable medical device, such as a pacemaker, hearing aid implant, or any implanted electronic device
  • Have a metallic device, such as a stent, bone plate, or bone screw, implanted at or near the neck
  • Are using another device at the same time (e.g., TENS Unit, muscle stimulator) or any portable electronic device (e.g., mobile phone)

Safety and efficacy of gammaCore have not been evaluated in the following patients:

  • Adolescent patients with congenital cardiac issues
  • Patients diagnosed with narrowing of the arteries (carotid atherosclerosis)
  • Patients who have had surgery to cut the vagus nerve in the neck (cervical vagotomy)
  • Pediatric patients (less than 12 years)
  • Pregnant women
  • Patients with clinically significant hypertension, hypotension, bradycardia, or tachycardia


Please refer to the gammaCore Instructions for Use for all of the important warnings and stuff precautions before using or prescribing this product.

Forward-Looking Statements
This press release and other written and oral statements made by representatives of electroCore may contain forward-looking statements within the meaning of the Private Securities Litigation Reform Act of 1995. Such forward-looking statements include, but are not limited to, statements about electroCore’s business prospects and clinical and product development plans; its pipeline or potential markets for its technologies; the timing, outcome and impact of regulatory, clinical and commercial developments; the issuance of US and international patents providing expanded IP coverage; the possibility of future business models and revenue streams from the company’s potential combining of nVNS and smartphone or application-based technologies; the availability and impact of payer coverage, the potential of nVNS generally and gammaCore in particular and other statements that are not historical in nature, particularly those that utilize terminology such as “anticipates,” “will,” “expects,” “believes,” “intends,” other words of similar meaning, derivations of such words and the use of future dates. Actual results could differ from those projected in any forward-looking statements due to numerous factors. Such factors include, among others, the ability to raise the additional funding needed to continue to pursue electroCore’s business and product development plans, the inherent uncertainties associated with developing new products or technologies, the ability to commercialize gammaCore™, the potential impact and effects of COVID-19 on the business of electroCore, electroCore’s results of operations and financial performance, and any measures electroCore has and may take in response to COVID-19 and any expectations electroCore may have with respect thereto, competition in the industry in which electroCore operates and overall market conditions. Any forward-looking statements are made as of the date of this press release, and electroCore assumes no obligation to update the forward-looking statements or to update the reasons why actual results could differ from those projected in the forward-looking statements, except as required by law. Investors should consult all of the information set forth herein and should also refer to the risk factor disclosure set forth in the reports and other documents electroCore files with the 
SEC available at www.sec.gov.

Investors:
Rich CockrellCG Capital
404-736-3838
ecor@cg.capital

or

Media Contact:
Jackie Dorsky
electroCore
908-313-6331
Jackie.dorsky@electrocore.com

Release – Lineage to Present at the 2021 Cantor Virtual Global Healthcare Conference on September 27 2021


Lineage to Present at the 2021 Cantor Virtual Global Healthcare Conference on September 27, 2021


CARLSBAD, Calif., September 20, 2021–(BUSINESS WIRE)–Lineage Cell Therapeutics, Inc. (NYSE American and TASE: LCTX), a clinical-stage biotechnology company developing allogeneic cell therapies for unmet medical needs, today announced that Brian M. Culley, the Company’s Chief Executive Officer, will be presenting at the 2021 Cantor Fitzgerald Virtual Global Healthcare Conference in a fireside chat hosted by Kristen Kluska, Director, Equity Research on September 27th, 2021 at 4pm ET / 1pm PT.

Interested parties can register to view both the on-demand and live industry presentations on the Events and Presentations section of Lineage’s website. Additional videos are available on the Media page of the Lineage website.

About Lineage Cell Therapeutics, Inc.

Lineage Cell Therapeutics is a clinical-stage biotechnology company developing novel cell therapies for unmet medical needs. Lineage’s programs are based on its robust proprietary cell-based therapy platform and associated in-house development and manufacturing capabilities. With this platform Lineage develops and manufactures specialized, terminally differentiated human cells from its pluripotent and progenitor cell starting materials. These differentiated cells are developed to either replace or support cells that are dysfunctional or absent due to degenerative disease or traumatic injury or administered as a means of helping the body mount an effective immune response to cancer. Lineage’s clinical programs are in markets with billion dollar opportunities and include three allogeneic (“off-the-shelf”) product candidates: (i) OpRegen®, a retinal pigment epithelium transplant therapy in Phase 1/2a development for the treatment of dry age-related macular degeneration, a leading cause of blindness in the developed world; (ii) OPC1, an oligodendrocyte progenitor cell therapy in Phase 1/2a development for the treatment of acute spinal cord injuries; and (iii) VAC2, an allogeneic dendritic cell therapy produced from Lineage’s VAC technology platform for immuno-oncology and infectious disease, currently in Phase 1 clinical development for the treatment of non-small cell lung cancer. For more information, please visit www.lineagecell.com or follow the Company on Twitter @LineageCell.

Contacts

Lineage Cell Therapeutics, Inc. IR
Ioana C. Hone
(ir@lineagecell.com)
(442) 287-8963

Solebury Trout IR
Gitanjali Jain Ogawa
(Gogawa@soleburytrout.com)
(646) 378-2949

Russo Partners – Media Relations
Nic Johnson or David Schull
Nic.johnson@russopartnersllc.com
David.schull@russopartnersllc.com
(212) 845-4242

Lineage to Present at the 2021 Cantor Virtual Global Healthcare Conference on September 27, 2021


Lineage to Present at the 2021 Cantor Virtual Global Healthcare Conference on September 27, 2021


CARLSBAD, Calif., September 20, 2021–(BUSINESS WIRE)–Lineage Cell Therapeutics, Inc. (NYSE American and TASE: LCTX), a clinical-stage biotechnology company developing allogeneic cell therapies for unmet medical needs, today announced that Brian M. Culley, the Company’s Chief Executive Officer, will be presenting at the 2021 Cantor Fitzgerald Virtual Global Healthcare Conference in a fireside chat hosted by Kristen Kluska, Director, Equity Research on September 27th, 2021 at 4pm ET / 1pm PT.

Interested parties can register to view both the on-demand and live industry presentations on the Events and Presentations section of Lineage’s website. Additional videos are available on the Media page of the Lineage website.

About Lineage Cell Therapeutics, Inc.

Lineage Cell Therapeutics is a clinical-stage biotechnology company developing novel cell therapies for unmet medical needs. Lineage’s programs are based on its robust proprietary cell-based therapy platform and associated in-house development and manufacturing capabilities. With this platform Lineage develops and manufactures specialized, terminally differentiated human cells from its pluripotent and progenitor cell starting materials. These differentiated cells are developed to either replace or support cells that are dysfunctional or absent due to degenerative disease or traumatic injury or administered as a means of helping the body mount an effective immune response to cancer. Lineage’s clinical programs are in markets with billion dollar opportunities and include three allogeneic (“off-the-shelf”) product candidates: (i) OpRegen®, a retinal pigment epithelium transplant therapy in Phase 1/2a development for the treatment of dry age-related macular degeneration, a leading cause of blindness in the developed world; (ii) OPC1, an oligodendrocyte progenitor cell therapy in Phase 1/2a development for the treatment of acute spinal cord injuries; and (iii) VAC2, an allogeneic dendritic cell therapy produced from Lineage’s VAC technology platform for immuno-oncology and infectious disease, currently in Phase 1 clinical development for the treatment of non-small cell lung cancer. For more information, please visit www.lineagecell.com or follow the Company on Twitter @LineageCell.

Contacts

Lineage Cell Therapeutics, Inc. IR
Ioana C. Hone
(ir@lineagecell.com)
(442) 287-8963

Solebury Trout IR
Gitanjali Jain Ogawa
(Gogawa@soleburytrout.com)
(646) 378-2949

Russo Partners – Media Relations
Nic Johnson or David Schull
Nic.johnson@russopartnersllc.com
David.schull@russopartnersllc.com
(212) 845-4242

TAAL Distributed Information Technologies (TAALF) – Preliminary 3Q21 Revenue well In Excess of Estimate

Friday, September 17, 2021

TAAL Distributed Information Technologies (TAALF)
Preliminary 3Q21 Revenue well In Excess of Estimate

Taal Distributed Information Technologies Inc delivers value-added blockchain services, providing professional-grade, highly scalable blockchain infrastructure and transactional platforms to support businesses building solutions and applications upon the Bitcoin SV platform, and developing, operating, and managing distributed computing systems for enterprise users.

Joe Gomes, Senior Research Analyst, Noble Capital Markets, Inc.

Refer to the full report for the price target, fundamental analysis, and rating.

    Preliminary 3Q21 Revenue. Yesterday, TAAL Distributed Information Technologies announced preliminary 3Q21 revenue guidance of $11.5 million to $12 million. The preliminary guidance represents an approximate 70% sequential increase from $6.7 million in 2Q21. The guidance is significantly above our projected 3Q21 revenue estimate of $8.0 million and exceeds our 4Q21 revenue projection of $11.0 million. We will update our model once the Company releases full 3Q21 operating results (which was in November last year).

    Outperformance Drivers.  The revenue increase was driven by strong transaction processing performance and capacity increases. More transactions and larger volumes benefited the quarter. Significantly, transaction fees exceeded block subsidy rewards on several blocks on the BSV network during August, validating the Company’s thesis of building the transaction processing and indexing infrastructure …


This Company Sponsored Research is provided by Noble Capital Markets, Inc., a FINRA and S.E.C. registered broker-dealer (B/D).

*Analyst certification and important disclosures included in the full report. NOTE: investment decisions should not be based upon the content of this research summary.  Proper due diligence is required before making any investment decision. 

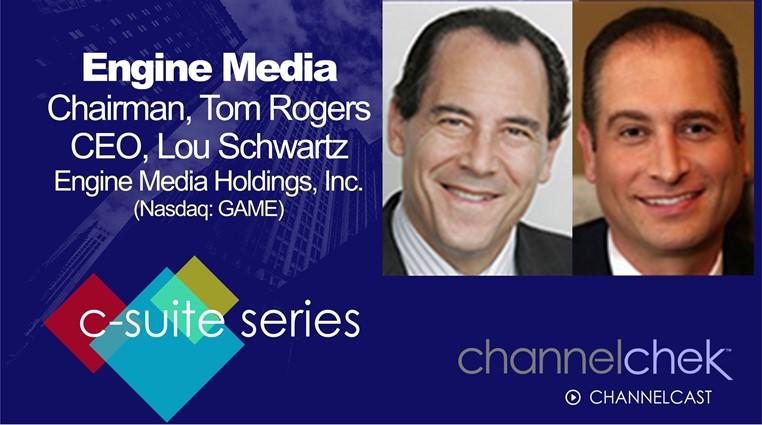
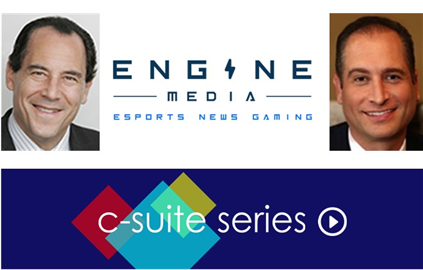
C-Suite Interview with Engine Media (GAME) Executive Chairman Tom Rogers & CEO Lou Schwartz


Noble Capital Markets Senior Research Analyst Michael Kupinski sits down with Engine Media Executive Chairman Tom Rogers and CEO Lou Schwartz for this exclusive interview.

Research, News, and Advanced Market Data on GAME


View all C-Suite Interviews

About Engine Media Holdings, Inc.

Engine Media Holdings Inc. is traded publicly under the ticker symbol (NASDAQ: GAME) (TSX-V: GAME). The organization is focused on developing premium consumer experiences and unparalleled technology and content solutions for partners in the esports, news and gaming industry. The company’s subsidiaries include Stream Hatchet; the global leader in gaming video distribution analytics; Eden Games , a premium video game developer and publisher with numerous console and mobile gaming franchises; WinView Games, an industry innovator in audience second screen play-along gaming during live events; UMG, an end-to-end competitive esports platform enabling the professional and amateur esports community with tournaments, matches and award nominating content; and Frankly Media, a digital publishing platform empowering broadcasters to create, distribute and monetize content across all channels. Engine Media generates revenue through a combination of direct-to-consumer and subscription fees; streaming technology and data SaaS-based offerings; programmatic advertising and sponsorships. To date, the combined companies’ clients have included more than 1,200 television, print and radio brands, dozens of gaming and technology companies, and have connectivity into hundreds of millions of homes around the world through their content, distribution and technology services.

Eagle Bulk Shipping Inc. Takes Delivery of M/V Antwerp Eagle


Eagle Bulk Shipping Inc. Takes Delivery of M/V Antwerp Eagle


STAMFORD, Conn.
Sept. 17, 2021 (GLOBE NEWSWIRE) — 
Eagle Bulk Shipping Inc. (NASDAQ: EGLE) (“Eagle Bulk”, “Eagle” or the “Company”), one of the world’s largest owner-operators within the Supramax / Ultramax drybulk segment, today announced that it has taken delivery of its previously announced vessel acquisition, the M/V Antwerp Eagle.

The ship, which was acquired this past May, is a 2015-built, high specification scrubber-fitted SDARI-64 Ultramax vessel built at 
Jiangsu Hantong Ship Heavy Industry Co.

Proforma for the one pending vessel acquisition, the Company’s fleet totals 53 ships with an average age of 8.8 years.

About Eagle Bulk Shipping Inc.

Eagle Bulk Shipping Inc. (“Eagle” or the “Company”) is a US-based fully integrated shipowner-operator providing global transportation solutions to a diverse group of customers including miners, producers, traders, and end users. Headquartered in 
Stamford, Connecticut, with offices in 
Singapore and 
Copenhagen, Eagle focuses exclusively on the versatile mid-size drybulk vessel segment and owns one of the largest fleets of Supramax / Ultramax vessels in the world. The Company performs all management services in-house (including: strategic, commercial, operational, technical, and administrative) and employs an active management approach to fleet trading with the objective of optimizing revenue performance and maximizing earnings on a risk-managed basis. For further information, please visit our website: www.eagleships.com.

Company Contact
Frank De Costanzo
Chief Financial Officer

Eagle Bulk Shipping, Inc.
Tel. +1 203-276-8100
Email: investor@eagleships.com

Media Contact

Rose & Company
Tel. +1 212-359-2228

Source: 
Eagle Bulk Shipping Inc.

Esports Game Makers Many Profit Centers


Image: Overwatch (Blizzard Entertainment)

Understanding Esports’ Many Income Streams


Gaming is the largest and fastest-growing entertainment vertical in the world. Esports / e-sports / eSports / esports is a high-growth sector of the industry with more ways to generate income than there are alternatives to spell its name. What are they? As with other media outlets, some revenue streams are “straight-line” obvious, like subscriptions. Others, like the value of an audience’s viewing habits, are not as direct. Although each company is different, revenue streams are often from game sales, advertising, audience subscriptions, data and analytics, licensing, and media rights.

There is a great deal of overlap in categorizing these revenue streams. As you’ll discover shortly, game sales may be made through ad sales that offset the product cost, and that data analysis may have a part in all revenue success. A well-run esports/gaming company integrates them all to maximizes all that it has at its disposal.

Data & Analytics

As with other media outlets, knowing who your audience is allows a better marketing effort to bring in advertising dollars. Esports entertainment businesses all do this on one level or another. The more data collected and categorized, the better they’re able to discern viewing habits, categorize popularity changes, determine who tomorrow’s “influencers” will be, maximize partnership opportunities, and capture trends early. 

The data itself also has value and can be sold to others that mine it for their own purposes, this includes for discovery of when and how to reach highly refined marketing demographics.

Advertisement Sales

As mentioned above, advertisement sales is a staple revenue stream for companies that provide online games. With audience insights related to sentiment, viewership, demographics, and traffic, esports companies are in an enviable position in that their advertising sales efforts and what the advertiser can expect are more clearly defined than trying to reach the consumer group through other outlets.

Game Sales

It wasn’t long ago that direct game sales to customers were the primary means for any game maker to generate revenue. This still exists, although the trip to GameStop (GME) is no longer necessary as you can go to a website like Steam and buy and download games. The game maker then gives the website a cut and keeps what might be 80% or more of the sale price.

Another variation of “selling” a game is when it’s being subsidized by an ad the purchaser will encounter after the download. This new but common revenue source works like this: The consumer downloads a game from a store (with or without cost to the consumer), the consumer then encounters ads as a result of the download. This concept has become common throughout the online world, specific to gaming; what companies are now doing is developing games whereby watching an ad they collect tools to help score more points playing the game.  When implemented correctly, this can be a lucrative part of how a game maker adds to their bottom line.

Ticket Sales

As part of the business of esports, as with other spectator sports, there are tickets sales for live audience participants and entry or subscription fees for viewing online. Stadiums with the capacity to seat 50 to 90 thousand have become filled in the past. As these sports events are of interest globally, online audiences approaching 100 million at world championships is normal. Although there are many businesses involved in organizing, promoting, broadcasting, merchandising, and overall production, the game makers are part of the action and perhaps receive small increments from the value of each spectator. But, with near 100 million spectators to some events, this can add up.

Merchandising

Although much of the merchandising in esports is for teams and leagues, game makers also can benefit from purchasable skins. The term “skin” refers to the way your in-game character looks. Some games have added purchasable skins to make characters look like members of professional esports teams. These in-game sales can add up. In 2017 in-game purchases accounted for more than half of Activision-Blizzard’s revenue, adding up to about $4 billion.

Games like Overwatch, League of Legends, Halo 5, Gears
of War 4, and Call of Duty: Modern Warfare
all have this feature allowing people to purchase character and weapon skins. These in-game purchases not only provide a revenue source for game developers, but esports teams themselves can receive a cut of each purchase. This can even help the decision as to which games the teams may become involved competing in. Additionally, if fans want to support a specific streamer, they can use the streamer’s content creator code while purchasing the in-game skins. This process provides that streamer a small cut of the purchase.

Vertical
Integration

As the esports segment grows, those companies most horizontally and vertically integrated have the most control over the synergies of the various revenue streams. Well-run esports companies often have multiple gaming businesses, while also able to capitalize on being a media entity with all of the insights and marketing solutions that can provide.

In a just-released C-Suite interview, the Executive Chairman and the CEO of Engine Media (GAME) were interviewed by the Senior Media Equity Analyst at Noble Capital Markets, Mike Kupinski.  Engine Media generates revenue through a combination of direct-to-consumer and subscription fees; streaming technology and data SaaS-based offerings; programmatic advertising, and sponsorships. In response to a question, Executive Chairman Tom Rogers summed up various parts of the industry well as he discussed his own company. Mr. Rogers talked about the many company pieces, which in the case of GAME are in-part data, analytics, advertising, marketing, and IP to support player experiences. It also sells some of the intel as a service, and profits from the easier to understand growth of the gaming business.

The interview provides a clear picture of the potential for this company and others involved in esports.

What Does the Future Hold?

Think of the changes that major league baseball has gone through in your lifetime, now soccer – unlike traditional sports, esports games, outlets, tools and support will need to constantly evolve. Consumers, whether they are gamers or spectators, are the main product, paying attention to their needs is critical. Also, expanding the sport to appeal to as many different demographics as possible will increase the size of the revenue pie from which companies will try to score a larger slice.


Suggested Content:


C-Suite Interview / Engine Media Holdings (September 2021)


Advertising Results are Becoming a Guessing Game


Ad Tech – Back in the Saddle, Riding High


What A Tolerant Fed Implies For Media Stocks


Sources:

https://enginemediainc.com/#about

https://www.youtube.com/watch?v=oCiKVXQXkKA

https://www.aikenhouse.com/post/how-do-esports-organizations-make-money

https://newzoo.com/insights/articles/newzoo-games-market-numbers-revenues-and-audience-2020-2023/

http://thesportdigest.com/2019/11/esports-or-esports-or-e-sports-or-esports-words-matter-for-more-reasons-than-you-think/#:~:text=The%20AP%20indicated%20for%20the,the%20beginning%20of%20a%20sentence

https://www.insiderintelligence.com/insights/esports-ecosystem-market-report/

https://www.pwc.com/gx/en/industries/technology/publications/monetising-esports.html

https://www.videogames.org.au/skin-betting/


Stay up to date. Follow us:


Cathie Wood Clears Way to Invest in Bitcoin ETFs from Canada


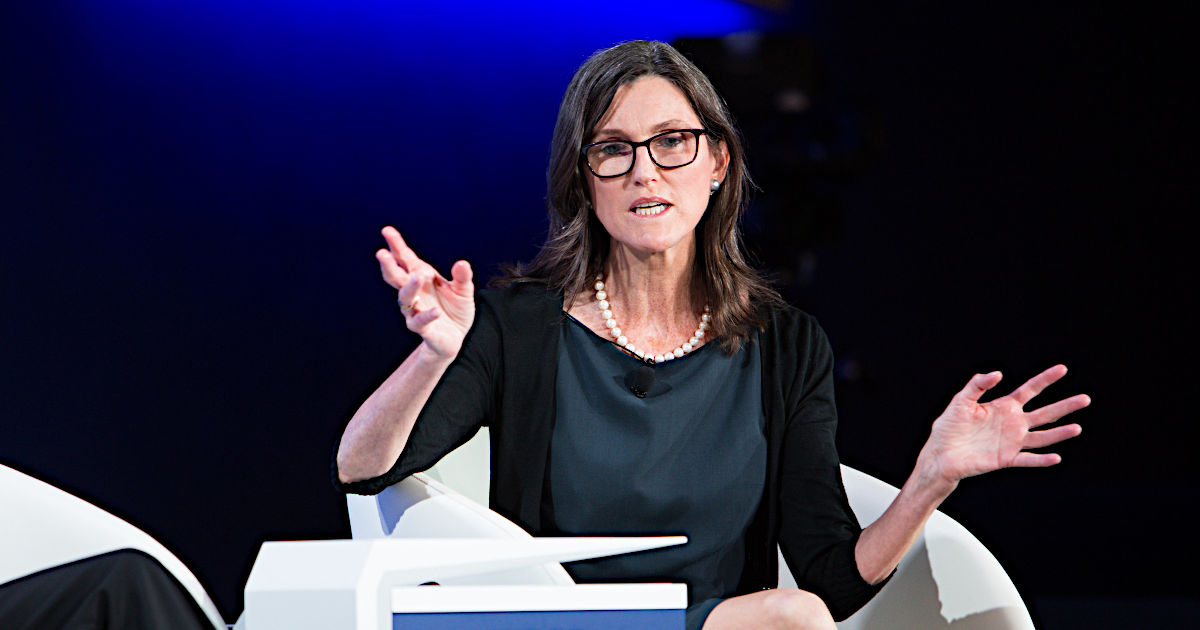
Canadian Bitcoin ETFs May Be Cathie Wood’s Solution


For every problem, there is a solution, and it looks like Cathie Wood may have finally found her answer. Here’s the problem. Wood, who is the founder of ARK Invest and the high-profile Chief Investment Officer of the company that has as its tagline: We Invest Solely In Disruptive
Innovation
 would like to more readily be able to gain exposure to Bitcoin through ETFs. The problem is, the U.S. Securities and Exchange Commission has not approved Cryptocurrency ETFs, so there are none in existence among the investment companies overseen by the SEC.


ARK BTC.X History

Over the past eight years, the SEC has rejected or delayed more than a dozen Bitcoin Exchange Traded Fund applications. The reasons given are concerns over sharp volatilities and potential risks of market manipulation. Back in June of this year, along with the company Swiss-based 21Shares, ARK Invest filed to create a Bitcoin ETF of their own to be called ARK 21Shares Bitcoin ETF. The joint filing is one of the delayed decisions.

The SEC has been dragging its feet on any Cryptocurrency ETFs and has not approved any. SEC Chair Gary Gensler says they’re studying all the ramifications and how the underlying coins or futures contracts may provide higher and lower levels of investor protection. Nothing sounds imminent in terms of a decision by the SEC, and it doesn’t even sound certain that there will be an ETF approved that invests directly in Bitcoin or other cryptocurrencies.

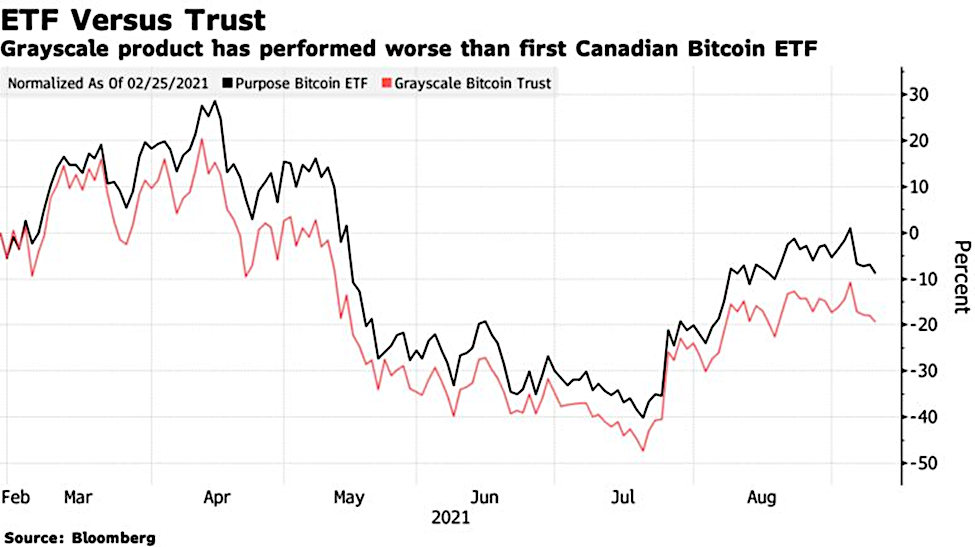
One of Wood’s funds, The ARK Next Generation Internet ETF,  already holds a significant amount of Bitcoin through a closed-end Grayscale Bitcoin Trust (GBTC). This trust owns coins that are held at a third-party custodian. The Grayscale Trust doesn’t track Bitcoin’s exchange rate tick-for-tick. Initially, the Grayscale Trust, which currently has $30 billion in assets, outperformed actual bitcoin and traded at as much as a 20% premium. This is because it became the preferred alternative as an asset that can be held more easily in many investment accounts, such as the ARK Next Generation Internet ETF. 

Wood’s ETF currently has 5.5% of its assets——worth about $314 million——in the Grayscale fund, which is its second-largest holding only behind Tesla (TSLA).


Current
Solution

Canada and Europe both moved ahead, allowing fund managers to offer Bitcoin and Ethereum in an ETF wrapper. In February, Grayscale began underperforming Bitcoin and underperforming the first Canadian Bitcoin ETF.


Wood’s asset-management company, ARK Invest, revised the prospectus of the $5.7 billion ARK Next Generation Internet ETF so the fund can hold cryptocurrencies via Canadian ETFs. Given all the uncertainties, it might be wise to diversify crypto holdings through the Canadian ETFs. Others have made similar moves. Recently, the $1.3 billion Amplify Transformational Data Sharing ETF (BLOK), which is actively managed and mainly invests in blockchain-related businesses, also bought shares in three Canadian Bitcoin ETFs.

Take-Away

The diversification Bitcoin offers relative to other “disruptive innovations” is high. The volatility also presents a unique opportunity. As U.S. fund managers like those at ARK Invest seek to provide an above-average return for their investors, they will find workarounds to gain the exposure they believe is best. These workarounds are at times more costly than a direct holding or one that is domestic.

In the case of ETFs, the ease with which they can be bought and sold and if ever approved in the U.S., used in fund management or qualified retirement accounts, may cause them to trade at a premium to the assets they hold. We won’t know this for sure if the SEC continues to hold off on making a decision.


Suggested Reading:


Will the SEC Allow ETFs to Own Cryptocurrency?


Coinbase Receives an Enforcement Letter from the SEC


What’s in the Surprise Cryptocurrency Bill


Elon Musk, Jack Dorsey, and Cathie Wood Drop Bombshells at Bitcoin Conference


Sources:

https://www.sec.gov/Archives/edgar/data/0001869699/000119312521201955/d165184ds1.htm

https://www.bloomberg.com/news/articles/2021-09-13/cathie-wood-s-ark-grants-itself-power-to-buy-canada-bitcoin-etfs

https://www.barrons.com/articles/cathie-woods-ark-invest-eyes-canadian-crypto-etfs-51631569128?mod=hp_LEAD_1_B_1


Stay up to date. Follow us:


Release – Eagle Bulk Shipping Inc. Takes Delivery of MV Antwerp Eagle


Eagle Bulk Shipping Inc. Takes Delivery of M/V Antwerp Eagle


STAMFORD, Conn.
Sept. 17, 2021 (GLOBE NEWSWIRE) — 
Eagle Bulk Shipping Inc. (NASDAQ: EGLE) (“Eagle Bulk”, “Eagle” or the “Company”), one of the world’s largest owner-operators within the Supramax / Ultramax drybulk segment, today announced that it has taken delivery of its previously announced vessel acquisition, the M/V Antwerp Eagle.

The ship, which was acquired this past May, is a 2015-built, high specification scrubber-fitted SDARI-64 Ultramax vessel built at 
Jiangsu Hantong Ship Heavy Industry Co.

Proforma for the one pending vessel acquisition, the Company’s fleet totals 53 ships with an average age of 8.8 years.

About Eagle Bulk Shipping Inc.

Eagle Bulk Shipping Inc. (“Eagle” or the “Company”) is a US-based fully integrated shipowner-operator providing global transportation solutions to a diverse group of customers including miners, producers, traders, and end users. Headquartered in 
Stamford, Connecticut, with offices in 
Singapore and 
Copenhagen, Eagle focuses exclusively on the versatile mid-size drybulk vessel segment and owns one of the largest fleets of Supramax / Ultramax vessels in the world. The Company performs all management services in-house (including: strategic, commercial, operational, technical, and administrative) and employs an active management approach to fleet trading with the objective of optimizing revenue performance and maximizing earnings on a risk-managed basis. For further information, please visit our website: www.eagleships.com.

Company Contact
Frank De Costanzo
Chief Financial Officer

Eagle Bulk Shipping, Inc.
Tel. +1 203-276-8100
Email: investor@eagleships.com

Media Contact

Rose & Company
Tel. +1 212-359-2228

Source: 
Eagle Bulk Shipping Inc.

Release – CoreCivic Provides Update on U.S. Marshals Service Contract for the West Tennessee Detention Facility


CoreCivic Provides Update on U.S. Marshals Service Contract for the West Tennessee Detention Facility


BRENTWOOD, Tenn., Sept. 17, 2021 (GLOBE NEWSWIRE) — As has been previously disclosed, CoreCivic, Inc. (NYSE: CXW) (the Company) has a direct contract with the U.S. Marshals Service (USMS) at the 600-bed West Tennessee Detention Facility in Mason, Tennessee that is scheduled to expire on September 30, 2021. The Company recently was provided with a definitive inmate population ramp down plan from the USMS indicating that all inmates will be transferred out of the facility by September 30, 2021. As a result, the Company does not expect the USMS to exercise its renewal option under the existing contract.

The Company has been actively marketing the facility to other government agencies, and in August 2021, the Company submitted a formal response to a government agency’s request for proposal to utilize the West Tennessee Detention Facility. However, the Company can provide no assurances that it will be successful in entering into a new contract with the government agency.

The revenue generated from the USMS at the West Tennessee Detention Facility for the year ended December 31, 2020, and six months ended June 30, 2021, was $18.4 million and $10.2 million, respectively. For the year ended December 31, 2020, the facility incurred a $1.4 million net operating loss, and for the six months ended June 30, 2021, the facility generated net operating income of $0.8 million.

About CoreCivic

CoreCivic is a diversified government solutions company with the scale and experience needed to solve tough government challenges in flexible, cost-effective ways. CoreCivic provides a broad range of solutions to government partners that serve the public good through corrections and detention management, a network of residential reentry centers to help address America’s recidivism crisis, and government real estate solutions. CoreCivic is the nation’s largest owner of partnership correctional, detention and residential reentry facilities, and believes it is the largest private owner of real estate used by government agencies in the U.S. CoreCivic has been a flexible and dependable partner for government for more than 35 years. CoreCivic’s employees are driven by a deep sense of service, high standards of professionalism and a responsibility to help government better the public good.

Forward-Looking Statements

This press release contains statements as to our beliefs and expectations of the outcome of future events that are “forward-looking” statements within the meaning of Section 21E of the Securities Exchange Act of 1934, as amended, and the Private Securities Litigation Reform Act of 1995. These forward-looking statements are subject to risks and uncertainties that could cause actual results to differ materially from the statements made. These include, but are not limited to, the risks and uncertainties associated with: (i) changes in government policy (including the United States Department of Justice, or DOJ, not renewing contracts as a result of President Biden’s Executive Order on Reforming Our Incarceration System to Eliminate the Use of Privately Operated Criminal Detention Facilities) (two agencies of the DOJ, the United States Federal Bureau of Prisons and the United States Marshals Service, utilize our services), legislation and regulations that affect utilization of the private sector for corrections, detention, and residential reentry services, in general, or our business, in particular, including, but not limited to, the continued utilization of our correctional and detention facilities by the federal government, and the impact of any changes to immigration reform and sentencing laws (we do not, under longstanding policy, lobby for or against policies or legislation that would determine the basis for, or duration of, an individual’s incarceration or detention); (ii) our ability to obtain and maintain correctional, detention, and residential reentry facility management contracts because of reasons including, but not limited to, sufficient governmental appropriations, contract compliance, negative publicity and effects of inmate disturbances; (iii) changes in the privatization of the corrections and detention industry, the acceptance of our services, the timing of the opening of new facilities and the commencement of new management contracts (including the extent and pace at which new contracts are utilized), as well as our ability to utilize available beds; (iv) general economic and market conditions, including, but not limited to, the impact governmental budgets can have on our contract renewals and renegotiations, per diem rates, and occupancy; (v) fluctuations in our operating results because of, among other things, changes in occupancy levels, competition, contract renegotiations or terminations, increases in costs of operations, fluctuations in interest rates and risks of operations; (vi) the duration of the federal government’s denial of entry at the United States southern border to asylum-seekers and anyone crossing the southern border without proper documentation or authority in an effort to contain the spread of COVID-19; (vii) government and staff responses to staff or residents testing positive for COVID-19 within public and private correctional, detention and reentry facilities, including the facilities we operate; (viii) restrictions associated with COVID-19 that disrupt the criminal justice system, along with government policies on prosecutions and newly ordered legal restrictions that affect the number of people placed in correctional, detention, and reentry facilities, including those associated with a resurgence of COVID-19; (ix) whether revoking our real estate investment trust, or REIT, election, effective January 1, 2021, and our revised capital allocation strategy can be implemented in a cost effective manner that provides the expected benefits, including facilitating our planned debt reduction initiative and planned return of capital to shareholders; (x) our ability to successfully identify and consummate future development and acquisition opportunities and our ability to successfully integrate the operations of our completed acquisitions and realize projected returns resulting therefrom; (xi) our ability, following our revocation of our REIT election, to identify and initiate service opportunities that were unavailable under the REIT structure; (xii) our ability to have met and maintained qualification for taxation as a REIT for the years we elected REIT status; and (xiii) the availability of debt and equity financing on terms that are favorable to us, or at all. Other factors that could cause operating and financial results to differ are described in the filings we make from time to time with the Securities and Exchange Commission.

CoreCivic takes no responsibility for updating the information contained in this press release following the date hereof to reflect events or circumstances occurring after the date hereof or the occurrence of unanticipated events or for any changes or modifications made to this press release or the information contained herein by any third-parties, including, but not limited to, any wire or internet services.

Contact:    Investors: Cameron Hopewell – Managing Director, Investor Relations – (615) 263-3024
Media: Steve Owen – Vice President, Communications – (615) 263-3107