Release – Comtech Telecommunications Corp. Awarded $2.1 Million of Funding


Comtech Telecommunications Corp. Awarded $2.1 Million of Funding for EEE Parts Management, Procurement and Engineering Services


MELVILLE, N.Y.–(BUSINESS WIRE)–Aug. 26, 2021– 
August 26, 2021— 
Comtech Telecommunications Corp. (NASDAQ: CMTL), a leading global provider of next-generation 911 emergency systems and secure wireless communications technologies, announced today, that during its fourth quarter of fiscal year 2021, it was awarded 
$2.1 million of additional funding from a major 
U.S. prime contractor in support of NASA’s Space Launch System (“SLS”) 
Control System Electronics. The contract consolidates requirements for high reliability electrical, electronic and electromechanical (“EEE”) parts and engineering services. The total contract value is now 
$10.3 million and fully funded.

“This most recent award demonstrates that our customer continues to recognize the unique value of Comtech’s space level electronic parts supply chain management and engineering services expertise for this critical manned space program,” said  Fred Kornberg, Chairman of the Board and Chief Executive Officer of 
Comtech Telecommunications Corp.

The contract was awarded to Comtech’s Space & Component Technology (“SCT”) division, which specializes in ground station systems and life cycle management, as well as the supply of high reliability microelectronics (“EEE parts”) for use in satellite, launch vehicle and manned space applications.

Satellite tracking antennas are manufactured from 30cm to 13m, as well as RF feeds, radomes and carbon fiber reflectors, for LEO, MEO and GEO orbits, for customers worldwide, for all frequency bands. This encompasses all aspects of use including requirements definition and analysis, design, development, and integration of turnkey systems from antenna to data processing, civil works and construction, software, station installation and verification, operations and maintenance, and decommissioning at end of life. For more information, visit www.comtechspace.com.

Comtech Telecommunications Corp. is a leading global provider of next-generation 911 emergency systems and secure wireless communications technologies to commercial and government customers around the world. Headquartered in 
Melville, New York and with a passion for customer success, 
Comtech designs, produces and markets advanced and secure wireless solutions to customers in more than 100 countries. For more information, please visit www.comtechtel.com.

Certain information in this press release contains statements that are forward-looking in nature and involve certain significant risks and uncertainties. Actual results could differ materially from such forward-looking information. The Company’s 
Securities and Exchange Commission filings identify many such risks and uncertainties. Any forward-looking information in this press release is qualified in its entirety by the risks and uncertainties described in such 
Securities and Exchange Commission filings.

Comtech Investor Relations:
631-962-7005
investors@comtech.com

Source: 
Comtech Telecommunications Corp.

Great Bear Resources Ltd. (GTBAF)(GBR:CA) – Drilling Affirms Bulk Tonnage Potential over 3 Kilometers of Strike Length

Thursday, August 26, 2021

Great Bear Resources Ltd. (GTBAF)(GBR:CA)
Drilling Affirms Bulk Tonnage Potential over 3 Kilometers of Strike Length

Noble Capital Markets research on Great Bear Resources is published under ticker symbols GTBAF and GBR:CA. The price target is in USD and based on ticker symbol GTBAF. Great Bear Resources Ltd is a gold exploration company. It explores for mineral properties in the Red Lake District in Ontario, Canada. Its property portfolio includes Great Bear’s Red Lake Properties with the flagship Dixie project, Pakwash property, and Sobel property.

Mark Reichman, Senior Research Analyst of Natural Resources, Noble Capital Markets, Inc.

Refer to the full report for the price target, fundamental analysis, and rating.

    Phase 1 drill results. Great Bear Resources released additional results for drill holes associated with its Phase 1 drilling program at Dixie. Since May 2019, Great Bear has completed 440 drill holes, representing 222,500 meters of drilling, at the LP Fault, of which results for 404 drill holes have been released. The company expects to publish a maiden mineral resource estimate in early 2022. The initial resource estimate will be based on Phase 1 drilling to a depth of 450 meters from surface.

    Phase 2 drilling commenced in August.  Great Bear commenced Phase 2 drilling in August. The program will include expansion drilling of the LP Fault below 450 meters depth and along strike, additional infill drilling of the upper 450 meters of the LP Fault, expansion and infill drilling of the Hinge, Limb, and Arrow zones, and testing of new regional targets …


This Company Sponsored Research is provided by Noble Capital Markets, Inc., a FINRA and S.E.C. registered broker-dealer (B/D).

*Analyst certification and important disclosures included in the full report. NOTE: investment decisions should not be based upon the content of this research summary.  Proper due diligence is required before making any investment decision. 

Golden Predator Mining (NTGSF)(GPY:CA) – Shareholders Approve Business Combination with Arizona Gold Corp

Thursday, August 26, 2021

Golden Predator Mining (NTGSF)(GPY:CA)
Shareholders Approve Business Combination with Arizona Gold Corp.

Golden Predator Mining Corp is a Canada based exploration stage company engaged in the business of acquiring and exploring mineral properties. It owns properties primarily in Yukon, Canada. Some of the company’s projects located in Yukon are the 3 Aces, Sprogge, Reef, Brewery Creek, Marg, Sonora Gulch, Grew Creek, Upper Hyland and others.

Mark Reichman, Senior Research Analyst of Natural Resources, Noble Capital Markets, Inc.

Refer to the full report for the price target, fundamental analysis, and rating.

    Business combination approved. Golden Predator Mining and Arizona Gold Corp. (TSX: AZG, OTCQB: AGAUF) shareholders overwhelmingly approved the proposed acquisition by Arizona Gold of all the outstanding common shares of Golden Predator by way of a proposed plan of arrangement. Shareholders of Golden Predator will receive 1.65 common shares of Arizona Gold Corp. in exchange for each share of Golden Predator. Upon closing, Golden Predator shareholders will own approximately 45% of the combined company shares.

    Merger expected to close on September 2.  Completion of the business combination is contingent on satisfaction or waiver of remaining conditions to the arrangement, including final approval by the Supreme Court of British Columbia …


This Company Sponsored Research is provided by Noble Capital Markets, Inc., a FINRA and S.E.C. registered broker-dealer (B/D).

*Analyst certification and important disclosures included in the full report. NOTE: investment decisions should not be based upon the content of this research summary.  Proper due diligence is required before making any investment decision. 

Release – Arizona Gold and Golden Predator Shareholders Approve Business Combination


Arizona Gold and Golden Predator Shareholders Approve Business Combination


VANCOUVER, British Columbia, Aug. 25, 2021 (GLOBE NEWSWIRE) — Arizona Gold Corp. (“Arizona”) (TSX: AZG, OTCQB: AGAUF) and Golden Predator Mining Corp. (“Golden Predator”) (TSX.V: GPY, OTCQX: NTGSF) are pleased to announce that shareholders of both Arizona and Golden Predator have overwhelmingly approved all matters voted on at Arizona’s special meeting as well as at Golden Predator’s special meeting held earlier today, including the proposed acquisition by Arizona of all of the outstanding common shares of Golden Predator by way of a proposed plan of arrangement (the “Arrangement”), pursuant to the terms and subject to the conditions of the arrangement agreement between Arizona and Golden Predator dated June 28, 2021.

Subject to the satisfaction or waiver of the remaining conditions to the Arrangement, including approval of the Arrangement by the British Columbia Supreme Court, which application will be heard on August 30, 2021, closing of the Arrangement is expected to occur on September 2, 2021.

Under the terms of the Arrangement, all of the issued and outstanding common shares of Golden Predator will be exchanged for common shares of Arizona on the basis of 1.65 common shares of Arizona per common share of Golden Predator (the “Exchange Ratio”). Following completion of the Arrangement, current Arizona shareholders and former Golden Predator shareholders will own approximately 55% and 45% of the combined company common shares, respectively.

Name Change to Sabre Gold Mines Corp.
Arizona also intends to proceed with a name change to Sabre Gold Mines Corp. (“Sabre Gold”) in connection with the closing of the Arrangement. The common shares of the new Sabre Gold are expected to trade under the ticker symbol ‘SGLD’ on the Toronto Stock Exchange. The company expects to begin trading under its new name on the OTCQB at or about the same time and under a new ticker symbol by the middle of September, 2021, until which time the company will continue to trade under the current OTCQB symbol (AGAUF). A new website for the combined company will also be launched in early September.

Golden Predator shares are expected to be delisted from the TSX Venture Exchange and an application will be made for Golden Predator to cease to be a reporting issuer on the date of closing of the Arrangement.

Arizona Meeting & Voting Results
The issuance by Arizona of common shares of Arizona (“Arizona Shares”) to the shareholders of Golden Predator in exchange for all of the issued and outstanding Golden Predator shares pursuant to the Arrangement was approved by 99.5% of the votes cast by Arizona shareholders present or represented by proxy at Arizona’s special meeting.

All matters presented for approval at the Arizona special meeting were duly authorized and approved as follows:

Total Shares Represented at the meeting: 161,052,465 (46.54%)
     
Share Issuance Resolution:    
Shares Represented by Proxy – Voted For 156,132,570 (99.5%)
Shares Represented by Proxy – Voted Against 759,817 (0.5%)
Share Represented by proxy – Not Voted 4,160,078  
     
Name Change Resolution:    
Shares Represented by Proxy – Voted For 158,113,145 (98.2%)
Shares Represented by Proxy – Voted Against 2,939,320 (1.8%)


Golden Predator Meeting & Voting Results
The Arrangement with Arizona was approved by 99.29% of the votes cast by Golden Predator shareholders present by virtual attendance or represented by proxy at Golden Predator’s special meeting.

All matters presented for approval at the Golden Predator special meeting were duly authorized and approved as follows:

Total Shares Represented at the meeting: 78,461,398 (45.50%)
     
Arrangement Resolution:    
Shares Represented by Proxy – Voted For 77,907,359 (99.29%)
Shares Represented by Proxy – Voted Against 554,029 (0.71%)


About Arizona
Arizona Gold is an emerging American gold producer advancing the restart of production at its 100% owned, fully permitted, past-producing Copperstone mine project, located in mining-friendly Arizona. The Copperstone mine project demonstrates significant upside exploration potential that has yet to be drilled within a 50 km2 land package that includes past production of over 500,000 oz gold by way of an open-pit operation.

The company’s current focus is on maximizing Copperstone’s potential by defining and expanding current resources and further optimizing the mine’s economics for purposes of the restart of gold production in the near-term as a result of the recent project funding transaction with Star Royalties Ltd.

For further information please visit the Arizona website at www.arizona-gold.com.

About Golden Predator
Golden Predator is advancing the past-producing Brewery Creek mine towards a timely resumption of mining activities in Canada’s Yukon. The project has established resources grading over 1.0 g/t gold and both a technical report and Bankable Feasibility Study underway to define the economics of a restart of heap leach operations at the Brewery Creek mine. The 180 km2 brownfield property is located 55 km by road from Dawson City, Yukon and operates under a Socio-Economic Accord with the Tr’ondëk Hwëch’in First Nation. The Company also holds the Marg project, with a NI 43-101 compliant resource, the Gold Dome project and the Grew Creek project.

For additional information on Golden Predator and the Brewery Creek mine, please visit the website at www.goldenpredator.com.

Contact Information

Arizona Gold Corp.
Giulio Bonifacio
CEO & Director
604-318-6760 
gtbonifacio@arizona-gold.com
Golden Predator Mining Corp.
William Sheriff
Executive Chair
972-333-2214
wms@goldenpredator.com


Cautionary Statements

Certain information contained herein constitutes forward-looking information or statements under applicable securities legislation and rules. Such statements include, but are not limited to, statements with respect to the anticipated completion of the Transaction. Forward-looking statements are based on the opinions and estimates of management as of the date such statements are made and are subject to known and unknown risks, uncertainties and other factors that may cause the actual results, level of activity, performance or achievements of Arizona and/or Golden Predator to be materially different from those expressed or implied by such forward-looking statements, including, but not limited to: (i) any inability of the parties to satisfy the conditions to the completion of the transaction on acceptable terms or at all; and (ii) receipt of necessary stock exchange and court approvals. Although management of each of Arizona and Golden Predator has attempted to identify important factors that could cause actual results to differ materially from those contained in forward-looking statements, there may be other factors that cause results not to be as anticipated, estimated or intended. There can be no assurance that such statements will prove to be accurate. Accordingly, readers should not place undue reliance on forward-looking statements. Neither party will update any forward-looking statements or forward-looking information that are incorporated by reference herein, except as required by applicable securities laws. The parties caution readers not to place undue reliance on these forward-looking statements and it does not undertake any obligation to revise and disseminate forward-looking statements to reflect events or circumstances after the date hereof, or to reflect the occurrence of or non-occurrence of any events.

This press release is not and is not to be construed in any way as, an offer to buy or sell securities in the United States. The distribution of the Arizona common shares in connection with the transactions described herein will not be registered under the United States Securities Act of 1933 (the “U.S. Securities Act”) and the Arizona common shares may not be offered or sold in the United States absent registration or an applicable exemption from the registration requirements of the U.S. Securities Act and applicable state securities laws. This press release shall not constitute an offer to sell or the solicitation of an offer to buy the Arizona common shares, nor shall there be any offer or sale of the Arizona common shares in any jurisdiction in which such offer, solicitation or sale would be unlawful.

Neither the TSX, the TSX Venture Exchange nor its Regulation Services Provider (as that term is defined in the policies of the TSX and TSX Venture Exchange) accepts responsibility for the adequacy or accuracy of this release.

QuickChek – August 26, 2021


Ceapro Inc. Reports 2021 Second Quarter and Six-Month Financial Results and Operational Highlights

Ceapro announced financial results and operational highlights for the second quarter and six months ended June 30, 2021

Research, News & Market Data on Ceapro

Watch recent presentation from Ceapro


Comtech Telecommunications Corp. Awarded $2.1 Million of Funding for EEE Parts Management, Procurement and Engineering Services

Comtech Telecommunications announced that during its fourth quarter of fiscal year 2021, it was awarded $2.1 million of additional funding from a major U.S. prime contractor in support of NASA’s Space Launch System Control System Electronics

Research, News & Market Data on Comtech

Watch recent presentation from Comtech


Arizona Gold and Golden Predator Shareholders Approve Business Combination

Golden Predator Mining announced that shareholders of both Arizona and Golden Predator have overwhelmingly approved all matters voted on at Arizona’s special meeting as well as at Golden Predator’s special meeting

See today’s research report from Mark Reichman, Senior Research Analyst of Natural Resources at Noble Capital Markets

Research, News & Market Data on Golden Predator

Watch recent presentation from Golden Predator


1-800-FLOWERS.COM, Inc. Reports Record Revenues for its Fiscal 2021 Fourth Quarter and Full Year

1-800-FLOWERS.COM reported results for its Fiscal 2021 fourth quarter and full year ended June 27, 2021

Research, News & Market Data on 1-800-FLOWERS.COM


Gevo Files for Environmental Permits in South Dakota for the Net-Zero 1 Project

Gevo announced that the air quality and wastewater permit applications for the company’s Net-Zero 1 project have been filed with the South Dakota Department of Agriculture & Natural Resources

Research, News & Market Data on Gevo

Watch recent presentation from Gevo


Stay up to date. Follow us:


Sierra Metals (SMTS)(SMT:CA) – Virtual Road Show Take-Aways

Wednesday, August 25, 2021

Sierra Metals (SMTS)(SMT:CA)
Virtual Road Show Take-Aways

As of April 24, 2020, Noble Capital Markets research on Sierra Metals is published under ticker symbols (SMTS and SMT:CA). The price target is in USD and based on ticker symbol SMTS. Research reports dated prior to April 24, 2020 may not follow these guidelines and could account for a variance in the price target.

Sierra Metals Inc is a precious and base metals producer in Latin America. The company acquires, explores, extracts, and produces mineral concentrates consisting of silver, copper, lead, zinc and gold in Mexico and Peru. Its activity includes the operation of the Yauricocha Mine in Peru, and the Bolivar and Cusi mines in Mexico. Yauricocha is an underground polymetallic mine using the sublevel block caving and cut-and-fill mining methods. Bolivar is a copper-silver-zinc-gold underground mine using room-and-pillar mining method. The majority of the revenue is earned by selling of the mineral concentrates to its customers in Peru.

Mark Reichman, Senior Research Analyst of Natural Resources, Noble Capital Markets, Inc.

Refer to the full report for the price target, fundamental analysis, and rating.

    Virtual Roadshow. Noble and Channelchek recently hosted a virtual roadshow featuring Mr. Luis Marchese, Chief Executive Officer, who provided an overview of operations and planned growth initiatives. While the pandemic had reduced the company’s operating work force levels during the first half of 2021, staffing has returned to normal. However, the company is still playing catch up on certain projects that had been planned earlier in the year, including mine development to access higher grade ore bodies. Because the inauspicious start of the new President in Peru has elevated anxiety among investors, the new administration should provide greater certainty with respect to planned mining policies and taxation.

    Strategic growth opportunities.  While Sierra is undergoing a strategic review that could contemplate a sale, the company has significant growth opportunities, including expansion potential at Bolivar utilizing the existing mill, and exploration potential at the Reyna and Batopilas properties in Mexico that could potentially support another mine and mill. Given that Cusi is small and primarily a …


This Company Sponsored Research is provided by Noble Capital Markets, Inc., a FINRA and S.E.C. registered broker-dealer (B/D).

*Analyst certification and important disclosures included in the full report. NOTE: investment decisions should not be based upon the content of this research summary.  Proper due diligence is required before making any investment decision. 

Which Autonomous Cars Have the Best Safety Record?


Image Credit: Joroen Mirck (Flickr)


Why the Feds are Investigating Tesla’s Autopilot and What that Means for the Future of Self-Driving Cars


It’s hard to miss the flashing lights of fire engines, ambulances, and police cars ahead of you as you’re driving down the road. But in at least 11 cases in the past three and a half years, Tesla’s Autopilot advanced driver-assistance system did just that. This led to 11 accidents in which Teslas crashed into emergency vehicles or other vehicles at those scenes, resulting in 17 injuries and one death.

The National Highway Transportation Safety Administration has launched an investigation into Tesla’s Autopilot system in response to the crashes. The incidents took place between January 2018 and July 2021 in Arizona, California, Connecticut, Florida, Indiana, Massachusetts, Michigan, North Carolina and Texas. The probe covers 765,000 Tesla cars – that’s virtually every car the company has made in the last seven years. It’s also not the first time the federal government has investigated Tesla’s Autopilot.


This article was republished with permission from  The Conversation, a news site dedicated to sharing ideas from academic experts. It represents the research-based findings and thoughts of Hayder Radha, Professor of Electrical and Computer Engineering, Michigan State University


As a researcher who studies autonomous vehicles, I believe the investigation will put pressure on Tesla to reevaluate the technologies the company uses in Autopilot and could influence the future of driver-assistance systems and autonomous vehicles.


How Tesla’s Autopilot Works

Tesla’s Autopilot uses cameras, radar, and ultrasonic sensors to support two major features: Traffic-Aware Cruise Control and Autosteer.

Traffic-Aware Cruise Control, also known as adaptive cruise control, maintains a safe distance between the car and other vehicles that are driving ahead of it. This technology primarily uses cameras in conjunction with artificial intelligence algorithms to detect surrounding objects such as vehicles, pedestrians, and cyclists, and estimate their distances. Autosteer uses cameras to detect clearly marked lines on the road to keep the vehicle within its lane.

In addition to its Autopilot capabilities, Tesla has been offering what it calls “full self-driving” features that include auto park and auto lane change. Since its first offering of the Autopilot system and other self-driving features, Tesla has consistently warned users that these technologies require active driver supervision and that these features do not make the vehicle autonomous.


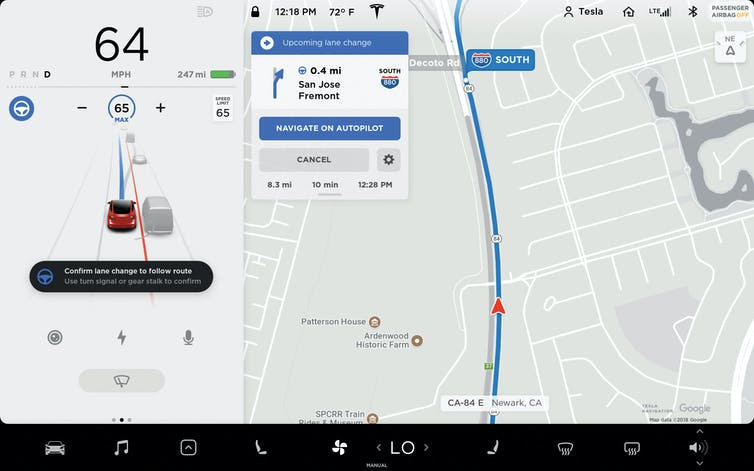
Tesla’s Autopilot display shows the driver where the car thinks it is in relation to
the road and other vehicles. Rosenfeld Media/Flickr

Tesla is beefing up the AI technology that underpins Autopilot. The company announced on Aug. 19, 2021, that it is building a supercomputer using custom chips. The supercomputer will help train Tesla’s AI system to recognize objects seen in video feeds collected by cameras in the company’s cars.


Autopilot Does Not Equal Autonomous

Advanced driver-assistance systems have been supported on a wide range of vehicles for many decades. The Society of Automobile Engineers divides the degree of a vehicle’s automation into six levels, starting from Level 0, with no automated driving features, to Level 5, which represents full autonomous driving with no need for human intervention.

Within these six levels of autonomy, there is a clear and vivid divide between Level 2 and Level 3. In principle, at Levels 0, 1 and 2, the vehicle should be primarily controlled by a human driver, with some assistance from driver-assistance systems. At Levels 3, 4 and 5, the vehicle’s AI components and related driver-assistance technologies are the primary controller of the vehicle. For example, Waymo’s self-driving taxis, which operate in the Phoenix area, are Level 4, which means they operate without human drivers but only under certain weather and traffic conditions.

Tesla Autopilot is considered a Level 2 system, and hence the primary controller of the vehicle should be a human driver. This provides a partial explanation for the incidents cited by the federal investigation. Though Tesla says it expects drivers to be alert at all times when using the Autopilot features, some drivers treat the Autopilot as having autonomous driving capability with little or no need for human monitoring or intervention. This discrepancy between Tesla’s instructions and driver behavior seems to be a factor in the incidents under investigation.

Another possible factor is how Tesla assures that drivers are paying attention. Earlier versions of Tesla’s Autopilot were ineffective in monitoring driver attention and engagement level when the system is on. The company instead relied on requiring drivers to periodically move the steering wheel, which can be done without watching the road. Tesla recently announced that it has begun using internal cameras to monitor drivers’ attention and alert drivers when they are inattentive.


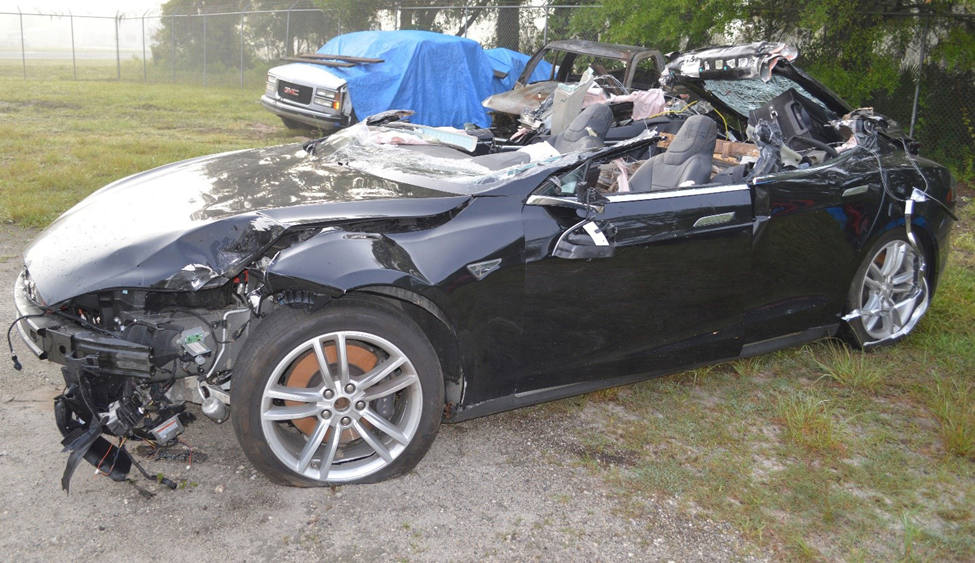
The Tesla Model S following its recovery from the crash scene near Williston, Florida.
(Photo by Florida Highway Patrol investigators)

Another equally important factor contributing to Tesla’s vehicle crashes is the company’s choice of sensor technologies. Tesla has consistently avoided the use of lidar. In simple terms, lidar is like radar but with lasers instead of radio waves. It’s capable of precisely detecting objects and estimating their distances. Virtually all major companies working on autonomous vehicles, including Waymo, Cruise, Volvo, Mercedes, Ford and GM, are using lidar as an essential technology for enabling automated vehicles to perceive their environments.

By relying on cameras, Tesla’s Autopilot is prone to potential failures caused by challenging lighting conditions, such as glare and darkness. In its announcement of the Tesla investigation, the NHTSA reported that most incidents occurred after dark where there were flashing emergency vehicle lights, flares, or other lights. Lidar, in contrast, can operate under any lighting conditions and can “see” in the dark.


Fallout From the Investigation

The preliminary evaluation will determine whether the NHTSA should proceed with an engineering analysis, which could lead to a recall. The investigation could eventually lead to changes in future Tesla Autopilot and its other self-driving system. The investigation might also indirectly have a broader impact on the deployment of future autonomous vehicles; in particular, the investigation may reinforce the need for lidar.

Although reports in May 2021 indicated that Tesla was testing lidar sensors, it’s not clear whether the company was quietly considering the technology or using it to validate their existing sensor systems. Tesla CEO Elon Musk called lidar “a fool’s errand” in 2019, saying it’s expensive and unnecessary.

However, just as Tesla is revisiting systems that monitor driver attention, the NHTSA investigation could push the company to consider adding lidar or similar technologies to future vehicles.


Suggested Reading:


Ford’s Announcement is Another Reason for Copper Investors to Smile


The Future of Electric Vehicles


Your Data is Used to Generate Big Returns


Edge Computing Importance to AI Applications


Stay up to date. Follow us:


Helius Medical Technologies (HSDT)(HSM:CA) – $32 Million Market Cap With A Multi-Billion TAM – Whats The Disconnect?

Wednesday, August 25, 2021

Helius Medical Technologies (HSDT)(HSM:CA)
$32 Million Market Cap With A Multi-Billion TAM – What’s The Disconnect?

Helius Medical Technologies is a neurotech company focused on neurological wellness. The Company’s purpose is to develop, license and acquire unique and non-invasive platform technologies that amplify the brain’s ability to heal itself. The Company’s first commercial product is the Portable Neuromodulation Stimulator (PoNSTM). For more information, visit www.heliusmedical.com.

Joe Gomes, Senior Research Analyst, Noble Capital Markets, Inc.

Refer to the full report for the price target, fundamental analysis, and rating.

    Can’t See the Forest For the Trees? We believe investors are missing the big picture at Helius Medical Technologies. Last week the Company received its second Breakthrough Designation from the U.S. Food and Drug Administration (FDA) for its PoNS device, this time for treatment of stroke patients with dynamic gait and balance deficits. Investors are missing the importance of the announcement, in our view.

    Second Breakthrough Designation.  To put last week’s announcement in perspective, there are over 400 companies with a Breakthrough Device Designation. Only 5.65% have FDA clearance, which Helius is one of them. For a company to have a second BDD puts Helius in rare air …


This Company Sponsored Research is provided by Noble Capital Markets, Inc., a FINRA and S.E.C. registered broker-dealer (B/D).

*Analyst certification and important disclosures included in the full report. NOTE: investment decisions should not be based upon the content of this research summary.  Proper due diligence is required before making any investment decision. 

Indonesia Energy Commences Drilling of Second of Three Back-to-Back Wells


Indonesia Energy Commences Drilling of Second of Three Back-to-Back Wells


New drilling paves way for commencement of additional production at Kruh Block

JAKARTA, INDONESIA and DANVILLE, CA / ACCESSWIRE / August 25, 2021 / Indonesia Energy Corporation Limited (NYSE American:INDO) (IEC), an oil and gas exploration and production company focused on Indonesia, today announced that the company has commenced the drilling of the second of three new back-to-back wells on its 63,000-acre Kruh Block.

This commencement of drilling is part of IEC’s overall previously announced plan to drill a total of 18 new wells on the Kruh Block over the next 3 years.

This second well (named “Kruh-26”) commenced drilling on Sunday, August 22 at 1:00 p.m. on Sumatra Island. The well has a target total depth of 3,400 feet, and it is expected to take approximately 60 days to complete all drilling operations.

IEC anticipates this well will cost approximately $1.5 million to drill and complete. Based on the terms of IEC’s contract with the Indonesian government and an assumed oil price of $63.50/barrel, this well is expected to generate approximately $3.3 million in net revenue in its first year, which is more than double the cost to drill such well.

The Kruh Block is located on Sumatra Island. IEC is already producing oil from 4 existing wells at Kruh Block.

Mr. Frank Ingriselli, IEC’s President, commented “We are excited to commence drilling our second new well on the Kruh Block. This new well, which we have the cash to drill, has the potential to additionally grow production and cash flow for our company, especially when coupled with our recent discovery well “Kruh-25″. We believe the Kruh Block is a great asset that should significantly grow our cash flow as we continue to seek to maximize returns on our investments and grow shareholder value.”

About Indonesia Energy Corporation Limited

Indonesia Energy Corporation Limited (NYSE American: INDO) is a publicly traded energy company engaged in the acquisition and development of strategic, high growth energy projects in Indonesia. IEC’s principal assets are its Kruh Block (63,000 acres) located onshore on the Island of Sumatra in Indonesia and its Citarum Block (1,000,000 acres) located onshore on the Island of Java in Indonesia. IEC is headquartered in Jakarta, Indonesia and has a representative office in Danville, California. For more information on IEC, please visit www.indo-energy.com.

Cautionary Statement Regarding Forward-Looking Statements

All statements in this press release of Indonesia Energy Corporation Limited (“IEC”) and its representatives and partners that are not based on historical fact are “forward-looking statements” within the meaning of the Private Securities Litigation Reform Act of 1995 and the provisions of Section 27A of the Securities Act of 1933, as amended, and Section 21E of the Securities Exchange Act of 1934, as amended (the “Acts”). In particular, when used in the preceding discussion, the words “estimates,” “believes,” “hopes,” “expects,” “intends,” “on-track”, “plans,” “anticipates,” or “may,” and similar conditional expressions are intended to identify forward-looking statements within the meaning of the Acts and are subject to the safe harbor created by the Acts. Any statements made in this news release other than those of historical fact, about an action, event or development, are forward-looking statements. While management has based any forward-looking statements contained herein on its current expectations, the information on which such expectations were based may change. These forward-looking statements rely on a number of assumptions concerning future events and are subject to a number of risks, uncertainties, and other factors, many of which are outside of the IEC’s control, that could cause actual results (including, without limitation, the anticipated results of IEC’s exploration and production activities and the impact of such activities on IEC’s results of operations as descried herein) to materially and adversely differ from such statements. Such risks, uncertainties, and other factors include, but are not necessarily limited to, those set forth in the Risk Factors section of the Company’s annual report on Form 20-F for the fiscal year ended December 31, 2020 filed on May 18, 2021 with the Securities and Exchange Commission (SEC). Copies are of such documents are available on the SEC’s website, www.sec.gov. IEC undertakes no obligation to update these statements for revisions or changes after the date of this release, except as required by law.

Company Contact:

Frank C. Ingriselli
President, Indonesia Energy Corporation Limited
Frank.Ingriselli@Indo-Energy.com

SOURCE: Indonesia Energy Corporation Limited

Timeline and Funding for Advanced Nuclear Designs


Image Credit: Fabio Puscicelli (Flickr)


Advanced Reactor Demonstration Program – How Does it Work, What’s the Timeline?


The coming innovations in nuclear power generation are designed to serve various purposes. Those now under development and headed for the U.S. Government’s Advanced Reactor Demonstration Program (ARDP) are part of a larger plan to reduce energy production from fossil fuels. Just as with other industries overseen by, and having to pass government testing, new nuclear power designs need to be vetted, tested, and brought online with caution, yet expeditiously.

Nuclear Reactor Demonstration

The idea of reactor demonstration is to prove the new engineering, design, construction, ability to operate, and correct licensing. The ARDP is unusual in that it is a partnership between the public and private sector. The intent is to add nuclear generation to be used for powering residential and commercial property.

As much as the partnerships between the public and private sector are intended to speed the development of reactors. Other more talked about reasons include providing clean energy while creating jobs. But there is another critical reason; this is the need for speed. Moving as fast as prudent is necessary because the supply chain of the fuel could further diminish if not exercised.  Bringing plants online, or at least operating in a test phase will help stop the infrastructure from decaying.


The Power of Grant Money

Through a government grant, the ARDP will be providing initial funds of $160 million to support demonstrating a plant’s concept, and design.  The purpose, according to the grants.gov portal is “…to facilitate the development of U.S. private industry advanced nuclear reactor demonstrations.” The grant portal also describes, “These designs are expected to enable a market environment in which commercial reactor services are available that are safe and affordable to both construct and operate when compared to competing alternative sources of energy in the near- and mid-term. These designs are expected to provide significant improvements in safety, security, economics, and environmental impacts over current nuclear power plant designs.”

Who Can Apply is Limited

Each project’s funding has various avenues for approval. The goal of the Department of Energy and non-federal parties is on the construction and actual demonstration that a reactor design is safe and affordable to build in the near- to mid-term. If the reactor would take ten years to build, the benefit may be much more limited.

ARDP identifies three separate pathways to meet this goal:

1). Advanced reactor demonstrations, which supports two reactor designs to be operational in 5-7 years

2). Risk reduction for future demonstration awards which supports two to five additional novel advanced reactor designs that have a commercialization horizon that is approximately 5 years longer than the advanced reactor demonstrations.

3). A third path, is identified in Congresses Appropriations Act of 2020, (H.R. 1865, Advanced Reactor Concepts). This supports the development of at least two new public-private partnership awards focused on advancing reactor designs toward the demonstration phase; these have a commercialization horizon that is approximately five years longer than the risk reduction for future demonstration awards.

The ARDP will use the National Reactor Innovation Center to test and assess ARD technologies by engaging the full capabilities of the U.S. National Laboratory system to safely walk these reactors from blueprints to reality


Take-Away

Knowing expected time frames used in the development of a plant or product is important. This is true whether you’re investing in plant and equipment, future patents, potential medicines, or anything involved in nuclear energy production. The U.S. is supporting bringing online new-tech nuclear plants with grant money under the Advanced Reactor Demonstration Program, there may be potential for investors to benefit.

Answers as to whether an allocation to the nuclear sector in the form of uranium production is appropriate for your portfolio may be found at next week’s uranium companies investor forum. Registration is free to registered Channelchek users.


Noble Capital Markets Uranium Power Players Investor Forum – August 31, 2021 Starting at 9am EDT

The Noble Uranium Power Players Investor Forum is a virtual conference bringing together leading companies involved in the exploration and production of uranium.

Registration is fast and free.


Sources:

https://www.grants.gov/web/grants/view-opportunity.html?oppId=326997

https://www.energy.gov/ne/advanced-reactor-demonstration-program

https://www.energy.gov/ne/articles/infographic-advanced-reactor-development

https://www.terrapower.com/advanced-nuclear-reactor-demonstration/

https://www.id.energy.gov/


Stay up to date. Follow us:


Kratos Air Wolf Tactical Drone System Completes Successful Flight at Burns Flat, Oklahoma Range Facility


Kratos Air Wolf Tactical Drone System Completes Successful Flight at Burns Flat, Oklahoma Range Facility


SAN DIEGO
Aug. 25, 2021 (GLOBE NEWSWIRE) — 
Kratos Defense & Security Solutions, Inc. (NASDAQ: KTOS), a leading National Security Solutions provider announced today that its Air Wolf Tactical Drone System completed a 100 percent successful flight at the recently approved 
Burns Flat, Oklahoma Range Facility.  
The Kratos Air Wolf Mission, which was the inaugural flight at the 
Burns Flat Range location, included multiple new payloads carried by the Air  Wolf Drone, including a proprietary Kratos artificial intelligence/autonomy system, which has been developed by Kratos specifically for high performance, jet drone aircraft. 

Air Wolf is one of several drones in Kratos’ family of affordable, high-performance jet drones that are flying today, also including the attritable UTAP-22 Mako, XQ-58A Valkyrie, and the reusable X-61A Gremlins drone with the Gremlins Program Prime being with Kratos’ strategic partner Dynetics.  The newly approved 
Burns Flat Test Range and Facility is an important new strategic asset available to Kratos, enabling Kratos to accelerate its drone testing and demonstration, further increasing Kratos’ ability to rapidly develop and demonstrate jet drones, supporting subsystems, and other tactical systems and aircraft.  For competitive, security and other considerations, no additional information will be provided regarding the successful Air Wolf flight and mission.

Steve Fendley, President of Kratos Unmanned Systems Division, said, “This successful Air Wolf flight at the recently approved 
Burns Flat Range facility is the latest example of the teaming approach Kratos routinely takes with its partners at the local, state and federal government levels with the objective of accelerating technology development and a focus on science, technology, engineering, and math advancement.  The Air Wolf drone system that successfully flew today demonstrated a number of new mission systems which we believe are operationally and tactically relevant for Kratos’ government customer set, as our proven commercial development approach and robust digital engineering, modeling and simulation capabilities, and affordability-focused processes continue to successfully rapidly deliver affordable high performance jet aircraft, not just models, surrogates, or renditions.”

Eric DeMarco, President and CEO of Kratos, said, “Kratos thanks  Senator Inhofe, the 
Federal Aviation Administration and all other government stakeholders in bringing the 
Burns Flat Range and Test facility to a reality, and we believe that 
Burns Flat will be an incredibly valuable asset to the 
State of Oklahoma and for companies like Kratos.  Kratos’ Ghost Works played an incredibly important role in today’s successful Air Wolf flight, and with our Valkyrie, Mako, Gremlin and Air Wolf drones, we believe that we are ready now, today, to meet our customers’ requirements with a family of affordable, high performance jet drones in the disposable, reusable and attritable classes.”

About Kratos Defense & Security Solutions

Kratos Defense & Security Solutions, Inc. (NASDAQ:KTOS) develops and fields transformative, affordable technology, platforms and systems for United States National Security related customers, allies and commercial enterprises. Kratos is changing the way breakthrough technology for these industries are rapidly brought to market through proven commercial and venture capital backed approaches, including proactive research and streamlined development processes. At Kratos, affordability is a technology, and we specialize in unmanned systems, satellite communications, cyber security/warfare, microwave electronics, missile defense, hypersonic systems, training, combat systems and next generation turbo jet and turbo fan engine development. For more information, please visit www.KratosDefense.com.

Notice Regarding Forward-Looking Statements
Certain statements in this press release may constitute “forward-looking statements” within the meaning of the Private Securities Litigation Reform Act of 1995. These forward-looking statements are made on the basis of the current beliefs, expectations and assumptions of the management of Kratos and are subject to significant risks and uncertainty. Investors are cautioned not to place undue reliance on any such forward-looking statements. All such forward-looking statements speak only as of the date they are made, and Kratos undertakes no obligation to update or revise these statements, whether as a result of new information, future events or otherwise. Although Kratos believes that the expectations reflected in these forward-looking statements are reasonable, these statements involve many risks and uncertainties that may cause actual results to differ materially from what may be expressed or implied in these forward-looking statements. For a further discussion of risks and uncertainties that could cause actual results to differ from those expressed in these forward-looking statements, as well as risks relating to the business of Kratos in general, see the risk disclosures in the Annual Report on Form 10-K of Kratos for the year ended December 27, 2020, and in subsequent reports on Forms 10-Q and 8-K and other filings made with the SEC by Kratos.

Press Contact:
Yolanda White
858-812-7302 Direct

Investor Information:
877-934-4687
investor@kratosdefense.com

Source: Kratos Defense & Security Solutions, Inc.

Great Bear Adds to LP Fault Gold Zone at Both Ends of Drill Grid


Great Bear Adds to LP Fault Gold Zone at Both Ends of Drill Grid: 28.18 g/t Gold Over 4.80 m, Within 3.83 g/t Gold Over 43.10 m in Northwest, 64.30 g/t Gold Over 0.55 m, Within 5.90 g/t Gold Over 8.25 m in Southeast; Gold Controls Confirmed


August 25, 2021 – Vancouver, British Columbia, Canada – Great Bear Resources Ltd. (the “Company” or “Great Bear”, TSX-V: GBR; OTCQX: GTBAF) today reported results from its ongoing fully funded $45 million 2021 exploration program at its 100% owned flagship Dixie Project in the Red Lake district of Ontario.

Key Results

  • Drill holes reported in this release primarily targeted the previously underexplored northwestern and southeastern areas of the 4.2 kilometre Phase 1 drill grid.  Results expand and characterize the zone outboard from the Central LP Fault, which had seen the highest density Phase 1 drilling prior to this release.  Figure 1.
  • High-grade gold controls have been identified along the LP Fault.  Drilling has confirmed these controls in several areas, which will facilitate targeting of high-grade gold during Phase 2 drilling below the current 450 metre drill depth, and elsewhere along strike.
  • Steeply-plunging high-grade gold mineralization has been successfully targeted in the northwestern “Discovery” and southeastern “Viggo” areas of the LP Fault.
  • The number of high-grade gold domains being modeled at the LP Fault has been expanded from 17 to 23.  This includes seven high-grade gold domains which are being modeled in the northwestern “Discovery” area. 
  • Bulk tonnage style gold mineralization has been confirmed as continuous along more than 3 kilometres of strike length of the LP Fault and remains open to extension.  New results from the previously under-drilled northwestern “Discovery” and “Gap” areas illustrate this continuity.

Chris Taylor, President and CEO of Great Bear said, “The confirmation of predictable high-grade gold controls within the LP Fault has clear, positive implications for our ability to target and model higher-grade mineralization, especially at depth.  However, the confirmation of continuous mineralization at shallow depths in the “Gap” area is arguably the more significant development as we progress towards maiden mineral resource estimate publication by early next year.  While clearly not the most strongly mineralized segment of the LP Fault, the “Gap” area contains mineralized intervals with similar grades and widths to those that have been incorporated into mine plans within other Canadian bulk tonnage gold deposits.  These new results confirm the strongly mineralized Central and Discovery areas are connected as a continuously mineralized gold zone with clear bulk tonnage potential over three kilometres of strike length.

With the 73 new drill holes contained in this release, Great Bear has reported 404 of the 440 LP Fault drill holes completed during Phase 1 drilling which will support maiden mineral resource estimation.

Figure 1: Long section showing Phase 1 drill grid results to date and areas discussed in this release.

High-Grade Gold Controls

Recent drilling has included a focus on modeling higher-grade gold mineralization controls within the broad, bulk tonnage style gold system.  Plunge controls to mineralization were interpreted using over 65,000 oriented core measurements, targeting the intersections of foliation fabrics and stratigraphy.  These intersections frequently host increased widths and grades of gold mineralization.

In this release, Great Bear successfully targeted higher grade zones within the LP Fault in both the “Discovery” and “Viggo” areas, and will apply the same criteria beneath currently drilled areas and along 11 kilometres of strike length of the LP Fault (see news release of February 20, 2020) through 2022.

Examples of confirmed and interpreted plunge controls are included in Figure 1.  These and additional interpreted plunge controls will be tested during Phase 2 drilling.

“Discovery” Area Results

Twenty six drill holes were completed in the original LP Fault “Discovery” area, located along the most northwesterly 700 metres of the 4.2 kilometre long Phase 1 drill grid.  This area was the site of LP Fault discovery hole DNW-011 (May 28, 2019; 12.33 g/t gold over 14.00 metres). Highlights include:

  • Drill hole BR-365 extended gold mineralization approximately 100 metres deeper than past drilling on its section, assaying 15.04 g/t gold over 4.00 metres from 545.00 to 549.00 metres downhole, within a broader envelope of 3.13 g/t gold over 29.50 metres from 523.50 to 553.00 metres downhole.  Figure 2.
  • Drill hole BR-394 assayed 150.00 g/t gold over 0.80 metres from 331.60 to 332.40 metres downhole, within a broader interval of 28.18 g/t gold over 4.80 metres from 331.60 to 336.40 metres downhole.  The total mineralized interval was 3.83 g/t gold over 43.10 metres from 311.50 to 354.60 metres downhole.  Figure 3.
  • Newly defined steeply northwest plunging high-grade gold controls were successfully confirmed in both BR-365 and BR-394, and will be targeted at depth below this area during Phase 2 drilling.
  • Most of the drill holes in the “Discovery” area contained multiple mineralized intervals.  An example is drill hole BR-393 which contained four mineralized zones assaying 70.90 g/t gold over 1.00 metre from 110.75 to 111.75 metres, 1.26 g/t gold over 23.00 metres from 209.50 to 232.50 metres downhole, 0.60 g/t gold over 98.35 metres from 237.60 to 335.95 metres downhole, and 16.00 g/t gold over 1.15 metres from 355.25 to 356.40 metres downhole.
  • Drill hole BR-360 assayed 22.80 g/t gold over 1.20 metres from bedrock surface, within a broader interval of 1.66 g/t gold over 34.90 metres from 13.20 to 48.10 metres downhole. A separate interval of 0.88 g/t gold over 14.00 metres was also present from 153.00 to 167.00 metres downhole.
  • Drill hole BR-333 assayed 26.60 g/t gold over 0.80 metres from 130.30 to 131.10 metres downhole, within a broader interval of 0.71 g/t gold over 84.25 metres from 51.00 to 135.25 metres downhole.
  • Great Bear is currently modeling 7 high-grade gold domains within the broader bulk tonnage gold domains in the “Discovery” area of the LP Fault zone.  Results are provided in Table 1, and expand both high-grade and bulk-tonnage style gold mineralization in this area.

Table 1: Drill results from the “Discovery” area of the northwestern LP Fault drill grid.

Drill Hole


From (m)

To (m)

Width* (m)

Gold (g/t)

Section

BR-361


229.40

230.00

0.60

3.01

22500


and

338.00

338.50

0.50

8.21


and

461.10

484.75

23.65

1.00


including

461.10

462.40

1.30

9.81


BR-362


304.50

307.20

5.70

1.45

22500


including

305.00

306.00

1.00

6.42


BR-363


137.60

154.30

16.70

1.01

22500


including

149.80

151.30

1.50

7.91


BR-364


177.90

178.65

0.75

4.51

22500

BR-365


151.00

152.50

1.50

15.10

22425


and

523.50

553.00

29.50

3.13


including

545.00

553.00

8.00

10.24


and including

545.00

549.00

4.00

15.04


BR-366


363.00

397.50

34.50

0.89

22425


including

375.00

376.00

1.00

9.74


BR-368


189.50

207.00

17.50

1.58

22400


including

198.50

205.10

6.60

3.82


and including

204.40

205.10

0.70

22.00


and

315.25

316.75

1.50

4.19


BR-367


352.40

353.85

1.45

4.45

22375


and

372.00

373.50

1.50

3.30


and

472.40

508.30

35.90

0.71


BR-369


245.00

306.35

61.35

0.67

22325

BR-420


315.00

358.90

43.90

1.14

22300


including

331.50

333.00

1.50

6.21


BR-360


13.20

48.10

34.90

1.66

22250


including

13.20

14.40

1.20

22.80


and

153.00

167.00

14.00

0.88


BR-308


150.60

183.00

32.40

0.96

22200


including

171.25

183.00

11.75

2.12


and including

171.25

172.00

0.75

12.50


and

227.60

236.10

8.50

2.11


and

286.40

356.50

70.10

0.52


and

311.80

312.75

0.95

3.30


BR-396


75.10

117.60

42.50

0.73

22200


including

101.00

107.50

6.50

2.25


and

128.20

163.25

35.05

0.74


including

152.90

153.90

1.00

5.21


BR-307


353.00

419.50

66.50

0.71

22150


including

380.00

382.90

2.90

2.29


Table 1 Continued.

Drill Hole


From (m)

To (m)

Width* (m)

Gold (g/t)

Section

BR-397


20.50

50.20

29.70

0.52

22125


and

55.40

68.70

13.30

1.31


and

74.00

80.60

6.60

2.13


and

83.90

123.70

39.80

0.37


BR-395


142.00

201.30

59.30

0.40

22100


and

253.00

275.10

22.10

0.78


including

260.00

261.00

1.00

7.34


BR-391


39.00

55.90

16.90

2.55

22075


including

48.00

54.00

6.00

6.37


and

60.00

101.00

41.00

0.51


including

69.00

70.50

1.50

4.09


and

166.60

167.20

0.60

3.86


BR-392


197.50

233.80

36.30

0.72

22075


and

253.10

256.75

3.65

2.66


BR-393


110.75

111.75

1.00

70.90

22075


and

209.50

232.50

23.00

1.26


and

237.60

335.95

98.35

0.60


and

355.25

356.40

1.15

16.00


BR-394


124.40

125.40

1.00

10.20

22075


and

311.50

354.60

43.10

3.83


and including

331.60

336.40

4.80

28.18


and including

331.60

332.40

0.80

150.00


and

451.20

455.65

4.45

2.34


BR-333


51.00

135.25

84.25

0.71

21975


and including

125.55

131.10

5.55

4.85


and including

130.30

131.10

0.80

26.60


BR-334


220.60

243.80

23.20

0.69

21950


including

228.25

235.50

7.25

1.36


BR-335


180.85

182.20

1.35

3.07

21875


and

235.50

278.75

43.25

0.54


including

271.50

273.00

1.50

4.10


BR-336


334.95

344.00

9.05

0.81

21825


including

338.00

344.00

6.00

1.00


BR-337


215.25

244.10

28.85

0.34

21825

BR-338


125.00

141.00

16.00

0.55

21825


including

132.55

136.80

4.25

1.15


*Represents core length. True mineralization widths range between 65- 95% of reported intervals as they are determined by both structural analyses obtained from oriented drill core data and orientations of individual high grade domains and bulk tonnage domains.  Mineralized domains vary in strike between 340 to 270 degrees and dip between 85 to 65 degrees to the north.  All drillholes intersect both high grade and bulk tonnage domains and often intersect multiple domains resulting in a range of true widths within the same drillhole.

Figure 2: Cross section 22425, located near the northwestern edge of the Phase 1 drill grid in the “Discovery” area.  Drill hole BR-365 extends mineralization by approximately 100 metres vertical depth. Drill core photos are of selected intervals and are not representative of all gold mineralization on the property.  Assay results from past drilling are also provided in the included table.

Figure 3: Cross section 22075 located in the northwestern “Discovery” area of the Phase 1 drill grid. Drill core photos are of selected intervals and are not representative of all gold mineralization on the property. Assay results from past drilling are also provided in the included table.

“Gap” Area Results

Eleven drill holes were completed into the “Gap” area, where bulk tonnage style gold mineralization dominates.  The Gap segment comprises approximately 400 metres of the Phase 1 grid drilling strike length.

Results are provided in Table 2.  Highlights include:

  • Confirmation of bulk tonnage style gold mineralization in all areas tested.  Results establish continuity between the adjacent “Discovery” and “Central” areas of the LP Fault zone, for a currently drilled total of over three kilometres of continuous bulk tonnage gold mineralization in the near surface of the zone.
  • Drill hole BR-410 assayed 23.80 g/t gold over 0.60 metres from 386.10 to 386.70 metres downhole, within a broader interval of 1.29 g/t over 27.50 metres from 367.00 to 394.50 metres downhole.
  • Drill hole BR-356 assayed 0.80 g/t gold over 26.90 metres from 124.10 to 151.00 metres downhole.
  • Drill hole BR-355 intersected a new high-grade target assaying 31.40 g/t gold over 1.00 metre from 271.50 to 272.50 metres downhole, in addition to a separate interval of 0.59 g/t gold over 31.90 metres from 165.00 to 196.90 metres downhole.
  • Great Bear is currently modeling 2 high-grade gold domains within the bulk tonnage gold domains in the Gap area of the LP Fault zone.
  • The “Gap” segment of the LP Fault zone has been found to contain more strongly developed gold mineralization at vertical depths of approximately 750 – 800 metres.  As originally reported on March 29, 2021, deep drill hole BR-260 intersected 15.57 g/t gold over 3.05 metres, within 1.08 g/t gold over 70.25 metres from 906.15 to 976.40 metres downhole.  This remains the deepest drill hole testing the LP Fault to date.

Table 2: Drill results from the “Gap” area of the Northwestern LP Fault drill grid.

Drill Hole


From (m)

To (m)

Width* (m)

Gold (g/t)

Section

BR-350


138.00

187.50

49.50

0.40

21650


including

144.00

171.00

27.00

0.50


BR-351


97.00

105.00

8.00

0.43

21600

BR-352


66.00

80.75

14.75

0.65

21525


and

116.30

129.00

12.70

0.51


and

133.85

138.10

4.25

2.76


and

144.50

145.50

1.00

4.36


BR-353


231.50

271.70

40.20

0.52

21525


including

241.70

243.30

1.60

5.96


BR-354


235.10

236.60

1.50

3.20

21525


and

256.80

324.10

67.30

0.31


BR-355


165.00

196.90

31.90

0.59

21450


and

271.50

272.50

1.00

31.40


BR-356


118.20

155.00

36.80

0.67

21450


and

170.55

174.00

3.45

2.36


including

170.55

171.00

0.45

8.35


BR-357

Anomalous


21425

BR-358


85.10

131.00

45.90

0.50

21400


and

192.70

193.55

0.85

6.96


BR-359


203.75

253.00

49.25

0.31

21400

BR-410


190.80

191.80

1.00

3.73

21325


and

295.50

361.90

66.40

0.32


and

367.00

394.50

27.50

1.29


and including

386.10

386.70

0.60

23.80


*Represents core length. True mineralization widths range between 65- 95% of reported intervals as they are determined by both structural analyses obtained from oriented drill core data and orientations of individual high grade domains and bulk tonnage domains.  Mineralized domains vary in strike between 340 to 270 degrees and dip between 85 to 65 degrees to the north.  All drillholes intersect both high grade and bulk tonnage domains and often intersect multiple domains resulting in a range of true widths within the same drillhole.

“Viggo” Area Results

The most southeasterly kilometre is the least explored section of the Phase 1 drill grid, and is referred to as the “Viggo” area (October 30, 2019). 

Gold mineralization in the “Viggo” area is transitional between the disseminated, bulk tonnage style gold of the central LP Fault in the west, and mesothermal vein-hosted gold with significant mineralized plunges or “shoots” in the east, such as is observed at the adjacent Hinge zone on the Dixie property, and elsewhere in the Red Lake district.  An example of this mineralization is shown in Figure 4.

All (100%) of twenty new drill holes successfully intersected gold mineralization, including newly predicted high-grade gold plunges, which are the main exploration targets in this area.  Gold results and structural data collected from this drilling will be used to target additional high-grade gold plunges during Phase 2 drilling.

New results are provided in Table 3 and include:

  • Drill hole BR-343 intersected the near-surface projection of a high-grade plunge assaying 21.70 g/t gold over 1.25 metres from 27.50 to 28.75 metres downhole, within a broader interval of 6.73 g/t gold over 5.50 metres from 27.50 to 33.00 metres downhole.  Follow-up drilling down plunge from this discovery is now required.
  • Eight hundred fifty metres along strike to the southeast, drill hole BR-371 intersected the at-depth projection of a separate high-grade plunge assaying 64.30 g/t gold over 0.55 metres from 334.75 to 335.30 metres downhole, within a broader interval of 5.90 g/t gold over 8.25 metres from 334.75 to 343.00 metres downhole.
  • BR-371 is the down-plunge continuation of gold mineralization first intersected in drill hole BR-057 (February 13, 2020), which assayed 38.03 g/t gold over 0.50 metres, within a broader interval of 7.35 g/t gold over 3.50 metres.  Additional up- and down-plunge drilling of this discovery is now required.
  • Many of the drill holes in the Viggo area contain multiple gold-bearing vein-like intervals which define priority targets for follow-up drilling.  Great Bear will test for potential structurally thickened plunging zones like those observed in BR-343 and BR-371 in these areas. An example from this release is drill hole BR-343 which intersected three mineralized vein-like intervals assaying 6.14 g/t gold over 0.50 metres from 34.05 to 34.55 metres downhole, 6.61 g/t gold over 0.95 metres from 79.85 to 80.80 metres downhole, and 10.20 g/t gold over 0.55 metres from 174.10 to 174.65 metres downhole. 
  • Other drilling in this area targeted shallow bulk-tonnage style gold mineralization immediately east of the central LP Fault zone, which will inform ongoing resource modeling.  New results include BR-341 which assayed 2.66 g/t gold over 20.90 metres from 61.50 to 82.40 metres downhole.
  • Drill density is currently limited in the Viggo area.  Additional drilling will be required during the Phase 2 program to further define the bulk tonnage style and high-grade gold in this area, and to explore for additional vein-like high-grade gold plunges.

Figure 4: Cross section 18750 located in the southeastern “Viggo” area of the Phase 1 drill grid.  The mineralized zone intersected in BR-371 and BR-057 plunges towards the west, into this view.  Drill core photos are of selected intervals and are not representative of all gold mineralization on the property. Assay results from past drilling are also provided in the included table.

Table 3: Drill results from the southeastern “Viggo” area.

Drill Hole


From (m)

To (m)

Width* (m)

Gold (g/t)

Section

BR-341


49.10

57.00

7.90

2.57

19750


including

52.50

57.00

4.50

4.26


and

61.50

82.40

20.90

2.66


BR-342


34.05

34.55

0.50

6.14

19700


and

79.85

80.80

0.95

6.61


and

174.10

174.65

0.55

10.20


BR-403


166.55

174.00

7.45

1.25

19700


including

173.25

174.00

0.75

9.38


and

302.95

311.50

8.55

0.41


BR-404


193.10

204.00

10.90

0.27

19700


and

212.00

223.50

11.50

0.18


and

256.80

276.70

19.90

0.55


including

270.00

270.70

0.70

3.31


BR-344


38.65

39.15

0.50

2.73

19675


and

173.60

185.25

11.65

0.30


and

215.65

220.35

4.70

0.28


BR-343


27.50

33.00

5.50

6.73

19625


including

27.50

28.75

1.25

21.70


and

155.00

156.00

1.00

4.61


BR-401


285.45

286.35

0.90

7.15

19600

BR-400


217.50

218.00

0.50

3.28

19575

BR-347


108.10

115.10

7.00

0.71

19525

BR-349


170.50

171.50

1.00

6.57

19500

BR-402


256.10

257.10

1.00

4.07

19475


and

269.70

270.20

0.50

4.51


BR-348


91.15

102.00

10.85

0.42

19450

BR-377


259.50

267.00

7.50

1.97

19050


including

261.00

261.60

0.60

16.10


BR-375


436.00

445.55

9.55

0.28

19000

BR-376A


354.25

357.10

2.85

2.00

18975

BR-373


471.60

472.70

1.10

3.32

18925


and

480.00

482.50

2.50

2.57


BR-370


282.35

283.60

1.25

11.85

18900


and

289.50

298.00

8.50

1.22


and including

289.50

290.25

0.75

9.19


BR-372


351.60

360.00

8.40

0.72

18850


including

351.90

352.80

0.90

3.53


and

367.55

368.05

0.50

11.30


BR-374


488.85

493.30

4.45

1.73

18850


including

489.70

490.30

0.60

8.90


BR-371


334.75

343.00

8.25

5.90

18775


including

334.75

335.30

0.55

64.30


*Represents core length. True mineralization widths range between 65- 95% of reported intervals as they are determined by both structural analyses obtained from oriented drill core data and orientations of individual high grade domains and bulk tonnage domains.  Mineralized domains vary in strike between 340 to 270 degrees and dip between 85 to 65 degrees to the north.  All drillholes intersect both high grade and bulk tonnage domains and often intersect multiple domains resulting in a range of true widths within the same drillhole.

Additional Drilling Peripheral to the LP Fault Zone

Fifteen of the 440 Phase 1 LP Fault drill holes were completed outside of the primary drill grid, up to 200 metres to the south of the zone at various locations along its strike length.  Results for these holes are available on the Company ‘s web site at www.greatbearresources.ca.  This drilling was undertaken to assess:

  1. The lateral extent of gold mineralization into the footwall of the LP Fault Zone host rocks,
  2. Geotechnical considerations such as rock density, competency and geochemistry that will be integrated into resource modeling, and
  3. Condemnation drilling that will be integrated into advanced project planning.

Bulk disseminated gold mineralization at the LP Fault generally lacks discrete boundaries and decreases in intensity with increasing distance from the centre of the zone.  As such, despite not targeting the LP Fault zone, all 15 (100%) of the drill holes completed into the periphery of the system still contained anomalous to low-grade gold over various interval widths.

Examples include peripheral drill holes BR-329a which intersected 0.22 g/t gold over 12.30 metres from 64.90 to 77.20 metres downhole, BR-345 which intersected 0.18 g/t gold over 16.35 metres from 21.60 to 37.95 metres downhole, and BR-405 which intersected 0.14 g/t gold over 14.10 metres from 40.90 to 55.00 metres downhole.

Peripheral drill hole BR-380 intersected high-grade gold assaying 23.50 g/t gold over 0.50 metres from 16.55 to 17.05 metres at bedrock surface.  While the hole was drilled away from system, it was collared in the footwall of high-grade zone BR7 (May 19, 2021), and hence intersected a portion of the high-grade domain prior to exiting the system.

On a go-forward basis, drill holes completed outside the LP Fault and other gold zones will be included in a separate table in the data download section of Great Bear’s website.  All LP Fault drill hole highlighted assays, plus drill collar locations and orientations can be downloaded at the Company’s web site.

Drill collar location, azimuth and dip for drill holes targeting the LP Fault zone included in this release are provided in the table below (UTM zone 15N, NAD 83):

Hole ID

Easting

Northing

Elevation

Length

Dip

Azimuth

BR-307

455817

5635200

375

519

-57

227

BR-308

455740

5635191

376

493

-60

227

BR-333

455801

5634900

373

282

-62

222

BR-334

455901

5634950

373

385

-56

222

BR-335

455955

5634906

372

327

-60

223

BR-336

456017

5634922

372

429

-60

221

BR-337

455974

5634868

372

345

-58

223

BR-338

455923

5634828

372

342

-59

214

BR-341

457797

5633930

364

435

-56

209

BR-342

457807

5633855

365

357

-55

208

BR-343

457873

5633787

363

327

-55

207

BR-344

457825

5633807

364

237

-55

209

BR-347

457955

5633730

362

330

-55

210

BR-348

458027

5633717

361

258

-55

211

BR-349

458012

5633799

368

378

-55

210

BR-350

455977

5634606

369

394

-49

39

BR-351

456027

5634582

369

426

-49

39

BR-352

456104

5634532

364

506

-52

37

BR-353

456076

5634490

365

473

-49

40

BR-354

456033

5634433

369

594

-48

39

BR-355

456106

5634447

358

561

-47

39

BR-356

456133

5634459

364

336

-44

38

BR-357

456203

5634502

363

231

-47

36

BR-358

456192

5634448

363

330

-50

37

BR-359

456149

5634403

367

594

-48

37

BR-360

455595

5635046

376

204

-61

227

BR-361

455585

5635497

383

582

-58

225

BR-362

455531

5635440

385

510

-59

224

BR-363

455489

5635381

384

345

-58

225

BR-364

455451

5635336

384

343

-58

225

BR-365

455726

5635551

382

723

-57

225

BR-366

455637

5635459

381

618

-58

223

BR-367

455687

5635426

379

579

-58

227

BR-368

455578

5635311

380

380

-63

226

BR-369

455656

5635260

378

387

-55

227

BR-370

458631

5633678

357

435

-56

210

BR-371

458787

5633652

358

453

-55

210

BR-372

458727

5633695

359

473

-55

212

BR-373

458723

5633841

360

609

-54

216

BR-374

458766

5633800

357

617

-56

213

BR-375

458620

5633844

360

570

-56

214

BR-376A

458583

5633766

358

489

-55

212

BR-377

458494

5633710

360

399

-55

211

BR-391

455720

5634953

376

303

-61

223

BR-392

455775

5635011

376

378

-61

224

BR-393

455818

5635062

374

465

-61

226

BR-394

455847

5635114

375

513

-62

222

BR-395

455751

5635052

374

390

-62

225

BR-396

455660

5635081

376

312

-61

227

BR-397

455679

5634990

375

306

-61

226

BR-400

457965

5633859

368

354

-55

211

BR-401

457961

5633926

369

420

-55

209

BR-402

458068

5633865

366

411

-55

208

BR-403

457857

5633935

364

450

-55

211

BR-404

457902

5634015

364

480

-54

209

BR-410

456193

5634289

369

678

-47

35

BR-420

455687

5635281

377

435

-57

229

About the Dixie Project

The 100% owned flagship Dixie project boasts one of the largest recent gold discoveries in a Canadian mining jurisdiction.  Proximal to major infrastructure near the town of Red Lake, Ontario, the Dixie property comprises over 91.4 square kilometres of contiguous claims that extend over 22 kilometres with a paved highway and provincial power and natural gas lines.  The property also hosts a network of well-maintained logging roads which facilitate access.

To date, Great Bear has completed a total of 630 drill holes (283,000 metres), identifying three high-grade gold discoveries.  The most significant discovery is the large-scale “LP Fault” zone, which comprises high-grade disseminated gold mineralization within broad moderate-to-lower-grade envelopes in felsic volcanic and sediment units.  LP Fault drilling has identified gold mineralization along 11 kilometres of strike length to date, and a detailed drill grid is being completed along approximately 4 kilometres of strike length.  The nearby “Hinge” and “Limb” gold zones are more characteristic of the renowned Red Lake mined deposits, comprising gold-bearing quartz veins and silica-sulphide replacement zones hosted by mafic volcanic units.  Over 80% of the Company’s drill holes into the LP Fault, Dixie Limb and Hinge zones contain visible gold mineralization.  Gold occurs mainly as free gold, neither bound to nor within sulphide minerals.

Great Bear adheres to industry-leading quality assurance / quality control (QA/QC) practices in data collection, analysis and disclosure, and detailed assays including all historical LP Fault drill hole data are available on the Company’s website at https://greatbearresources.ca/projects/overview/dixie-project-data/.

About Great Bear

Great Bear Resources Ltd. is a Vancouver-based gold exploration company focused on advancing its 100% owned Dixie project in Northwestern Ontario, Canada.  A significant exploration drill program is currently underway to define the mineralization within a large-scale, high-grade disseminated gold discovery made in 2019, the LP Fault.  Additional exploration drilling is also in progress to expand and infill nearby high-grade gold zones, as well as to test new regional targets.  The Company is currently in the process of compiling all historical data together with incoming assay results, with the goal of publishing an initial NI 43-101 compliant multi-million ounce mineral resource estimate for the Dixie project in early 2022. 

Great Bear is a committed partner to all stakeholders, with a long-term vision of sustainable exploration to advance the Dixie project in a manner that demonstrates good stewardship of land, operational excellence and accountability.

QA/QC and Core Sampling Protocols

Drill core is logged and sampled in a secure core storage facility located in Red Lake Ontario.  Core samples from the program are cut in half, using a diamond cutting saw, and are sent to Activation Laboratories in Ontario, an accredited mineral analysis laboratory, for analysis. All samples are analysed for gold using standard Fire Assay-AA techniques. Samples returning over 10.0 g/t gold are analysed utilizing standard Fire Assay-Gravimetric methods.  Pulps from approximately 5% of the gold mineralized samples are submitted for check analysis to a second lab.  Selected samples are also chosen for duplicate assay from the coarse reject of the original sample.  Selected samples with visible gold are also analyzed with a standard 1 kg metallic screen fire assay.  Certified gold reference standards, blanks and field duplicates are routinely inserted into the sample stream, as part of Great Bear’s quality control/quality assurance program (QAQC).  No QAQC issues were noted with the results reported herein. 

Qualified Person and NI 43-101 Disclosure

Mr. R. Bob Singh, P.Geo, VP Exploration, and Ms. Andrea Diakow P.Geo, VP Projects for Great Bear are the Qualified Persons as defined by National Instrument 43-101 responsible for the accuracy of technical information contained in this news release.

ON BEHALF OF THE BOARD

“Chris Taylor”

Chris Taylor, President and CEO

Investor Inquiries:
Ms. Jenni Piette,
Director, Sustainability and Stakeholder Relations
Tel: 604-646-8354
info@greatbearresources.ca
www.greatbearresources.ca

Cautionary note regarding forward-looking statements

This release contains certain “forward looking statements” and certain “forward-looking information” as defined under applicable Canadian and U.S. securities laws. Forward-looking statements and information can generally be identified by the use of forward-looking terminology such as “may”, “will”, “should”, “expect”, “intend”, “estimate”, “anticipate”, “believe”, “continue”, “plans” or similar terminology. The forward-looking information contained herein is provided for the purpose of assisting readers in understanding management’s current expectations and plans relating to the future. Readers are cautioned that such information may not be appropriate for other purposes.

Forward-looking information are based on management of the parties’ reasonable assumptions, estimates, expectations, analyses and opinions, which are based on such management’s experience and perception of trends, current conditions and expected developments, and other factors that management believes are relevant and reasonable in the circumstances, but which may prove to be incorrect.

Such factors, among other things, include: impacts arising from the global disruption caused by the Covid-19 coronavirus outbreak, business integration risks; fluctuations in general macroeconomic conditions; fluctuations in securities markets; fluctuations in spot and forward prices of gold or certain other commodities; change in national and local government, legislation, taxation, controls, regulations and political or economic developments; risks and hazards associated with the business of mineral exploration, development and mining (including environmental hazards, industrial accidents, unusual or unexpected formations pressures, cave-ins and flooding); discrepancies between actual and estimated metallurgical recoveries; inability to obtain adequate insurance to cover risks and hazards; the presence of laws and regulations that may impose restrictions on mining; employee relations; relationships with and claims by local communities and indigenous populations; availability of increasing costs associated with mining inputs and labour; the speculative nature of mineral exploration and development (including the risks of obtaining necessary licenses, permits and approvals from government authorities); and title to properties.

Great Bear undertakes no obligation to update forward-looking information except as required by applicable law. Such forward-looking information represents management’s best judgment based on information currently available. No forward-looking statement can be guaranteed and actual future results may vary materially. Accordingly, readers are advised not to place undue reliance on forward-looking statements or information.


Schwazze (SHWZ) – The Acquisition Beat Goes On

Wednesday, August 25, 2021

Schwazze (SHWZ)
The Acquisition Beat Goes On

Medicine Man Technologies, Inc. is now operating under its new trade name, Schwazze. Schwazze is executing its strategy to become a leading vertically integrated cannabis holding company with a portfolio consisting of top-tier licensed brands spanning cultivation, extraction, infused-product manufacturing, dispensary operations, consulting, and a nutrient line. Schwazze leadership includes Colorado cannabis leaders with proven expertise in product and business development as well as top-tier executives from Fortune 500 companies. As a leading platform for vertical integration, Schwazze is strengthening the operational efficiency of the cannabis industry in Colorado and beyond, promoting sustainable growth and increased access to capital, while delivering best-quality service and products to the end consumer. The corporate entity continues to be named Medicine Man Technologies, Inc.

Joe Gomes, Senior Research Analyst, Noble Capital Markets, Inc.

Refer to the full report for the price target, fundamental analysis, and rating.

    More Cultivation Expansion. Schwazze has entered into an agreement to acquire the assets of Brow 2 LLC. Denver-based Brow 2 operates a 37,000 sq. ft. building, including 27,000 sq. ft. of canopy, for indoor cultivation and related equipment. Brow 2 adds high-quality flower cultivation capacity and new strain genetics to Schwazze’s portfolio. The price for the acquisition is $6.7 million to be paid in cash at closing, which is expected before the end of the third quarter of 2021.

    More to Come? We believe Schwazze will continue to target expansion on the cultivation side as ownership of production provides the Company with a controlled source of differentiated product for both its retail and wholesale operations as well as a better overall margin profile than outsourced product.  Schwazze’s integrated operating capabilities provide a cost advantage over mom and pop operators …


This Company Sponsored Research is provided by Noble Capital Markets, Inc., a FINRA and S.E.C. registered broker-dealer (B/D).

*Analyst certification and important disclosures included in the full report. NOTE: investment decisions should not be based upon the content of this research summary.  Proper due diligence is required before making any investment decision.