Release – PLBY Group Closes Previously Announced Acquisition of Honey Birdette


PLBY Group Closes Previously Announced Acquisition of Honey Birdette


LOS ANGELES, Aug. 10, 2021 (GLOBE NEWSWIRE) — PLBY Group, Inc. (NASDAQ: PLBY) (“PLBY Group” or the “Company”), a leading pleasure and leisure lifestyle company and owner of Playboy, one of the most recognizable and iconic brands in the world, today announced the completion of its previously announced deal to acquire Australia-based Honey Birdette, the fast-growing, luxury lingerie and lifestyle brand.

The acquisition of 100% of the equity of Honey Birdette was completed for consideration of $235 million in cash and 2.16 million shares of PLBY Group stock. Honey Birdette generated $71 million of revenue and $17.6 million of net income for the twelve months ended June 30, 2021, representing growth of over 42% and 187%, respectively, over the prior year period.

Ben Kohn, Chief Executive Officer of PLBY Group, commented, “We are thrilled to officially welcome the Honey Birdette team to PLBY Group. This transaction will play a key role in the acceleration of our company’s expansion into new territories and product categories, specifically bolstering product design, sourcing and direct-to-consumer capabilities across our lingerie, loungewear, swimwear, sexual wellness and essentials collections. We see enormous organic growth prospects for both the Honey Birdette brand and the new Playboy-branded female focused lifestyle collections we will bring to market powered by Honey Birdette’s superior infrastructure.”

Eloise Monaghan, Founder and Managing Director of Honey Birdette, commented, “Today is a proud day for us as we officially join forces with one of the world’s most iconic brands and the lifestyle platform it represents. PLBY Group’s commitment to sexual wellness and female empowerment is everything that Honey Birdette embraces, and this partnership will help transform the company into one of the leading global lingerie and lifestyle platforms.”

About PLBY Group, Inc.

PLBY Group, Inc. connects consumers around the world with products, services, and experiences to help them look good, feel good, and have fun. PLBY Group serves consumers in four major categories: Sexual Wellness, Style & Apparel, Gaming & Lifestyle, and Beauty & Grooming. PLBY Group’s flagship consumer brand, Playboy, is one of the most recognizable, iconic brands in the world, driving billions of dollars in global consumer spending annually across approximately 180 countries. Learn more at http://www.plbygroup.com.

Forward-Looking Statements

This press release includes “forward-looking statements” within the meaning of the “safe harbor” provisions of the United States Private Securities Litigation Reform Act of 1995. The Company’s actual results may differ from their expectations, estimates, and projections and, consequently, you should not rely on these forward-looking statements as predictions of future events. Words such as “expect,” “estimate,” “project,” “budget,” “forecast,” “anticipate,” “intend,” “plan,” “may,” “will,” “could,” “should,” “believes,” “predicts,” “potential,” “continue,” and similar expressions (or the negative versions of such words or expressions) are intended to identify such forward-looking statements. These forward-looking statements include, without limitation, the Company’s expectations with respect to future performance, growth plans and anticipated financial impacts of its acquisitions.

These forward-looking statements involve significant risks and uncertainties that could cause the actual results to differ materially from those discussed in the forward-looking statements. Factors that may cause such differences include, but are not limited to: (1) the impact of the COVID-19 pandemic on the Company’s business and acquisitions; (2) the inability to maintain the listing of the Company’s shares of common stock on Nasdaq; (3) the risk that the business combination, recent acquisitions or any proposed transactions disrupt the Company’s current plans and/or operations, including the risk that the Company does not complete any such proposed transactions or achieve the expected benefits from them; (4) the ability to recognize the anticipated benefits of the business combination, acquisitions, commercial collaborations, commercialization of digital assets and proposed transactions, which may be affected by, among other things, competition, the ability of the Company to grow and manage growth profitably, and retain its key employees; (5) costs related to being a public company, acquisitions, commercial collaborations and proposed transactions; (6) changes in applicable laws or regulations; (7) the possibility that the Company may be adversely affected by other economic, business, and/or competitive factors; (8) risks relating to the uncertainty of the projected financial information of the Company; (9) risks related to the organic and inorganic growth of the Company’s business and the timing of expected business milestones; and (10) other risks and uncertainties indicated from time to time in the Company’s annual report on Form 10-K, including those under “Risk Factors” therein, and in the Company’s other filings with the Securities and Exchange Commission. The Company cautions that the foregoing list of factors is not exclusive, and readers should not place undue reliance upon any forward-looking statements, which speak only as of the date which they were made. The Company does not undertake any obligation to update or revise any forward-looking statements to reflect any change in its expectations or any change in events, conditions, or circumstances on which any such statement is based.

Contact:

Investors: investors@plbygroup.com
Media: press@plbygroup.com

Release – PLBY Group Reports Second Quarter 2021 Financial Results


PLBY Group Reports Second Quarter 2021 Financial Results


Second Quarter 2021 Revenue Grew 44% Year-Over-Year to $49.9 Million

LOS ANGELES, Aug. 10, 2021 (GLOBE NEWSWIRE) — PLBY Group, Inc. (NASDAQ: PLBY) (“PLBY Group” or the “Company”), a leading pleasure and leisure lifestyle company and owner of Playboy, one of the most recognizable and iconic brands in the world, today provided financial results for the second quarter ended June 30, 2021.

Ben Kohn, Chief Executive Officer of PLBY Group, stated, “We are pleased to report another successful quarter that demonstrates the powerful combination of our growing direct-to-consumer business, an optimized licensing operation and scalable digital offerings. On the direct-to-consumer side, we saw great traction on Playboy.com with expanded merchandise offerings and strategic influencer marketing. In addition, the second quarter marked continued strong performance in our licensing business and our entry into blockchain-powered offerings with our first NFT collection.”

Mr. Kohn continued, “We are also very excited by our acquisition of Honey Birdette, the fast-growing, luxury lingerie and lifestyle brand. We are eager to integrate Honey Birdette’s operations into our direct-to-consumer infrastructure and to help accelerate the high-end brand’s growth in new regions. The Honey Birdette team brings immense experience in product design, sourcing and direct-to-consumer strategies that will contribute to our work building the leading global pleasure and leisure lifestyle platform.”

Second Quarter 2021 Financial Highlights

  • Revenue grew 44% year-over-year, to $49.9 million, driven by growth in both direct-to-consumer and licensing revenues.
  • Direct-to-consumer revenue grew 88% year-over-year, to $28.0 million, and licensing revenue grew 12% year-over-year, to $15.4 million.
  • Net loss was $8.9 million, largely driven by $7.9 million of non-recurring expenses related to the acquisition of Honey Birdette, refinancing of debt, and amortization of a one-time non-cash inventory valuation step-up as part of the purchase accounting resulting from the acquisition of Lovers in March 2021.
  • Adjusted EBITDA was $5.9 million and was impacted by a full quarter of public company expenses, in addition to technology investments being made to provide a superior and unified direct-to-consumer experience.

Webcast Details
The Company will host a webcast at 5:00 p.m. Eastern Time today to discuss the second quarter 2021 financial results. Participants may access the live webcast on the events section of the PLBY Group, Inc. Investor Relations website at https://www.plbygroup.com/investors/events-and-presentations.

About PLBY Group, Inc.
PLBY Group connects consumers around the world with products, services, and experiences to help them look good, feel good, and have fun. PLBY Group serves consumers in four major categories: Sexual Wellness, Style & Apparel, Gaming & Lifestyle, and Beauty & Grooming. PLBY Group’s flagship consumer brand, Playboy, is one of the most recognizable, iconic brands in the world, driving billions of dollars in consumer spending annually across approximately 180 countries. Learn more at http://www.plbygroup.com.

Forward-Looking Statements
This press release includes “forward-looking statements” within the meaning of the “safe harbor” provisions of the United States Private Securities Litigation Reform Act of 1995. The Company’s actual results may differ from their expectations, estimates, and projections and, consequently, you should not rely on these forward-looking statements as predictions of future events. Words such as “expect,” “estimate,” “project,” “budget,” “forecast,” “anticipate,” “intend,” “plan,” “may,” “will,” “could,” “should,” “believes,” “predicts,” “potential,” “continue,” and similar expressions (or the negative versions of such words or expressions) are intended to identify such forward-looking statements. These forward-looking statements include, without limitation, the Company’s expectations with respect to future performance, growth plans and anticipated financial impacts of its acquisitions.

These forward-looking statements involve significant risks and uncertainties that could cause the actual results to differ materially from those discussed in the forward-looking statements. Factors that may cause such differences include, but are not limited to: (1) the impact of the COVID-19 pandemic on the Company’s business and acquisitions; (2) the inability to maintain the listing of the Company’s shares of common stock on Nasdaq; (3) the risk that the business combination, recent acquisitions or any proposed transactions disrupt the Company’s current plans and/or operations, including the risk that the Company does not complete any such proposed transactions or achieve the expected benefits from them; (4) the ability to recognize the anticipated benefits of the business combination, acquisitions, commercial collaborations, commercialization of digital assets and proposed transactions, which may be affected by, among other things, competition, the ability of the Company to grow and manage growth profitably, and retain its key employees; (5) costs related to being a public company, acquisitions, commercial collaborations and proposed transactions; (6) changes in applicable laws or regulations; (7) the possibility that the Company may be adversely affected by other economic, business, and/or competitive factors; (8) risks relating to the uncertainty of the projected financial information of the Company; (9) risks related to the organic and inorganic growth of the Company’s business and the timing of expected business milestones; and (10) other risks and uncertainties indicated from time to time in the Company’s annual report on Form 10-K, including those under “Risk Factors” therein, and in the Company’s other filings with the Securities and Exchange Commission. The Company cautions that the foregoing list of factors is not exclusive, and readers should not place undue reliance upon any forward-looking statements, which speak only as of the date which they were made. The Company does not undertake any obligation to update or revise any forward-looking statements to reflect any change in its expectations or any change in events, conditions, or circumstances on which any such statement is based.

Contact:

Investors: investors@plbygroup.com
Media: press@plbygroup.com


PLBY Group, Inc.        
Condensed Consolidated Statements of Operations
(Unaudited)
(in thousands)

  Three Months Ended
June 30,
  Six Months Ended
June 30,
  2021   2020   2021   2020
Net revenues $ 49,851     $ 34,557     $ 92,531     $ 66,331  
Costs and expenses              
Cost of sales (23,675 )   (19,096 )   (42,699 )   (35,648 )
Selling and administrative expenses (29,615 )   (13,277 )   (57,561 )   (25,727 )
Related party expenses     (250 )   (250 )   (500 )
Total costs and expenses (53,290 )   (32,623 )   (100,510 )   (61,875 )
Operating (loss) income (3,439 )   1,934     (7,979 )   4,456  
Nonoperating income (expense):              
Interest expense (2,253 )   (3,314 )   (5,550 )   (6,656 )
Loss on extinguishment of debt (1,217 )       (1,217 )    
Other (expense) income, net (3 )   42     742     29  
Total nonoperating expense (3,473 )   (3,272 )   (6,025 )   (6,627 )
Loss before income taxes (6,912 )   (1,338 )   (14,004 )   (2,171 )
Benefit (expense) from income taxes (2,003 )   (2,278 )   91     (3,854 )
Net loss (8,915 )   (3,616 )   (13,913 )   (6,025 )
Net loss attributable to redeemable noncontrolling interest              
Net loss attributable to PLBY Group, Inc. $ (8,915 )   $ (3,616 )   $ (13,913 )   $ (6,025 )
Net loss per share, basic and diluted $ (0.24 )   $ (0.16 )   $ (0.42 )   $ (0.27 )
Weighted-average shares used in computing net loss per share, basic and diluted 36,736,446     22,199,098     33,298,957     22,093,444  


PLBY Group, Inc.
Condensed Consolidated Balance Sheets
(in thousands, except share and per share amounts)

  June 30,
2021
  December 31,
2020
  (Unaudited)    
Assets      
Current assets:      
Cash and cash equivalents $ 255,529       $ 13,430    
Restricted cash       2,130    
Receivables, net of allowance for doubtful accounts 6,770       6,601    
Inventories, net 18,263       11,788    
Stock receivable       4,445    
Prepaid expenses and other current assets 14,215       8,822    
Total current assets 294,777       47,216    
Restricted cash 2,130          
Property and equipment, net 20,925       5,203    
Intangible assets, net 342,812       339,032    
Goodwill 16,814       504    
Contract assets, net of current portion 14,667       7,159    
Other noncurrent assets 12,658       13,013    
Total assets $ 704,783       $ 412,127    
Liabilities and Stockholders’ Equity      
Current liabilities:      
Accounts payable $ 15,467       $ 8,678    
Accrued salaries, wages, and employee benefits 2,377       4,870    
Deferred revenues, current portion 10,644       11,159    
Long-term debt, current portion 2,093       4,470    
Convertible promissory notes       6,230    
Other current liabilities and accrued expenses 19,359       18,556    
Total current liabilities 49,940       53,963    
Deferred revenues, net of current portion 42,891       43,792    
Long-term debt, net of current portion 159,438       154,230    
Deferred tax liabilities, net 73,797       74,909    
Other noncurrent liabilities 5,160       2,422    
Total liabilities 331,226       329,316    
Commitments and contingencies (Note 13)      
Redeemable noncontrolling interest (208 )     (208 )  
Stockholders’ equity:      
Common stock, $0.0001 par value per share, 150,000,000 shares authorized, 39,228,956 shares issued and 38,528,956 shares outstanding as of June 30, 2021; 20,626,249 shares issued and outstanding as of December 31, 2020 4       2    
Treasury stock, at cost, 700,000 shares and 0 shares as of June 30, 2021 and December 31, 2020 (4,445 )        
Additional paid-in capital 470,134       161,033    
Accumulated deficit (91,928 )     (78,016 )  
Total stockholders’ equity 373,765       83,019    
Total liabilities, redeemable noncontrolling interest, and stockholders’ equity $ 704,783       $ 412,127    

EBITDA Reconciliation

This release presents the financial measure earnings before interest, taxes, depreciation and amortization, or “EBITDA”, and Adjusted EBITDA, which are not financial measures under the accounting principles generally accepted in the United States of America (“GAAP”). “EBITDA” is defined as net income or loss before interest, income tax expense or benefit, and depreciation and amortization. “Adjusted EBITDA” is defined as EBITDA adjusted for stock-based compensation and other special items determined by management. Adjusted EBITDA is intended as a supplemental measure of our performance that is neither required by, nor presented in accordance with, GAAP. We believe that the use of EBITDA and Adjusted EBITDA provides an additional tool for investors to use in evaluating ongoing operating results and trends and in comparing our financial measures with those of comparable companies, which may present similar non-GAAP financial measures to investors. However, investors should be aware that when evaluating EBITDA and Adjusted EBITDA, we may incur future expenses similar to those excluded when calculating these measures. In addition, our presentation of these measures should not be construed as an inference that our future results will be unaffected by unusual or nonrecurring items. Our computation of Adjusted EBITDA may not be comparable to other similarly titled measures computed by other companies, because all companies may not calculate Adjusted EBITDA in the same fashion.

In addition to adjusting for non-cash stock-based compensation, we typically adjust for nonoperating expenses and income, such as management fees paid to our largest stockholder, merger related bonus payments, non-recurring special projects including the implementation of internal controls, expenses associated with financing activities, acquisition related inventory step-up amortization and costs, the expense associated with reorganization and severance resulting in the elimination or rightsizing of specific business activities or operations as we transform from a print and digital media business to a commerce centric business.

Because of these limitations, EBITDA and Adjusted EBITDA should not be considered in isolation or as a substitute for performance measures calculated in accordance with GAAP. We compensate for these limitations by relying primarily on our GAAP results and using EBITDA and Adjusted EBITDA on a supplemental basis. Investors should review the reconciliation of net loss to EBITDA and Adjusted EBITDA below and not rely on any single financial measure to evaluate our business.

The following table reconciles the Company’s net loss to EBITDA and Adjusted EBITDA:


GAAP Net Loss to Adjusted EBITDA Reconciliation
(Unaudited)
(in thousands)

  Three Months Ended June 30,   Six Months Ended June 30,
  2021   2020   2021   2020
Net loss $ (8,915 )   $ (3,616 )   $ (13,913 )   $ (6,025 )
Adjusted for:              
Interest expense 2,253     3,314     5,550     6,656  
Loss on extinguishment of debt 1,217         1,217      
Provision for income taxes 2,003     2,278     (91 )   3,854  
Depreciation and amortization 1,034     533     1,762     1,174  
EBITDA (2,408 )   2,509     (5,475 )   5,659  
Adjusted for:              
Stock-based compensation 361     1,345     3,859     2,094  
Reduction in force expenses     1,780         2,777  
Nonrecurring items 1,460     117     7,500     117  
Amortization of inventory step-up 2,250     1,615     2,250     3,230  
Management fees and expenses     250     250     500  
Nonoperating expenses     44         102  
Acquisition related costs 4,218         4,218      
Adjusted EBITDA $ 5,881     $ 7,660     $ 12,602     $ 14,479  


Release – Neovasc Announces Second Quarter 2021 Financial Results


Neovasc Announces Second Quarter 2021 Financial Results


VANCOUVER and MINNEAPOLIS – (NewMediaWire) – August 10, 2021 – Neovasc, Inc. (“Neovasc” or the “Company”) (NASDAQ, TSX: NVCN), today reported financial results for the second quarter ended June 30, 2021.

Second Quarter Highlights

  • Generated revenue of approximately $633,000 in the quarter, up 123% from the same period in 2020, and a sequential 40% increase from Q1 2021.
  • Streamlined strategic focus to pursue three value-creation strategies around Reducer and Tiara TA, suspending Tiara TF activity and reducing headcount by 40%.  These moves are expected to extend the Company’s cash runway into 2024.
  • Continued to execute a strategic focus of additional reimbursement agreements, announcing in June that Reducer had been granted the first national reimbursement from the National Health Service England.
  • Continued to pursue clinical studies supporting Reducer:
    • Advanced preparations for COSIRA II, the pivotal US trial for Reducer.  The Company expects to file an Investigational Device Exemption (IDE) Supplement with the FDA in the third quarter.
    • Announced the first enrollment in the COSIMA trial in Germany, studying Reducer as a treatment for microvascular angina.

Neovasc enjoyed a strong second quarter and continued to make good progress on its value creation strategies.  During the quarter we made a strategic decision to streamline our focus on three value creation strategies, coupled with a significant corporate headcount reduction, which is expected to extend our cash runway for three years.  We followed up on these moves in July, adding a new VP of Clinical Affairs and a VP of Regulatory Affairs, Global Angina Therapies to strengthen our expertise in these important areas.  We are placing a heavy emphasis on expanding the market penetration of our CE-marked Reducer device in Europe, working directly with hospitals, cardiologists, and medical associations to raise awareness of the Reducer’s safety, efficacy, and ease of use,” said Fred Colen, President and Chief Executive Officer of Neovasc. Mr. Colen continued, “Our team is also working diligently to expand reimbursement for the Reducer device.  Those efforts were rewarded when Reducer was granted full reimbursement by the National Health Service (NHS) England, and we look forward to sharing news of more reimbursement decisions in the second half of the year. In the United States, we continue to prepare for our pivotal U.S. trial for Reducer and expect to file an IDE Supplement in the third quarter.  With respect to Tiara, we are working with our notified body in Europe to understand all specific requirements and leverage of work already performed, to pursue a CE mark decision for the Tiara TA device under MDR.  There is much more work to do, but we are confident that we now have the team in place and the financial security to successfully execute on our value creation strategies.”

Financial results for the second quarter ended June 30, 2021

Revenues increased 123% to approximately $633,000 for the quarter ended June 30, 2021, compared to revenues of approximately $284,000 for the same period in 2020. 

The cost of goods sold for the three months ended June 30, 2021, was approximately $109,000, compared to $75,000 for the same period in 2020. The overall gross margin for the quarter ended June 30, 2021, was 83%, compared to 74% gross margin for the same period in 2020.

Total expenses for the quarter ended June 30, 2021, were $9.6 million compared to $8.9 million for the same period in 2020, representing an increase of approximately $748,000 or 8%.  The increase in total expenses can be substantially explained by the following non-cash charges; a $1.0 million increase in non-cash share-based payments and an approximate $903,000 charge related to the decision to pause the development of the Tiara TF device ($594,000 impairment charge due to fixed assets obsolescence, and $309,000 charge for employee termination expenses).  This increase in non-cash charges was offset by a $1.1 million decrease in cash-based employee expenses due to the Company’s reductions in force in December 2020 and June 2021.

Operating losses and comprehensive losses for the quarter ended June 30, 2021, were $9.1 million and $9.3 million, respectively, or $0.13 basic and diluted loss per share, as compared with $8.7 million operating losses and $12.2 million comprehensive losses, or $0.81 basic and diluted loss per share, for the same period in 2020.

Conference Call and Webcast information

Neovasc will be hosting a conference call and audio webcast today at 4:30 pm ET to discuss these results.

Domestic:                  1-877-407-9208
International:            1-201-493-6784
Reference ID Code: 13721306

Parties wishing to access the call via webcast should use the link in the Investors section of the Neovasc website at https://www.neovasc.com/investors/.  A replay of the webcast will be available in the Investors sections of the website approximately 30 minutes after the conclusion of the call.

About Neovasc Inc.

Neovasc is a specialty medical device company that develops, manufactures, and markets products for the rapidly growing cardiovascular marketplace. The Company is a leader in the development of minimally invasive transcatheter mitral valve replacement technologies, and minimally invasive devices for the treatment of refractory angina. Its products include the Neovasc Reducer™, for the treatment of refractory angina, which is not currently commercially available in the United States (6 U.S. patients have been treated under Compassionate Use) and has been commercially available in Europe since 2015, and Tiara™, for the transcatheter treatment of mitral valve disease, which is currently under clinical investigation in the United States, Canada, Israel, and Europe. For more information, visit: www.neovasc.com.

NEOVASC INC.

Condensed Interim Consolidated Statements of Financial Position

(Expressed in U.S. dollars) (Unaudited)                                                                 

  June 30,
2021
December 31,
2020
 
         
ASSETS        
  Current assets      
    Cash and cash equivalents   $   63,294,878 $   12,935,860
    Accounts receivable    1,213,450 987,057
    Finance lease receivable    93,466 95,849
    Inventory    1,387,718 839,472
    Research and development supplies    11,852 167,378
    Prepaid expenses and other assets    969,740 705,471
  Total current assets    66,971,104      15,731,087
       
Non-current assets      
    Restricted cash    483,714           470,460
    Right-of-use asset    643,445           830,551
    Finance lease receivable      –               42,841
    Property and equipment    215,024           803,280
    Deferred loss on 2021 derivative warrant liabilities    12,705,147
  Total non-current assets    14,047,330 2,147,132
       
Total assets   $   81,018,434 $   17,878,219
       
LIABILITIES AND EQUITY      
  Liabilities      
  Current liabilities      
   Accounts payable and accrued liabilities   $     6,422,130  $     7,243,500
   Lease liabilities   290,957 342,910
   2019 Convertible notes   38,633 38,633
   2020 Convertible notes, warrants and derivative warrant liabilities   37,839 37,525
  Total current liabilities   6,789,559 7,662,568
       
  Non-current Liabilities      
   Lease liabilities   426,699 596,881
   2019 Convertible notes   6,544,895 6,156,724
   2020 Convertible notes, warrants and derivative warrant liabilities   2,077,415 1,484,529
   2021 Derivative warrant liabilities   1,745,600
Total non-current liabilities   10,794,609 8,238,134
       
Total liabilities   $   17,584,168 $   15,900,702
       
  Equity      
    Share capital   $ 439,679,546 $ 369,775,383
    Contributed surplus    38,783,708 35,045,056
    Accumulated other comprehensive loss    (8,601,354) (7,615,717)
    Deficit     (406,427,634) (395,227,205)
  Total equity   $   63,434,266 $      1,977,517
       
Total liabilities and equity   $   81,018,434 $   17,878,219


NEOVASC INC.

Condensed Interim Consolidated Statements of Loss and Comprehensive Loss

For the three and six months ended June 30, 2021 and 2020
(Expressed in U.S. dollars) (Unaudited)                                                                             

    For the three months ended
June 30
For the six months ended
June 30
    2021 2020 2021 2020
           
REVENUE   $     633,068 $     284,047 $  1,084,862 $     816,942
COST OF GOODS SOLD   109,106 74,669 181,499 199,232
GROSS PROFIT   523,962 209,378 903,363 617,710
           
EXPENSES          
Selling expenses    832,812 452,514 1,470,791 1,006,043
General and administrative expenses     5,042,804 3,825,510 10,335,373 6,313,012
Product development and clinical trials expenses      3,740,887 4,589,724 8,362,315 9,113,130
    9,616,503 8,867,748 20,168,479 16,432,185
           
OPERATING LOSS   (9,092,541) (8,658,370) (19,265,116) (15,814,475)
           
OTHER INCOME/(EXPENSE)          
Interest and other income    39,733 24,981  49,753 58,650
Interest and other expense    (278,154) (566,886)  (318,563) (537,550)
Gain/(loss) on foreign exchange    15,057 (125,002)  (20,238) (125,653)
Unrealized gain on warrants, derivative liability
warrants and convertible notes


2,809,340  369,849  15,259,393  3,502,831
Realized gain/(loss) on exercise or conversion of warrants, derivative liability warrants and convertible notes   219,307 (835,880)      (1,895,344)
 (979,630)
Amortization of deferred loss    (2,761,152) (135,082) (5,026,442) (135,082)
     44,131 (1,268,020) 8,048,559 1,783,566
LOSS BEFORE TAX   (9,048,410) (9,926,390) (11,216,557) (14,030,909)
           
Tax refund/(expense)   15,396               1,075             16,128             (5,997)
LOSS FOR THE PERIOD   $ (9,033,014) $   (9,925,315) $ (11,200,429) $ (14,036,906)
           
OTHER COMPREHENSIVE INCOME FOR THE
PERIOD
         
Fair market value changes in convertible notes due to changes in own credit risk   (280,051) (2,309,141) (985,637) (870,956)
LOSS AND OTHER COMPREHENSIVE LOSS FOR THE PERIOD    

$ (9,313,065)
 

$ (12,234,456)
 

$ (12,186,066)
 

$ (14,907,862)
           
LOSS PER SHARE          
Basic and diluted loss per share   $          (0.13)   $          (0.81)   $           (0.19) $            (1.21)


Investors
Mike Cavanaugh
Westwicke/ICR
Phone: +1.617.877.9641
Mike.Cavanaugh@westwicke.com

Media
Sean Leous
Westwicke/ICR
Phone: +1.646.677.1839
Sean.Leous@icrinc.com

Forward-Looking Statement Disclaimer

Certain statements in this news release contain forward-looking statements within the meaning of the U.S. Private Securities Litigation Reform Act of 1995 and applicable Canadian securities laws that may not be based on historical fact. When used herein, the words “expect”, “anticipate”, “estimate”, “may”, “will”, “should”, “intend,” “believe”, and similar expressions, are intended to identify forward-looking statements. Forward-looking statements may involve, but are not limited to, expectations as to the future growth of the Company, the expansion of reimbursement for the Reducer, the continued preparation for the US trial of the Reducer, the expectation to file an IDE Supplement in the third quarter, the pursual of a CE mark decision for the Tiara TA device under MDR and the growing cardiovascular marketplace. Many factors and assumptions could cause the Company’s actual results, performance or achievements to differ materially from those expressed or implied by the forward-looking statements, including, without limitation, the doubt about the Company’s ability to continue as a going concern; risks related to the recent COVID-19 coronavirus outbreak or other health epidemics, which could significantly impact the Company’s operations, sales or ability to raise capital or enroll patients in clinical trials and complete certain Tiara development milestones on the Company’s expected schedule; risks relating to the Company’s need for significant additional future capital and the Company’s ability to raise additional funding; risks relating to the sale of a significant number of Common Shares; risks relating to the possibility that the Company’s common shares (the “Common Shares”) may be delisted from the Nasdaq or the TSX, which could affect their market price and liquidity; risks relating to the Company’s conclusion that it did have effective internal control over financial reporting as of December 31, 2020 but not at December 31, 2019 and 2018; risks relating to the Common Share price being volatile; risks relating to the possibility that the Common Shares may be delisted from the Nasdaq or the TSX, which could affect their market price and liquidity; risks relating to the Company’s significant indebtedness, and its effect on the Company’s financial condition; risks relating to lawsuits that the Company is subject to, which could divert the Company’s resources and result in the payment of significant damages and other remedies; risks relating to claims by third-parties alleging infringement of their intellectual property rights; risks relating to the Company’s ability to establish, maintain and defend intellectual property rights in the Company’s products; risks relating to results from clinical trials of the Company’s products, which may be unfavorable or perceived as unfavorable; the Company’s history of losses and significant accumulated deficit; risks associated with product liability claims, insurance and recalls; risks relating to use of the Company’s products in unapproved circumstances, which could expose the Company to liabilities; risks relating to competition in the medical device industry, including the risk that one or more competitors may develop more effective or more affordable products; risks relating to the Company’s ability to achieve or maintain expected levels of market acceptance for the Company’s products, as well as the Company’s ability to successfully build its in-house sales capabilities or secure third-party marketing or distribution partners; risks relating to the Company’s ability to convince public payors and hospitals to include the Company’s products on their approved products lists; risks relating to new legislation, new regulatory requirements and the efforts of governmental and third-party payors to contain or reduce the costs of healthcare; risks relating to increased regulation, enforcement and inspections of participants in the medical device industry, including frequent government investigations into marketing and other business practices; risks relating to the extensive regulation of the Company’s products and trials by governmental authorities, as well as the cost and time delays associated therewith; risks relating to post-market regulation of the Company’s products; risks relating to health and safety concerns associated with the Company’s products and industry; risks relating to the Company’s manufacturing operations, including the regulation of the Company’s manufacturing processes by governmental authorities and the availability of two critical components of the Reducer; risks relating to the possibility of animal disease associated with the use of the Company’s products; risks relating to the manufacturing capacity of third-party manufacturers for the Company’s products, including risks of supply interruptions impacting the Company’s ability to manufacture its own products; risks relating to the Company’s dependence on limited products for substantially all of the Company’s current revenues; risks relating to the Company’s exposure to adverse movements in foreign currency exchange rates; risks relating to the possibility that the Company could lose its foreign private issuer status under U.S. federal securities laws; risks relating to the possibility that the Company could be treated as a “passive foreign investment company”; risks relating to breaches of anti-bribery laws by the Company’s employees or agents; risks relating to future changes in financial accounting standards and new accounting pronouncements; risks relating to the Company’s dependence upon key personnel to achieve its business objectives; risks relating to the Company’s ability to maintain strong relationships with physicians; risks relating to the sufficiency of the Company’s management systems and resources in periods of significant growth; risks relating to consolidation in the health care industry, including the downward pressure on product pricing and the growing need to be selected by larger customers in order to make sales to their members or participants; risks relating to the Company’s ability to successfully identify and complete corporate transactions on favorable terms or achieve anticipated synergies relating to any acquisitions or alliances; risks relating to conflicts of interests among the Company’s officers and directors as a result of their involvement with other issuers; and risks relating to anti­takeover provisions in the Company’s constating documents which could discourage a third-party from making a takeover bid beneficial to the Company’s shareholders. These risk factors and others relating to the Company are discussed in greater detail in the “Risk Factors” section of the Company’s Annual Information Form and in the Management’s Discussion and Analysis for the three and six months ended June 30, 2021 (copies of which may be obtained at www.sedar.com or www.sec.gov). The Company has no intention and undertakes no obligation to update or revise any forward-looking statements beyond required periodic filings with securities regulators, whether as a result of new information, future events or otherwise, except as required by law.

Release – Comtech Telecommunications Corp. Awarded $1.0 Million Contract for 5G Support with a Tier-One U.S. Carrier


Comtech Telecommunications Corp. Awarded $1.0 Million Contract for 5G Support with a Tier-One U.S. Carrier


MELVILLE, N.Y.–(BUSINESS WIRE)–Aug. 11, 2021– 
August 11, 2021 — 
Comtech Telecommunications Corp. (NASDAQ: CMTL), a global leading provider of next-generation 911 emergency systems and secure wireless communications technologies, announced today, that during its fourth quarter of fiscal 2021, it was awarded a contract for approximately 
$1.0 million for operations support features and enhancements supporting 5G applications with a major tier-one mobile network operator in 
the United States.

“Comtech is dedicated to supporting 5G technologies for our customers worldwide,” said  Fred Kornberg, Chairman of the Board and Chief Executive Officer of 
Comtech Telecommunications Corp. “Our long-term relationship with this customer demonstrates their trust in us to support them through the next steps in this technology.”

The contract was awarded to Comtech’s Trusted Location group, a leading provider of precise device location, mapping and messaging solutions for public safety, mobile network operators, and enterprise solutions. Sold around the world to mobile network operators, government agencies and Fortune 100 enterprises, our platforms locate, map, track and message. For more information, visit www.comtechlocation.com.

Comtech Telecommunications Corp. is a leading provider of next-generation 911 emergency systems and critical wireless communication technologies to commercial and government customers around the world. Headquartered in 
Melville, New York and with a passion for customer success, 
Comtech designs, produces and markets advanced and secure wireless solutions to customers in more than 100 countries. For more information, please visit www.comtechtel.com.

Certain information in this press release contains statements that are forward-looking in nature and involve certain significant risks and uncertainties. Actual results could differ materially from such forward-looking information. The Company’s 
Securities and Exchange Commission filings identify many such risks and uncertainties. Any forward-looking information in this press release is qualified in its entirety by the risks and uncertainties described in such 
Securities and Exchange Commission filings.

Comtech Investor Relations:
631-962-7005
investors@comtech.com

Source: 
Comtech Telecommunications Corp.

Release – Dr. Chris Ryan and Lynn Smull to Participate in a Water Tower Research Fireside Chat on Wednesday August 18, 2021 at 4:00 pm EDT


Dr. Chris Ryan and Lynn Smull to Participate in a Water Tower Research Fireside Chat on Wednesday, August 18, 2021 at 4:00 pm EDT


ENGLEWOOD, Colo., Aug. 11, 2021 (GLOBE NEWSWIRE) — Gevo, Inc. (NASDAQ:GEVO), announced today that Dr. Chris Ryan, President, Chief Operating Officer, and Lynn Smull, Chief Financial Officer, will participate in a Water Tower Research Fireside Chat on Wednesday, August 18, 2021 at 4:00 pm EDT.
 

Topic: Progress Report on Net-Zero 1 Capex Scope & Financial Projection

Investors and other persons interested in participating in the event must register using the link below. Please note that registration for the live event is limited but may be accessed at any time for replay after the presentation ends on August 18, 2021, utilizing the same registration link.

Registration Link:

https://globalmeet.webcasts.com/starthere.jsp?ei=1483592&tp_key=bddd6d026f

About Gevo

Gevo’s mission is to transform renewable energy and carbon into energy-dense liquid hydrocarbons. These liquid hydrocarbons can be used for drop-in transportation fuels such as gasoline, jet fuel and diesel fuel, that when burned have potential to yield net-zero greenhouse gas emissions when measured across the full life cycle of the products. Gevo uses low-carbon renewable resource-based carbohydrates as raw materials, and is in an advanced state of developing renewable electricity and renewable natural gas for use in production processes, resulting in low-carbon fuels with substantially reduced carbon intensity (the level of greenhouse gas emissions compared to standard petroleum fossil-based fuels across their life cycle). Gevo’s products perform as well or better than traditional fossil-based fuels in infrastructure and engines, but with substantially reduced greenhouse gas emissions. In addition to addressing the problems of fuels, Gevo’s technology also enables certain plastics, such as polyester, to be made with more sustainable ingredients. Gevo’s ability to penetrate the growing low-carbon fuels market depends on the price of oil and the value of abating carbon emissions that would otherwise increase greenhouse gas emissions. Gevo believes that its proven, patented technology enabling the use of a variety of low-carbon sustainable feedstocks to produce price-competitive low-carbon products such as gasoline components, jet fuel and diesel fuel yields the potential to generate project and corporate returns that justify the build-out of a multi-billion-dollar business.

Gevo believes that the Argonne National Laboratory GREET model is the best available standard of scientific-based measurement for life cycle inventory or LCI.

Learn more at Gevo’s website: www.gevo.com

Investor and Media Contact

+1 720-647-9605

IR@gevo.com

Release – Ceapro Inc. Expands Collaboration with Montreal Heart Institute (MHI) with New Clinical Study Evaluating Flagship Product Avenanthramide


Ceapro Inc. Expands Collaboration with Montreal Heart Institute (MHI) with New Clinical Study Evaluating Flagship Product, Avenanthramide


– Second human trial to be conducted as part of a long-term Master Service Agreement with MHI

– Phase 1 study with Ceapro’s pharmaceutical grade avenanthramide to be coordinated by MHI’s Montreal Health Innovations Coordinating Center (MHICC) and led by Dr. Jean-Claude Tardif

EDMONTON, Alberta, Aug. 11, 2021 (GLOBE NEWSWIRE) — Ceapro Inc. (TSX-V: CZO; OTCQX: CRPOF), a growth-stage biotechnology company focused on the development and commercialization of active ingredients for healthcare and cosmetic industries, announced today that it has entered into a research agreement for a Phase 1 safety and pharmacokinetic study with its flagship product avenanthramide. This clinical study is part of the long-term formal collaboration signed in 2018 with the prestigious Montreal Heart Institute (MHI) and will be led by Jean-Claude Tardif, CM, MD, Director of the Montreal Heart Institute Research Center.

“As we are entering into the last phase of our trial with MHI for our beta-glucan as a potential cholesterol lowering agent, we are honoured to expand our work with the expert team from MHI to conduct a Phase 1 clinical trial to assess the safety and tolerability of our flagship product, avenanthramide, which is well known for its anti-histaminic and anti-inflammatory properties. While some studies have been conducted with various formulations of avenanthramides, to our knowledge none have been done with such a pure pharmaceutical grade formulation. The expertise of the team at MHI, one of the best research Institute specializing in cardiovascular disease in Canada and beyond, is exactly in line with Ceapro’s strategic sector of activities in lifestyle, inflammation and immune-based diseases. This agreement is another step in the expansion of Ceapro’s business model from a contract manufacturer to a life science company,” commented Gilles R. Gagnon, M.Sc., MBA, President and CEO of Ceapro.

Dr. Tardif added, “We are pleased to enter into this new clinical study with Ceapro to evaluate their flagship product, avenanthramide. Because many cardiovascular diseases are inflammation-based, we are quite excited to initiate, hopefully very soon, a clinical trial aimed at evaluating Ceapro’s avenanthramide as a potential therapeutic and/or as a preventive natural product to manage and potentially decrease the risk of cardiovascular diseases. Due to their favorable safety profile, active ingredients from natural products such as avenanthramide generate significant interest in preventing and managing chronic lifestyle diseases.’’

This safety and tolerability study will assess six escalating doses of avenanthramide given orally to healthy volunteers. A unique formulation of Ceapro’s avenanthramide is also under development through a partnership with Montreal-based COREALIS Pharma Inc., a specialty drug design company.

About the Montreal Heart Institute

Founded in 1954 by Dr. Paul David, the Montreal Heart Institute constantly aims for the highest standards of excellence in the cardiovascular field through its leadership in clinical and basic research, ultra-specialized care, professional training, and prevention. It houses the largest cardiology research center in Canada, the largest cardiovascular prevention center in the country, and the largest cardiovascular genetics center in Canada. The Institute is affiliated with the Université de Montréal and has more than 2000 employees, including 245 physicians and more than 85 researchers. For more information, please visit https://www.icm-mhi.org/en. The Montreal Health Innovations Coordinating Center (MHICC) is a leading full-service academic clinical research organization and an integral part of the Montreal Heart Institute (MHI). The MHICC possesses an established network of collaborators in over 4500 clinical sites in more than 35 countries. It has specific expertise in precision medicine, low-cost high-quality clinical trials, and drug repurposing (https:/www.mhicc.org).

About Ceapro Inc.

Ceapro Inc. is a Canadian biotechnology company involved in the development of proprietary extraction technology and the application of this technology to the production of extracts and “active ingredients” from oats and other renewable plant resources. Ceapro adds further value to its extracts by supporting their use in cosmeceutical, nutraceutical, and therapeutics products for humans and animals. The Company has a broad range of expertise in natural product chemistry, microbiology, biochemistry, immunology and process engineering. These skills merge in the fields of active ingredients, biopharmaceuticals and drug-delivery solutions. For more information on Ceapro, please visit the Company’s website at www.ceapro.com.

For more information contact:

Jenene Thomas
Jenene Thomas Communications, LLC
Investor Relations and Corporate Communications Advisor
T (US): +1 (833) 475-8247
E: czo@jtcir.com

Issuer:

Gilles R. Gagnon, M.Sc., MBA
President & CEO
T: 780-421-4555

Neither TSX Venture Exchange nor its Regulation Services Provider (as that term is defined in the policies of the TSX Venture Exchange) accepts responsibility for the adequacy or accuracy of this release

Source: Ceapro Inc.

QuickChek – August 11, 2021


Ceapro Inc. Expands Collaboration with Montreal Heart Institute (MHI) with New Clinical Study Evaluating Flagship Product, Avenanthramide

Ceapro announced that it has entered into a research agreement for a Phase 1 safety and pharmacokinetic study with its flagship product avenanthramide.

Research, News & Market Data on Ceapro

Watch recent presentation from Ceapro


Comtech Telecommunications Corp. Awarded $1.0 Million Contract for 5G Support with a Tier-One U.S. Carrier

Comtech Telecommunications announced that during its fourth quarter of fiscal 2021, it was awarded a contract for approximately $1.0 million for operations support features and enhancements supporting 5G applications

Research, News & Market Data on Comtech

Watch recent presentation from Comtech


Dr. Chris Ryan and Lynn Smull to Participate in a Water Tower Research Fireside Chat on Wednesday, August 18, 2021 at 4:00 pm EDT

Gevo announced that COO Dr. Chris Ryan and CFO Lynn Smull will participate in a Water Tower Research Fireside Chat on Wednesday, August 18, 2021 at 4pm EDT

Research, News & Market Data on Gevo

Watch recent presentation from Gevo


Vectrus Announces Strong Second Quarter Results; Increases Revenue and Adjusted Diluted EPS Guidance

Vectrus, Inc. announced strong second quarter 2021 financial results

See today’s research report from Joe Gomes, Senior Research Analyst at Noble Capital Markets

Research, News & Market Data on Vectrus


Neovasc Announces Second Quarter 2021 Financial Results

Neovasc reported financial results for the second quarter ended June 30, 2021.

Research, News & Market Data on Neovasc


PLBY Group Reports Second Quarter 2021 Financial Results
PLBY Group Closes Previously Announced Acquisition of Honey Birdette

Research, News & Market Data on PLBY Group


Stay up to date. Follow us:


Metals and Mining Review and Outlook – Noble Capital Markets Natural Resources Sector Review – Q2 2021

Metals & Mining Second Quarter 2021 Review and Outlook

Noble Capital Markets Natural Resources Sector Review – August 2021

Source: Capital IQ as of 06/30/2021

Source: Capital IQ as of 06/30/2021; Company Filings

METALS AND MINING INDUSTRY OUTLOOK

Metals & Mining Second Quarter 2021 Review and Outlook

Mining companies modestly trailed the broader market

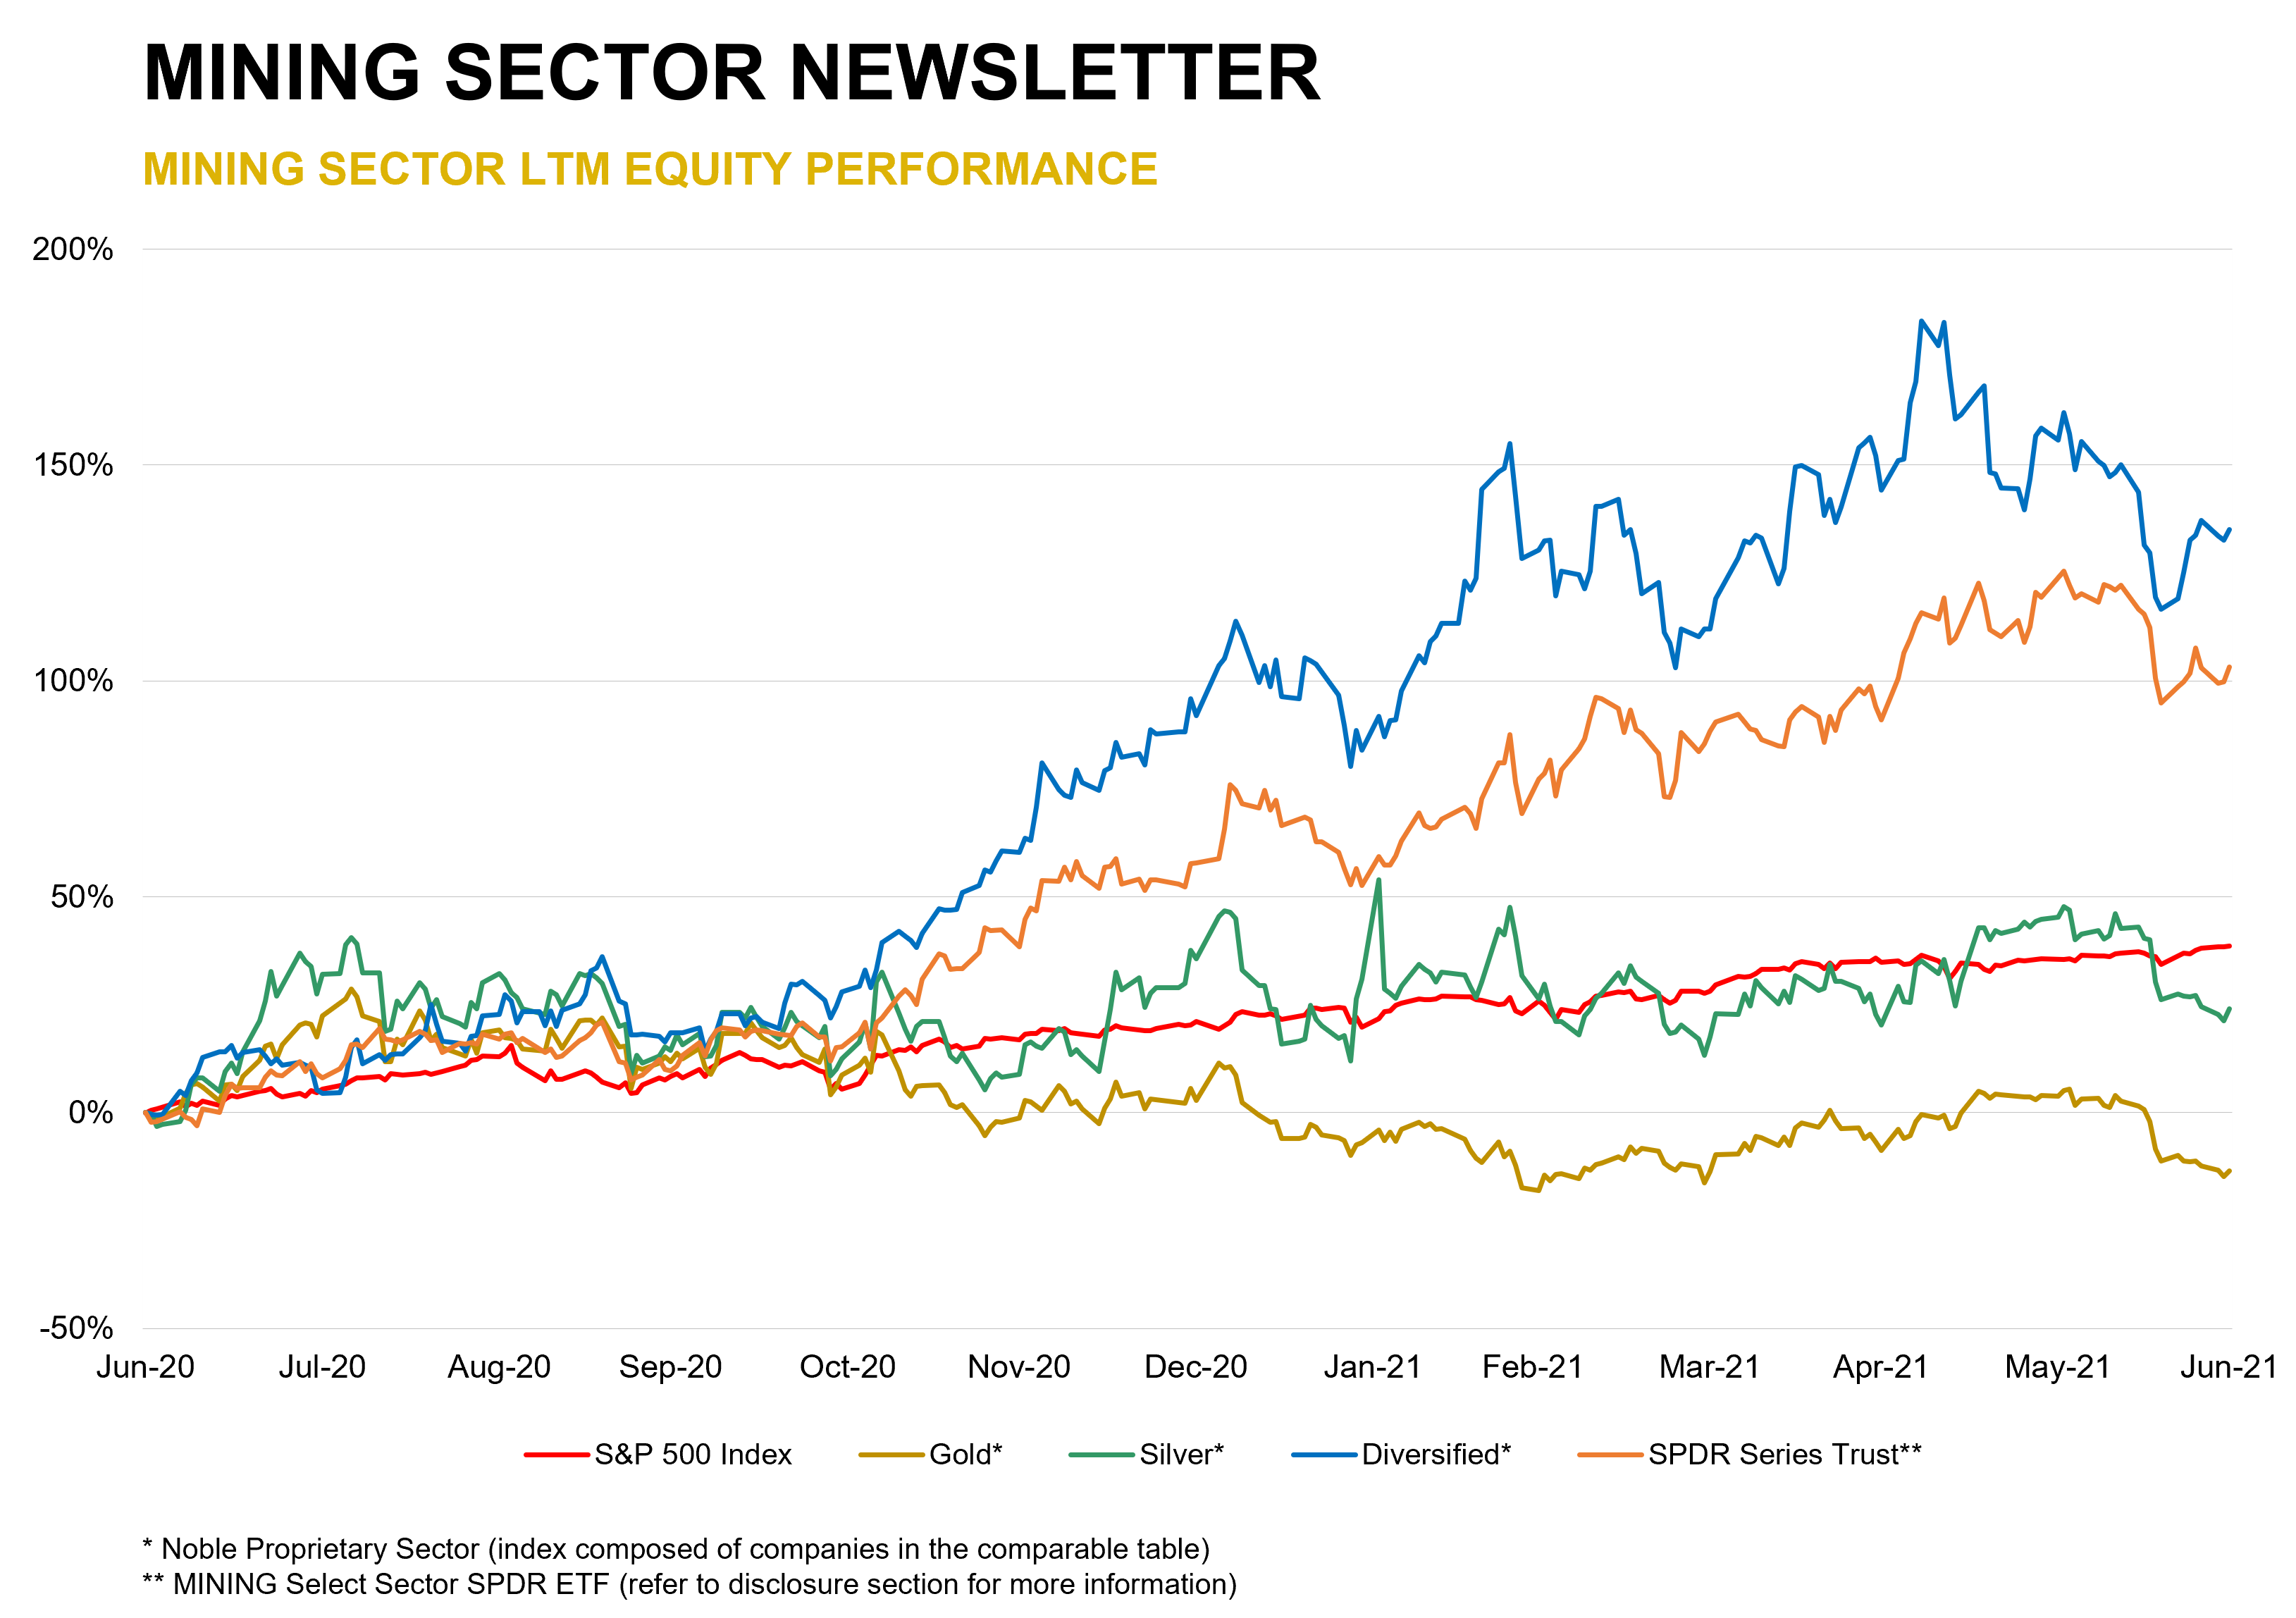
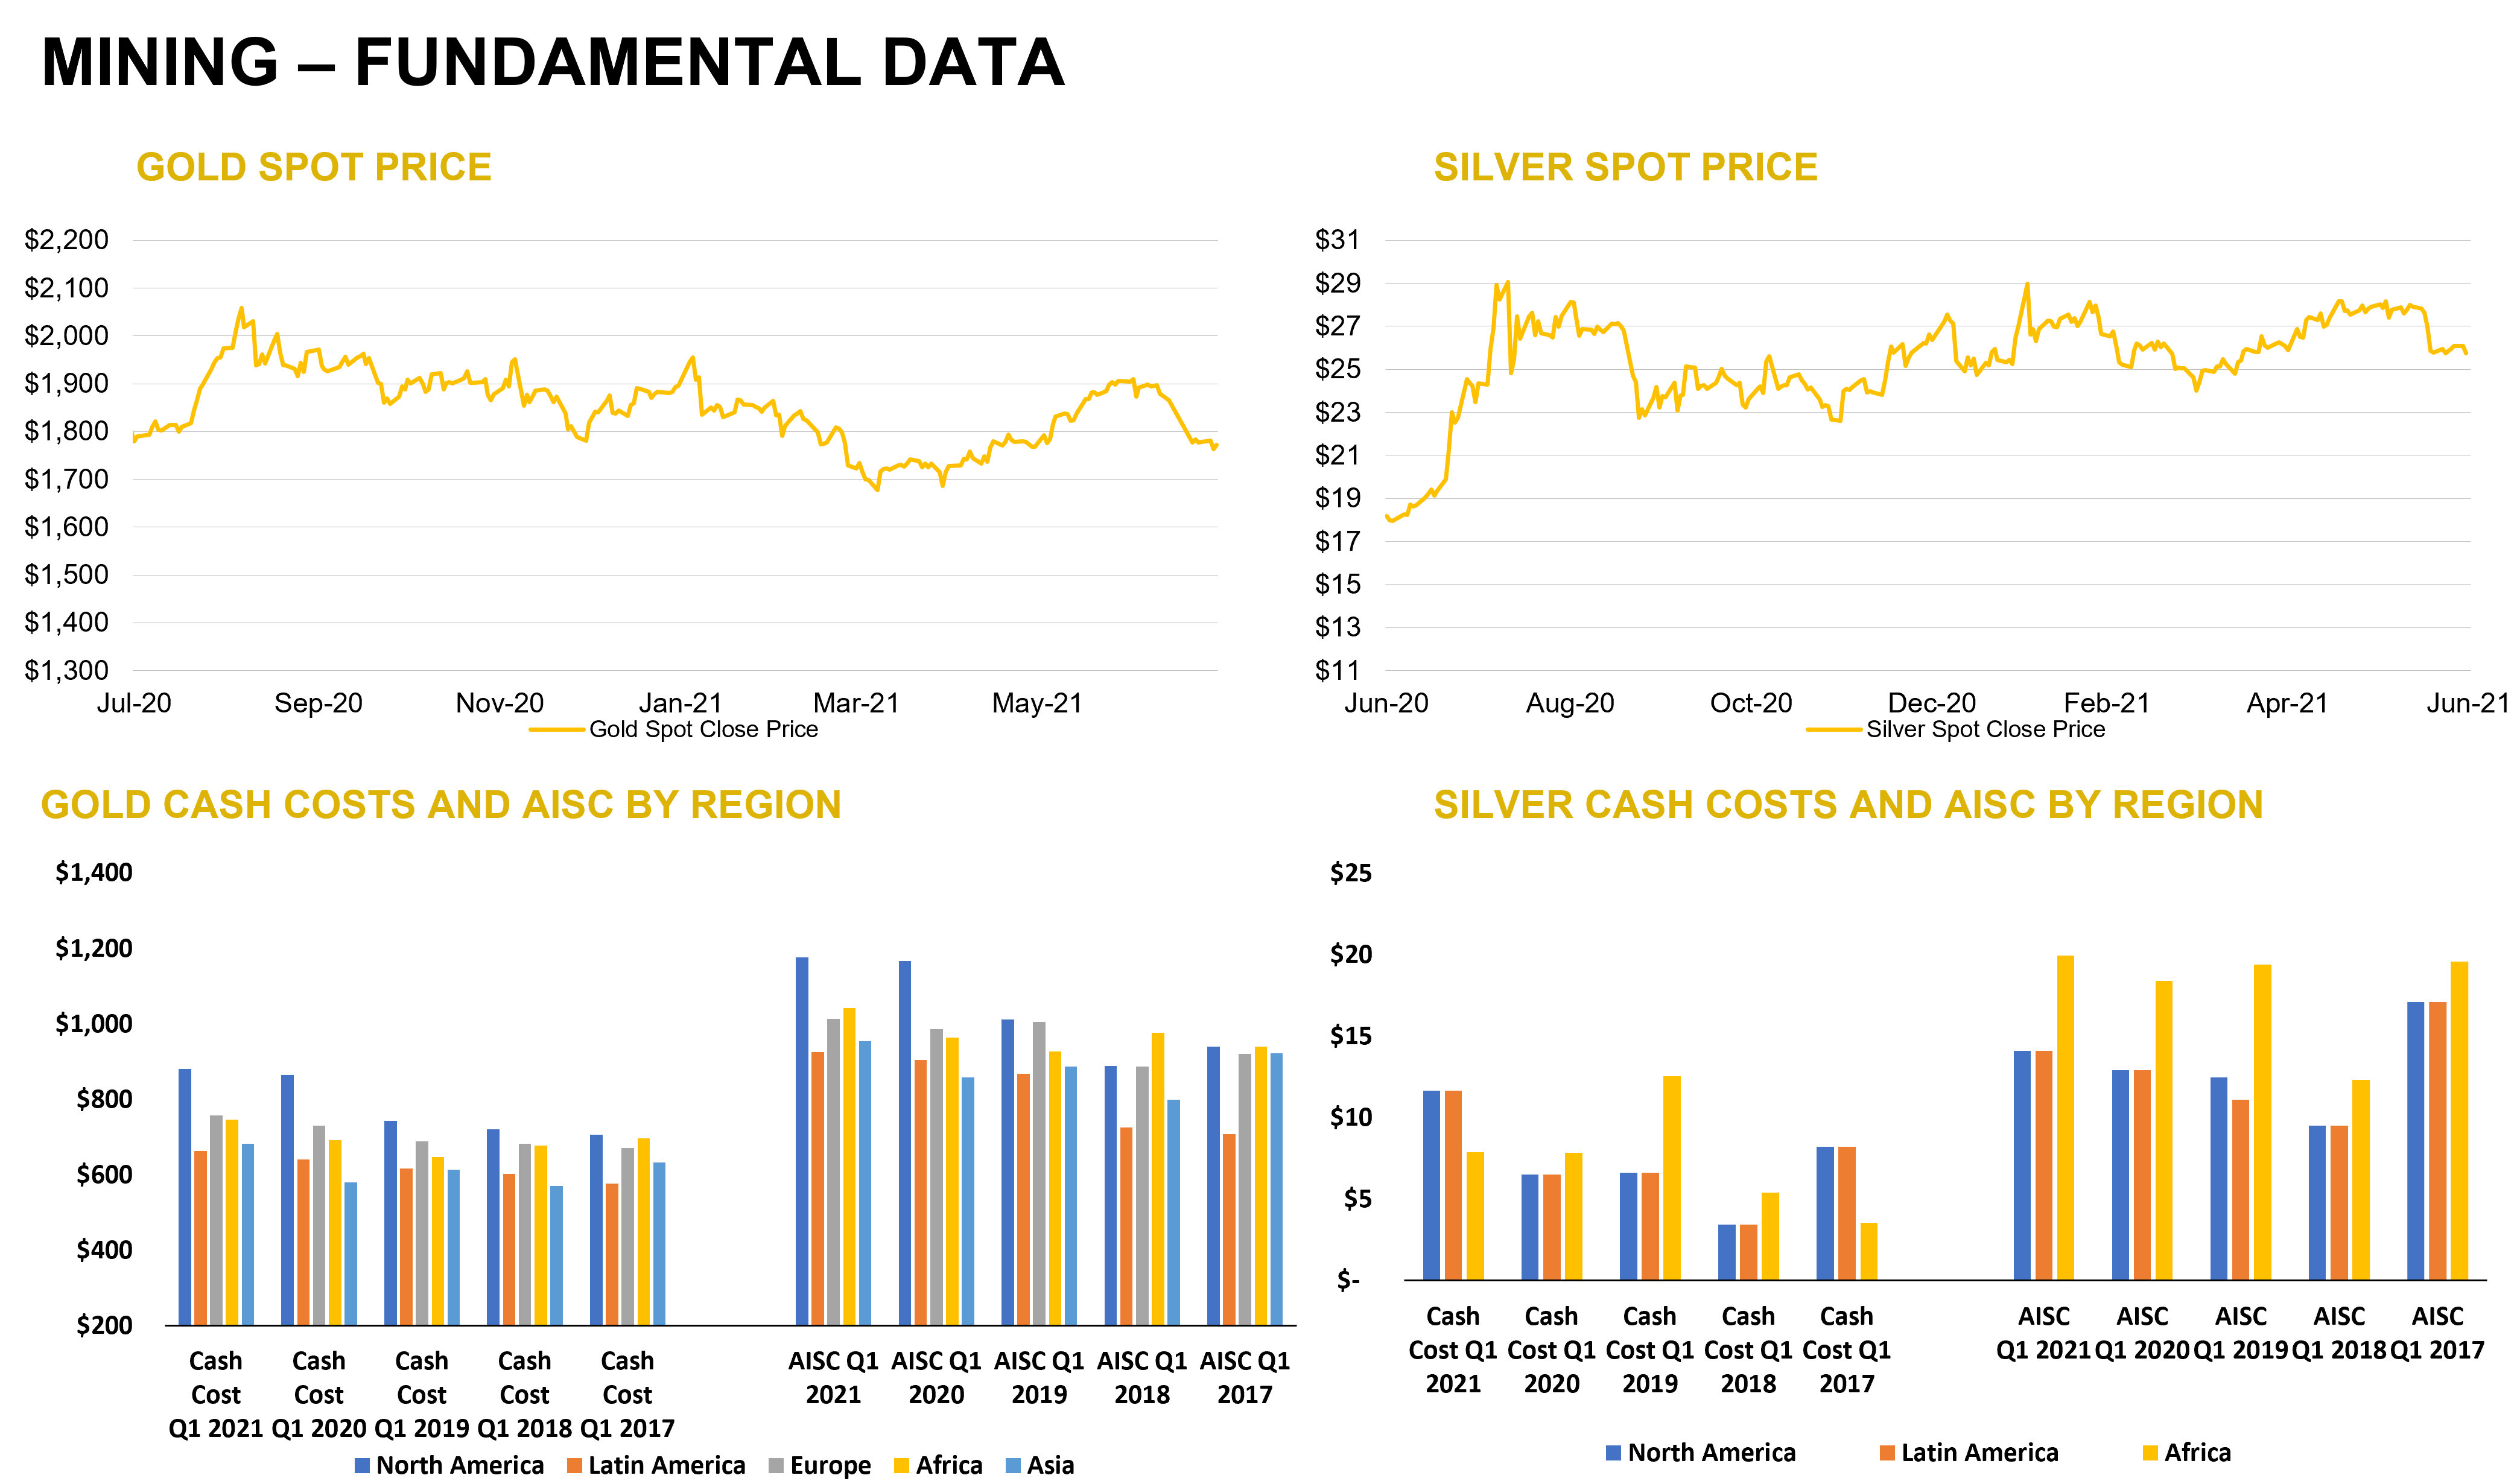
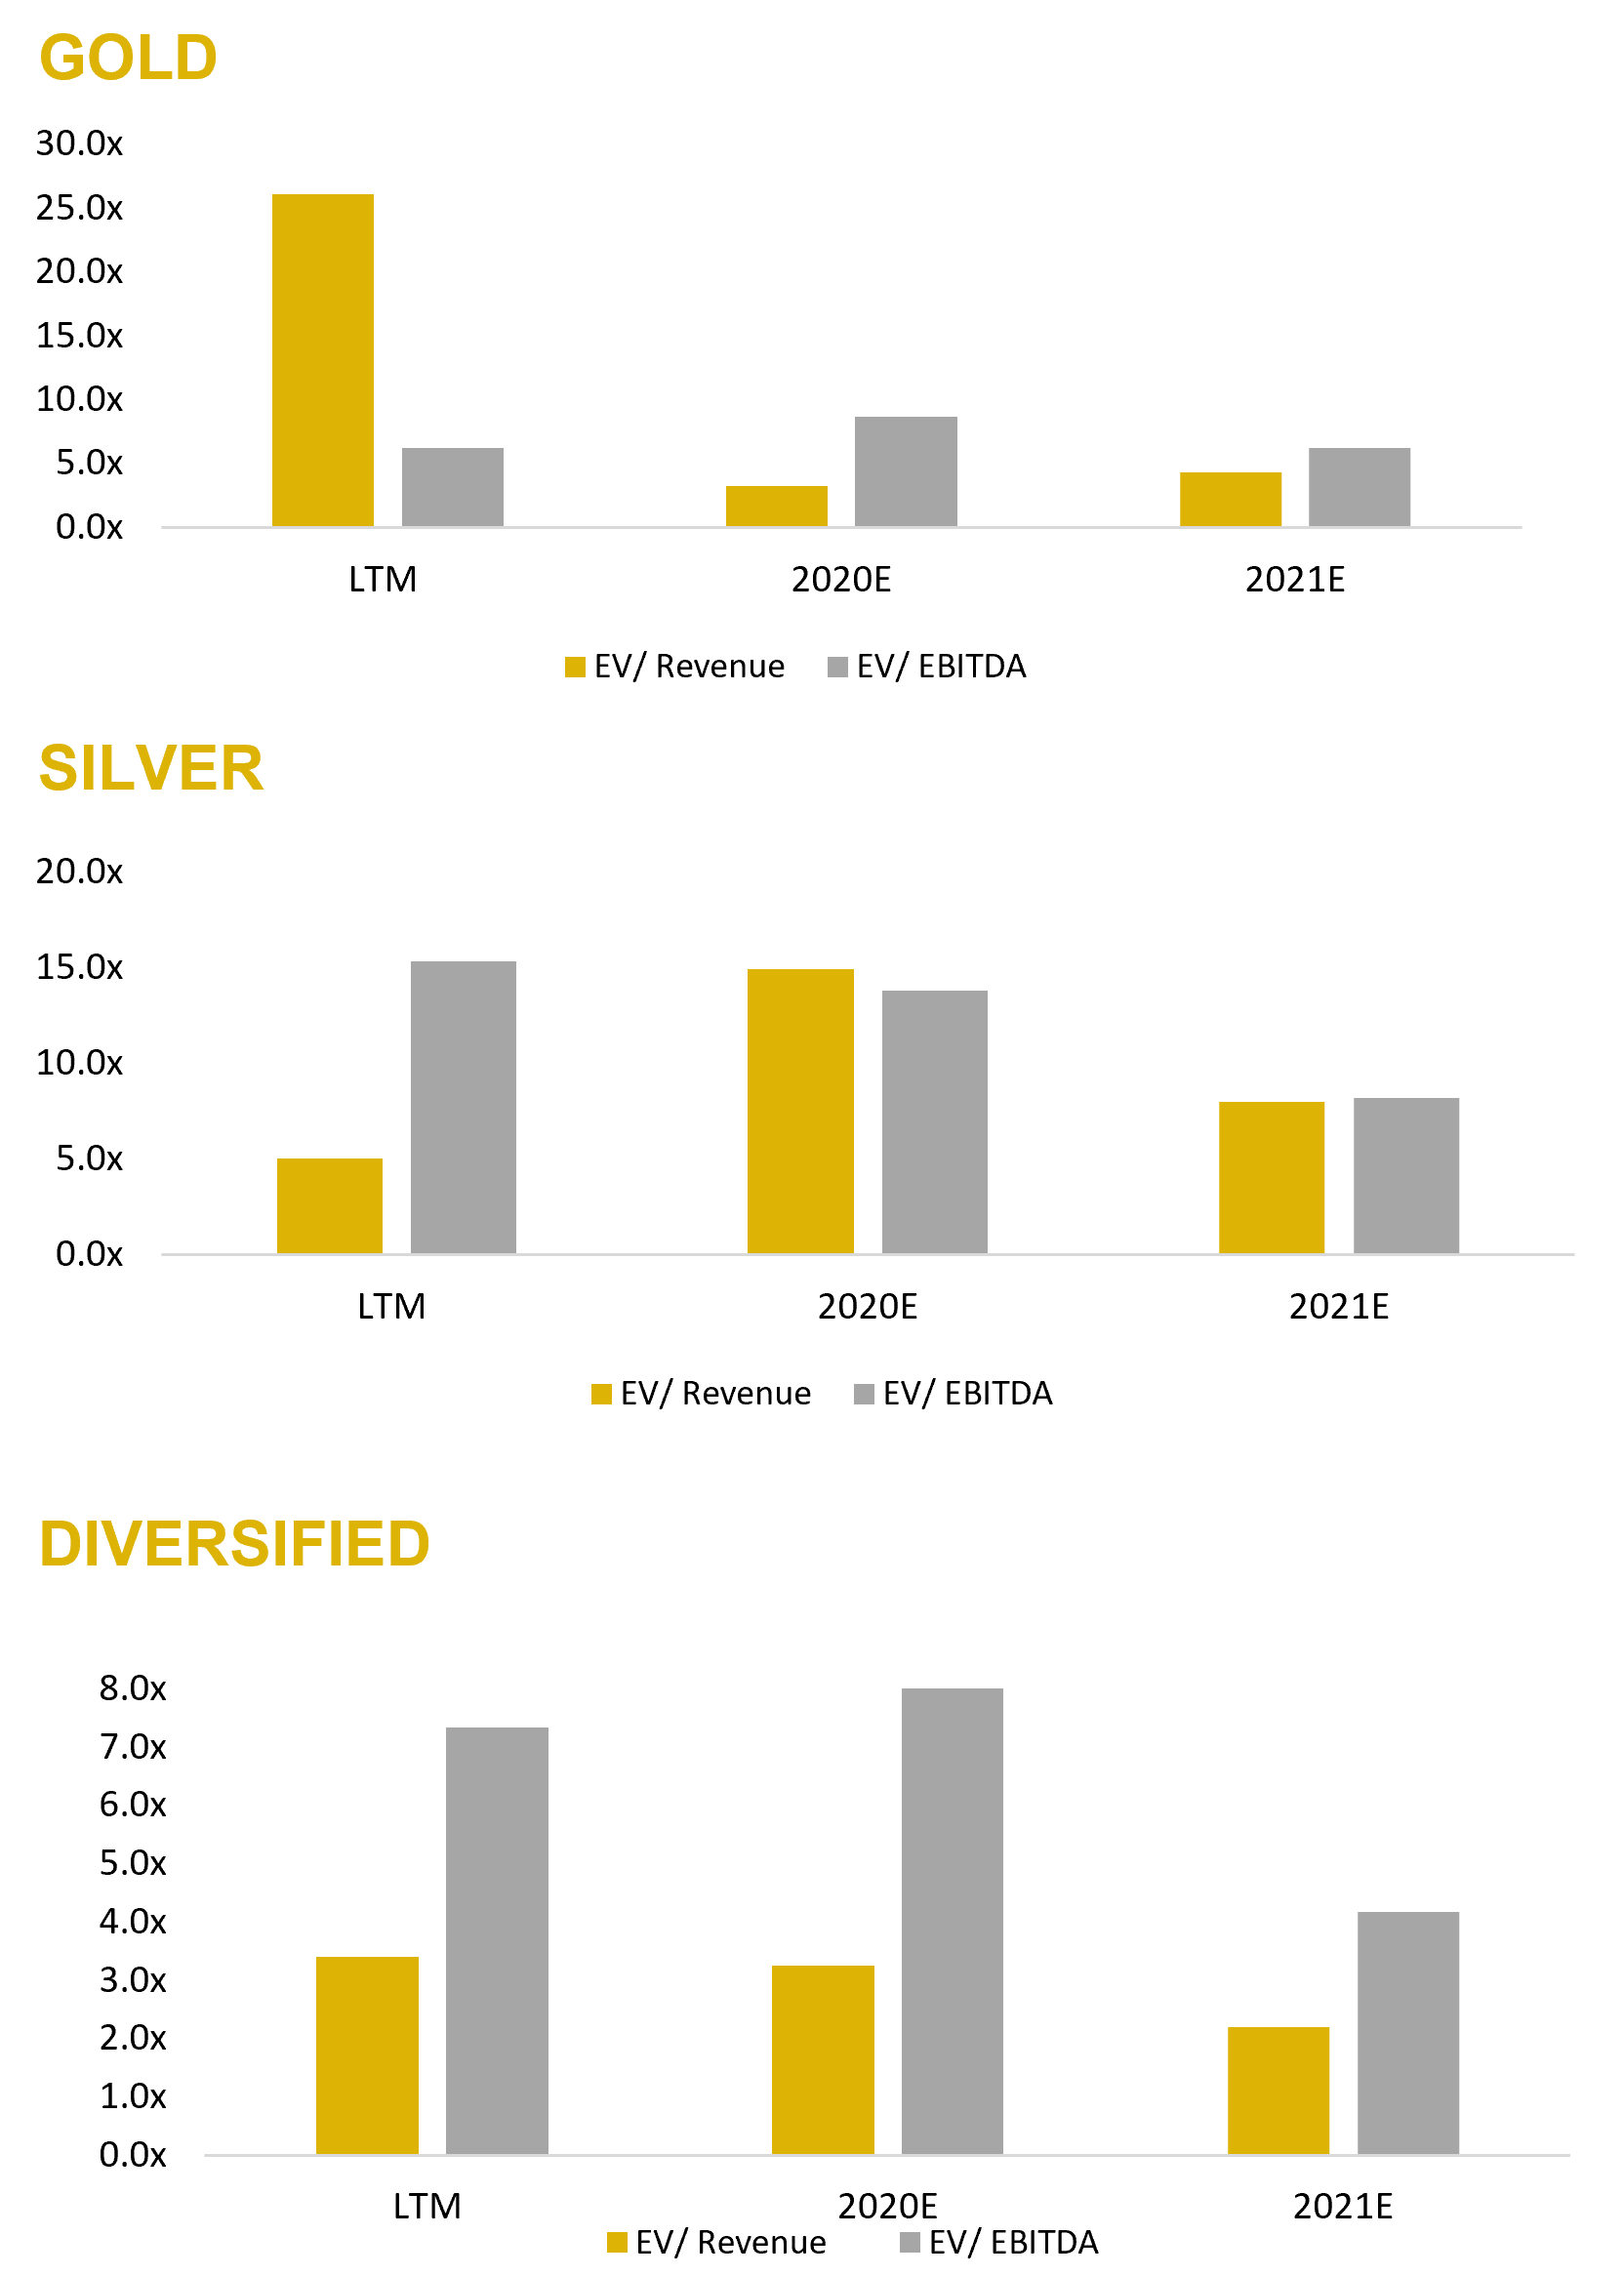
During the second quarter of 2021, mining companies (as measured by the XME) gained 7.9% compared to 8.2% for the broader market as measured by the S&P 500 index. The VanEck Vectors Gold Miners (GDX) and Junior Gold Miners (GDXJ) ETFs were up 4.6% and 3.9%, respectively. During the second quarter, gold, silver, copper, lead, and zinc futures prices were up 3.2%, 6.4%, 7.4%, 3.5%, and 9.5%, respectively. While gold and silver recovered some of their first quarter losses, prices were still down year-to-date through June 30, while copper, lead and zinc prices were up 21.8%, 13.7%, and 12.0%, respectively. While the U.S. Dollar Index rose 2.7% year-to-date through June 30, it was down under 1% during the second quarter.

Reading the Fed’s tea leaves

The Federal Reserve threw some cold water on the reflation trade during their Federal Open Market Committee (FOMC) meeting in June with economic projections that led investors to worry that the Fed could increase rates sooner than previously expected. While the FOMC will meet again in July, investors will have to wait until the FOMC meeting in September for the next set of economic projections. In the interim, commentary at the Jackson Hole Economic Policy Symposium in August may provide more clues about the Fed’s direction.

We remain constructive on the sector

We think gold and silver could remain somewhat range-bound for the remainder of 2021 with silver offering modestly higher upside due to growing industrial demand and where it trades relative to gold. Much will depend on inflation expectations, U.S. dollar strength, and other uncertainties. This is not a bad thing, in our view, given that precious metals prices should be profitable for producers at current levels. Demand for base metals will likely benefit from global economic growth and infrastructure spending and we think prices could go higher. Additionally, secular themes, including trends toward electrification, favor metals used in electric vehicle batteries, infrastructure, and solar and renewable power technologies.

Taking the long view

Investors should consider gaining exposure to precious and base metals through mining stocks. Real interest rates are likely to remain low for the foreseeable future, despite potential increases in nominal rates, and gold could remain attractive as a store of value. Presently, we do not view volatile cryptocurrencies as a credible substitute for this function. Importantly, metals prices could have an upward bias given relatively modest levels of reinvestment in new reserves and resources in recent years.

Source: Capital IQ as of 06/30/2021

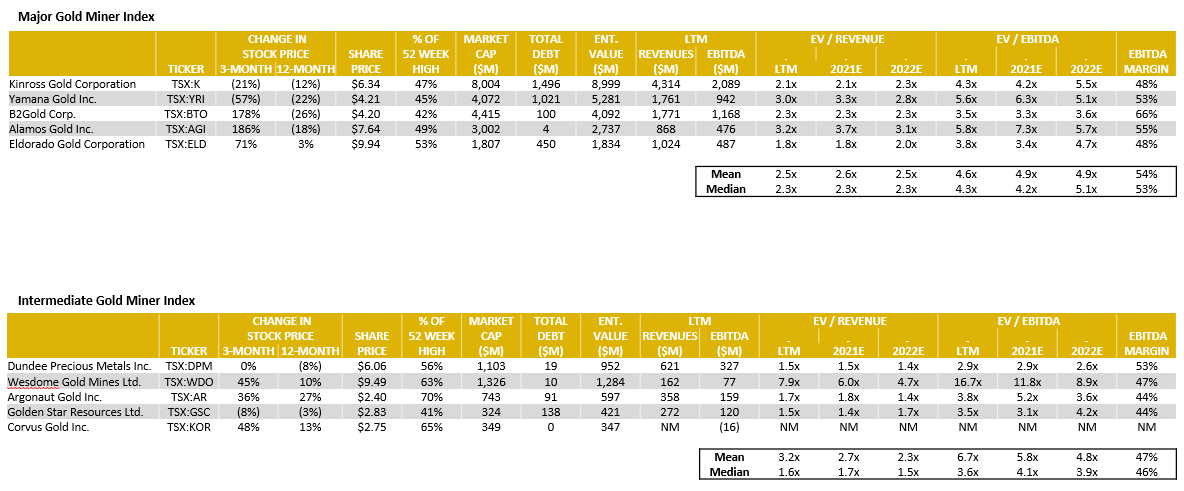
Gold Mining – Comparable Tables 

Source: Capital IQ as of 06/30/2021

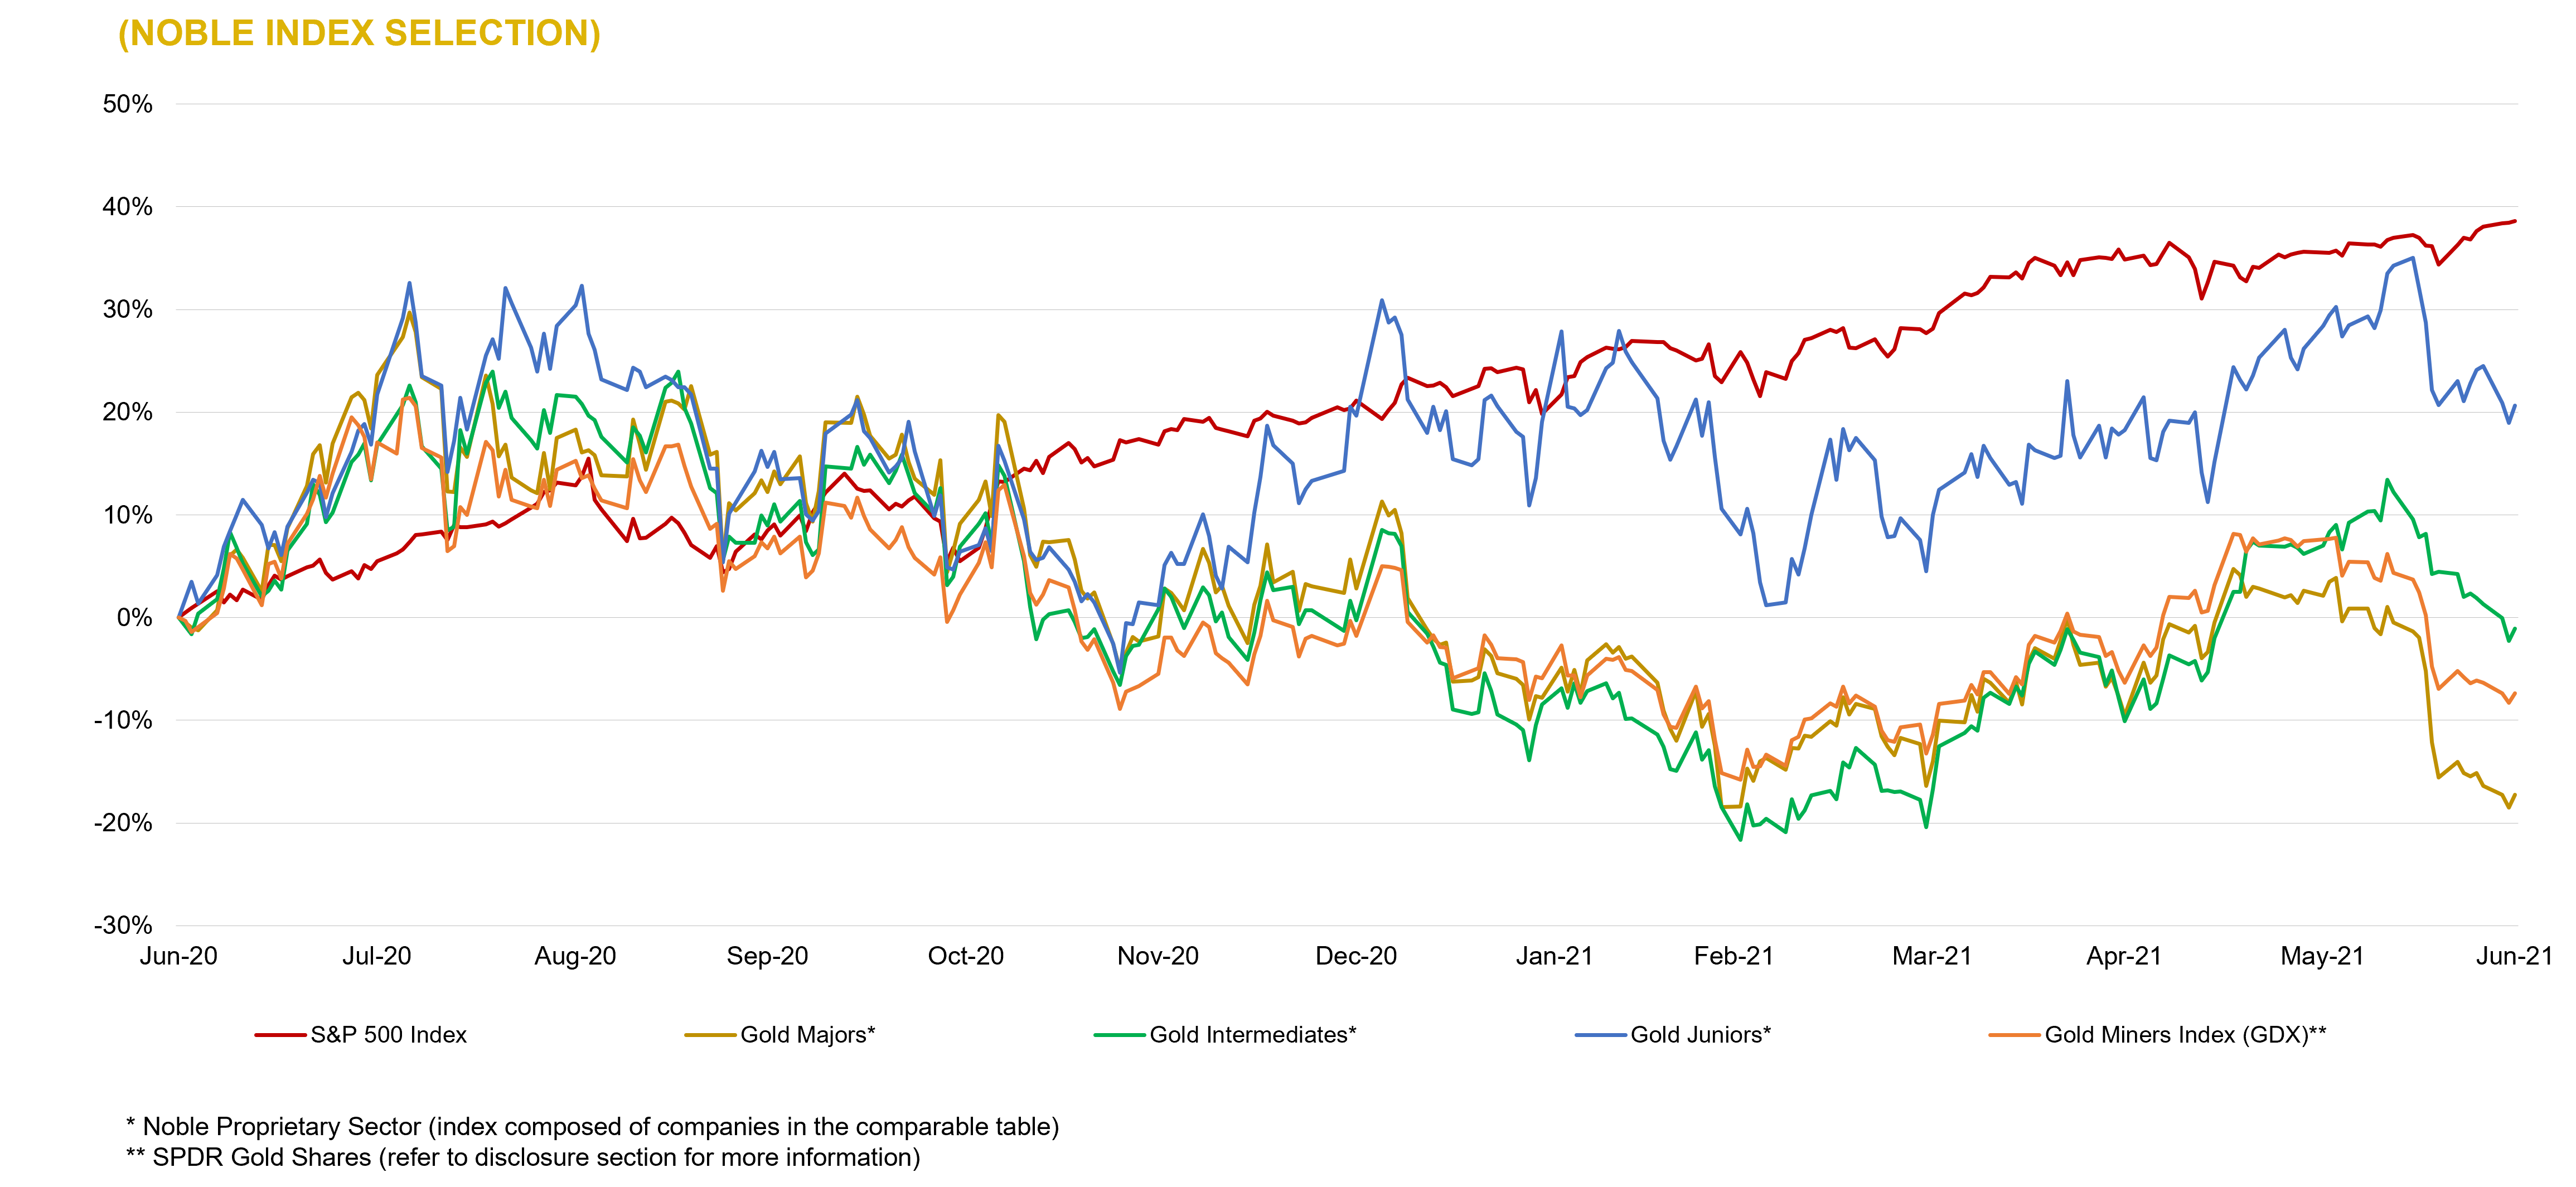
Gold Mining – LTM Equity Performance 

Source: Capital IQ as of 06/30/2021

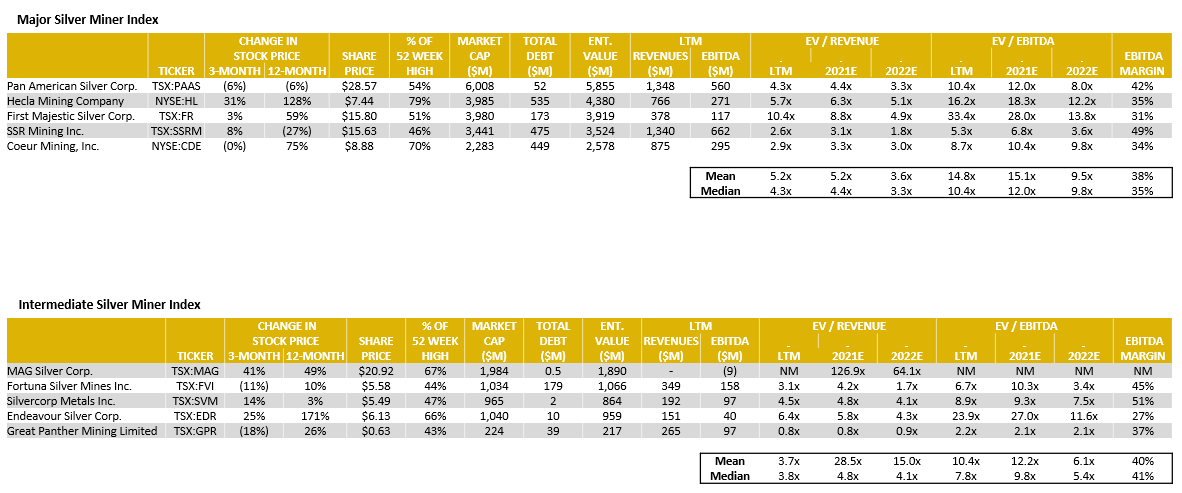
Silver Mining – Comparable Tables 

Source: Capital IQ as of 06/30/2021

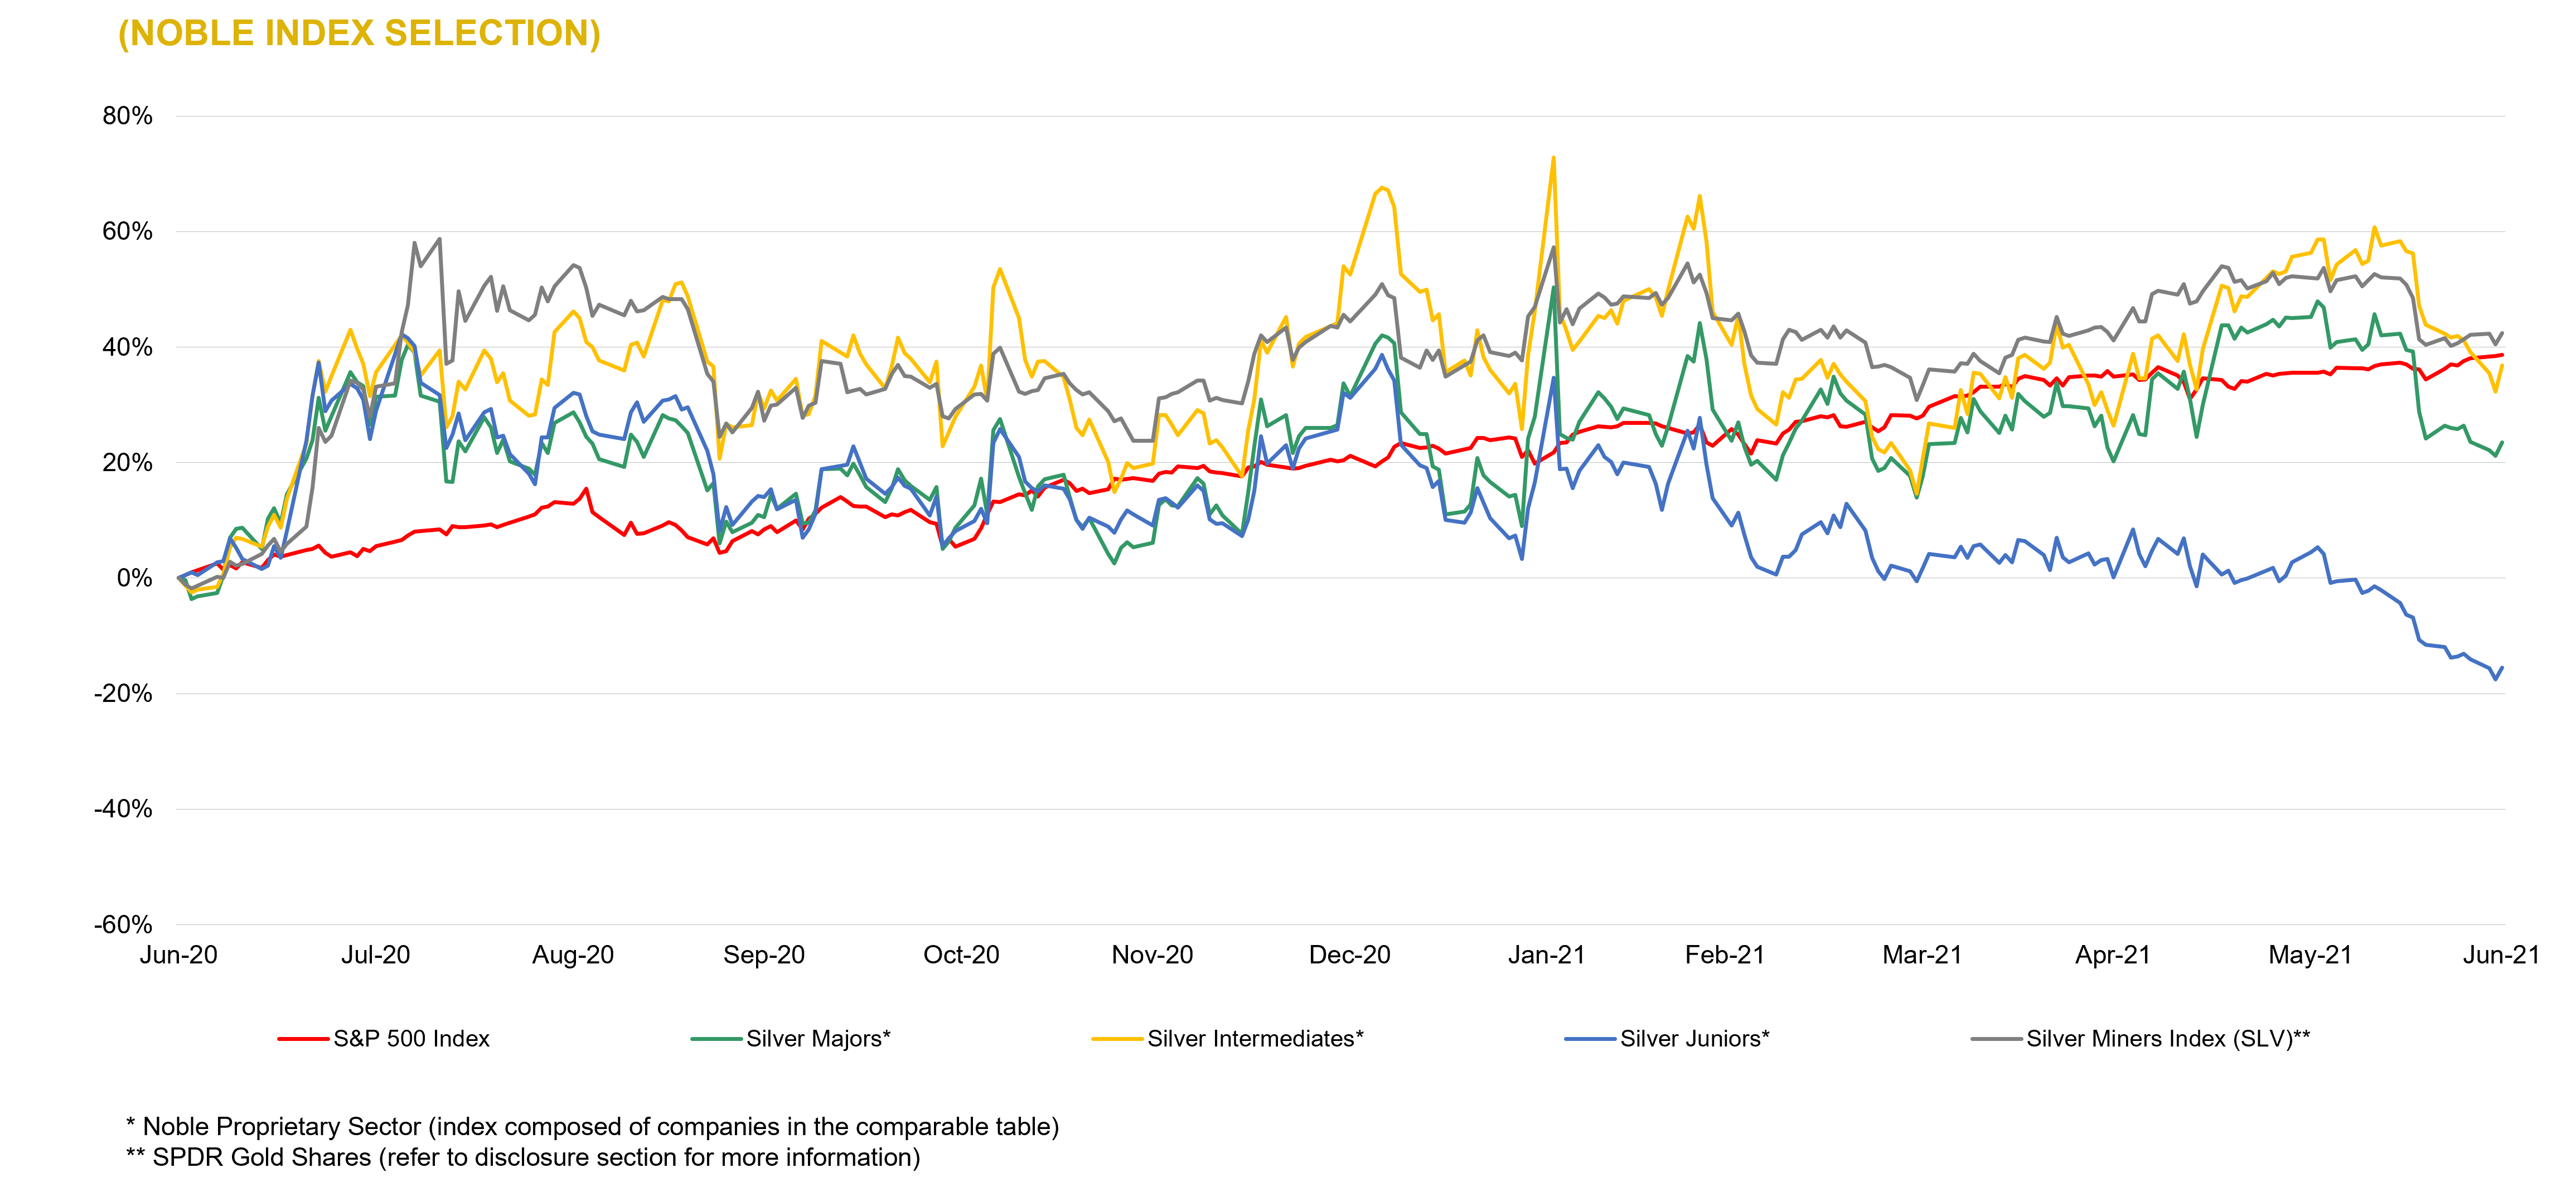
Silver Mining – LTM Equity Performance 

Source: Capital IQ as of 06/30/2021

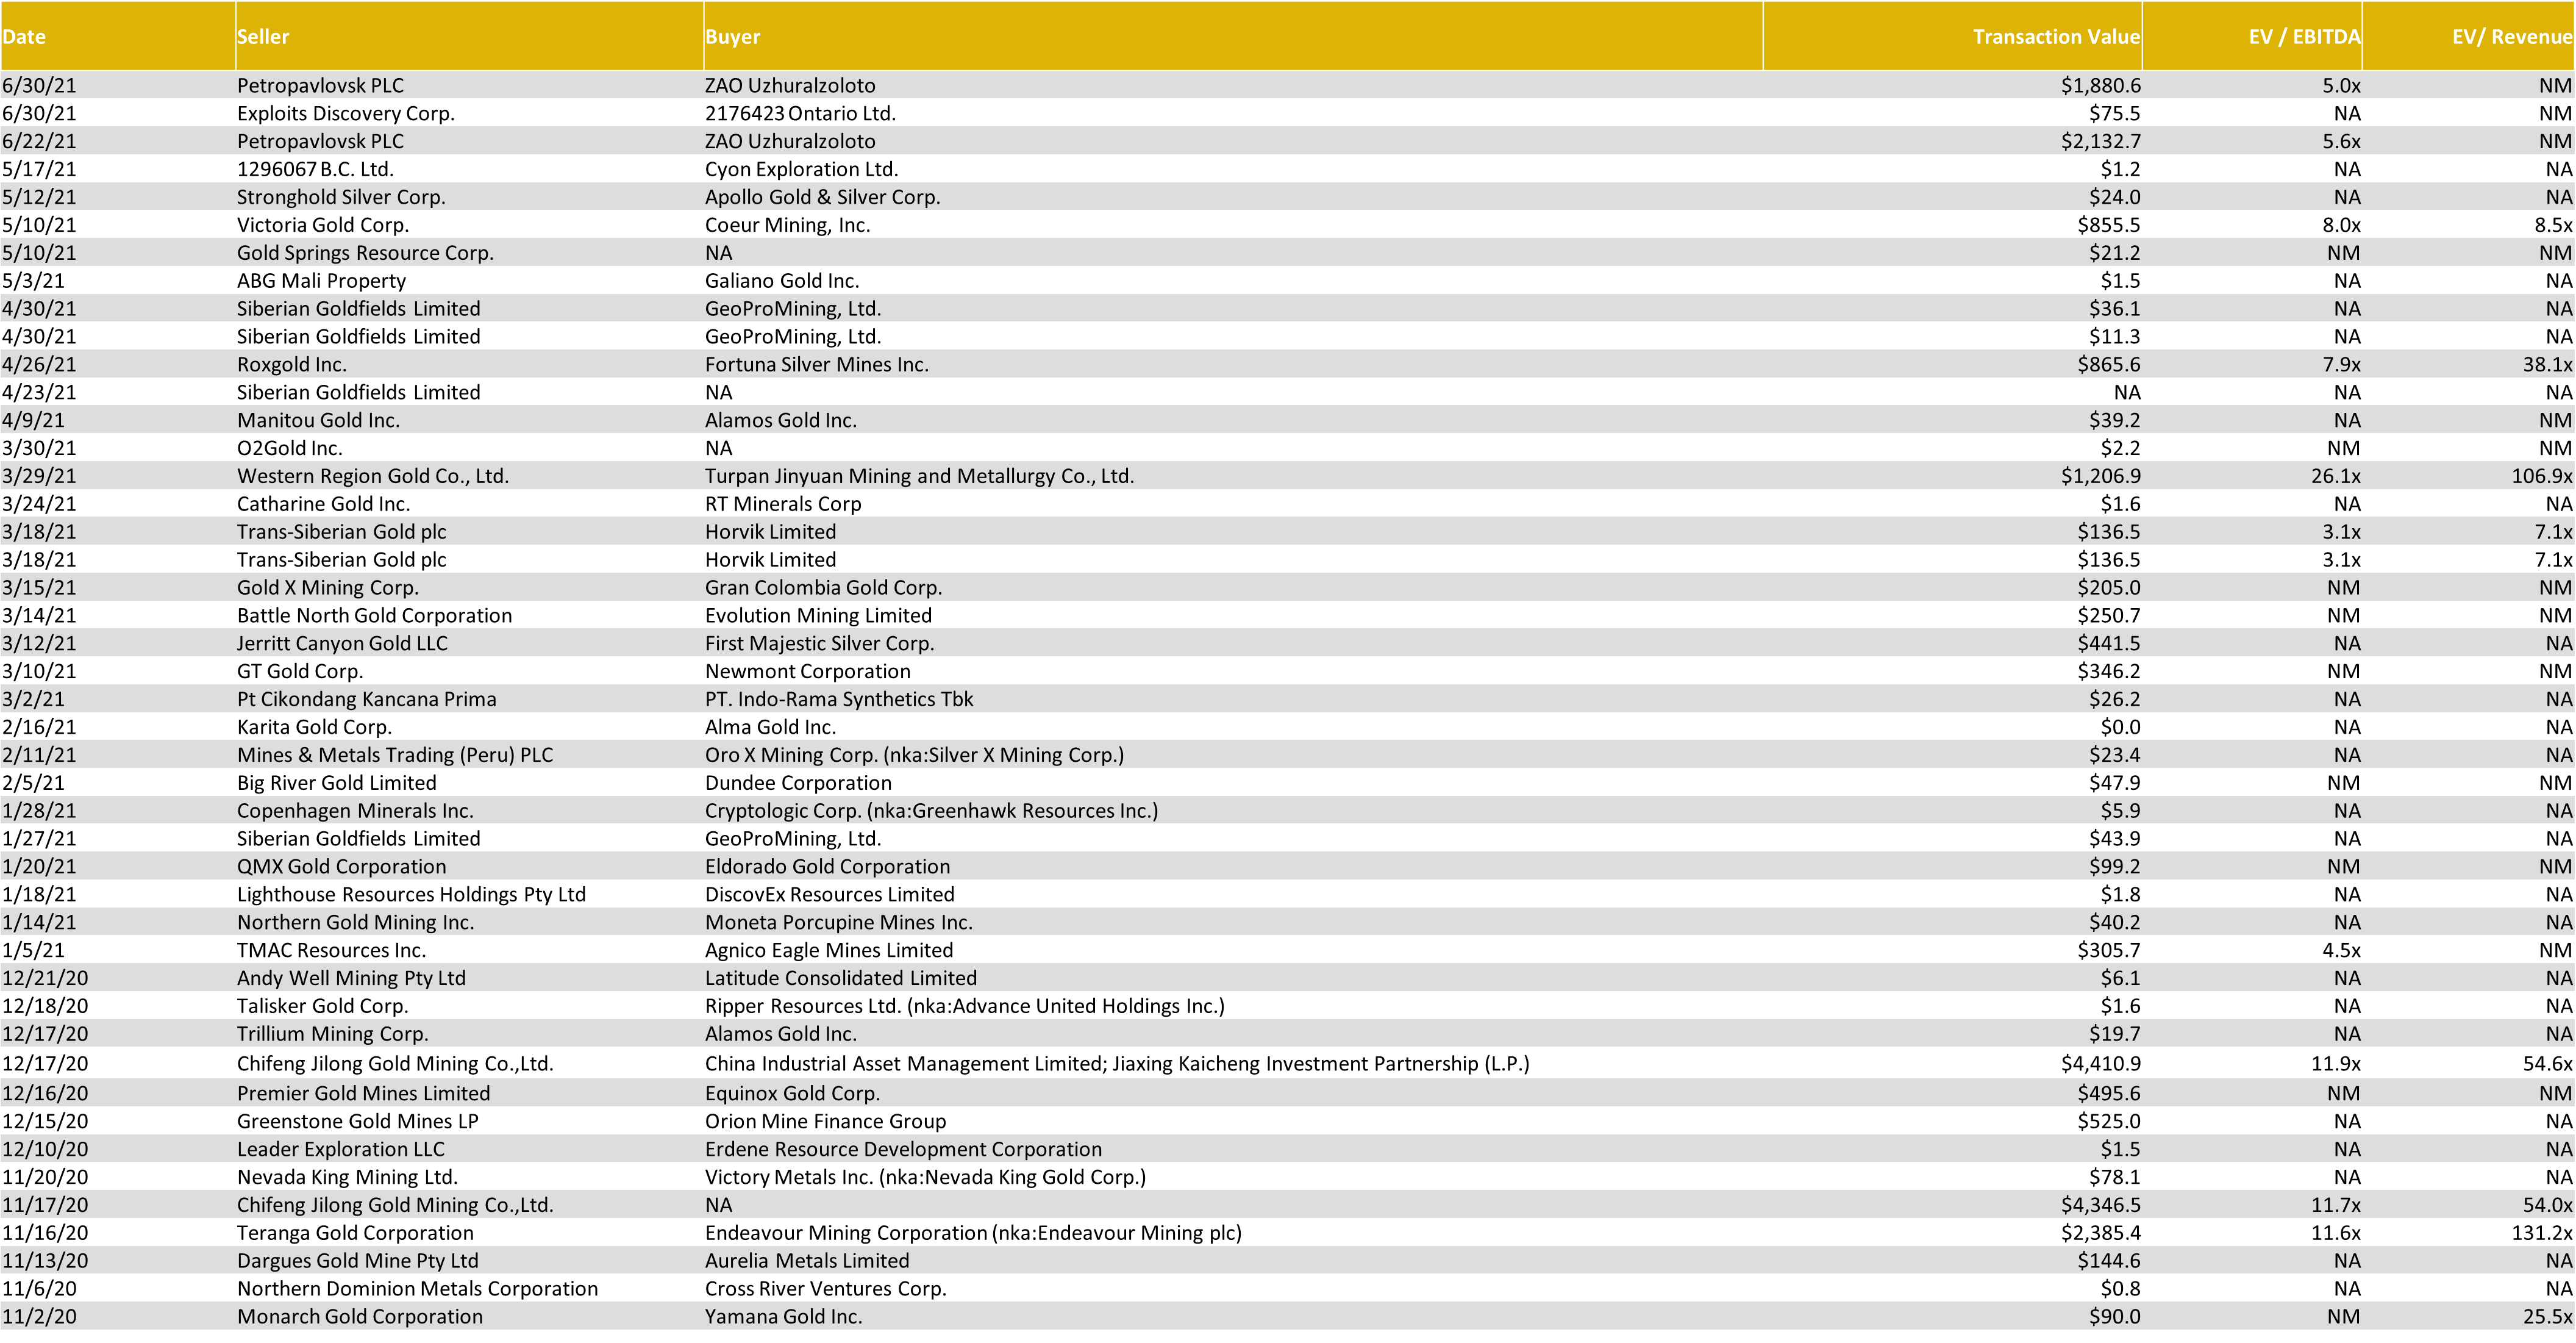
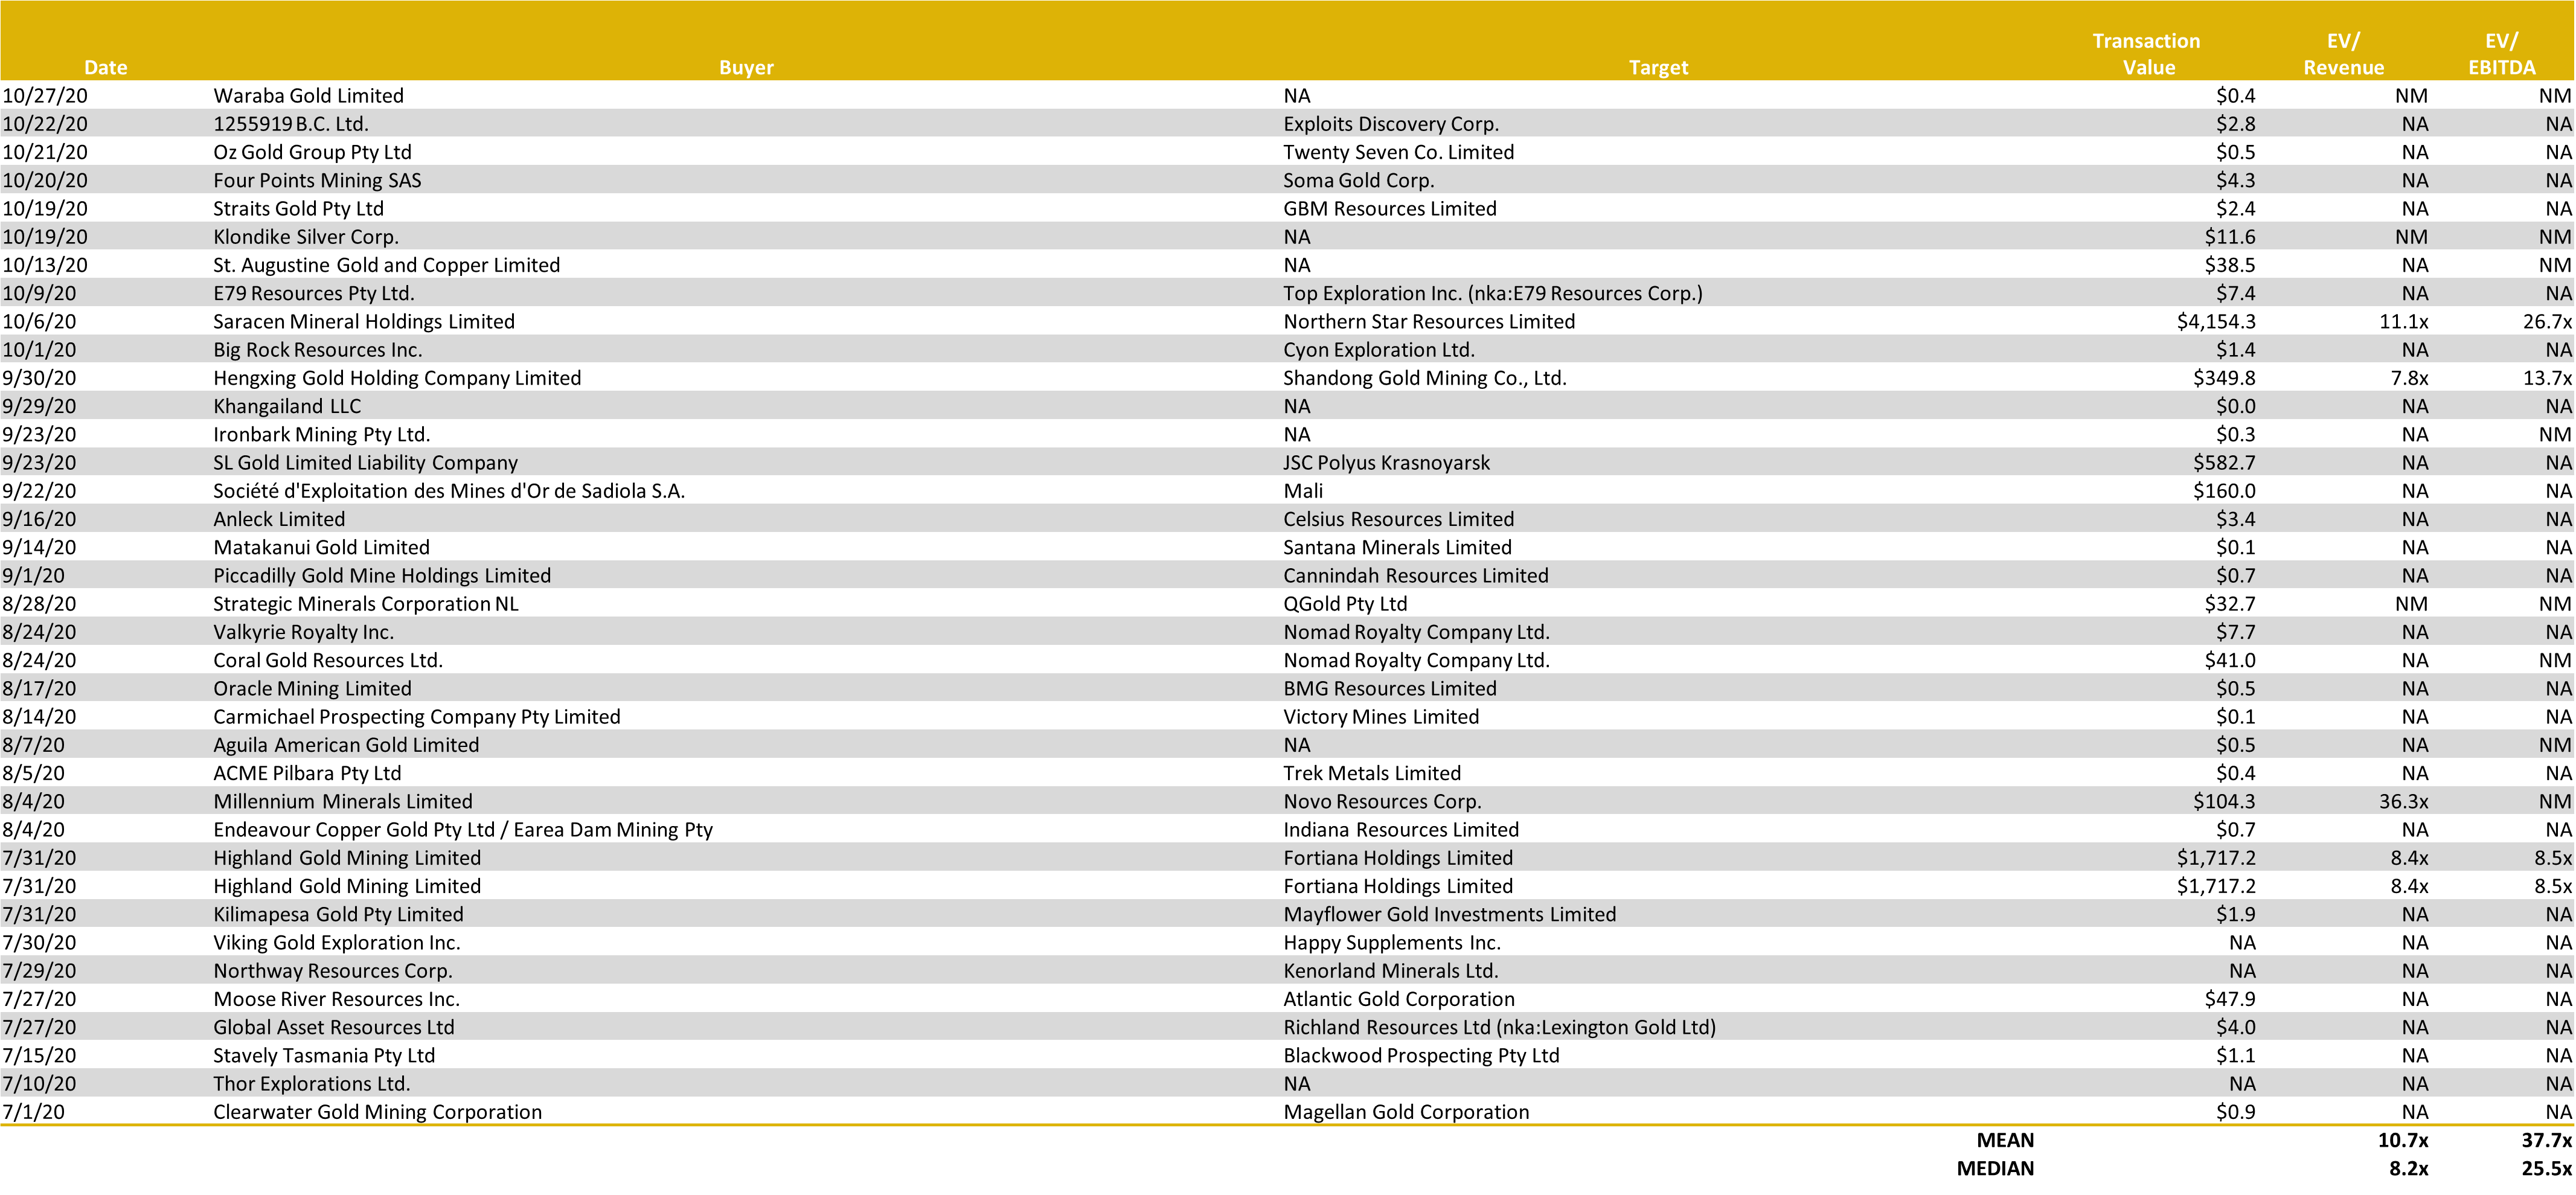
Gold & Silver – LTM Global M&A Activity 

Source: Capital IQ as of 06/30/2021

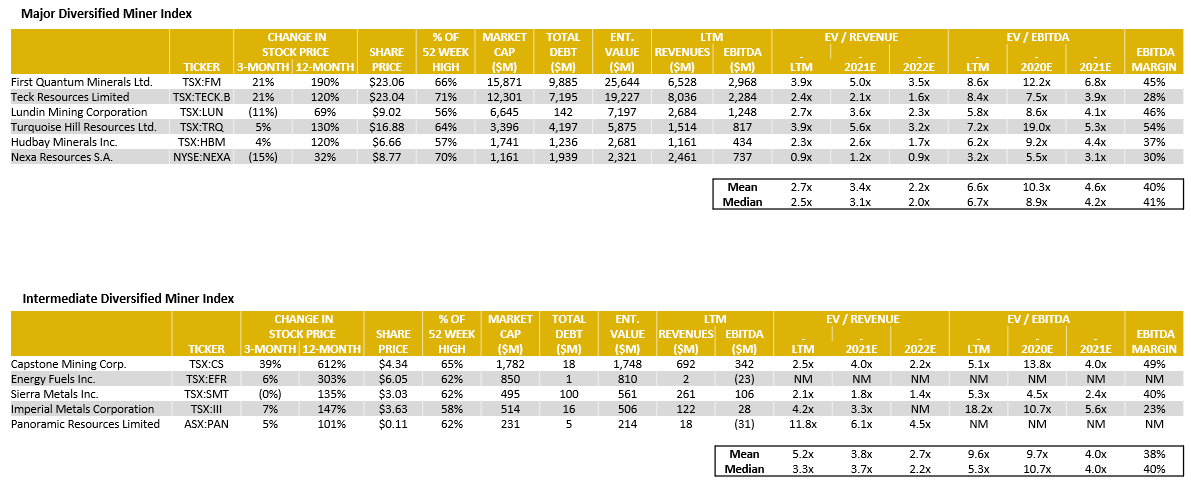
Diversified Mining – Comparable Tables 

Source: Capital IQ as of 06/30/2021

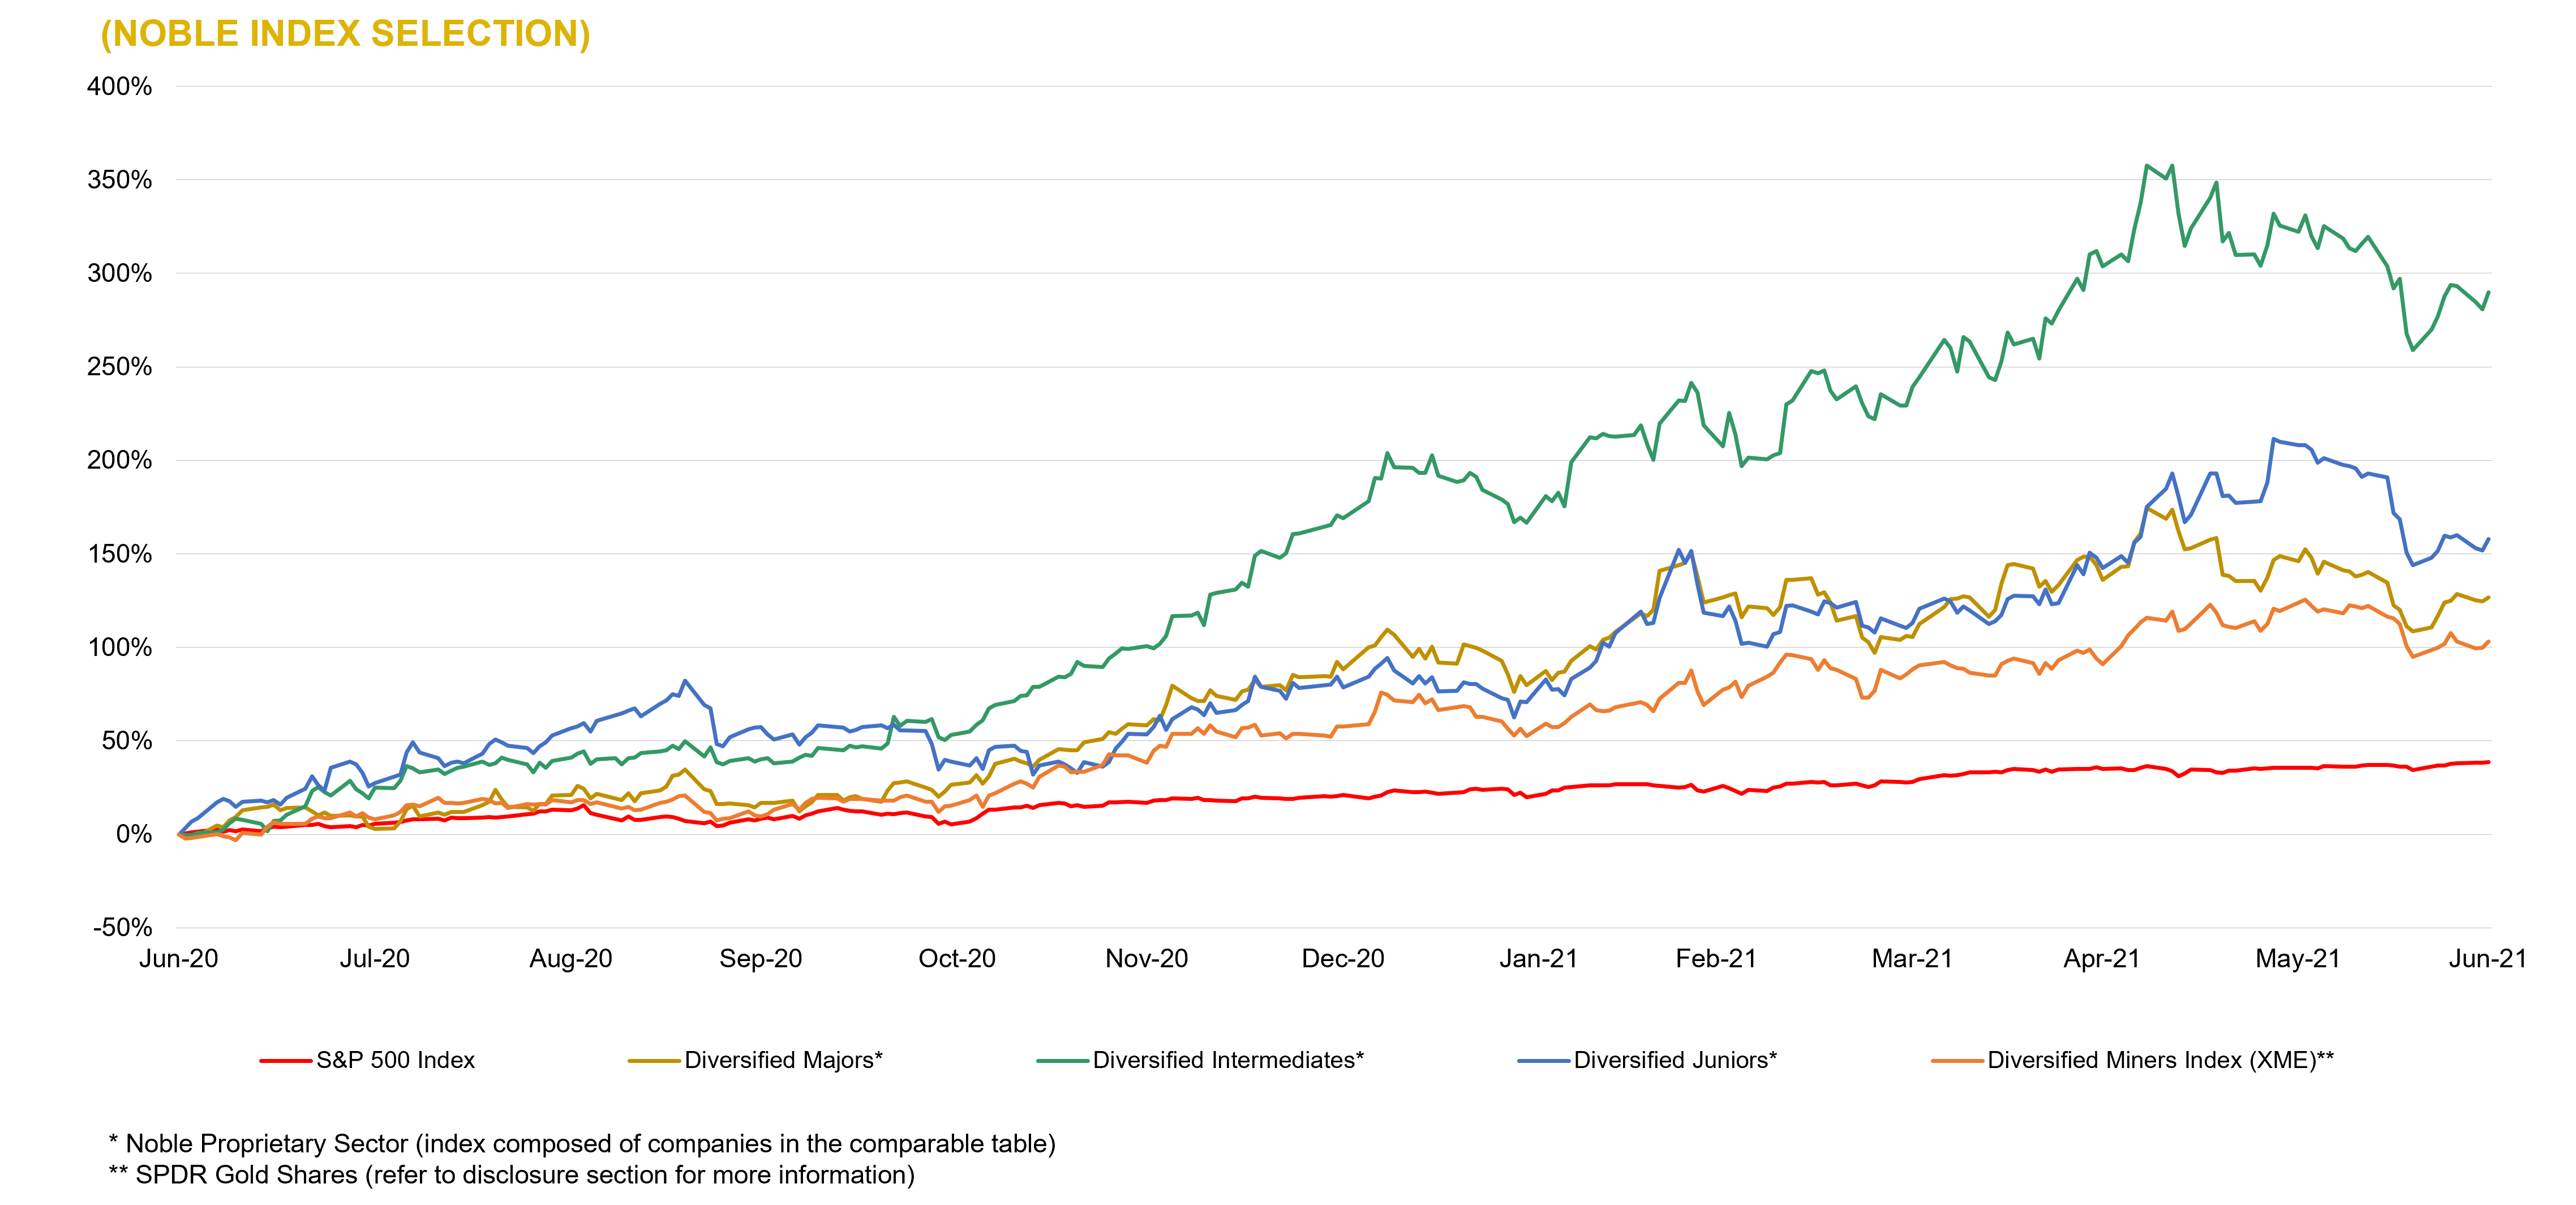
Diversified Mining – LTM Equity Performance 

Source: Capital IQ as of 06/30/2021

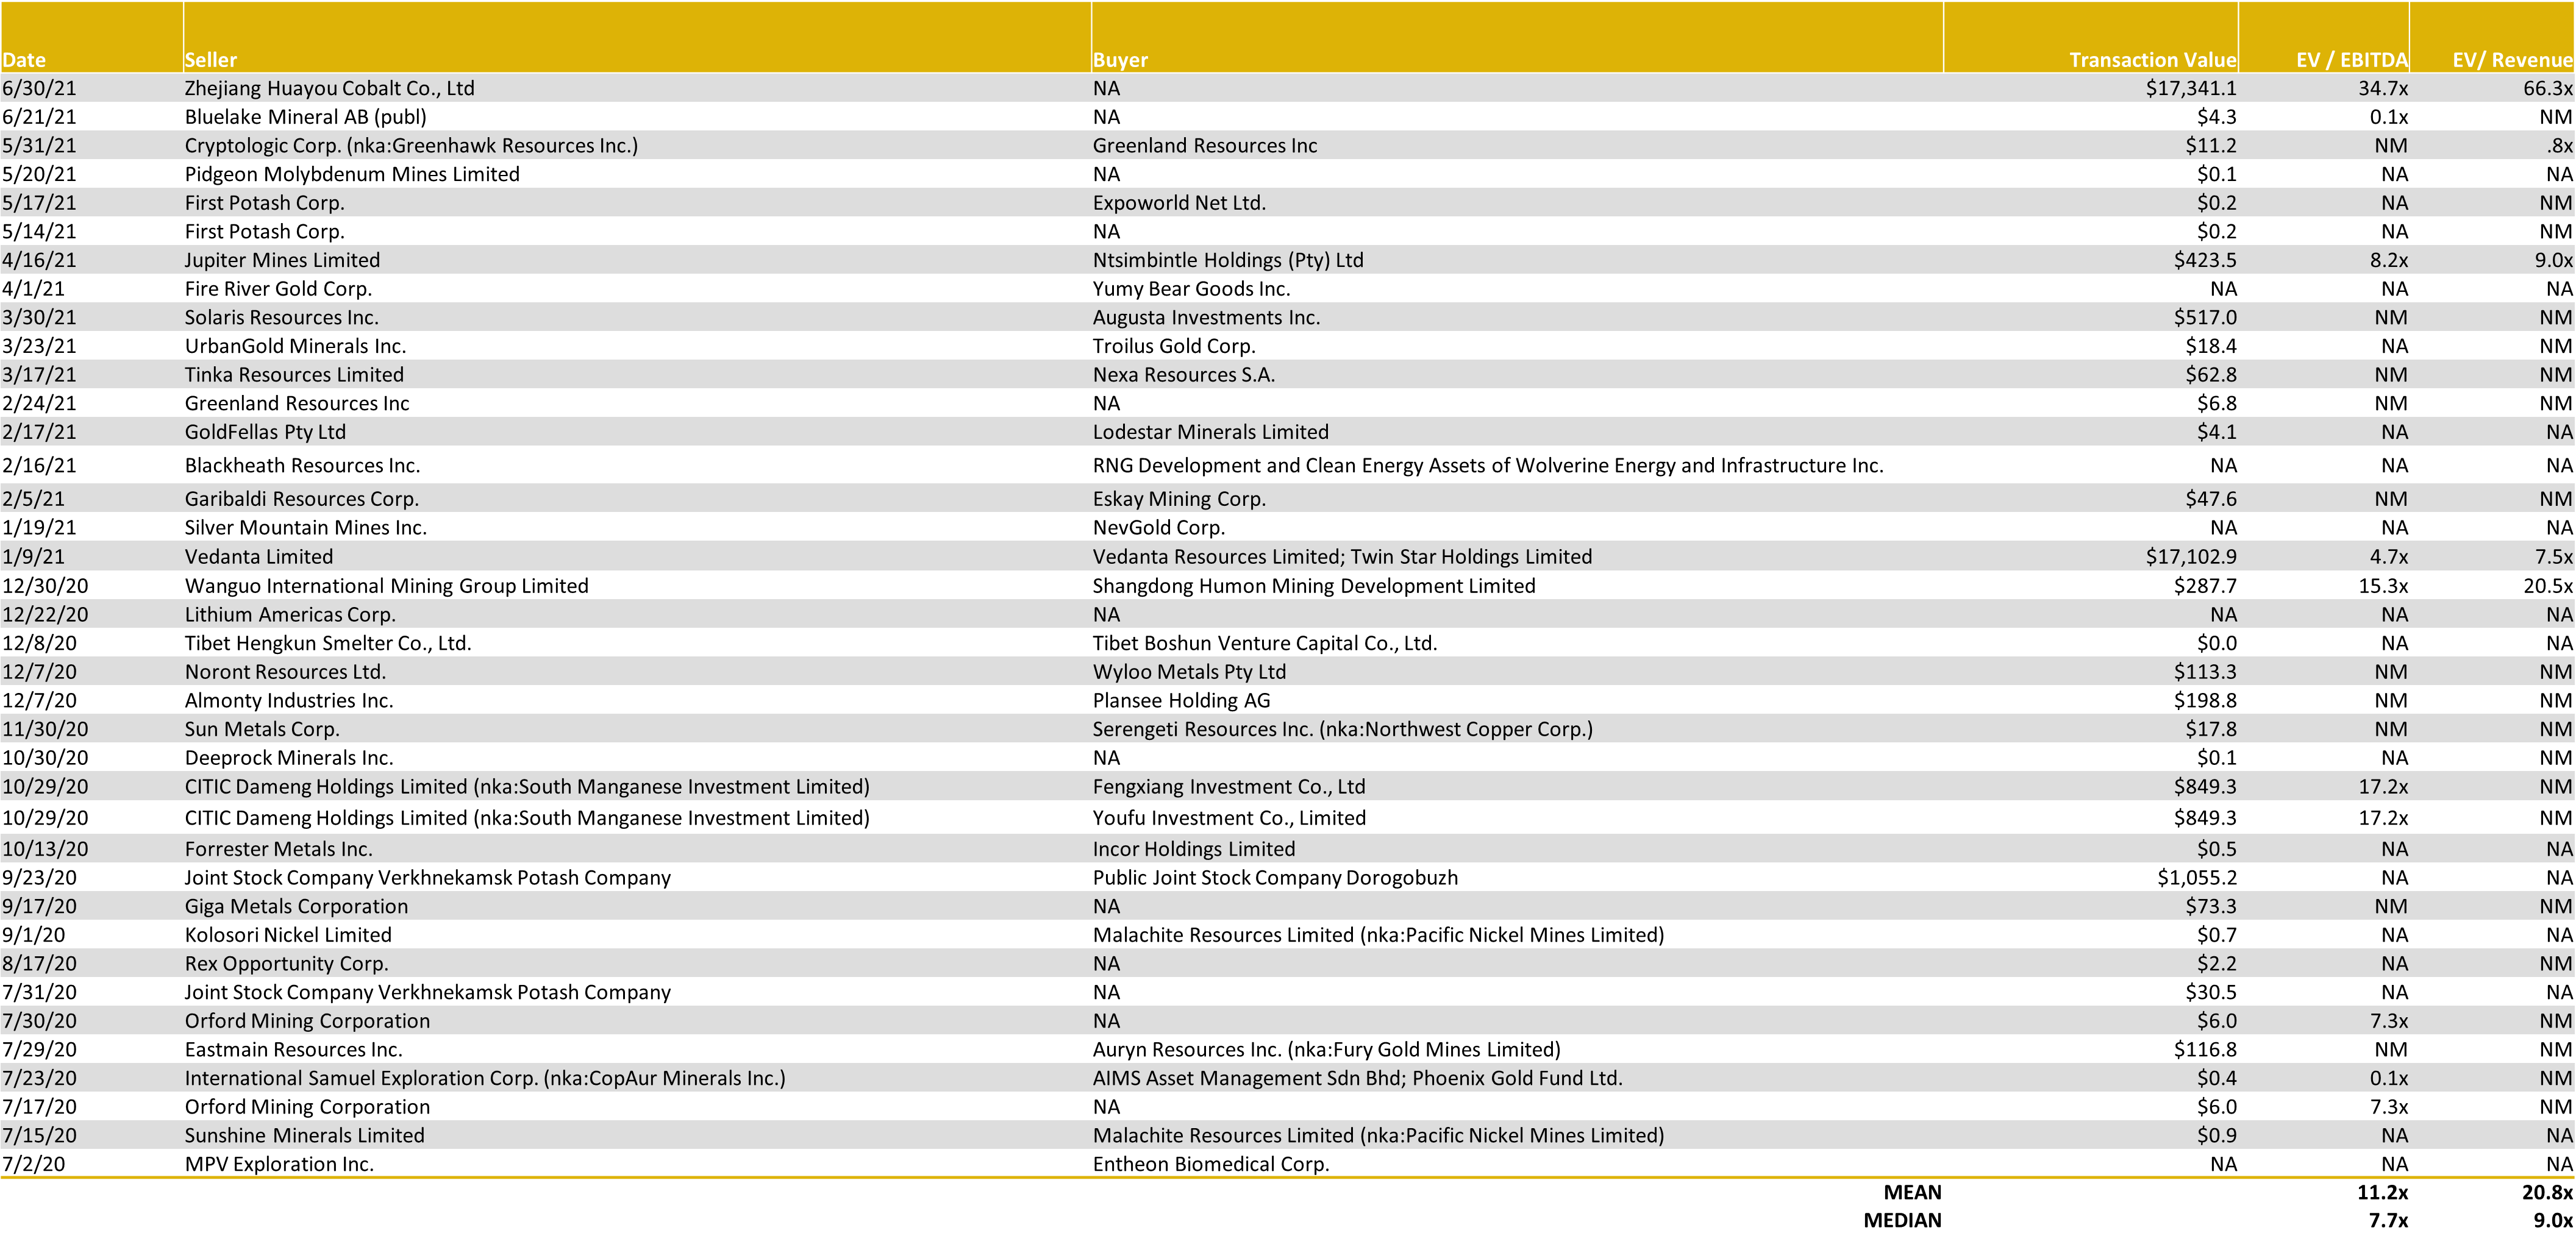
Diversified Mining – LTM Global M&A Activity 

Source: Capital IQ as of 06/30/2021

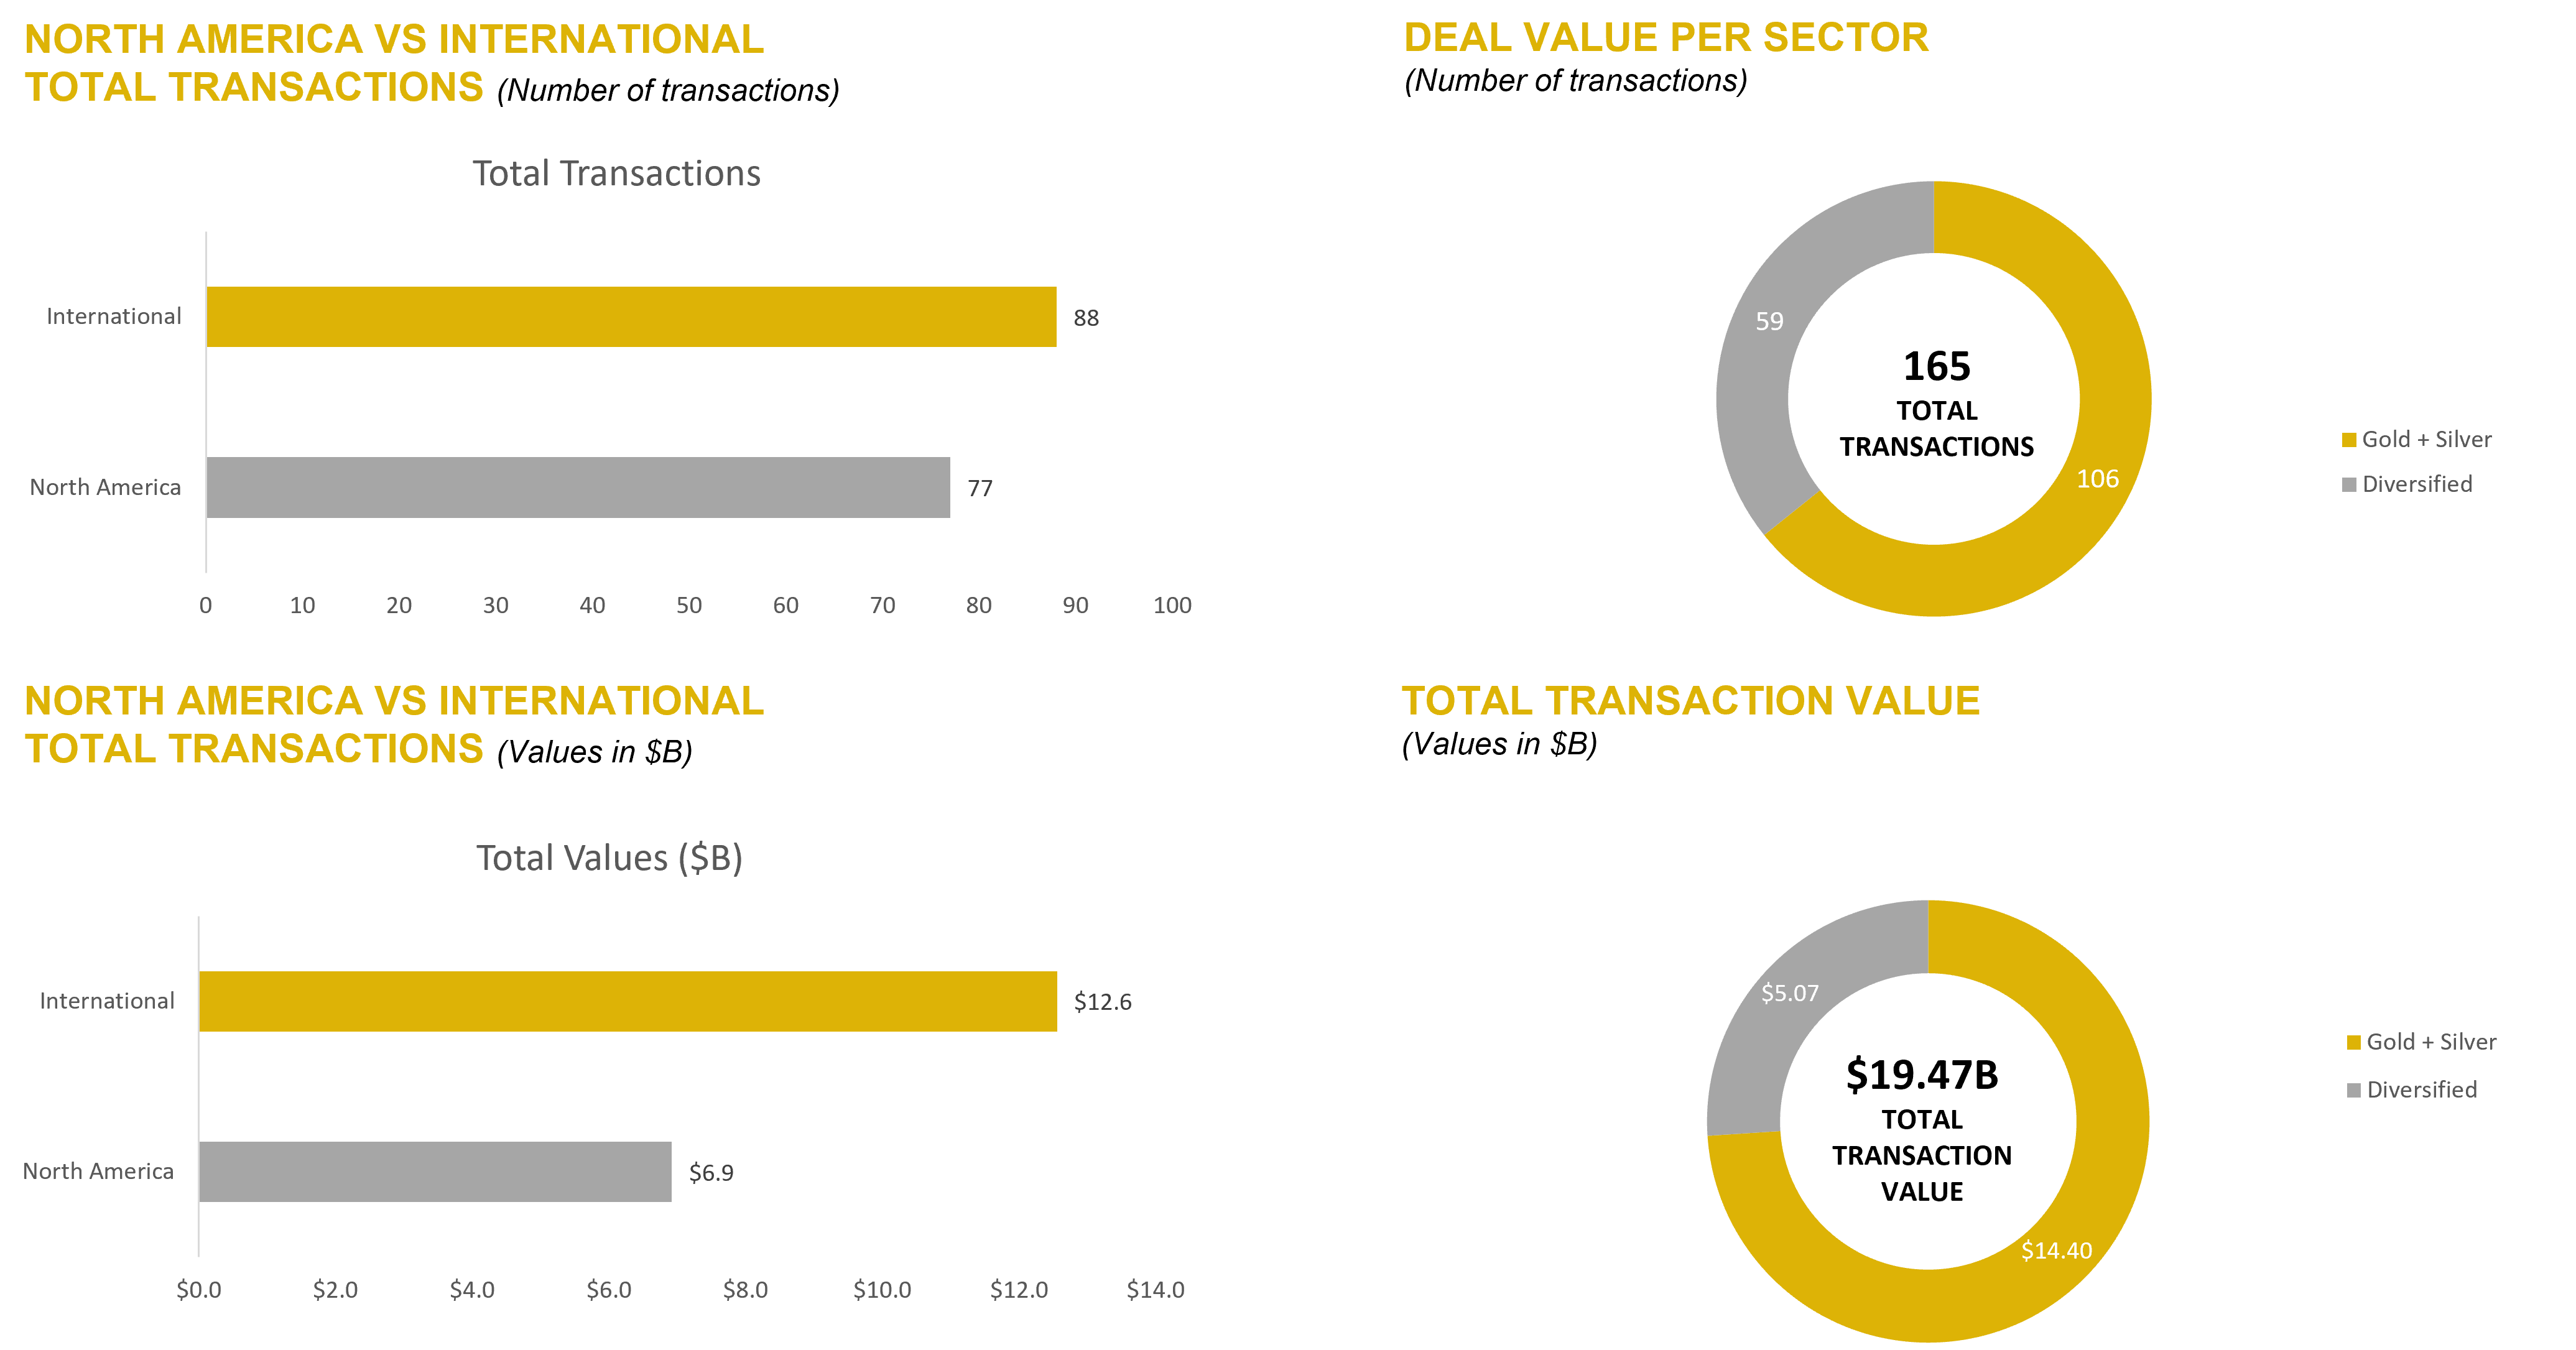
LTM Mining Industry M&A Summary 

Source: Capital IQ as of 06/30/2021

NOBLE QUARTERLY HIGHLIGHTS

Sailfish Royalty Corp. – CDX: FISH

Industry: Metals and Mining – Precious metals; Gold & Silver

Sailfish is a precious metals royalty and streaming company. Within Sailfish’s portfolio are three main assets on advanced stage projects in the Americas: a gold stream equivalent to a 3% NSR on the San Albino gold project (~3.5 sq. km) and a 2% NSR on the rest of the area (~134.5 sq. km) surrounding San Albino in northern Nicaragua; an up to 2.75% NSR on the Tocantinzinho gold project in the prolific Tapajos district of northern Brazil; and an up to 3% NSR on the multi-million-ounce Spring Valley gold project in Pershing County, Nevada.

2nd Quarter News Highlights:

May 12, 2021: Sailfish received the remaining US$3 million from the monetization of a portion of the NSR on the Tocantinzinho Gold Project, located in northern Brazil, and receives first delivery from the San Albino Gold stream, which is in northern Nicaragua. The company’s CEO stated that, “the receipt of the final cash payment from the Transaction and the first delivery from the San Albino gold stream will further bolster the Company’s balance sheet and provide the means to continue repurchasing shares, facilitate the planned spinout of the Gavilanes silver property and explore paying a dividend.”

Great Bear Resources Ltd. – OTCQX: GTBAF

Industry: Metals and Mining – Precious metals; Gold

Great Bear Resources Ltd. is a well-financed gold exploration company managed by a team with a track record of success in mineral exploration. Great Bear is focused in the prolific Red Lake gold district in northwest Ontario, where the company controls over 330 km2 of highly prospective tenure across 5 projects: the flagship Dixie Project (100% owned), the Pakwash Property (earning a 100% interest), the Dedee Property (earning a 100% interest), the Sobel Property (earning a 100% interest), and the Red Lake North Property (earning a 100% interest) all of which are accessible year-round through existing roads.

2nd Quarter News Highlights:

April 7, 2021: The Company announced the addition of a 6th drill to the flagship Dixie Project located at Red Lake district of Ontario. Great Bear’s primary focus remains infill and expansion drilling of the LP Fault zone at 25 – 75 metre centres. However, there remain large undrilled gaps of 100 – 400 metres between existing drill holes in several areas of the LP Fault, and within the other Dixie Project gold zones where step-out and step-down drilling have already successfully expanded the zones, all of which remain open to extension.

Garibaldi resources Corp. – OTC: GGIFF

Industry: Metals and Mining – Diversified metals and mining

Garibaldi Resources Corp. is an active Canadian-based junior exploration company focused on creating shareholder value through discoveries and strategic development of its assets in some of the most prolific mining regions in British Columbia and Mexico.

2nd Quarter News Highlights:

June 11, 2021: Garibaldi Resources announced the addition of key claims expanding the Company’s Otter Creek lode gold prospect to 8,704 total hectares within the Atlin Gold fields. The Otter Creek claims are located 12 kms east of Atlin in northwest British Columbia. Atlin has been a rich placer gold mining district since the Klondike gold rush from the mid 1800’s to the present day, rivalling Barkerville during the Cariboo gold rush. Until recently, the source of Atlin’s coarse gold placers had remained elusive. Significantly, Garibaldi’s geology team considers the expanded claims package covering the Otter Creek placers as an important exploration priority.

Source: Company Press Releases

DOWNLOAD THE FULL REPORT (PDF)

Noble Capital Markets Metals & Mining Newsletter Q2 2021

This newsletter was prepared and provided by Noble Capital Markets, Inc. For any questions and/or requests regarding this newsletter, please contact >Francisco Penafiel

DISCLAIMER

All statements or opinions contained herein that include the words “ we”,“ or “ are solely the responsibility of NOBLE Capital Markets, Inc and do not necessarily reflect statements or opinions expressed by any person or party affiliated with companies mentioned in this report Any opinions expressed herein are subject to change without notice All information provided herein is based on public and non public information believed to be accurate and reliable, but is not necessarily complete and cannot be guaranteed No judgment is hereby expressed or should be implied as to the suitability of any security described herein for any specific investor or any specific investment portfolio The decision to undertake any investment regarding the security mentioned herein should be made by each reader of this publication based on their own appraisal of the implications and risks of such decision This publication is intended for information purposes only and shall not constitute an offer to buy/ sell or the solicitation of an offer to buy/sell any security mentioned in this report, nor shall there be any sale of the security herein in any state or domicile in which said offer, solicitation or sale would be unlawful prior to registration or qualification under the securities laws of any such state or domicile This publication and all information, comments, statements or opinions contained or expressed herein are applicable only as of the date of this publication and subject to change without prior notice Past performance is not indicative of future results.

Please refer to the above PDF for a complete list of disclaimers pertaining to this newsletter

Robo-Attorneys Could Put Some Law Work at Risk


Image Credit: The People Speak! (flickr)


Are Robots Coming After the Law Profession?


Imagine what a lawyer does on a given day: researching cases, drafting briefs, advising clients. While technology has been nibbling around the edges of the legal profession for some time, it’s hard to imagine those complex tasks being done by a robot.

And it is those complicated, personalized tasks that have led technologists to include lawyers in a broader category of jobs that are considered pretty safe from a future of advanced robotics and artificial intelligence.

But, as we discovered in a recent research collaboration to analyze legal briefs using a branch of artificial intelligence known as machine learning, lawyers’ jobs are a lot less safe than we thought. It turns out that you don’t need to completely automate a job to fundamentally change it. All you need to do is automate part of it.


This article was
republished with permission from 
The Conversation, a news site dedicated to sharing ideas from academic experts. It represents the research-based findings and opinions of Elizabeth C. Tippett, Associate Professor of Law, University of Oregon and Charlotte Alexander, Associate Professor of Law and Analytics, Georgia State University. The research cited in this article was produced in collaboration with MITRE, a federally funded non-profit devoted to research and development in the public interest.


While this may be bad news for tomorrow’s lawyers, it could be great for their future clients – particularly those who have trouble affording legal assistance.


Technology Can be Unpredictable

Our research project – in which we collaborated with computer scientists and linguists at MITRE, a federally funded nonprofit devoted to research and development – was not meant to be about automation. As law professors, we were trying to identify the text features of successful versus unsuccessful legal briefs.

We gathered a small cache of legal briefs and judges’ opinions and processed the text for analysis.

One of the first things we learned is that it can be hard to predict which tasks are easily automated. For example, citations in a brief – such as “Brown v. Board of Education 347 U.S. 483 (1954)” – are very easy for a human to pick out and separate from the rest of the text. Not so for machine learning software, which got tripped up in the blizzard of punctuation inside and outside the citation.

It was like those “Captcha” boxes you are asked to complete on websites to prove you’re not a robot – a human can easily spot a telephone pole, but a robot will get confused by all the background noise in the image.

A Tech Shortcut

Once we figured out how to identify the citations, we inadvertently stumbled on a methodology to automate one of the most challenging and time-consuming aspects of legal practice: legal research.

The scientists at MITRE used a methodology called “graph analysis” to create visual networks of legal citations. The graph analysis enabled us to predict whether a brief would “win” based on how well other briefs performed when they included a particular citation.

Later, however, we realized the process could be reversed. If you were a lawyer responding to the other side’s brief, normally you would have to search laboriously for the right cases to cite using an expensive database. But our research suggested that we could build a database with software that would just tell lawyers the best cases to cite. All you would need to is feed the other side’s brief into the machine.

Now we didn’t actually construct our research-shortcut machine. We would need a mountain of lawyers’ briefs and judicial opinions to make something useful. And researchers like us do not have free access to data of that sort – even the government-run database known as PACER charges by the page.

But it does show how technology can turn any task that is extremely time-consuming for humans into one where the heavy lifting can be done at the click of a button.


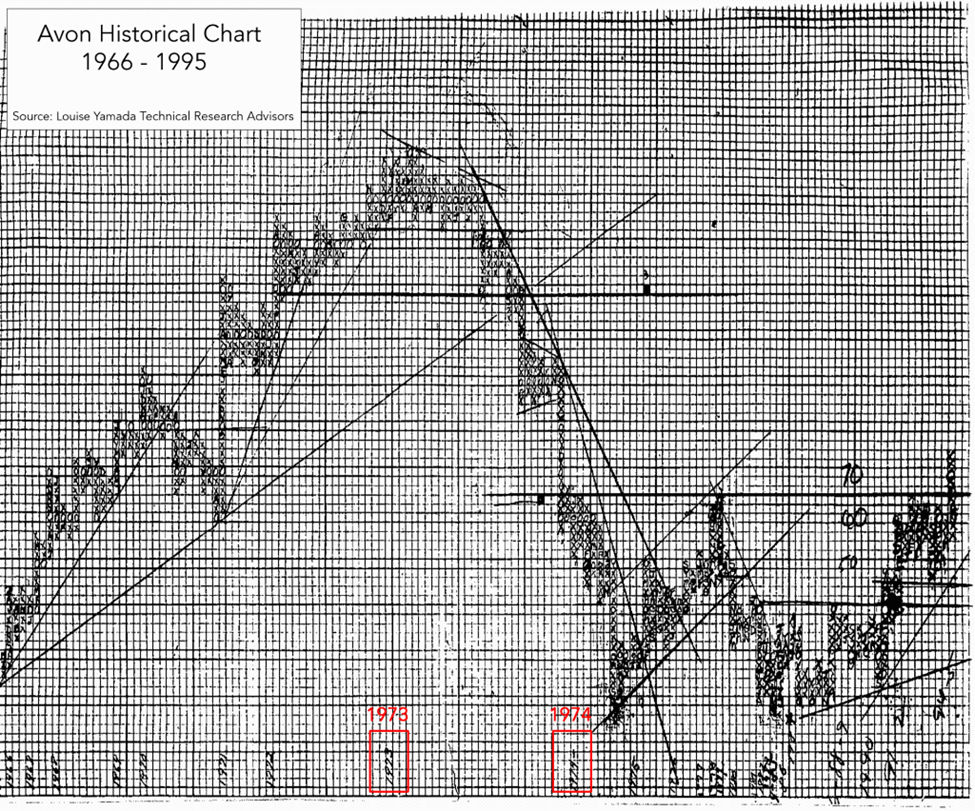
Not long ago, stock charts were updated by hand.Technology has led to automation of updating stock movements. This frees the
investor to focus on other details.


A History of Partial Automation

Automating the hard parts of a job can make a big difference both for those performing the job and the consumers on the other side of the transaction.

Take for example, a hydraulic crane or a power forklift. While today people think of operating a crane as manual work, these powered machines were considered labor-saving devices when they were first introduced because they supplanted the human power involved in moving heavy objects around.

Forklifts and cranes, of course, didn’t replace people. But like automating the grind of legal research, power machines multiplied the amount of work one person could accomplish within a unit of time.

Partial automation of sewing machines in the early 20th century offers another example. By the 1910s, women working in textile mills were no longer responsible for sewing on a single machine – as you might today on a home sewing machine – but wrangling an industrial-grade machine with 12 needles sewing 4,000 stitches per minute. These machines could automatically perform all the fussy work of hemming, sewing seams and even stitching the “embroidery trimming of white underwear.” Like an airline pilot flying on autopilot, they weren’t sewing so much as monitoring the machine for problems.

Was the transition bad for workers? Maybe somewhat, but it was a boon for consumers. In 1912, women perusing the Sears mail order catalog had a choice between “drawers” with premium hand-embroidered trimming, and a much cheaper machine-embroidered option.

Likewise, automation could help reduce the cost of legal services, making it more accessible for the many individuals who can’t afford a lawyer.


Indeed, in other sectors of the economy, technological developments in recent decades have enabled companies to shift work from paid workers to customers.

Touchscreen technology, for example, enabled airlines to install check-in kiosks. Similar kiosks are almost everywhere – in parking lots, gas stations, grocery stores and even fast-food restaurants.

At one level these kiosks are displacing paid labor by employees with unpaid labor by consumers. But that argument assumes that everyone could access the product or service back when it was performed by an employee.

In the context of legal services, the many consumers who can’t afford a lawyer are already forgoing their day in court altogether or handling legal claims on their own – often with bad results. If partial automation means an overwhelmed legal aid lawyer now has time to take more clients’ cases or clients can now afford to hire a lawyer, everyone will be better off.

In addition, tech-enabled legal services can help consumers do a better job of representing themselves. For example, the federal district court in Missouri now offers a platform to help individuals filing for bankruptcy prepare their forms – either on their own or with a free 30-minute meeting with a lawyer. Because the platform provides a head start, both the lawyer and consumer can make better use of the 30-minute time slot.

More help for consumers may be on the way – there is a bumper crop of tech startups jostling to automate various types of legal work. So while our research-shortcut machine hasn’t been built, powerful tools like it may not be far off.

And the lawyers themselves? Like factory and textile workers armed with new power tools, they may be expected to do more work in the time they have. But it should be less of a grind. It might even free them up to meet with clients.


Suggested Reading:


Preparing Investors for the Artificial Intelligence Revolution


AI and Skyborg Technology Will Create Huge Tech Winners


Trading Technology Continues to Level the Playing Field


Tax Treatment of Crypto Miners Could Cause U.S. Exodus


Stay up to date. Follow us:


Release – Digerati Case Studies By Industry


Digerati Case Studies By Industry


Digerati is on the frontline of cloud communications providing telecommunication solutions on its carrier-grade network in a rapidly changing environment.

Gartner recently released new projections based on its sales analysis by technology suppliers and predicts an annual increase of almost 9% in global tech spending, estimated to hit $4.2 trillion by the end of 2021. Spending on cloud computing and other tech services like Unified Communications is expected to reach almost $1.2 trillion this year as businesses look to gain the edge over the competition.

In addition, Gartner notes that investment in cloud and other infrastructure could outpace software applications by the end of 2021 for the first time in many years. Banks, for example, are on-track, investing at least one-tenth of their annual revenues into IT.

Digerati can validate Gartner’s findings through its work in many sectors like financial institutions, the service industry, healthcare, and non-profit organizations.

Here are some frontline case studies that demonstrate Digerati’s solution-based approach to serving its customers.

Case Studies

1. A Community Bank

T3 Communications, a Digerati operating subsidiary, has become the service provider of choice for several regional and local community banks throughout Texas and Florida.

One regional bank has been a client for over ten years. The bank required a unified fiber-optic network to connect its eight branches and meet redundancy protocols to secure its growing operations.

The T3 team implemented a fiber optic network and SIP trunking solution for the bank’s on-premises PBX.

T3’s telecom solution allows the bank’s customers to call into a single phone system to reach the appropriate branch which played a significant role in business continuity and a positive customer experience.

The T3 Team consolidated voice and data services for all branches and streamlined billing into one easy-to-read statement. Enhancements to the network provided by T3 included routing a multicarrier fiber optic network at the bank’s main headquarters through separate building access points. The network enhancements established redundancy by routing distinct carriers to a specific location while hosting a mirror image of the bank’s PBX and network equipment.

This allowed for modernization of the community bank’s safety protocols and established full redundancy with a seamless auto failover via BGP and OSPF protocols.

2. Nationwide Restaurant Chain

A nationwide restaurant chain needed a solution to meet the increased volume of incoming calls for ‘to-go’ orders.

Digerati’s operating subsidiary, Nexogy, created a centralized call center environment for callers to reach each of the restaurant locations.  This call center solution included an auto-attendant with professional greetings and on-hold music.

To improve the caller’s experience, the Nexogy team implemented a Centralized IDR (integrated data repository) and remote agent system, placing the calls in a queue and avoiding busy signals.

The IDR enabled the franchise owner to add restaurants to the same account and simplify all services under one provider and bill. In addition, the Nexogy team met the owner’s telecom budget per restaurant and offered call reports for monitoring, analytics and measuring performance.

The new on-hold features, centralized billing, real-time call reporting, statistics, and even call flow management were excellent IT investments to save time and increase productivity.

3. Health Care Provider

Another client T3 Communications is a nationwide healthcare provider specializing in employee health clinics for Fortune 500 corporate campuses.

This health care provider required a complete cloud communications system to support its physical clinics and to ramp up its telemedicine and remote medical support services.

The T3 team created a dedicated call center, updated their nationwide telco system and network, and tailored a comprehensive UCaaS platform to support physical devices, mobile solutions, and cloud-based applications.

As this client continues to adapt and grow in the new work-from-home professional arena, its communications infrastructure is steadily growing in parallel thanks to the innovative approach by the T3 team.

4. United Way

T3 Communications has also been a solutions provider for many years to its local chapter of United Way located in Southwest Florida by supporting the public 211 social services referral line in four counties.

United Way needed to revamp its entire legacy phone system to better serve the community and increase accountability measures.

211 call center traffic has dramatically increased over the past couple of years, forcing the non-profit to invest in its IT infrastructure.

The T3 team installed a full-featured cloud-based ACD solution for the 211call center, as well as a hosted phone solution for all the other employees and locations. T3 also installed a fiber optic network to support the phone system and internet traffic at the main location.

Through the benefit of having a cloud-based system, this non-profit organization now has the ability to continue  working in an emergency situation. The local United Way is included in the first responders’ team when the local county emergency operations center activates in the event of a hurricane.

T3 was able to provide the required fast, reliable, and affordable communications technology to support people in times of need. T3 provides the critical infrastructure for United Way to successfully accomplish its mission and provide community services.

Conclusion

Through its operating subsidiaries, Digerati serves over 28,000 business users on its platform while increasing customer adoption in diverse industries.

As corporations, businesses, and organizations continue to invest in their IT infrastructure, Digerati will continue to prove itself as an economic and disciplined communications solution provider.

Its robust platform for growth throughout Texas and Florida, combined with its clean and clear fundamentals, growth plan, acquisition strategy, and seasoned leadership team, are expected to increase shareholder value as the Company matures and enters a new phase of growth.

SPAC Correlation in a Diversified Portfolio


How Correlated is the SPAC Asset Class to Other Equities?


While IPOs have been running at a higher than average pace this year, Special Purpose Acquisition Companies (SPAC) have been outpacing the more traditional offerings. As with most investment classes, some have grouped all SPACs together and demonized the entire market, while others have hailed them as the new asset that everyone should have as part of their portfolio.

Not unlike all holdings, the truth as to whether any SPAC “belongs” in your portfolio comes down to the portfolio purpose, amount allocated, and risk-return measurements.

Allocation

The CFA Institute Blog “Enterprising Investor” recently posted research of a study related to allocation. They wanted to measure SPAC holding diversification benefits. Guiding the research was the question, “…are these benefits real or illusory?” To find out they conducted an analysis of all SPACs that have listed since November 2020 and used the CNBC SPAC 50 as representative of a SPAC portfolio. The CNBC SPAC 50 chosen for the pre-acquisition phase proxy, tracks U.S.-based pre-merger deals by market cap. They used statistics from the CNBC post-deal SPAC 50 which is comprised of SPACs that have found a target and gone public.

Have SPACs Benefitted Portfolios?

How have SPACs fared pre and post-deal and against the Russell 2000,  S&P 500, the Dow Jones Industrial Average, the NASDAQ Composite, and the tech stocks (ETF XLK)?  From November 30, 2020 to April 1, 2021, the Pre-deal SPACs underperformed the post-deal measure by 12.15% to 17.61%, about 5 percent.


SPACs vs. The Major Indexes, 30 Nov.
2020 to 1 April 2021

Return Volatility
SPAC 50 Pre-Deal 12.15% 26.52%
SPAC 50 Post-Deal 17.61% 44.31%
S&P 500 11.00% 14.30%
Dow 11.86% 12.33%
NASDAQ 10.50% 21.50%
Russell 2000 23.85% 25.16%
XLK 10.21% 22.13%


Volatility

Both SPAC portfolios endured higher volatility than all the indexes they were measured against. Among the returns of the indivividual post-deal SPACs, the returns are as wide-spread as you’d find in any market.  In the lower quartile of performance, the SPACs averaged negative 30%, while the top quartile averaged a high 81%. 


Diversification

Correlation, or lack thereof, is what makes a good diversifier in a portfolio. You don’t want it to be fully correlated either directly or inversely. Pre-deal SPACs average a correlation coefficient of 0.43 with the major stock indexes. Once merged and public, the correlation coefficient rises to 0.53, a little more than half of 1:1. This suggests that SPACs may offer some diversification benefits in the pre-deal phase; the SPAC benefits erode by about 20% once a deal is fully executed. At this point those looking after the portfolio may wish to consider it as a regular equity holding for diversification purposes.

Some indexes were more correlated than others. Pre-deal, SPACs were most correlated with the NASDAQ Composite, with a correlation coefficient of 0.50. Post-deal SPACs tended to follow the Russell 2000 with a correlation coefficient of 0.66.


SPAC 50: Pre-Deal Correlation

S&P 500 0.44
Dow 0.33
NASDAQ 0.50
Russell 2000 0.45
XLK 0.43


The SPAC 50: Post-Deal Correlation

S&P 500 0.49
Dow 0.37
NASDAQ 0.61
Russell 2000 0.66
XLK 0.52

These correlation coefficients are considered high across the board. They certainly are not the diversifier found between equities and bonds during the same period. The SPAC 50 Index had a 0.068 correlation with the Vanguard Total Bond Index, compared to the 0.112 correlation the S&P 500 had with the bond index.

While SPACs constitute an asset class which has less correlation than say the indexes against one another, the period measured suggests there is a mid-level degree of correlation during the pre-SPAC phase that is largely removed post-SPAC. In the post deal phase, the SPACs are closer to full fledged operating companies than ever. It would make sense that a portfolio manager should, if looking to keep a SPAC allocation look for the next pre-merger deal in order to keep the percentage at their target.

Suggested Reading:


The Lifecycle of a SPAC


Analysis of a SPAC


Regulation of a SPAC


Merger of a SPAC


Sources:

https://www.investopedia.com/managing-wealth/achieve-optimal-asset-allocation/

https://www.sifma.org/wp-content/uploads/2021/03/SIFMA-Insights-Spotlight-SPACs-vs-IPOs-FOR-WEB.pdf

https://blogs.cfainstitute.org/investor/2021/04/26/spacs-an-uncorrelated-asset-class/


Stay up to date. Follow us:


Release – Vectrus Announces Strong Second Quarter Results Increases Revenue and Adjusted Diluted EPS Guidance


Vectrus Announces Strong Second Quarter Results; Increases Revenue and Adjusted Diluted EPS Guidance


Company Release – 8/10/2021
– Q2 revenue +40% Y/Y to $471 million; Organic revenue(1) +21% Y/Y
– Operating margin of 4.8%; Adjusted EBITDA margin(1) of 5.6%
– Q2 fully diluted EPS of $1.35; Adjusted diluted EPS(1) of $1.52
– Increasing 2021 revenue and adjusted diluted EPS(1) guidance
– Pacific region activities driving incremental revenue growth under LOGCAP V
– Successfully phased-in new task orders to provide sustainment services in the Middle East

COLORADO SPRINGS, Colo., Aug. 10, 2021 /PRNewswire/ — Vectrus, Inc. (NYSE: VEC) announced strong second quarter 2021 financial results.

“Our second quarter results are demonstrative of Vectrus’ ability to provide mission critical and rapid response converged solutions across all time zones and operational environments,” said Chuck Prow, Chief Executive Officer of Vectrus.

“During the quarter, revenue grew 40% year-over-year, with organic revenue growth of 21%,” said Prow. “Our strong organic revenue growth in the quarter was driven partly by the successful performance and execution of a task order to support an important training initiative based in the Indo-Pacific region, as well as achieving full operational capability under our new LOGCAP V CENTCOM task order in Iraq.”

“Our adjusted EBITDA margin in the second quarter was strong, reaching 5.6%,” said Prow. “Our year-to-date adjusted EBITDA margin is 5.2%, which is driven in part by the continued focus on operationalizing our enterprise performance improvement initiatives and demonstrates Vectrus’ ability to expand margins over time.” 

“LOGCAP V continues to gain momentum and during the quarter we successfully achieved full operational capability in Iraq,” said Prow. “This transition represents a significant milestone for Vectrus and our employees that worked around the clock in challenging environments to ensure client success. We look forward to serving as the Army’s preferred source for base operations support and sustainment services in Iraq over the next several years.”

Prow continued, “In terms of INDOPACOM, we are experiencing growth executing task orders to support mission requirements in the region.  We expect growth to continue as we ramp up operations in Kwajalein and become fully operational by mid-2022.” 

“We are also continuing to execute client campaigns by inserting innovative technology-based solutions into infrastructure and creating value through mission effectiveness and cost reduction,” said Prow. “In the second quarter, we were awarded a position on the U.S. Navy Supply Systems Command Worldwide Expeditionary Multiple Award IDIQ Contract2 (WEXMAC). WEXMAC provides worldwide expeditionary supplies and services to support humanitarian and disaster relief, military exercises, and contingencies in 22 geographic regions.  This award builds on our position under the Naval Facilities Engineering Command Global Contingency Services Multiple Award IDIQ Contract II, which has been an instrumental part of our Navy campaign. Importantly, WEXMAC represents another avenue to access this important client and we see significant opportunity to leverage Vectrus’ geographic positioning to support future opportunities under this new contract.”  

“Additionally, we continue to focus on advancing our presence with the Air Force and in the second quarter won two new firm-fixed-price task orders valued at $40 million to provide installation and other support services, which were awarded under the Air Force Contract Augmentation Program V, or AFCAP V, which is a $6.4 billion IDIQ contract vehicle that provides contingency planning, deploying, training, and equipping of forces; emergency and contingency construction; and logistics and commodities and services,” said Prow.

Second Quarter 2021 Results

Second quarter 2021 revenue of $470.8 million was up $134.8 million year-on-year or 40.1% as compared to the same period last year.  Revenue grew by $64.4 million year-over-year as a result of the two acquisitions on December 31, 2020 and grew $70.4 million organically. 

Operating income was $22.6 million or 4.8% margin.  Adjusted operating income1 was $25.0 million or 5.3% margin.

Adjusted EBITDA1 was $26.6 million or 5.6% margin. “Margin improved 360 basis points year-over-year in the second quarter and 210 basis points year-to-date,” said Susan Lynch, Senior Vice President and Chief Financial Officer. “Our strong first half results were driven by the ongoing execution of our enterprise performance improvement initiatives, recent acquisitions, our team’s success converting certain cost-plus components of a contract to fixed price and continued focus on prudently managing our cost structure. We remain focused on transforming Vectrus into a higher margin business and our second quarter and year-to-date performance reflects our ability to expand margins over time.”  

Fully diluted EPS for the second quarter of 2021 was $1.35 as compared to $0.09 cents in the same period last year. Adjusted diluted EPS1, which adds back amortization of acquired intangible assets, was $1.52 for the quarter, as compared to $0.31 cents in the prior year.  The increase in diluted EPS was driven by the company’s improved operating performance and two recent acquisitions.

Lynch continued, “Our results year-to-date are representative of Vectrus’ ability to generate substantial growth and earnings power. The second quarter results demonstrate our organic ability and how our strategic acquisitions are transforming the company into a higher value, growth-oriented platform. Our thoughtful deployment of capital is adding value from both an operational and financial perspective and we believe our strong balance sheet positions Vectrus to pursue future opportunities that align with our strategy and increase shareholder value.”

Cash provided by operating activities through July 2, 2021 was $14.0 million. Operating cash flow decreased year on year primarily due to the CARES Act Benefit in Q2’20 of $13 million in addition to the working capital requirements associated with several new program phase-ins.

Net debt at July 2, 2021 was $105.2 million, up $100.4 million from July 3, 2020. Total debt at July 2, 2021 was $175.0 million, up $107.5 million from $67.5 million at July 3, 2020. Both net and total debt were up due to the acquisitions of Zenetex and HHB on December 31, 2020. Cash at quarter-end was $69.8 million. Total consolidated indebtedness to consolidated EBITDA1 (total leverage ratio) was 1.76x.

Total backlog as of July 2, 2021 was $4.9 billion and funded backlog was $1.3 billion. The trailing twelve-month book-to-bill was 1.2x as of July 2, 2021. 

Increasing 2021 Revenue and EPS Guidance

Lynch continued, “In light of our strong year-to-date performance, we are increasing the revenue and diluted EPS guidance ranges.” Guidance for 2021 is as follows:

$ millions, except for EBITDA margins and per share amounts

2020
Actual

2021 Guidance

2021
Mid-Point

2021
Mid-Point
vs 2020

Revenue

$1,396

$1,745

to

$1,780

$1,762

26.2%

Operating Income Margin

3.1%

3.7%

to

3.9%

3.8%

70 bps

Adjusted EBITDA Margin1

4.0%

4.8%

to

5.0%

4.9%

90 bps

Earnings Per Share

$3.14

$3.87

to

$4.18

$4.02

28.0%

Adjusted Diluted Earnings Per Share1

$3.36

$4.76

to

$5.07

$4.92

46.4%

Net Cash Provided by Operating Activities

$64.1

$58.0

to

$65.0

$61.5

(4.1%)

Forward-looking statements are based upon current expectations and are subject to factors that could cause actual results to differ materially from those suggested here, including those factors set forth in the Safe Harbor Statement below. 

Second Quarter 2021 Conference Call

Management will conduct a conference call with analysts and investors at 4:30 p.m. ET on Tuesday, August 10, 2021. U.S.-based participants may dial in to the conference call at 877-407-0792, while international participants may dial 201-689-8263. A live webcast of the conference call as well as an accompanying slide presentation will be available on the Vectrus Investor Relations website at http://investors.vectrus.com or https://www.webcaster4.com/Webcast/Page/1431/42374.

A replay of the conference call will be posted on the Vectrus website shortly after completion of the call and will be available for one year. A telephonic replay will also be available through August 24, 2021, at 844-512-2921 (domestic) or 412-317-6671 (international) with passcode 13721935.

Footnotes:
1 See “Key Performance Indicators and Non-GAAP Financial Measures” for reconciliation.
2 WEXMAC is currently under protest.

About Vectrus

For more than 70 years, Vectrus has provided critical mission support for our customers’ toughest operational challenges. As a high-performing organization with exceptional talent, deep domain knowledge, a history of long-term customer relationships, and groundbreaking technical expertise, we deliver innovative, mission-matched solutions for our military and government customers worldwide. Whether it’s base operations support, supply chain and logistics, IT mission support, engineering and digital integration, security, or maintenance, repair, and overhaul, our customers count on us for on-target solutions that increase efficiency, reduce costs, improve readiness, and strengthen national security. Vectrus is headquartered in Colorado Springs, Colo., and includes approximately 9,200 employees spanning 206 locations in 27 countries. In 2020, Vectrus generated sales of $1.4 billion. For more information, visit the company’s website at www.vectrus.com or connect with Vectrus on Facebook, Twitter, and LinkedIn.

Safe Harbor Statement

Safe Harbor Statement under the Private Securities Litigation Reform Act of 1995 (the “Act”): Certain material presented herein includes forward-looking statements intended to qualify for the safe harbor from liability established by the Act. These forward-looking statements include, but are not limited to, all of the statements and items listed in the table in “2021 Guidance” above and other assumptions contained therein for purposes of such guidance, other statements about our 2021 performance outlook, five-year growth plan, revenue, DSO, contract opportunities, the potential impact of COVID-19, and any discussion of future operating or financial performance.

Whenever used, words such as “may,” “are considering,” “will,” “likely,” “anticipate,” “estimate,” “expect,” “project,” “intend,” “plan,” “believe,” “target,” “could,” “potential,” “continue,” “goal” or similar terminology are forward-looking statements. These statements are based on the beliefs and assumptions of our management based on information currently available to management.

These forward-looking statements are not guarantees of future performance, conditions or results, and involve a number of known and unknown risks, uncertainties, assumptions and other important factors, many of which are outside our management’s control, that could cause actual results to differ materially from the results discussed in the forward-looking statements. For a discussion  of some of the risks and important factors that could cause actual results to differ from such forward-looking statements, see the risks and other factors detailed from time to time our Annual Report on Form 10-K, Quarterly Reports on Form 10-Q, and other filings with the U.S. Securities and Exchange Commission.

We undertake no obligation to update any forward-looking statements, whether as a result of new information, future events or otherwise, except as required by law.

VECTRUS, INC.

CONDENSED CONSOLIDATED STATEMENTS OF INCOME (UNAUDITED)


Three Months Ended


Six Months Ended


July 2,


July 3,


July 2,


July 3,

(In thousands, except per share data)


2021


2020


2021


2020

Revenue


$

470,845


$

336,063


$

904,849


$

687,797


Cost of revenue


422,660


311,817


816,308


631,510


Selling, general, and administrative expenses


25,605


21,816


49,427


41,374


Operating income


22,580


2,430


39,114


14,913


Interest expense, net


(2,253)


(1,346)


(4,186)


(3,048)


Income from operations before income taxes


20,327


1,084


34,928


11,865


Income tax (benefit) expense


4,393


(27)


6,946


2,086


Net income


$

15,934


$

1,111


$

27,982


$

9,779


Earnings per share


Basic


$

1.36


$

0.10


$

2.40


$

0.84


Diluted


$

1.35


$

0.09


$

2.37


$

0.83


Weighted average common shares outstanding – basic


11,715


11,607


11,681


11,575


Weighted average common shares outstanding – diluted


11,828


11,745


11,823


11,742


VECTRUS, INC. 

CONDENSED CONSOLIDATED BALANCE SHEETS (UNAUDITED)


July 2,


December 31,

(In thousands, except share information)


2021


2020

Assets


Current assets


Cash and cash equivalents


$

69,803


$

66,949


Restricted cash


1,778


Receivables


353,813


314,959


Other current assets


27,594


24,702


Total current assets


451,210


408,388


Property, plant, and equipment, net


22,612


22,573


Goodwill


317,608


339,702


Intangible assets, net


68,818


48,105


Right-of-use assets


26,997


18,718


Other non-current assets


8,902


6,325


Total non-current assets


444,937


435,423


Total Assets


$

896,147


$

843,811


Liabilities and Shareholders’ Equity


Current liabilities


Accounts payable


$

175,002


$

159,586


Compensation and other employee benefits


90,646


79,568


Short-term debt


9,800


8,600


Other accrued liabilities


41,223


40,657


Total current liabilities


316,671


288,411


Long-term debt, net


163,997


168,751


Deferred tax liability


39,709


39,386


Other non-current liabilities


42,946


42,325


Total non-current liabilities


246,652


250,462


Total liabilities


563,323


538,873


Commitments and contingencies (Note 10)


Shareholders’ Equity


Preferred stock; $0.01 par value; 10,000,000 shares authorized; No shares issued and outstanding


Common stock; $0.01 par value; 100,000,000 shares authorized; 11,724,430 and 11,624,717 shares
issued and outstanding as of July 2, 2021 and December 31, 2020, respectively                                      


117


116


Additional paid in capital


84,650


82,823


Retained earnings


250,008


222,026


Accumulated other comprehensive loss


(1,951)


(27)


Total shareholders’ equity


332,824


304,938


Total Liabilities and Shareholders’ Equity


$

896,147


$

843,811


VECTRUS, INC.

CONDENSED CONSOLIDATED STATEMENTS OF CASH FLOWS (UNAUDITED)


Six Months Ended


July 2,


July 3,

(In thousands)


2021


2020

Operating activities


Net income


$

27,982


$

9,779


Adjustments to reconcile net income to net cash (used in) provided by operating activities:

Depreciation expense


3,097


1,971


Amortization of intangible assets


4,891


2,028


Loss on disposal of property, plant, and equipment


60


Stock-based compensation


4,923


5,411


Amortization of debt issuance costs


463


193


Changes in assets and liabilities:


Receivables


(38,882)


9,429


Other assets


(4,063)


(7,938)


Accounts payable


18,784


(6,021)


Deferred taxes


370


(2,735)


Compensation and other employee benefits


11,285


7,037


Other liabilities


(14,884)


15,252


Net cash provided by operating activities


14,026


34,406


Investing activities


Purchases of capital assets and intangibles


(4,833)


(2,246)


Proceeds from the disposition of assets


16


Business acquisition purchase price adjustment


262


Contribution to join venture


(1,846)


Net cash used in investing activities


(6,401)


(2,246)


Financing activities


Repayments of long-term debt


(4,000)


(3,000)


Proceeds from revolver


215,000


144,000


Repayments of revolver


(215,000)


(144,000)


Proceeds from exercise of stock options


113


59


Payments of debt issuance costs


(17)


Payments of employee withholding taxes on share-based compensation


(2,272)


(1,873)


Net cash used in financing activities


(6,176)


(4,814)


Exchange rate effect on cash


(373)


55


Net change in cash, cash equivalents and restricted cash


1,076


27,401


Cash, cash equivalents and restricted cash-beginning of year


68,727


35,318


Cash, cash equivalents and restricted cash-end of period


$

69,803


$

62,719


Supplemental disclosure of cash flow information:


Interest paid


$

3,111


$

2,527


Income taxes paid


$

5,747


$

70


Purchase of capital assets on account


$

618


$

447


Key Performance Indicators and Non-GAAP Measures

The primary financial performance measures we use to manage our business and monitor results of operations are revenue trends and operating income trends. Management believes that these financial performance measures are the primary drivers for our earnings and net cash from operating activities. Management evaluates its contracts and business performance by focusing on revenue, operating income, and operating margin. Operating income represents revenue less both cost of revenue and selling, general and administrative (SG&A) expenses. Cost of revenue consists of labor, subcontracting costs, materials, and an allocation of indirect costs, which includes service center transaction costs. SG&A expenses consist of indirect labor costs (including wages and salaries for executives and administrative personnel), bid and proposal expenses and other general and administrative expenses not allocated to cost of revenue. We define operating margin as operating income divided by revenue.

We manage the nature and amount of costs at the program level, which forms the basis for estimating our total costs and profitability. This is consistent with our approach for managing our business, which begins with management’s assessing the bidding opportunity for each contract and then managing contract profitability throughout the performance period.

In addition to the key performance measures discussed above, we consider adjusted operating income, adjusted operating margin, adjusted net income, adjusted diluted earnings per share, EBITDA, adjusted EBITDA, EBITDA margin, adjusted EBITDA margin, and organic revenue to be useful to management and investors in evaluating our operating performance, and to provide a tool for evaluating our ongoing operations. This information can assist investors in assessing our financial performance and measures our ability to generate capital for deployment among competing strategic alternatives and initiatives. We provide this information to our investors in our earnings releases, presentations, and other disclosures.

Adjusted operating income, adjusted operating margin, adjusted net income, adjusted diluted earnings per share, EBITDA, adjusted EBITDA, EBITDA margin, adjusted EBITDA margin, and organic revenue, however, are not measures of financial performance under GAAP and should not be considered a substitute for operating income, operating margin, net income and diluted earnings per share as determined in accordance with GAAP.  Definitions and reconciliations of these items are provided below.

  • Adjusted operating income is defined as operating income, adjusted to exclude items that may include, but are not limited to significant charges or credits, and unusual and infrequent non-operating items, such as M&A transaction and LOGCAP V pre-operational legal costs, and amortization of acquired intangible assets that impact current results but are not related to our ongoing operations.
  • Adjusted operating margin is defined as adjusted operating income divided by revenue.
  • Adjusted net income is defined as net income, adjusted to exclude items that may include, but are not limited to, significant charges or credits, and unusual and infrequent non-operating items, such as M&A transaction and LOGCAP V pre-operational legal costs, and amortization of acquired intangible assets that impact current results but are not related to our ongoing operations.
  • Adjusted diluted earnings per share is defined as adjusted net income divided by the weighted average diluted common shares outstanding.
  • EBITDA is defined as operating income, adjusted to exclude depreciation and amortization.
  • Adjusted EBITDA is defined as EBITDA, adjusted to exclude items that may include, but are not limited to, significant charges or credits and unusual and infrequent non-operating items, such as M&A transaction and LOGCAP V pre-operational legal costs that impact current results but are not related to our ongoing operations.
  • EBITDA margin is defined as EBITDA divided by revenue.
  • Adjusted EBITDA margin is defined as Adjusted EBITDA divided by revenue.
  • Organic revenue is defined as revenue, adjusted to exclude revenue from acquired companies.


Adjusted Net Income, Adjusted Diluted Earnings Per Share (Non-GAAP Measures)


($ in thousands, except per share data)


Three Months Ended July 2, 2021 As Reported


M&A Related Costs


LOGCAP V Pre-Operational Legal Costs


Amortization of acquired intangible assets


Three Months Ended July 2, 2021 As Reported – Adjusted


Revenue


$

470,845


$


$


$


$

470,845


Growth


40.1

%


40.1

%

Operating income


$

22,580


$


$

21


$

2,436


$

25,037


Operating margin


4.8

%


5.3

%


Interest expense, net


$

(2,253)


$


$


$


$

(2,253)


Income from operations before income taxes


$

20,327


$


$

21


$

2,436


$

22,784


Income tax expense


$

4,393


$


$

4


$

463


$

4,860


Income tax rate


21.6

%


21.3

%


Net income


$

15,934


$


$

17


$

1,973


$

17,924


Weighted average common shares outstanding, diluted


11,828


11,828


Diluted earnings per share


$

1.35


$


$


$

0.17


$

1.52


EBITDA (Non-GAAP Measures)


($ in thousands)


Three Months Ended July 2, 2021 As Reported


M&A Related Costs


LOGCAP V Pre-Operational Legal Costs


Amortization of acquired intangible assets


Three Months Ended July 2, 2021 As Reported – Adjusted

Operating Income


$

22,580


$


$

21


$

2,436


$

25,037


Add:


Depreciation and amortization


$

3,991


$


$


$

(2,436)


$

1,555


EBITDA


$

26,571


$


$

21


$


$

26,592


EBITDA Margin


5.6

%


5.6

%


Adjusted Net Income, Adjusted Diluted Earnings Per Share (Non-GAAP Measures)


($ in thousands, except per share data)


Three Months Ended July 3, 2020 As Reported


M&A Related Costs


LOGCAP V Pre-Operational Legal Costs


Amortization of acquired intangible assets


Three Months Ended July 3, 2020 As Reported – Adjusted


Revenue


$

336,063


$


$


$


$

336,063


Operating income


$

2,430


$

2,193


$

46


$

1,013


$

5,682


Operating margin


0.7

%


1.7

%


Interest expense, net


$

(1,346)


$


$


$


$

(1,346)


Income from operations before income taxes


$

1,084


$

2,193


$

46


$

1,013


$

4,336


Income tax expense


$

(27)


$

504


$

11


$

171


$

659


Income tax rate


(2.5)

%


15.2

%


Net income


$

1,111


$

1,689


$

35


$

842


$

3,677


Weighted average common shares outstanding, diluted


11,745


11,745


Diluted earnings per share


$

0.09


$

0.14


$


$

0.07


$

0.31


EBITDA (Non-GAAP Measures)


($ in thousands)


Three Months Ended July 3, 2020 As Reported


M&A Related Costs


LOGCAP V Pre-Operational Legal Costs


Amortization of acquired intangible assets


Three Months Ended July 3, 2020 As Reported – Adjusted

Operating Income


$

2,430


$

2,193


$

46


$

1,013


$

5,682


Add:


Depreciation and amortization


$

1,988


$


$


$

(1,013)


$

975


EBITDA


$

4,418


$

2,193


$

46


$


$

6,657


EBITDA Margin


1.3

%


2.0

%


Adjusted Net Income, Adjusted Diluted Earnings Per Share (Non-GAAP Measures)


($ in thousands, except per share data)


Six Months Ended July 2, 2021 As Reported


M&A Related Costs


LOGCAP V Pre-Operational Legal Costs


Amortization of acquired intangible assets


Six Months Ended July 2, 2021 As Reported – Adjusted


Revenue


$

904,849


$


$


$


$

904,849


Growth


31.6%


31.6%


Growth


%


1

%

Operating income


$

39,114


$


$

178


$

4,891


$

44,183


Operating margin


4.3

%


4.9

%


Interest expense, net


$

(4,186)


$


$


$


$

(4,186)


Income from operations before income taxes


$

34,928


$


$

178


$

4,891


$

39,997


Income tax expense


$

6,946


$


$

34


$

929


$

7,909


Income tax rate


19.9

%


19.8

%


Net income


$

27,982


$


$

144


$

3,962


$

32,088


Weighted average common shares outstanding, diluted


11,823


11,823


Diluted earnings per share


$

2.37


$


$

0.01


$

0.33


$

2.71


EBITDA (Non-GAAP Measures)


($ in thousands)


Six Months Ended July 2, 2021 As Reported


M&A Related Costs


LOGCAP V Pre-Operational Legal Costs


Amortization of acquired intangible assets


Six Months Ended July 2, 2021 As Reported – Adjusted

Operating Income


$

39,114


$


$

178


$

4,891


$

44,183


Add:


Depreciation and amortization


$

7,989


$


$


$

(4,891)


$

3,097


EBITDA


$

47,103


$


$

178


$


$

47,280


EBITDA Margin


5.2

%


5.2

%


Adjusted Net Income, Adjusted Diluted Earnings Per Share (Non-GAAP Measures)


($ in thousands, except per share data)


Six Months Ended July 3, 2020 As Reported


M&A Related Costs


LOGCAP V Pre-Operational Legal Costs


Amortization of acquired intangible assets


Six Months Ended July 3, 2020 As Reported – Adjusted


Revenue


$

687,797


$


$


$


$

687,797


Operating income


$

14,913


$

2,193


$

187


$

2,028


$

19,321


Operating margin


2.2

%


2.8

%


Interest expense, net


$

(3,048)


$


$


$


$

(3,048)


Income from operations before income taxes


$

11,865


$

2,193


$

187


$

2,028


$

16,273


Income tax expense


$

2,086


$

504


$

39


$

342


$

2,971


Income tax rate


17.6

%


18.3

%


Net income


$

9,779


$

1,689


$

148


$

1,686


$

13,302


Weighted average common shares outstanding, diluted


11,742


11,742


Diluted earnings per share


$

0.83


$

0.14


$

0.01


$

0.14


$

1.13


EBITDA (Non-GAAP Measures)


($ in thousands)


Six Months Ended July 3, 2020 As Reported


M&A Related Costs


LOGCAP V Pre-Operational Legal Costs


Amortization of acquired intangible assets


Six Months Ended July 3, 2020 As Reported – Adjusted

Operating Income


$

14,913


$

2,193


$

187


$

2,028


$

19,321


Add:


Depreciation and amortization


$

3,999


$


$


$

(2,028)


$

1,971


EBITDA


$

18,912


$

2,193


$

187


$


$

21,292


EBITDA Margin


2.7

%


3.1

%


($ In thousands)


Three Months Ended July 2, 2021 As Reported


Three Months Ended July 2, 2021 Zenetex & HHB


Three Months Ended July 2, 2021 As Reported – Organic


Revenue


$

470,845


$

64,397


$

406,448


($ In thousands)


Three Months Ended July 3, 2020 As Reported


Three Months Ended July 3, 2020 Zenetex & HHB


Three Months Ended July 3, 2020 As Reported – Organic


Revenue


$

336,063


$


$

336,063


Organic Revenue $


$

70,385


Organic Revenue %


20.9

%


($ In thousands)


Six Months Ended July 2, 2021 As Reported


Six Months Ended July 2, 2021 Zenetex & HHB


Six Months Ended July 2, 2021 As Reported – Organic


Revenue


$

904,849


$

133,266


$

771,583


($ In thousands)


Six Months Ended July 3, 2020 As Reported


Six Months Ended July 3, 2020 Zenetex & HHB


Six Months Ended July 3, 2020 As Reported – Organic


Revenue


$

687,797


$


$

687,797


Organic Revenue $


$

83,786


Organic Revenue %


12.2

%


SUPPLEMENTAL INFORMATION

Revenue by client branch, contract type, contract relationship, and geographic region for the periods presented below was as follows: 

Revenue by Client


Three Months Ended


Six Months Ended


July 2,


July 3,


July 2,


July 3,


(In thousands)


2021


%


2020


%


2021


%


2020


%

Army


$

310,638


66

%


$

227,351


68

%


$

567,987


63

%


$

474,906


69

%

Air Force


63,206


13

%


78,321


23

%


141,375


16

%


151,663


22

%

Navy


56,399


12

%


14,542


4

%


112,827


12

%


29,779


4

%

Other


40,602


9

%


15,849


5

%


82,660


9

%


31,449


5

%

Total Revenue


$

470,845


$

336,063


$

904,849


$

687,797


Revenue by Contract Type


Three Months Ended


Six Months Ended


July 2,


July 3,


July 2,


July 3,


(In thousands)


2021


%


2020


%


2021


%


2020


%

Cost-plus and cost-reimbursable ¹


$

359,429


76

%


$

242,740


72

%


$

664,676


73

%


$

499,059


73

%

Firm-fixed-price


111,416


24

%


93,323


28

%


240,173


27

%


188,738


27

%

Total Revenue


$

470,845


$

336,063


$

904,849


$

687,797


¹ Includes time and material contracts


Revenue by Contract Relationship


Three Months Ended


Six Months Ended


July 2,


July 3,


July 2,


July 3,


(In thousands)


2021


%


2020


%


2021


%


2020


%

Prime contractor


$

440,040


93

%


$

314,345


94

%


$

843,303


93

%


$

647,738


94

%

Subcontractor


30,805


7

%


21,718


6

%


61,546


7

%


40,059


6

%

Total Revenue


$

470,845


$

336,063


$

904,849


$

687,797


Revenue by Geographic Region


Three Months Ended


Six Months Ended


July 2,


July 3,


July 2,


July 3,


(In thousands)


2021


%


2020


%


2021


%


2020


%

Middle East


$

258,488


55

%


$

215,968


64

%


$

498,500


55

%


$

453,905


66

%

United States


146,549


31

%


82,670


25

%


296,362


33

%


162,921


24

%

Europe


36,084


8

%


35,533


11

%


76,706


8

%


68,063


10

%

Asia


29,724


6

%


1,892


1

%


33,281


4

%


2,908


0

%

Total Revenue


$

470,845


$

336,063


$

904,849


$

687,797


CONTACT:

Vectrus
Mike Smith, CFA
719-637-5773
mike.smith@vectrus.com

SOURCE Vectrus, Inc.

CoreCivic Inc. (CXW) – Solid Second Quarter Results

Tuesday, August 10, 2021

CoreCivic, Inc. (CXW)
Solid Second Quarter Results

CoreCivic is a diversified government solutions company with the scale and experience needed to solve tough government challenges in flexible, cost-effective ways. We provide a broad range of solutions to government partners that serve the public good through corrections and detention management, a growing network of residential reentry centers to help address America’s recidivism crisis, and government real estate solutions. We are a publicly traded real estate investment trust and the nation’s largest owner of partnership correctional, detention and residential reentry facilities. We also believe we are the largest private owner of real estate used by U.S. government agencies. The Company has been a flexible and dependable partner for government for more than 35 years. Our employees are driven by a deep sense of service, high standards of professionalism and a responsibility to help government better the public good.

Joe Gomes, Senior Research Analyst, Noble Capital Markets, Inc.

Refer to the full report for the price target, fundamental analysis, and rating.

    2Q21 Results. CoreCivic reported solid second quarter results after the market closed yesterday. Revenue came in at $464.6 million, just below the $472.6 million in the same period last year, which was before populations were significantly reduced due to COVID. The Company reported net income of $15.6 million, or $0.13 per share, compared to $22.2 million, or $0.18 per share last year. Adjusted EPS was $0.25 compared to $0.33 last year. On a proforma basis to reflect the adoption of a C-corp structure EPS was $0.25 versus $0.23 last year. We had projected revenue of $445 million and EPS of $0.07.

    Noise, Again.  There was significant noise in the quarter. For example, special items included a charge of $52.2 million in expenses associated with debt repayments and refinancing transactions, $2.9 million in asset impairments, $2.6 million in shareholder litigation expense, $0.8 million in expenses associated with COVID-19, and a $38.8 million gain on the sale of non-core real estate assets, net …


This Company Sponsored Research is provided by Noble Capital Markets, Inc., a FINRA and S.E.C. registered broker-dealer (B/D).

*Analyst certification and important disclosures included in the full report. NOTE: investment decisions should not be based upon the content of this research summary.  Proper due diligence is required before making any investment decision.