Release – ProMIS Neurosciences Announces Second Quarter 2021 Results


ProMIS Neurosciences Announces Second Quarter 2021 Results


TORONTO, Ontario and CAMBRIDGE, Massachusetts – August 12, 2021 – ProMIS Neurosciences, Inc. (TSX: PMN) (OTCQB: ARFXF) (“ProMIS or the Company”), a biotechnology company focused on the discovery and development of antibody therapeutics targeting toxic oligomers implicated in the development of neurodegenerative diseases, today announced its operational and financial results for the three and six months ended June 30, 2021.

ProMIS Neurosciences is applying its patented technology platform to build a portfolio of antibody therapies, therapeutic vaccines, and diagnostics in neurodegenerative diseases, including Alzheimer’s disease (AD) and other dementias, Parkinson’s Disease (PD), and amyotrophic lateral sclerosis (ALS). 

These diseases share a common biologic cause – misfolded versions of proteins, that otherwise perform a normal function, kill neurons and produce disease.

 ProMIS’ technology platform is an example of the advances in drug discovery enabled by computational power, in silico discovery, and/or artificial intelligence. This platform provides an advantage in either selectively targeting the toxic misfolded proteins with therapeutics or detecting them with diagnostics. This capability has given ProMIS a growing portfolio of potential “best in class” monoclonal antibodies (or corresponding therapeutic vaccines), including our lead program PMN310, targeting toxic oligomers of amyloid in AD. 

Corporate Highlights

  • On May 21, 2021, we re-initiated the path to Investigational New Drug application for PMN310 in AD with the start of producer cell line development. This key first step in the manufacturing of antibody therapeutics is being carried out by Selexis, SA, using Selexis’ proprietary SUREtechnology Platform™.
  • On June 3, 2021, the Company announced that it had filed a preliminary Prospectus with the securities regulators in each of the provinces and territories of Canada, except Quebec. The Prospectus will allow the Company to make offerings of common shares, warrants, units, debt securities, subscription receipts, convertible securities or any combination thereof for up to an aggregate total of US$50 million during the 25-month period that the Prospectus is effective.
  • On July 8, 2021, the Company announced that it had filed, and obtained a receipt for the Prospectus with the securities regulators in each of the provinces and territories of Canada, except Quebec.
  • On July 2, 2021, the Company announced the voting results of the Company’s annual meeting of shareholders held on June 30, 2021, in Vancouver, British Columbia, Canada.  All resolutions described in the Management Proxy Circular and placed before the meeting were approved by the shareholders.

People

  • On May 12, 2021, Dr. Rudolph Tanzi, Ph.D., was appointed as the Chair of the Company’s Scientific Advisory Board. Dr. Tanzi is the Joseph P. and Rose F. Kennedy Professor of Neurology at Harvard University and Vice-Chair of Neurology, Director of the Genetics and Aging Research Unit, and Co-Director of the Henry and Allison McCance Center for Brain Health at Massachusetts General Hospital.
  • On May 13, 2021, we appointed Neil K. Warma, to the Company’s Board of Directors. Neil Warma has been a healthcare entrepreneur for over 25 years having managed and advised numerous biotechnology and pharmaceutical companies.
  • On May 25, 2021, the Company appointed Owen Dempsey to lead the commercialization program for its COVID-19 serology assay.
  • On May 27, 2021, Dr. David Wishart, Distinguished University Professor in the Departments of Biological Sciences and Computing Science at the University of Alberta, was appointed as Chief Physics Officer at ProMIS.

Financial Results

Results of Operations – Three months ended June 30, 2021 and 2020

Net Loss for the three months ended June 30, 2021 were $297,346 compared to $1,650,218 for the three months ended June 30, 2020.  Included in the net loss amount for the three months ended June 30, 2021, was non-cash expenses/(income) of ($1,049,745) representing the change in the fair value of the embedded derivative of ($1,245,388), share-based compensation of $180,392, amortization of property and equipment and an intangible asset of $12,252 compared to $76,310 for the three months ended June 30, 2020, consisting of share-based compensation of $74,642 and amortization of an intangible asset of $1,668.  

Operating loss for the three months ended June 30, 2021 was $1,378,603, as compared to $1,650,218 in the three months ended June 30, 2020. The decrease in the operating loss for the three months ended June 30, 2021, reflects decreased contracted salaries and associated costs of $350,622 due to reduction in compensation to management and attrition of contract staff, decreased investor relations of $203,971 due to scale down of investor relations activities and consultants and foreign exchange gains of $233,874 due to the foreign exchange on US denominated assets and liabilities offset by increased costs associated with external contract research organizations for internal programs of $172,518 as the company restarts the internal programs, share-based compensation of $105,749 due to the grant of share options, increased patent expense of $40,162 due to increased maintenance fees, increased legal expense of $45,752, increased consulting expense of $137,522, increase in amortization of property and equipment and intangible asset of $13,584 and decreased revenue of $1,565. 

Research and development expenses for the three months ended June 30, 2021 were $1,065,197, as compared to $898,887 in the three months ended June 30, 2020. The increase in research and development expense for the three months ended June 30, 2021, compared to the same period ended June 30, 2020, is primarily attributed to increased costs associated with external contract research organizations for internal programs of $172,518 as the company restarts the internal programs, increased share-based compensation of $28,579 due to the grant of share options, increased patent expense of $40,162 due to increased maintenance fees  ,increased outside consultants of $137,706 and increase in amortization of property and equipment and intangible asset of $13,584 offset by decreased contracted research salaries and associated costs of $226,238 due to reduction in compensation to management and attrition of contract staff.  

General and administrative expenses for the three months ended June 30, 2021 were $313,406, as compared to $752,896 in the three months ended June 30, 2020.  The decrease for the three months ended June 30, 2021, compared to the same period in 2020, is primarily attributable to a reduction in contracted corporate salaries and associated costs of $124,383 due to reduction in compensation to management and attrition of contracted staff, decreased investor relations of $203,971 due to scale down of investor relations activities and consultants and foreign exchange gains of $233,874 due to the foreign exchange on US denominated assets and liabilities offset by share-based compensation of $77,171 due to the grant of share options,  and increased legal expense of $45,752.

Results of Operations – Six months ended June 30, 2021 and 2020

Net loss for the six months ended June 30, 2021 were $7,896,763 compared to $3,412,137 for the six months ended June 30, 2020.  Included in the net loss amount for the six months ended June 30, 2021, was non-cash expense $5,909,542, representing the change in the fair value of the embedded derivative of $5,766,915, share-based compensation of $112,123, amortization of property and equipment and an intangible asset of $30,504 for the six months ended June 30, 2021, compared to $290,048 for the six months ended June 30, 2020, consisting of share-based compensation of $286,712 and amortization of an intangible asset of $3,336.  

Operating loss for the six months ended June 30, 2021 was $1,960,934, as compared to $3,412,137 in the six months ended June 30, 2020. The decrease in the operating loss for the six months ended June 30, 2021, reflects decreased contract salaries and associated costs of $924,565 due to reduction in compensation to management and attrition of contracted staff, decreased investor relations of $380,959 due to scale down of investor relation activities and consultants, decreased share-based compensation of $174,589 due to forfeiture of unvested/vested share options due to termination of consulting arrangement and foreign exchange gains of $293,012 due to the foreign exchange on US denominated offset by increased costs associated with external contract research organizations for internal programs of $88,673 as the company restarts the internal programs, increased patent expense of $3,617 due to increased maintenance fees, increased legal expense of $99,572, increased consulting expense of $101,315, increase in amortization of property and equipment and intangible asset of $27,168 and decreased revenue of $1,578.   

Research and development expenses for the six months ended June 30, 2021 were $1,259,120, as compared to $1,872,473 in the six months ended June 30, 2020. The decrease in research and development expense for the six months ended June 30, 2021, compared to the same period ended June 30, 2020, reflects the conservation of cash resources and decreased contract salaries and associated costs of $673,785 due to reduction in compensation to management and attrition of contracted staff and decreased share-based compensation of $145,459 due to forfeiture of unvested/vested share options due to termination of consulting arrangement offset by increased costs associated with external contract research organizations for internal programs of $88,673 as the company restarts the internal programs, increased patent expense of $3,617 due to increased maintenance fees, increased consulting expense of $86,435 and increase in amortization of property and equipment and intangible asset of $27,168.   

General and administrative expenses for the six months ended June 30, 2021 were $701,814, as compared to $1,541,242 in the six months ended June 30, 2020.  The decrease for the six months ended June 30, 2021, compared to the same period in 2020, is primarily attributable to a reduction in contract salaries and associated costs of $250,780 due to reduction in compensation to management and attrition of contracted staff, decreased investor relations of $380,959 due to scale down of investor relation activities and consultants, decreased share-based compensation of $29,129 due to forfeiture of unvested/vested share options due to termination of consulting arrangement and foreign exchange gains of $293,012 due to the foreign exchange on US-denominated offset by the increased legal expense of $99,572 and increased consulting expense of $14,880.

Outlook

Going forward ProMIS will focus on accelerating or re-initiating programs in our core business area, best-in-class therapeutics for neurodegenerative diseases.  In addition, we will continue to expand the application of our unique discovery platform, with which we can “rationally design” antibodies or vaccines to be selective for only mis-folded, pathogenic proteins involved in disease.    

In Alzheimer’s we will restart IND enabling work for PMN310, our antibody highly selective for toxic oligomers of amyloid. That selectivity may prove to give PMN310 significant competitive advantages in safety and efficacy over products from Biogen, Lilly, and Eisai that appear to provide benefit slowing the progression of Alzheimer’s disease. In addition, starting with the same proprietary technology that creates selective antibodies (“passive” immunotherapy), we are moving forward our program to create therapeutic vaccines (“active” immunotherapy) targeting toxic oligomers of amyloid. Therapeutic vaccines may be a preferred therapy for Alzheimer’s prevention; the ultimate goal in Alzheimer’s treatment is to detect disease in the ~20 year window before symptoms arise and treat to prevent symptoms of cognitive decline.

In ALS we will advance our program targeting toxic TDP-43 with further in vitro and in vivo validation, and we will build on the significant scientific advances we have made targeting RACK1 (Receptor for A Activated C Kinase 1). We will also further advance our alpha-synuclein program with further in vivo and in vitro validation, targeting diseases like Parkinson’s disease and Multiple System Atrophy.

About ProMIS Neurosciences, Inc.

ProMIS Neurosciences, Inc. is a development stage biotechnology company focused on discovering and developing antibody therapeutics selectively targeting toxic oligomers implicated in the development and progression of neurodegenerative diseases, in particular Alzheimer’s disease (AD), amyotrophic lateral sclerosis (ALS) and Parkinson’s disease (PD). The Company’s proprietary target discovery engine is based on the use of two complementary techniques. The Company applies its thermodynamic, computational discovery platform -ProMIS and Collective Coordinates – to predict novel targets known as Disease Specific Epitopes on the molecular surface of misfolded proteins. Using this unique approach, the Company is developing novel antibody therapeutics for AD, ALS and PD.  ProMIS is headquartered in Toronto, Ontario, with offices in Cambridge, Massachusetts. ProMIS is listed on the Toronto Stock Exchange under the symbol PMN, and on the OTCQB Venture Market under the symbol ARFXF.

Visit us at www.promisneurosciences.com, follow us on Twitter and LinkedIn

For Investor Relations please contact:
Alpine Equity Advisors
Nicholas Rigopulos, President
nick@alpineequityadv.com
Tel. 617 901-0785

The TSX has not reviewed and does not accept responsibility for the adequacy or accuracy of this release. This information release contains certain forward-looking information. Such information involves known and unknown risks, uncertainties and other factors that may cause actual results, performance or achievements to be materially different from those implied by statements herein, and therefore these statements should not be read as guarantees of future performance or results. All forward-looking statements are based on the Company’s current beliefs as well as assumptions made by and information currently available to it as well as other factors. Readers are cautioned not to place undue reliance on these forward-looking statements, which speak only as of the date of this press release. Due to risks and uncertainties, including the risks and uncertainties identified by the Company in its public securities filings, actual events may differ materially from current expectations. The Company disclaims any intention or obligation to update or revise any forward-looking statements, whether as a result of new information, future events or otherwise.

Release – Comtech Telecommunications Corp. Awarded $3.6 Million in Contracts for Military X-band SSPAs


Comtech Telecommunications Corp. Awarded $3.6 Million in Contracts for Military X-band SSPAs


MELVILLE, N.Y.–(BUSINESS WIRE)–Aug. 12, 2021– 
August 12, 2021— 
Comtech Telecommunications Corp. (NASDAQ: CMTL), a global leading provider of next-generation 911 emergency systems and secure wireless communications technologies, announced today, that during its fourth quarter of fiscal 2021, it was awarded multiple contracts aggregating 
$3.6 million from a 
U.S. system integrator for X-band SSPAs and BUCs for transportable satellite communication terminals.

Secure and available satellite communications are required to support all phases of a mission from the command center to the tactical edge. Comtech’s X-band SSPAs and BUCs are rugged and compact, supporting voice, video and data communications among dispersed elements of the battle force.

“Comtech’s SSPAs and BUCs have a proven heritage across multiple military systems and operate with high reliability in certified terminals around the globe,” said  Fred Kornberg, Chairman of the Board and Chief Executive Officer of 
Comtech Telecommunications Corp. “We are pleased with the ongoing success of these transportable terminals.”

Comtech, a world leader in high-power amplifiers, manufactures a wide variety of tube-based and solid-state power amplifiers for military and commercial satellite uplink applications. The product range encompasses power levels from 8 W to 3 kW, with frequency coverage in sub-bands within the 2 GHz to 52 GHz spectrum. Amplifiers are available for fixed and ground-based, shipboard, and airborne mobile applications. Please visit www.xicomtech.com for more information.

Comtech Telecommunications Corp. is a leading provider of next-generation 911 emergency systems and critical wireless communication technologies to commercial and government customers around the world. Headquartered in 
Melville, New York and with a passion for customer success, 
Comtech designs, produces and markets advanced and secure wireless solutions to customers in more than 100 countries. For more information, please visit www.comtechtel.com.

Certain information in this press release contains statements that are forward-looking in nature and involve certain significant risks and uncertainties. Actual results could differ materially from such forward-looking information. The Company’s 
Securities and Exchange Commission filings identify many such risks and uncertainties. Any forward-looking information in this press release is qualified in its entirety by the risks and uncertainties described in such 
Securities and Exchange Commission filings.

Comtech Investor Relations:
631-962-7005
investors@comtech.com


Source: 
Comtech Telecommunications Corp.

Capstone Green Energy Corporation (CGRN) – June-quarter sales disappointing but growth is coming

Thursday, August 12, 2021

Capstone Green Energy Corporation (CGRN)
June-quarter sales disappointing but growth is coming

Capstone Green Energy Corp is the producer of low-emission microturbine systems.The company develops, manufactures, markets and services microturbine technology solutions for use in stationary distributed power generation applications. Capstone Turbine’s products include onboard generation for hybrid electric vehicles; conversion of oil field and biomass waste gases into electricity; combined heat, power, and chilling solutions; capacity addition; and standby power.

Michael Heim, Senior Research Analyst, Noble Capital Markets, Inc.

Refer to the full report for the price target, fundamental analysis, and rating.

    June quarter sales were below our expectations. The company reported revenues of $16.1 million up 13% year over year but down 4.5% sequentially and below our $18.5 million forecast. The company is in the middle of a transition towards rental and service business, which will provide for more steady revenues but will have less of the big ticket items that sometimes boost sales in a given quarter. Management believes rentals and sales are still being negatively impacted by COVID and supply chain issues specifically pointing to Italy, India and Brazil where Capstone does business.

    Costs rose causing margins and cash flow to shrink.  Adjusted EBIDTA was ($2.3) million versus $0.1 million. Cost of goods sold rose to $13.4 million versus $10.8 million pushing gross margins down to $2.6 million (16%) versus $3.4 million (24%). We had hoped for the gross margin percent to remain at 24%. Operating costs were $6.2 million versus $3.9 million last year. Net income was ($4.8) million …


This Company Sponsored Research is provided by Noble Capital Markets, Inc., a FINRA and S.E.C. registered broker-dealer (B/D).

*Analyst certification and important disclosures included in the full report. NOTE: investment decisions should not be based upon the content of this research summary.  Proper due diligence is required before making any investment decision. 

Endeavour Silver (EXK)(EDR:CA) – Operating Cost Profile Expected to Improve in the Second Half

Thursday, August 12, 2021

Endeavour Silver (EXK)(EDR:CA)
Operating Cost Profile Expected to Improve in the Second Half

As of April 24, 2020, Noble Capital Markets research on Endeavour Silver is published under ticker symbols (EXK and EDR:CA). The price target is in USD and based on ticker symbol EXK. Research reports dated prior to April 24, 2020 may not follow these guidelines and could account for a variance in the price target.

Endeavour Silver Corp is a precious metal mining company. The company is primarily engaged in silver mining and owns three high-grade, underground, silver-gold mines in Mexico. Its other business activities include acquisition, exploration, development, extraction, processing, refining and reclamation. The company is organized into four operating mining segments, Guanacevi, Bolanitos, El Cubo, and El Compas, which are located in Mexico as well as Exploration and Corporate segments. Its Exploration segment consists of projects in the exploration and evaluation phases in Mexico and Chile.

Mark Reichman, Senior Research Analyst of Natural Resources, Noble Capital Markets, Inc.

Refer to the full report for the price target, fundamental analysis, and rating.

    Second quarter 2021 results. Endeavour reported second quarter 2021 net income of $6.7 million, or $0.04 per share, compared to a loss of $3.3 million, or $(0.02) per share during the prior year period. Excluding a gain on the sale of the El Cubo mine, the company generated net income of $0.8 million, or $0.01 per share. We had projected net income of $6.9 million or $0.04 per share. Revenue was in line with our estimates although operating costs were higher than expected due to inflationary pressures, including increased labor costs. Cash costs per silver ounce and all-in sustaining costs per ounce increased to $13.03 and $25.30, respectively, compared to $7.86 and $19.94 in the first quarter of 2021.

    Updating estimates.  We have trimmed our 2021 EPS and EBITDA estimates to $0.03 and $47.5 million from $0.06 and $52.5 million, respectively. Our 2022 EPS and EBITDA estimates are $0.18 and $75.5 million, respectively. While our 2022 estimates are largely unchanged, our 2021 estimates reflect second quarter results although we anticipate some margin improvement in the second half of the year. There …


This research is provided by Noble Capital Markets, Inc., a FINRA and S.E.C. registered broker-dealer (B/D).

*Analyst certification and important disclosures included in the full report. NOTE: investment decisions should not be based upon the content of this research summary.  Proper due diligence is required before making any investment decision. 

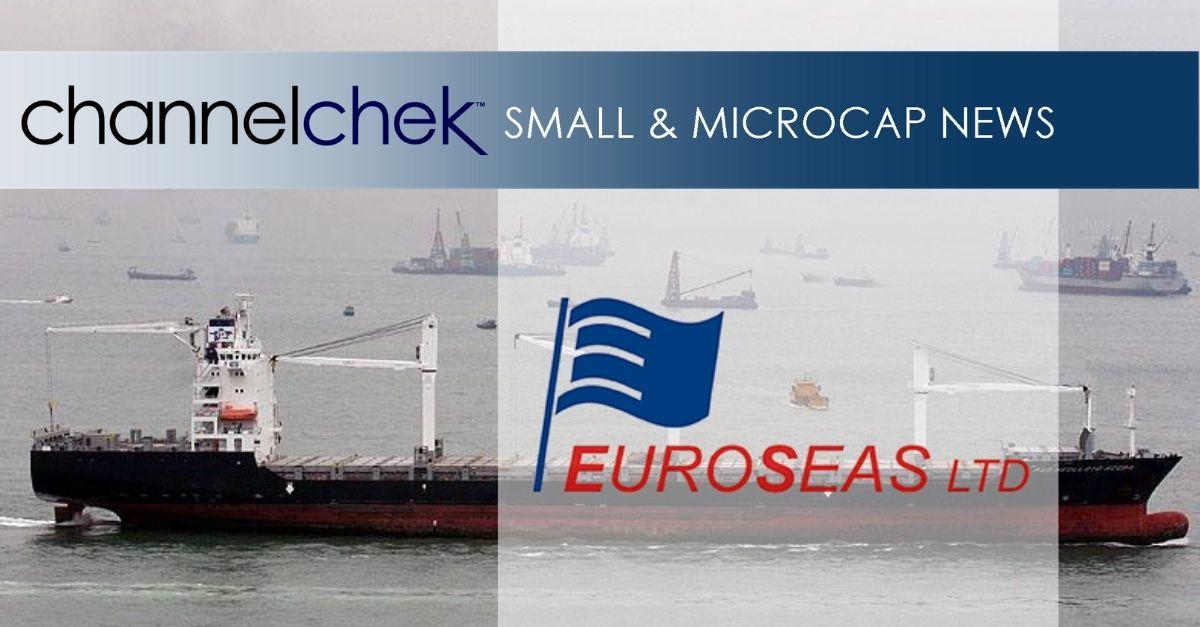
Euroseas Ltd. (ESEA) – Strong 2Q2021 Results and Term Charter on Diamantis

Thursday, August 12, 2021

Euroseas Ltd. (ESEA)
Strong 2Q2021 Results and Term Charter on Diamantis

Euroseas Ltd. provides ocean-going transportation services worldwide. The company owns and operates containerships that transport dry and refrigerated containerized cargoes, including manufactured products and perishables; and drybulk carriers that transport iron ore, coal, grains, bauxite, phosphate, and fertilizers. As of March 31, 2017, it had a fleet of seven containerships; and six drybulk carriers, including three Panamax drybulk carriers, one Handymax drybulk carrier, one Kamsarmax drybulk carrier, and one Ultramax drybulk carrier. The company was founded in 2005 and is based in Maroussi, Greece.

Poe Fratt, Senior Research Analyst, Noble Capital Markets, Inc.

Refer to the full report for the price target, fundamental analysis, and rating.

    Adjusted 2Q2021 EBITDA of $10.5 million in line with expectations after adjusting for claim award on a failed 1Q2020 sale of the Manolis P.  Call with management today at 9am EST—number is (877) 553-9962 and code is Euroseas. TCE revenue of $18.8 million increased from $14.7 million in 1Q2021 due to a $2,719 move up in TCE rates to $14,853/day from $12,134/day and higher shipping days of 1,273 versus 1,219 in 1Q2021, with only one idle day versus 41 in 1Q2021.

    Another feeder secured term charter at higher TCE rate.  The Diamantis P, a 1998-built 2,008 TEU feeder, secured a charter through October 2024 (min of 36 months and max of 40 months) at a TCE rate of $27.0k/day (up from $6.6k/day). Three feeders (Corfu/Evridiki/Astoria) and one intermediate (Oakland) are available for charter over the next six months, and recent charters on the Oakland intermediate …


This research is provided by Noble Capital Markets, Inc., a FINRA and S.E.C. registered broker-dealer (B/D).

*Analyst certification and important disclosures included in the full report. NOTE: investment decisions should not be based upon the content of this research summary.  Proper due diligence is required before making any investment decision. 

InPlay Oil (IPOOF)(IPO:CA) – Outstanding quarter due to operational improvements

Thursday, August 12, 2021

InPlay Oil (IPOOF)(IPO:CA)
Outstanding quarter due to operational improvements

As of April 24, 2020, Noble Capital Markets research on InPlay Oil is published under ticker symbols (IPOOF and IPO:CA). The price target is in USD and based on ticker symbol IPOOF. Research reports dated prior to April 24, 2020 may not follow these guidelines and could account for a variance in the price target. InPlay Oil is a junior oil and gas exploration and production company with operations in Alberta focused on light oil production. The company operates long-lived, low-decline properties with drilling development and enhanced oil recovery potential as well as undeveloped lands with exploration possibilities. The common shares of InPlay trade on the Toronto Stock Exchange under the symbol IPO and the OTCQZ Exchange under the symbol IPOOF.

Michael Heim, Senior Research Analyst, Noble Capital Markets, Inc.

Refer to the full report for the price target, fundamental analysis, and rating.

    Production is soaring due to the performance of recently drilled wells. InPlay reported average production of 5,380 boe/d in the June quarter, up 71% versus last year and above our forecast of 5,167 boe/d. The jump in production reflect strong performance by three Pembina wells drilled in the first quarter that continue to blow through type curve projections. Well flow shows no signs of decreasing after 120 days and the wells have paid for themselves in 3-4 months. In addition, three new wells in Pembina came on in July and are even outperforming the wells drilled in the first quarter. Management announced that it now plans to replace three wells planned for the Willesden Green with wells in the Pembina play.

    High production means high cash flow and earnings.  Adjusted funds flow (AFF) for the quarter was $8.2 million ($0.12) up 730% y-o-y and 34% sequentially and above the $6.4 million ($0.09) in our models. Net income was $0.8 million ($0.02) after excluding nonrecurring items, well surpassing previous periods and our forecast of ($0.7 million) or ($0.01). Realized prices and operating netbacks were …


This Company Sponsored Research is provided by Noble Capital Markets, Inc., a FINRA and S.E.C. registered broker-dealer (B/D).

*Analyst certification and important disclosures included in the full report. NOTE: investment decisions should not be based upon the content of this research summary.  Proper due diligence is required before making any investment decision. 

Seanergy Maritime (SHIP) – Stock Buyback Another Sign of Financial Stability

Thursday, August 12, 2021

Seanergy Maritime (SHIP)
Stock Buyback Another Sign of Financial Stability

Seanergy Maritime Holdings Corp., an international shipping company, provides marine dry bulk transportation services through the ownership and operation of dry bulk vessels. Seanergy Maritime Holdings Corp. is the only pure-play Capesize shipping company listed in the US capital markets. Seanergy provides marine dry bulk transportation services through a modern fleet of 10 Capesize vessels, with total capacity of approximately 1,748,581 dwt and an average fleet age of about 9.8 years. The Company is incorporated in the Marshall Islands with executive offices in Athens, Greece and an office in Hong Kong. The Company’s common shares trade on the Nasdaq Capital Market under the symbol “SHIP” and class A warrants under “SHIPW”.

Poe Fratt, Senior Research Analyst, Noble Capital Markets, Inc.

Refer to the full report for the price target, fundamental analysis, and rating.

    Stock buy back program announced. The Board of Directors approved a stock buy back program of up to $17 million. At the current price, the buy back equals ~16.4 million shares, or close to 10% of the current shares outstanding of ~168.5 million. We believe that this positive move should help support the stock price, especially if the buy back program is active.

    Buy back program reinforces our view that equity issuance near the current price is unlikely.  As highlighted in recent notes, the financial position has improved markedly, and we believe that no additional equity will be issued despite the F-3 filing on July 2nd. After pending transactions close, pro forma 3Q2021 cash should be $45-$50 million, or close to 2Q2021 cash of $56 million. Financial …


This research is provided by Noble Capital Markets, Inc., a FINRA and S.E.C. registered broker-dealer (B/D).

*Analyst certification and important disclosures included in the full report. NOTE: investment decisions should not be based upon the content of this research summary.  Proper due diligence is required before making any investment decision. 

Release – Capstone Green Energy (NASDAQ:CGRN) Reports First Quarter Fiscal 2022 Financial Results


Capstone Green Energy (NASDAQ:CGRN) Reports First Quarter Fiscal 2022 Financial Results


Total Revenue Grew 13% Year-Over-Year

Cash and Cash Equivalents of $49.2M

Book-to-Bill Ratio of 1:1 for the Quarter with New Gross Product Orders of $8.2M

Webcast to be Held Today, August 11, 2021 at 1:45 PM PT; 4:45 PM ET

VAN NUYS, CA / ACCESSWIRE / August 11, 2021 / Capstone Green Energy Corporation (NASDAQ:CGRN), formerly Capstone Turbine Corporation (NASDAQ:CPST) (“Capstone,” the “Company,” “we” or “us”), a global leader in carbon reduction and on-site resilient green energy solutions, today announced financial results for its fiscal year 2022 first quarter ended June 30, 2021.

Financial Highlights of Fiscal Year 2022 First Quarter:

  • Total revenue in the quarter was $16.1 million, up 13%, compared to $14.2 million in the first quarter last year as orders and shipments gradually started to rebound despite continued negative impacts from the ongoing COVID-19 global pandemic.
  • The book-to-bill ratio was 1:1 for the quarter, and new gross product orders were $8.2 million despite continued negative global impacts from the ongoing COVID-19 global pandemic in key markets like Europe, Latin America, Asia, and Australia.
  • The long-term microturbine rental fleet increased 1.5 megawatts (MWs) to 12.1 MWs from 10.6 MWs during the quarter as the Company continues to execute against its plan to increase the fleet to 21.1 MWs by March 31, 2022.
  • Total cash and cash equivalents as of June 30, 2021, were $49.2 million, a decrease of $0.3 million, compared to $49.5 million as of March 31, 2021.
  • Cash provided by financing activities was $11.0 million during the quarter, as the Company continued to focus on strengthening liquidity as it accelerates the expansion of the long-term rental fleet.
  • Net loss of $2.2 million for the quarter, compared to a net loss of $1.8 million in the first quarter of fiscal 2021.
  • Adjusted EBITDA of negative $2.3 million, compared to Adjusted EBITDA of $0.1 million in the first quarter of fiscal 2021.

“I am pleased that we were again able to drive year-over-year revenue growth as the global recovery from the COVID-19 global pandemic continued to evolve, and we executed upon our revenue growth strategy,” said Darren Jamison, President and Chief Executive Officer of Capstone Green Energy. “We also announced during the quarter that we expanded our long-term rental fleet from 10.6 megawatts to 12.1 megawatts as we march towards our goal of growing the fleet to 21.1 megawatts by the end of our fiscal year. This remains a key driver in our long-term strategy, as rental-related revenue drives a much higher margin than a typical product sale. This, along with our Factory Protection Plan program, are important supporting pillars in growing our Energy as a Service business,” added Mr. Jamison.

“We also took steps during the quarter to expand our direct solutions sales team as their effort in the field is creating a robust project pipeline. We are excited for the second half of the year as we expect to start to close on potential projects deploying not only our existing microturbine technology, but the new energy products and service offerings we added on the back of our evolution into Capstone Green Energy Corporation, announced on Earth Day in April 2021,” concluded Mr. Jamison.

Financial Results for Fiscal Year 2022 First Quarter

Total revenue for the quarter increased $1.9 million to $16.1 million, compared with total revenue of $14.2 million in the year-ago quarter. The increase in revenue was the result of higher MWs shipped, as the year-ago quarter was more negatively impacted by the global COVID-19 pandemic.

Gross margin decreased $0.8 million, to $2.6 million in the first quarter compared to $3.4 million in the same period last year, primarily due to lower overhead expenses in the prior period as a result of the Company’s COVID-19 Business Continuity Plan, which consisted of pay cuts, furloughs, and other cost-cutting measures.

Gross margin as a percentage of revenue decreased to 16% in the first quarter, compared to 24% in the same period last year, primarily due to lower overhead expenses in the prior period as a result of the Company’s COVID-19 Business Continuity Plan. Additionally, Factory Protection Plan margins were higher in the prior-year period primarily due to site shutdowns caused by the pandemic, which delayed servicing events.

Operating expenses in the first quarter of fiscal year 2022 were $6.2 million, an increase of $2.3 million from $3.9 million in the year-ago quarter, as the year-ago quarter had reduced expenses from the COVID-19 Business Continuity Plan, which reduced operating expenses and increased working capital during the pandemic.

Net loss was $2.2 million for the first quarter of fiscal year 2022, compared to a net loss of $1.8 million in the year-ago quarter. Net loss per share improved to $0.16 cents per share compared to $0.17 cents in the year-ago quarter. Adjusted EBITDA was negative $2.3 million for the first quarter of fiscal year 2022, compared to an adjusted EBITDA of $0.1 million in the year-ago quarter.

Cash and cash equivalents were $49.2 million as of June 30, 2021, compared to $49.5 million as of March 31, 2021.

Conference Call and Webcast

Capstone will host a live webcast on August 11, 2021, at 1:45 PM Pacific Time (4:45 PM Eastern Time) to provide the results of the fiscal year 2022 first quarter ended June 30, 2021. Capstone will discuss its financial results and will provide an update on its business activities. At the end of the conference call, Capstone will host a question-and-answer session to provide an opportunity for financial analysts to ask questions. Investors and interested individuals are invited to listen to the webcast by logging on to Capstone’s investor relation’s webpage at www.CapstoneGreenEnergy.com. A replay of the webcast will be available on the website for 30 days.

About Capstone Green Energy

Capstone Green Energy (NASDAQ:CGRN) is a leading provider of customized microgrid solutions and on-site energy technology systems focused on helping customers around the globe meet their environmental, energy savings, and resiliency goals. Capstone Green Energy focuses on four key business lines. Through its Energy as a Service (EaaS) business, it offers rental solutions utilizing its microturbine energy systems and battery storage systems, comprehensive Factory Protection Plan (FPP) service contracts that guarantee life-cycle costs, as well as aftermarket parts. Energy Conversion Products are driven by the Company’s industry-leading, highly efficient, low-emission, resilient microturbine energy systems offering scalable solutions in addition to a broad range of customer-tailored solutions, including hybrid energy systems and larger frame industrial turbines. The Energy Storage Products business line designs and installs microgrid storage systems creating customized solutions using a combination of battery technologies and monitoring software. Through Hydrogen Energy Solutions, Capstone Green Energy offers customers a variety of hydrogen products, including the Company’s microturbine energy systems.

For customers with limited capital or short-term needs, Capstone offers rental systems; for more information, contact: rentals@CGRNenergy.com. To date, Capstone has shipped over 10,000 units to 83 countries and estimates that, in FY21, it saved customers over $217 million in annual energy costs and approximately 397,000 tons of carbon. Total savings over the last three years are estimated to be approximately $698 million in energy savings and approximately 1,115,100 tons of carbon savings.

For more information about the Company, please visit: www.CapstoneGreenEnergy.com. Follow Capstone Green Energy on TwitterLinkedInInstagramFacebook, and YouTube.

Cautionary Note Regarding Forward-Looking Statements

This release contains forward-looking statements as defined in the Private Securities Litigation Reform Act of 1995, including statements regarding expectations for green initiatives and execution on the Company’s growth strategy and other statements regarding the Company’s expectations, beliefs, plans, intentions, and strategies. The Company has tried to identify these forward-looking statements by using words such as “expect,” “anticipate,” “believe,” “could,” “should,” “estimate,” “intend,” “may,” “will,” “plan,” “goal” and similar terms and phrases, but such words, terms and phrases are not the exclusive means of identifying such statements. Actual results, performance and achievements could differ materially from those expressed in, or implied by, these forward-looking statements due to a variety of risks, uncertainties and other factors, including, but not limited to, the following: the ongoing effects of the COVID-19 pandemic; the availability of credit and compliance with the agreements governing the Company’s indebtedness; the Company’s ability to develop new products and enhance existing products; product quality issues, including the adequacy of reserves therefor and warranty cost exposure; intense competition; financial performance of the oil and natural gas industry and other general business, industry and economic conditions; the Company’s ability to adequately protect its intellectual property rights; and the impact of pending or threatened litigation. For a detailed discussion of factors that could affect the Company’s future operating results, please see the Company’s filings with the Securities and Exchange Commission, including the disclosures under “Risk Factors” in those filings. Except as expressly required by the federal securities laws, the Company undertakes no obligation to update or revise any forward-looking statements, whether as a result of new information, changed circumstances or future events, or for any other reason.

Financial Tables to Follow

CAPSTONE GREEN ENERGY CORPORATION AND SUBSIDIARIES
CONDENSED CONSOLIDATED BALANCE SHEETS
(In thousands, except share amounts)
(Unaudited)
June 30, March 31,
2021 2021
Assets
Current Assets:
Cash and cash equivalents
$ 49,216 $ 49,533
Accounts receivable, net of allowances of $324 at June 30, 2021 and $314 at March 31, 2021
23,871 20,593
Inventories, net
14,937 11,829
Prepaid expenses and other current assets
5,718 4,953
Total current assets
93,742 86,908
Property, plant, equipment and rental assets, net
10,669 9,630
Non-current portion of inventories
1,802 1,845
Other assets
7,497 7,639
Total assets
$ 113,710 $ 106,022
Liabilities and Stockholders’ Equity
Current Liabilities:
Accounts payable and accrued expenses
$ 22,396 $ 19,767
Accrued salaries and wages
1,565 1,889
Accrued warranty reserve
3,904 5,850
Deferred revenue
6,000 6,374
Current portion of notes payable and lease obligations
1,097 576
Total current liabilities
34,962 34,456
Deferred revenue – non-current
734 765
Term note payable, net
50,923 52,865
Long-term portion of notes payable and lease obligations
4,589 4,762
Total liabilities
91,208 92,848
Commitments and contingencies
Stockholders’ Equity:
Preferred stock, $.001 par value; 1,000,000 shares authorized; none issued
Common stock, $.001 par value; 51,500,000 shares authorized, 15,206,891 shares issued and 15,128,731 shares outstanding at June 30, 2021; 12,898,144 shares issued and 12,824,190 shares outstanding at March 31, 2021
15 13
Additional paid-in capital
945,918 934,381
Accumulated deficit
(921,453 ) (919,271 )
Treasury stock, at cost; 78,160 shares at June 30, 2021 and 73,954 shares at March 31, 2021
(1,978 ) (1,949 )
Total stockholders’ equity
22,502 13,174
Total liabilities and stockholders’ equity
$ 113,710 $ 106,022
CAPSTONE GREEN ENERGY CORPORATION AND SUBSIDIARIES
CONDENSED CONSOLIDATED STATEMENTS OF OPERATIONS
(In thousands, except per share data)
(Unaudited)
Three Months Ended
June 30,
2021 2020
Revenue:
Product and accessories
$ 8,389 $ 6,606
Parts and service
7,693 7,587
Total revenue
16,082 14,193
Cost of goods sold:
Product and accessories
8,992 6,800
Parts and service
4,442 4,020
Total cost of goods sold
13,434 10,820
Gross margin
2,648 3,373
Operating expenses:
Research and development
883 370
Selling, general and administrative
5,324 3,546
Total operating expenses
6,207 3,916
Loss from operations
(3,559 ) (543 )
Other income
665 4
Interest income
5 8
Interest expense
(1,235 ) (1,291 )
Gain on debt extinguishment
1,950
Loss before provision for income taxes
(2,174 ) (1,822 )
Provision for income taxes
8 1
Net loss
(2,182 ) (1,823 )
Net loss per common share attributable to common stockholders-basic and diluted
$ (0.16 ) $ (0.17 )
Weighted average shares used to calculate basic and diluted net loss per common share attributable to common stockholders
13,226 10,598
CAPSTONE GREEN ENERGY CORPORATION AND SUBSIDIARIES
RECONCILIATION OF NON-GAAP FINANCIAL MEASURE
(In thousands, except per share data)
(Unaudited)

Three months ended
Reconciliation of Reported Net Loss to EBITDA and Adjusted EBITDA
June 30,
2021 2020
Net loss, as reported
$ (2,182 ) $ (1,823 )
Interest expense
1,235 1,291
Provision for income taxes
8 1
Depreciation and amortization
386 354
EBITDA
$ (553 ) $ (177 )
Gain on debt extinguishment
(1,950 )
Additional PPP loan forgiveness
(660 )
Stock-based compensation and other expense
870 298
Adjusted EBITDA
$ (2,293 ) $ 121

To supplement the company’s unaudited financial data presented on a generally accepted accounting principles (GAAP) basis, management has presented Adjusted EBITDA, a non-GAAP financial measure. This non-GAAP financial measure is among the indicators management uses as a basis for evaluating the company’s financial performance as well as for forecasting future periods. Management establishes performance targets, annual budgets and makes operating decisions based in part upon this metric. Accordingly, disclosure of this non-GAAP financial measure provides investors with the same information that management uses to understand the company’s economic performance year-over-year.

EBITDA is defined as net income before interest, provision for income taxes, and depreciation and amortization expense. Adjusted EBITDA is defined as EBITDA before gain on debt extinguishment, additional PPP loan forgiveness and stock-based compensation and other expense. Gain on debt extinguishment and additional PPP loan forgiveness relates to the Paycheck Protection Program loan forgiveness. Stock-based compensation and other expense includes expense related to stock issued to employees, directors, and vendors.

Adjusted EBITDA is not a measure of the company’s liquidity or financial performance under GAAP and should not be considered as an alternative to, net income or any other performance measure derived in accordance with GAAP, or as an alternative to cash flows from operating activities as a measure of its liquidity.

While management believes that the non-GAAP financial measure provides useful supplemental information to investors, there are limitations associated with the use of this measure. The measures are not prepared in accordance with GAAP and may not be directly comparable to similarly titled measures of other companies due to potential differences in the exact method of calculation. Management compensates for these limitations by relying primarily on the company’s GAAP results and by using Adjusted EBITDA only supplementally and by reviewing the reconciliations of the non-GAAP financial measure to its most comparable GAAP financial measure.

Non-GAAP financial measures are not in accordance with, or an alternative for, generally accepted accounting principles in the United States. The company’s non-GAAP financial measures are not meant to be considered in isolation or as a substitute for comparable GAAP financial measures and should be read only in conjunction with the company’s consolidated financial statements prepared in accordance with GAAP.

CONTACT:
Capstone Green Energy
Investor and investment media inquiries:
818-407-3628
ir@CGRNenergy.com

SOURCE: Capstone Green Energy Corporation

Release – Euroseas Ltd. Reports Results for the Six-Month Period and Quarter Ended June 30 2021 and Announces Three-year Charter for its Vessel MV Diamantis P.


Euroseas Ltd. Reports Results for the Six-Month Period and Quarter Ended June 30, 2021 and Announces Three-year Charter for its Vessel, M/V Diamantis P.


ATHENS, Greece, Aug. 11, 2021 (GLOBE NEWSWIRE) — Euroseas Ltd. (NASDAQ: ESEA, the “Company” or “Euroseas”), an owner and operator of container carrier vessels and provider of seaborne transportation for containerized cargoes, announced today its results for the three and six month periods ended June 30, 2021.

Second Quarter 2021 Financial Highlights:

  • Total net revenues of $18.3 million. Net income of $7.9 million and net income attributable to common shareholders (after a $0.1 million dividend on Series B Preferred Shares and a $0.3 million of preferred deemed dividend arising out of the redemption of approximately $6.4 million of Series B Preferred Shares in the second quarter of 2021) of $7.6 million or $1.12 and $1.11 earnings per share basic and diluted, respectively. Adjusted net income attributable to common shareholders1 for the period was $7.6 million or $1.12 per share basic and diluted.

  • Adjusted EBITDA1 was $10.3 million.

  • An average of 14.00 vessels were owned and operated during the second quarter of 2021 earning an average time charter equivalent rate of $14,853 per day.

First Half 2021 Financial Highlights:

  • Total net revenues of $32.6 million. Net income of $11.7 million; net income attributable to common shareholders (after a $0.3 million of dividend on Series B Preferred Shares and a $0.3 million of preferred deemed dividend arising out of the redemption of approximately $8.4 million of Series B Preferred Shares in the first half of 2021) of $11.1 million or $1.65 and $1.64 earnings per share basic and diluted, respectively. Adjusted net income attributable to common shareholders1 for the period was $10.7 million or $1.58 and $1.57 per share basic and diluted, respectively.

  • Adjusted EBITDA1 was $15.9 million.

  • An average of 14.00 vessels were owned and operated during the first half of 2021 earning an average time charter equivalent rate of $13,523 per day.

New Charter for M/V Diamantis

The Company announced today a new time charter contract for its container vessel M/V “Diamantis P”, a 2,008 teu vessel built in 1998. The vessel was chartered for a period between a minimum of thirty-six (36) and a maximum of forty (40) months at the option of the charterer, at a gross daily rate of $27,000. The new rate, which is more than four times higher than the vessel’s current charter rate, will commence between October 5, 2021 and October 15, 2021, after the vessel completes its upcoming drydocking.


1 Adjusted EBITDA, Adjusted net income and Adjusted earnings per share are not recognized measurements under US GAAP (GAAP) and should not be used in isolation or as a substitute for Euroseas financial results presented in accordance with GAAP. Refer to a subsequent section of the Press Release for the definitions and reconciliation of these measurements to the most directly comparable financial measures calculated and presented in accordance with GAAP.

Other Developments

During the second quarter of 2021, the holders of the Company’s Series B Preferred Shares (“Series B shares”) converted all the remaining Series B shares into shares of common stock as per the terms of the Series B shares. As a result of the conversion, Euroseas issued 453,044 common shares to the holders of the Series B shares for the outstanding amount of $6.365 million. Following the conversion of the Series B shares into common stock, the Company’s Director Mr. Christian Donohue, originally appointed to the Board by Tennenbaum Capital Partners, LLC / Blackrock, Inc. as Series B director and, recently, re-elected as director, resigned from Board in accordance to Blackrock Inc. policy.
In June,2021, the Company signed a term sheet with a bank to draw a loan of $10.0 million with M/V “Aegean Express” and M/V “EM Corfu” as collateral. The loan is expected to be drawn in the fourth quarter of 2021 and it will partly refinance the balloon payment of $12.1 million due in November 2021.

Aristides Pittas, Chairman and CEO of Euroseas commented“Containership markets, both charter rates and secondhand prices, have continued unabated their upward path that started in the fall of last year reaching all time highs in all size segments. Selected short term “fill-the-gap” charters have been reported in extremely high levels while long term charters of two to five years are widely offered by charterers for the various types and ages of vessels. There is no doubt that part of the near term increase in demand for vessels is fueled by the inefficiencies brought about by the effects of the COVID pandemic in the transportation system, in addition to rebounding trade growth. However, the strong demand for securing capacity for the medium and longer term can only come from expectations that vessel capacity will be in short supply in view of the expected demand. We believe that the favorable market fundamentals will continue as incremental regulatory requirements coming in 2023 will further restrict the effective supply of vessels and assist in absorbing increased new deliveries starting from the latter part of 2023 onwards as a result of recently placed newbuilding orders.

“Chartering-wise, we have pursued to-date a staggered expiration strategy which has allowed us to follow the upward path of the market having charters coming due for renewal on a rolling basis. Today, we announced the three-year long charter of our vessel, Diamantis P., at a rate of $27,000 per day which will provide us with more than $28.5 million of contracted revenues and $21 million EBITDA during the term of the charter. As the containership markets keep their present levels or continue to rise, we expect our profitability to rise as well, in addition to providing increased visibility of our earnings which now extends into next year and in 2023.

“Our broader strategy is to build Euroseas in a key long term participant in the feeder/intermediate containership segment as evidenced with the placement of our order to build two 2,800 teu vessels to be delivered in the first half of 2023. In that spirit, we continue to evaluate additional uses of any accumulated earnings for the benefit of our shareholders, like, expanding in a risk measured and accretive manner, targeting to use our public listing as a potential platform to consolidate privately owned vessels or fleets or rewarding our shareholders by re-instituting common stock dividends.”

Tasos Aslidis, Chief Financial Officer of Euroseas commented: “The results of the second quarter of 2021 reflect the increased charter rates our vessels earned due to the major recovery of the market compared to the same period of 2020, despite the decrease in the number of vessels we operated during the second quarter of 2021 to 14 vessels, from 19 vessels operated during the same period last year. Our net revenues increased to $18.3 million in the second quarter of 2021 compared to $13.5 million during the same period of last year. On a per-vessel-per-day basis, our vessels earned a 57.0% higher average charter rate in the second quarter of 2021 as compared to the same period of 2020. Our results have also benefitted from other operating income of $1.1 million, net, mainly consisting of the proceeds of a claim award related to the sale of one of our vessels, M/V “Manolis P”, for scrap in March 2020 that initially failed due to COVID-related reasons with the vessel finally being sold to another buyer within the second quarter of 2020.

“Total daily vessel operating expenses, including management fees, general and administrative expenses but excluding drydocking costs, averaged $6,860 per vessel per day during the second quarter of 2021 as compared to $6,120 per vessel per day for the same quarter of last year, and $6,887 per vessel per day for the first half of 2021 as compared to $6,003 per vessel per day for the same period of 2020, reflecting a 12.1% and 14.7% increase, respectively, which was attributable to increased supply of stores, increase in hull and machinery insurance premiums and the increased crewing costs for our vessels resulting from difficulties in crew rotation due to COVID-19 related restrictions.

“Adjusted EBITDA during the second quarter of 2021 was $10.3 million versus $4.4 million in the second quarter of last year. As of June 30, 2021, our outstanding debt (excluding the unamortized loan fees) was $62.0 million versus restricted and unrestricted cash of $11.0 million. As of the same date, our scheduled bank debt repayments over the next 12 months amounted to about $20.1 million (excluding the unamortized loan fees), and we are in compliance with all our loan covenants.”

Second Quarter 2021 Results:
For the second quarter of 2021, the Company reported total net revenues of $18.3 million representing a 35.4% increase over total net revenues of $13.5 million during the second quarter of 2020 which was a result of the increased market charter rates our vessels earned in the second quarter of 2021 compared to the same period of 2020. The Company reported a net income for the period of $7.9 million and a net income attributable to common shareholders of $7.6 million, as compared to a net income of $1.3 million and a net income attributable to common shareholders of $1.1 million, respectively, for the same period of 2020. Drydocking expenses amounted to $0.1 million during the second quarter of 2021 related to certain expenses incurred in connection with upcoming drydockings. In the corresponding period of 2020, one vessel passed its intermediate survey in-water and another vessel its special survey in-water for a total cost of $0.4 million. Depreciation expenses for the second quarter of 2021 amounted to $1.6 million compared to $1.7 million for the same period of 2020, due to the decreased number of vessels in the Company’s fleet. Vessel operating expenses were $6.9 million in the second quarter of 2021 as compared to $8.5 million for the second quarter of 2020. The decreased amount is due to the lower number of vessels owned and operated in the second quarter of 2021 compared to the corresponding period of 2020, partly offset by the increased crewing costs for our vessels compared to the same period of 2020, resulting from difficulties in crew rotation due to COVID-19 related restrictions, the increased supply of stores and the increase in hull and machinery insurance premiums. General and administrative expenses amounted to $0.7 million for the second quarter of 2021, marginally lower compared to $0.8 million for the second quarter of 2020. On average, 14.0 vessels were owned and operated during the second quarter of 2021 earning an average time charter equivalent rate of $14,853 per day compared to 19.0 vessels in the same period of 2020 earning on average $9,458 per day.

Interest and other financing costs for the second quarter of 2021 amounted to $0.7 million compared to $1.1 million for the same period of 2020. This decrease is due to the decreased amount of debt and the decrease in weighted average LIBOR rate in the current period compared to the same period of 2020.   

Adjusted EBITDA for the second quarter of 2021 was $10.3 million compared to $4.4 million achieved during the second quarter of 2020.

Basic and diluted earnings per share attributable to common shareholders for the second quarter of 2021 was $1.12 and $1.11, calculated on 6,778,829 basic and 6,826,305 diluted weighted average number of shares outstanding, compared to basic and diluted earnings per share of $0.20 for the second quarter of 2020, calculated on 5,576,960 basic and diluted weighted average number of shares outstanding.

Excluding the effect on the income attributable to common shareholders for the quarter of the unrealized loss on derivative, the adjusted earnings attributable to common shareholders for the quarter ended June 30, 2021 would have been $1.12 per share basic and diluted, compared to adjusted earnings of $0.25 per share basic and diluted for the quarter ended June 30, 2020, after excluding unrealized loss on derivative, amortization of below market time charters acquired and loss on write down of vessel held for sale. Usually, security analysts do not include the above item in their published estimates of earnings per share.

First Half 2021 Results:
For the first half of 2021, the Company reported total net revenues of $32.6 million representing a 12.6% increase over total net revenues of $28.9 million during the first half of 2020, as a result of the higher average charter rates our vessels earned during the period as compared to the same period of last year. The Company reported a net income for the period of $11.7 million and a net income attributable to common shareholders of $11.1 million, as compared to a net income of $3.2 million and a net income attributable to common shareholders of $2.9 million respectively, for the first half of 2020. Depreciation expenses for the first half of 2021 were $3.2 million compared to $3.4 million during the same period of 2020. On average, 14.0 vessels were owned and operated during the first half of 2021 earning an average time charter equivalent rate of $13,523 per day compared to 19.0 vessels in the same period of 2020 earning on average $9,541 per day.

Interest and other financing costs for the first half of 2021 amounted to $1.4 million compared to $2.4 million for the same period of 2020. This decrease is due to the decreased amount of debt and the decrease in weighted average LIBOR rate of our bank loans in the current period compared to the same period of 2020.  

Adjusted EBITDA for the first half of 2021 was $15.9 million compared to $8.4 million achieved during the first half of 2020.

Basic and diluted earnings per share attributable to common shareholders for the first half of 2021 was $1.65 calculated on 6,745,305 basic and $1.64, calculated on 6,789,718 diluted weighted average number of shares outstanding compared to basic and diluted earnings per share of $0.52 for the first half of 2020, calculated on 5,576,960 basic and diluted weighted average number of shares outstanding.

Excluding the effect on the income attributable to common shareholders for the first half of the year of the unrealized gain on derivative, the adjusted earnings per share attributable to common shareholders for the six-month period ended June 30, 2021 would have been $1.58 and $1.57, basic and diluted, respectively, compared to adjusted earnings of $0.42 per share basic and diluted for the same period in 2020, after excluding unrealized loss on derivative, amortization of below market time charters acquired and loss on write down of vessel held for sale. As mentioned above, usually, security analysts do not include the above items in their published estimates of earnings per share.

Fleet Profile:

The Euroseas Ltd. fleet profile is as follows:

Name Type Dwt TEU Year Built Employment(*) TCE Rate ($/day)
Container Carriers            
AKINADA BRIDGE(*) Intermediate 71,366 5,610 2001 TC until Oct-21
TC until Oct-22
$17,250
$20,000
SYNERGY BUSAN(*) Intermediate 50,726 4,253 2009 TC until Aug-21
TC until Aug-24
$12,000
$25,000
SYNERGY ANTWERP(*) Intermediate 50,726 4,253 2008 TC until Sep-23 $18,000
SYNERGY OAKLAND(+) Intermediate 50,787 4,253 2009 TC until Oct-21 CONTEX(**) 4250
less 10%
SYNERGY KEELUNG(+) Intermediate 50,969 4,253 2009 TC until Jun-22
plus 8- 12 months option
$11,750
option $14,500
EM KEA(*) Feeder 42,165 3,100 2007 TC until May-23 $22,000
EM ASTORIA(+) Feeder 35,600 2,788 2004 TC until Feb-22 $18,650
EVRIDIKI G(+) Feeder 34,677 2,556 2001 TC until Jan-22 $15,500
EM CORFU(+) Feeder 34,654 2,556 2001 TC until Sep-21 $10,200
DIAMANTIS P(+)(*) Feeder 30,360 2,008 1998 TC until Sep- 21
then from Oct-21
until Oct-24
$6,500
then $27,000
EM SPETSES(*) Feeder 23,224 1,740 2007 TC until Aug-24 $29,500
EM HYDRA(*) Feeder 23,351 1,740 2005 TC until Apr-23 $20,000
JOANNA(*) Feeder 22,301 1,732 1999 TC until Oct-22 $16,800
AEGEAN EXPRESS(*) Feeder 18,581 1,439 1997 TC until Mar-22 $11,500
Total Container Carriers on the Water 14 539,487 42,281      
         
Vessels under construction   Type Dwt TEU To be delivered
H4201 Feeder 37,237 2,800 Q1 2023
H4202 Feeder 37,237 2,800 Q2 2023

Note:  
(*)    TC denotes time charter. Charter duration indicates the earliest redelivery date; All dates listed are the earliest redelivery dates under each TC unless the contract rate is lower than the current market rate in which cases the latest redelivery date is assumed; vessels with the latest redelivery date shown are marked by (+).
(**)  The CONTEX (Container Ship Time Charter Assessment Index) has been published by the Hamburg and Bremen Shipbrokers’ Association (VHBS) since October 2007. The CONTEX is a company-independent index of time charter rates for container ships. It is based on assessments of the current day charter rates of six selected container ship types, which are representative of their size categories: Type 1,100 TEU and Type 1,700 TEU with a charter period of one year, and the Types 2,500, 2,700, 3,500 and 4,250 TEU all with a charter period of two years.

Summary Fleet Data:

  Three months, ended
June 30, 2020
Three months, ended
June 30, 2021
Six months, ended
June 30, 2020
Six months, ended
June 30, 2021
FLEET DATA        
Average number of vessels (1) 19.00   14.00   19.00   14.00  
Calendar days for fleet (2) 1,729.0   1,274.0   3,458.0   2,534.0  
Scheduled off-hire days incl. laid-up (3) 210.3   0.0   210.3   0.0  
Available days for fleet (4) = (2) – (3) 1,518.7   1,274.0   3,247.7   2,534.0  
Commercial off-hire days (5) 81.6   0.0   99.8   0.0  
Operational off-hire days (6) 3.9   1.1   69.7   42.3  
Voyage days for fleet (7) = (4) – (5) – (6) 1,433.2   1,272.9   3,078.2   2,491.7  
Fleet utilization (8) = (7) / (4) 94.4 % 99.9 % 94.8 % 98.3 %
Fleet utilization, commercial (9) = ((4) – (5)) / (4) 94.6 % 100.0 % 96.9 % 100.0 %
Fleet utilization, operational (10) = ((4) – (6)) / (4) 99.7 % 99.9 % 97.9 % 98.3 %
         
AVERAGE DAILY RESULTS        
Time charter equivalent rate (11) 9,458   14,853   9,541   13,523  
Vessel operating expenses excl. drydocking expenses (12) 5,665   6,279   5,544   6,295  
General and administrative expenses (13) 455   581   459   592  
Total vessel operating expenses (14) 6,120   6,860   6,003   6,887  
Drydocking expenses (15) 210   116   109   91  

(1) Average number of vessels is the number of vessels that constituted the Company’s fleet for the relevant period, as measured by the sum of the number of calendar days each vessel was a part of the Company’s fleet during the period divided by the number of calendar days in that period.

(2) Calendar days. We define calendar days as the total number of days in a period during which each vessel in our fleet was in our possession including off-hire days associated with major repairs, drydockings or special or intermediate surveys or days of vessels in lay-up. Calendar days are an indicator of the size of our fleet over a period and affect both the amount of revenues and the amount of expenses that we record during that period.

(3) The scheduled off-hire days including vessels laid-up, vessels committed for sale or vessels that suffered unrepaired damages are days associated with scheduled repairs, drydockings or special or intermediate surveys or days of vessels in lay-up, or of vessels that were committed for sale or suffered unrepaired damages.

(4) Available days. We define available days as the Calendar days in a period net of scheduled off-hire days including laid up. We use available days to measure the number of days in a period during which vessels were available to generate revenues.

(5) Commercial off-hire days. We define commercial off-hire days as days a vessel is idle without employment.

(6) Operational off-hire days. We define operational off-hire days as days associated with unscheduled repairs or other off-hire time related to the operation of the vessels.

(7) Voyage days. We define voyage days as the total number of days in a period during which each vessel in our fleet was in our possession net of commercial and operational off-hire days. We use voyage days to measure the number of days in a period during which vessels actually generate revenues or are sailing for repositioning purposes.

(8) Fleet utilization. We calculate fleet utilization by dividing the number of our voyage days during a period by the number of our available days during that period. We use fleet utilization to measure a company’s efficiency in finding suitable employment for its vessels and minimizing the amount of days that its vessels are off-hire for reasons such as unscheduled repairs or days waiting to find employment.

(9) Fleet utilization, commercial. We calculate commercial fleet utilization by dividing our available days net of commercial off-hire days during a period by our available days during that period.

(10) Fleet utilization, operational. We calculate operational fleet utilization by dividing our available days net of operational off-hire days during a period by our available days during that period.

(11) Time charter equivalent rate, or TCE rate, is a measure of the average daily revenue performance of our vessels. Our method of calculating TCE is determined by dividing time charter revenue and voyage charter revenue net of voyage expenses by voyage days for the relevant time period. Voyage expenses primarily consist of port, canal and fuel costs that are unique to a particular voyage, which would otherwise be paid by the charterer under a time charter contract, or are related to repositioning the vessel for the next charter. TCE is a standard shipping industry performance measure used primarily to compare period-to-period changes in a shipping company’s performance despite changes in the mix of charter types (i.e., spot voyage charters, time charters, pool agreements and bareboat charters) under which the vessels may be employed between the periods. Our definition of TCE may not be comparable to that used by other companies in the shipping industry.

(12) Daily vessel operating expenses, which include crew costs, provisions, deck and engine stores, lubricating oil, insurance, maintenance and repairs and management fees are calculated by dividing vessel operating expenses by fleet calendar days for the relevant time period. Drydocking expenses are reported separately.

(13) Daily general and administrative expense is calculated by dividing general and administrative expenses by fleet calendar days for the relevant time period.

(14) Total vessel operating expenses, or TVOE, is a measure of our total expenses associated with operating our vessels. TVOE is the sum of vessel operating expenses, management fees and general and administrative expenses; drydocking expenses are not included. Daily TVOE is calculated by dividing TVOE by fleet calendar days for the relevant time period.

(15) Drydocking expenses include expenses during drydockings that would have been capitalized and amortized under the deferral method divided by the fleet calendar days for the relevant period. Drydocking expenses could vary substantially from period to period depending on how many vessels underwent drydocking during the period. The Company expenses drydocking expenses as incurred.

Conference Call and Webcast:
Tomorrow, August 12, 2021 at 9:00 a.m. Eastern Time, the Company’s management will host a conference call and webcast to discuss the results.  

Conference Call details:  
Participants should dial into the call 10 minutes before the scheduled time using the following numbers: 1 (877) 553-9962 (US Toll Free Dial In), 0(808) 238-0669 (UK Toll Free Dial In) or +44 (0) 2071 928592 (Standard International Dial In). Please quote “Euroseas” to the operator.

To listen to the archived audio file, visit our website http://www.euroseas.gr and click on Company Presentations under our Investor Relations page. The audio replay of the conference call will remain available until Wednesday, August 18, 2021.

Audio webcast – Slides Presentation:
There will be a live and then archived audio webcast of the conference call, via the internet through the Euroseas website (www.euroseas.gr). Participants to the live webcast should register on the website approximately 10 minutes prior to the start of the webcast. A slide presentation on the Second Quarter 2021 results in PDF format will also be available 10 minutes prior to the conference call and webcast accessible on the company’s website (www.euroseas.gr) on the webcast page. Participants to the webcast can download the PDF presentation. 


Euroseas Ltd.
Unaudited Consolidated Condensed Statements of Operations
(All amounts expressed in U.S. Dollars – except number of shares)

  Three Months Ended
June 30,
Three Months Ended
June 30,
Six Months Ended
June 30,
Six Months Ended
June 30, 
  2020
  2021
  2020
  2021
  (unaudited) (unaudited)
Revenues        
Time charter revenue 14,135,109   19,057,379   30,266,431   33,973,743  
Commissions (626,398 ) (766,732 ) (1,324,913 ) (1,373,981 )


Net revenues


13,508,711
   

18,290,647
  28,941,518   32,599,762  
         
Operating expenses        
Voyage expenses 580,496   150,573   895,049   277,982  
Vessel operating expenses 8,482,050   6,937,767   16,530,150   13,802,119  
Drydocking expenses 362,783   147,175   376,369   229,384  
Vessel depreciation 1,659,641   1,596,543   3,386,726   3,193,086  
Related party management fees 1,313,546   1,061,816   2,642,368   2,148,221  
Other operating income (2,688,194 ) (1,080,000 ) (2,688,194 ) (1,296,496 )
General and administrative expenses

785,890
 

739,674
 

1,588,266
 

1,500,651
 
Loss on sale of vessel       9,417  
Loss on write down of vessel held for sale 121,165     121,165    
Total operating expenses 10,617,377   9,553,548   22,851,899   19,864,364  
         
Operating income 2,891,334   8,737,099   6,089,619   12,735,398  
         
Other income/(expenses)        
Interest and other financing costs (1,137,609 ) (687,360 ) (2,389,021 ) (1,381,667 )
(Loss) / gain on derivative, net (468,146 ) (96,765 ) (468,146 ) 388,145  
Foreign exchange gain / (loss) 555   (7,263 ) 2,183   (7,504 )
Interest income 4,185   740   12,780   1,954  
Other expenses, net (1,601,015 ) (790,648 ) (2,842,204 ) (999,072 )
Net income 1,290,319   7,946,451   3,247,415   11,736,326  
Dividend Series B Preferred shares (179,507 ) (117,055 ) (339,069 ) (255,324 )
Preferred deemed dividend   (259,067 )   (345,423 )
Net income attributable to common shareholders 1,110,812   7,570,329   2,908,346   11,135,579  
Weighted average number of shares, basic 5,576,960   6,778,829   5,576,960   6,745,305  
Earnings per share, basic 0.20   1.12   0.52   1.65  
Weighted average number of shares, diluted 5,576,960   6,826,305   5,576,960   6,789,718  
Earnings per share, diluted 0.20   1.11   0.52   1.64  


Euroseas Ltd.
Unaudited Consolidated Condensed Balance Sheets
(All amounts expressed in U.S. Dollars – except number of shares)

  December 31,
2020
June 30,
2021
     
ASSETS    
Current Assets:    
Cash and cash equivalents 3,559,399 8,267,771
Trade accounts receivable, net 2,013,023 1,536,746
Other receivables 1,866,624 2,525,962
Inventories 1,662,422 1,530,069
Restricted cash 345,010 876,187
Prepaid expenses 244,315 442,307
Total current assets

9,690,793 15,179,042
Fixed assets:    
Vessels, net 98,458,447 95,598,016
Long-term assets:    
Restricted cash 2,433,768 1,900,000
Derivative 230,640
Total assets 110,583,008 112,907,698
     
LIABILITIES, MEZZANINE EQUITY AND SHAREHOLDERS’ EQUITY    
Current liabilities:    
Long-term bank loans, current portion 20,645,320 14,993,800
Related party loan, current 2,500,000
Trade accounts payable 2,854,377 2,219,766
Accrued expenses 1,300,420 1,158,617
Accrued preferred dividends 168,676 332,393
Deferred revenue 949,364 883,129
Due to related company 24,072 747,680
Derivative 203,553 322,741
Total current liabilities 28,645,782 20,658,126
     
Long-term liabilities:    
Long-term bank loans, net of current portion 46,220,028 46,699,188
Derivative 362,195
Total long-term liabilities 46,582,223 46,699,188
Total liabilities 75,228,005 67,357,314
     
Mezzanine equity:      
Series B Preferred shares (par value $0.01, 20,000,000 shares authorized, 8,365 and nil issued and outstanding, respectively) 8,019,636      
Shareholders’ equity:      
Common stock (par value $0.03, 200,000,000 shares authorized, 6,708,946 and 7,244,891, issued and outstanding) 201,268   217,347    
Additional paid-in capital 257,467,980   264,531,339    
Accumulated deficit (230,333,881 ) (219,198,302 )  
Total shareholders’ equity 27,335,367   45,550,384    
Total liabilities, mezzanine equity and shareholders’ equity 110,583,008   112,907,698    


Euroseas Ltd.
Unaudited Consolidated Condensed Statements of Cash Flows
(All amounts expressed in U.S. Dollars)

  Six Months Ended June 30,   Six Months Ended June 30,  
2020   2021  
     
Cash flows from operating activities:  
Net income 3,247,415   11,736,326  
Adjustments to reconcile net income to net cash provided by operating activities:    
Vessel depreciation 3,386,726   3,193,086  
Amortization of deferred charges 122,787   98,560  
Share-based compensation 60,808   57,850  
Unrealized loss / (gain) on derivative 468,146   (473,647 )
Amortization of fair value of below market time charters acquired (1,160,839 )  
Loss on write down of vessel held for sale 121,165    
Loss on sale of vessel   9,417  
Changes in operating assets and liabilities (2,273,177 ) (511,343 )
Net cash provided by operating activities 3,973,031   14,110,249  
     
Cash flows from investing activities:    
Cash paid for vessels capitalized expenses and sale expenses (256,482 ) (225,136 )
Advance received for vessel held for sale 540,783    
Net cash provided by / (used in) investing activities 284,301   (225,136 )
     
Cash flows from financing activities:    
Redemption of Series B preferred shares   (2,000,000 )
Proceeds from issuance of common stock, net of commissions paid   743,553  
Preferred dividends paid (320,877 ) (91,608 )
Repayment of long-term bank loans and vessel profit participation liability (5,295,920 ) (5,270,920 )
Repayment of related party loan (625,000 ) (2,500,000 )
Offering expenses paid (40,486 ) (60,357 )
Net cash used in financing activities (6,282,283 ) (9,179,332 )
     
Net (decrease) / increase in cash, cash equivalents and restricted cash (2,024,951 ) 4,705,781  
Cash, cash equivalents and restricted cash at beginning of period 5,930,061   6,338,177  
Cash, cash equivalents and restricted cash at end of period 3,905,110   11,043,958  

Cash breakdown

Cash and cash equivalents 1,338,375   8,267,771  
Restricted cash, current 432,468   876,187  
Restricted cash, long term 2,134,267   1,900,000  
Total cash, cash equivalents and restricted cash shown in the statement of cash flows 3,905,110  
11,043,958


Euroseas Ltd.
Reconciliation of Adjusted EBITDA to Net income
(All amounts expressed in U.S. Dollars)

  Three Months Ended
June 30, 2020
Three Months Ended
June 30, 2021
Six Months Ended
June 30, 2020
Six Months Ended
June 30, 2021
Net income 1,290,319   7,946,451 3,247,415   11,736,326  
Interest and other financing costs, net (incl. interest income) 1,133,424   686,620 2,376,241   1,379,713  
Vessel depreciation 1,659,641   1,596,543 3,386,726   3,193,086  
Loss / (gain) on interest rate swap derivative, net 468,146   96,765 468,146   (388,145 )
Amortization of below market time charters acquired (314,434 ) (1,160,839 )  
Loss on sale of vessel     9,417  
Loss on write down of vessel held for sale 121,165   121,165    

Adjusted EBITDA
4,358,261   10,326,379 8,438,854   15,930,397  

Adjusted EBITDA Reconciliation:
Euroseas Ltd. considers Adjusted EBITDA to represent net income before interest, income taxes, depreciation, (gain) / loss on interest rate swaps, amortization of below market time charters acquired, loss on sale of vessel and loss on write down of vessel held for sale. Adjusted EBITDA does not represent and should not be considered as an alternative to net income, as determined by United States generally accepted accounting principles, or GAAP. Adjusted EBITDA is included herein because it is a basis upon which the Company assesses its financial performance and liquidity position and because the Company believes that this non- GAAP financial measure assists our management and investors by increasing the comparability of our performance from period to period by excluding the potentially disparate effects between periods, of financial costs, (gain)/ loss on interest rate swaps, depreciation, amortization of below market time charters acquired, loss on vessel sale and loss on write down of vessel held for sale. The Company’s definition of Adjusted EBITDA may not be the same as that used by other companies in the shipping or other industries. 


Euroseas Ltd.
Reconciliation of Net income to Adjusted net income
(All amounts expressed in U.S. Dollars – except share data and number of shares)

  Three Months Ended
June 30, 2020
Three Months Ended
June 30, 2021
Six Months Ended
June 30, 2020
Six Months Ended
June 30, 2021
Net income 1,290,319   7,946,451   3,247,415   11,736,326  
Unrealized loss / (gain) on derivative 468,146   54,128   468,146   (473,647 )
Amortization of below market time charters acquired (314,434 )   (1,160,839 )  
Loss on write down of vessel held for sale 121,165     121,165    
Loss on sale of vessel       9,417  
Adjusted net income 1,565,196   8,000,579   2,675,887   11,272,096  
Preferred dividends (179,507 ) (117,055 ) (339,069 ) (255,324 )
Preferred deemed dividend   (259,067 )   (345,423 )

Adjusted net income attributable to common shareholders
1,385,689   7,624,457   2,336,818   10,671,349  

Adjusted earnings per share, basic
0.25   1.12   0.42   1.58  

Weighted average number of shares, basic
5,576,960   6,778,829   5,576,960   6,745,305  

Adjusted earnings per share, diluted
0.25   1.12   0.42   1.57  

Weighted average number of shares, diluted
5,576,960   6,826,305   5,576,960   6,789,718  

Adjusted net income and Adjusted earnings per share Reconciliation:
Euroseas Ltd. considers Adjusted net income to represent net income before unrealized (gain) / loss on derivative, amortization of below market time charters acquired, loss on write down of vessel held for sale and loss on sale of vessel. Adjusted net income and Adjusted earnings per share is included herein because we believe it assists our management and investors by increasing the comparability of the Company’s fundamental performance from period to period by excluding the potentially disparate effects between periods of unrealized (gain) / loss on derivative, loss on write down of vessel held for sale, loss on sale of vessel and amortization of below market time charters acquired, which items may significantly affect results of operations between periods. 

Adjusted net income and Adjusted earnings per share do not represent and should not be considered as an alternative to net income or earnings per share, as determined by GAAP. The Company’s definition of Adjusted net income and Adjusted earnings per share may not be the same as that used by other companies in the shipping or other industries.

About Euroseas Ltd.
Euroseas Ltd. was formed on May 5, 2005 under the laws of the Republic of the Marshall Islands to consolidate the ship owning interests of the Pittas family of Athens, Greece, which has been in the shipping business over the past 140 years. Euroseas trades on the NASDAQ Capital Market under the ticker ESEA. 

Euroseas operates in the container shipping market. Euroseas’ operations are managed by Eurobulk Ltd., an ISO 9001:2008 and ISO 14001:2004 certified affiliated ship management company, which is responsible for the day-to-day commercial and technical management and operations of the vessels. Euroseas employs its vessels on spot and period charters and through pool arrangements. 

The Company has a fleet of 14 vessels, including 9 Feeder containerships and 5 Intermediate Containerships. Euroseas 14 containerships have a cargo capacity of 42,281 teu.

Forward Looking Statement
This press release contains forward-looking statements (as defined in Section 27A of the Securities Act of 1933, as amended, and Section 21E of the Securities Exchange Act of 1934, as amended) concerning future events and the Company’s growth strategy and measures to implement such strategy; including expected vessel acquisitions and entering into further time charters. Words such as “expects,” “intends,” “plans,” “believes,” “anticipates,” “hopes,” “estimates,” and variations of such words and similar expressions are intended to identify forward-looking statements. Although the Company believes that the expectations reflected in such forward-looking statements are reasonable, no assurance can be given that such expectations will prove to have been correct. These statements involve known and unknown risks and are based upon a number of assumptions and estimates that are inherently subject to significant uncertainties and contingencies, many of which are beyond the control of the Company. Actual results may differ materially from those expressed or implied by such forward-looking statements. Factors that could cause actual results to differ materially include, but are not limited to changes in the demand for containerships, competitive factors in the market in which the Company operates; risks associated with operations outside the United States; and other factors listed from time to time in the Company’s filings with the Securities and Exchange Commission. The Company expressly disclaims any obligations or undertaking to release publicly any updates or revisions to any forward-looking statements contained herein to reflect any change in the Company’s expectations with respect thereto or any change in events, conditions or circumstances on which any statement is based. 

Visit our website www.euroseas.gr

Company Contact Investor Relations / Financial Media
Tasos Aslidis
Chief Financial Officer
Euroseas Ltd.
11 Canterbury Lane,
Watchung, NJ 07069
Tel. (908) 301-9091
E-mail: aha@euroseas.gr
Nicolas Bornozis
President
Capital Link, Inc.
230 Park Avenue, Suite 1536
New York, NY 10169
Tel. (212) 661-7566
E-mail: nbornozis@capitallink.com

Release – Kelly Reports Second-Quarter 2021 Earnings and Announces Dividend


Kelly Reports Second-Quarter 2021 Earnings and Announces Dividend


Financial Highlights

  • Q2 revenue up 29.0%; 26.2% in constant currency
  • Q2 operating earnings of $13.7 million; up 24.1% from a year ago
  • Q2 earnings per share of $0.60 down from $1.04 a year ago; adjusted EPS of $0.49 compared to $0.51

TROY, Mich., Aug. 12, 2021 (GLOBE NEWSWIRE) — Kelly (Nasdaq: KELYA) (Nasdaq: KELYB), a leading specialty talent solutions provider, today announced results for the second quarter of 2021.

Peter Quigley, president and chief executive officer, announced revenue for the second quarter of 2021 totaled $1.3 billion, a 29.0% increase compared to the corresponding quarter of 2020. Revenue improved year-over-year in the quarter reflecting increased customer demand compared to the COVID-19-impacted prior year period.

Earnings from operations in the second quarter of 2021 totaled $13.7 million, compared to earnings of $11.1 million reported in the second quarter of 2020.

Diluted earnings per share in the second quarter of 2021 were $0.60 compared to $1.04 per share in the second quarter of 2020. Included in the earnings per share is a non-cash gain per share, net of tax, on Kelly’s investment in Persol Holdings common stock of $0.11 in the second quarter of 2021 and $0.52 in the second quarter of 2020. On an adjusted basis, earnings per share were $0.49 in the second quarter of 2021 compared to $0.51 in the corresponding quarter of 2020.

“All five of our operating segments—Professional & Industrial (P&I); Science, Engineering & Technology (SET); Education; OCG; and International—delivered organic year-over-year revenue growth in the second quarter as the recovery gained momentum,” said Quigley. “OCG continues to exceed pre-COVID growth rates; Education exited the quarter on track with 2019 revenue; our International and SET segments delivered solid specialty growth; and our Softworld acquisition is already delivering top- and bottom-line results for the enterprise. Demand is strong in our P&I segment, though it will take longer to fully recover. We’re encouraged by the healthy sales pipelines and new wins we’re seeing across all of our businesses. Our reinstatement of a dividend for the quarter reflects the progress we’re making with our specialization and M&A strategies, and our confidence in the economic recovery. Kelly is well-positioned for the future and ready for what’s next.”

Kelly also reported that on August 11, its board of directors declared a dividend of $0.05 per share. The dividend is payable on September 7, 2021 to stockholders of record as of the close of business on August 25, 2021.

In conjunction with its second quarter earnings release, Kelly has published a financial presentation on the Investor Relations page of its public website and will host a conference call at 9 a.m. ET on August 12 to review the results and answer questions. The call may be accessed in one of the following ways:

Via the Internet:
Kellyservices.com

Via the Telephone
(877) 692-8955 (toll free) or (234) 720-6979 (caller paid)
Enter access code 5728672
After the prompt, please enter “#”

A recording of the conference call will be available after 2:30 p.m. ET on August 12, 2021, at (866) 207-1041 (toll-free) and (402) 970-0847 (caller-paid). The access code is 8454029#. The recording will also be available at kellyservices.com during this period.

This release contains statements that are forward looking in nature and, accordingly, are subject to risks and uncertainties. These factors include, but are not limited to, changing market and economic conditions, the recent novel coronavirus (COVID-19) outbreak, competitive market pressures including pricing and technology introductions and disruptions, disruption in the labor market and weakened demand for human capital resulting from technological advances, competition law risks, the impact of changes in laws and regulations (including federal, state and international tax laws), unexpected changes in claim trends on workers’ compensation, unemployment, disability and medical benefit plans, or the risk of additional tax liabilities in excess of our estimates, our ability to achieve our business strategy, our ability to successfully develop new service offerings, material changes in demand from or loss of large corporate customers as well as changes in their buying practices, risks particular to doing business with government or government contractors, the risk of damage to our brand, our exposure to risks associated with services outside traditional staffing, including business process outsourcing, services of licensed professionals and services connecting talent to independent work, our increasing dependency on third parties for the execution of critical functions, our ability to effectively implement and manage our information technology strategy, the risks associated with past and future acquisitions, including risk of related impairment of goodwill and intangible assets, exposure to risks associated with investments in equity affiliates including PersolKelly Pte. Ltd., risks associated with conducting business in foreign countries, including foreign currency fluctuations, the exposure to potential market and currency exchange risks relating to our investment in Persol Holdings, risks associated with violations of anti-corruption, trade protection and other laws and regulations, availability of qualified full-time employees, availability of temporary workers with appropriate skills required by customers, liabilities for employment-related claims and losses, including class action lawsuits and collective actions, our ability to sustain critical business applications through our key data centers, risks arising from failure to preserve the privacy of information entrusted to us or to meet our obligations under global privacy laws, the risk of cyberattacks or other breaches of network or information technology security, our ability to realize value from our tax credit and net operating loss carryforwards, our ability to maintain specified financial covenants in our bank facilities to continue to access credit markets, and other risks, uncertainties and factors discussed in this release and in the Company’s filings with the Securities and Exchange Commission. Actual results may differ materially from any forward-looking statements contained herein, and we undertake no duty to update any forward-looking statement to conform the statement to actual results or changes in the Company’s expectations.

About Kelly®

Kelly Services, Inc. (Nasdaq: KELYA, KELYB) connects talented people to companies in need of their skills in areas including Science, Engineering, Education, Office, Contact Center, Light Industrial, and more. We’re always thinking about what’s next in the evolving world of work, and we help people ditch the script on old ways of thinking and embrace the value of all workstyles in the workplace. We directly employ nearly 370,000 people around the world, and we connect thousands more with work through our global network of talent suppliers and partners in our outsourcing and consulting practice. Revenue in 2020 was $4.5 billion. Visit kellyservices.com and let us help with what’s next for you.


MEDIA CONTACT:     ANALYST CONTACT:
Jane Stehney     James Polehna
(248) 765-6864     (248) 244-4586
stehnja@kellyservices.com     james.polehna@kellyservices.com


KELLY SERVICES, INC. AND SUBSIDIARIES
CONSOLIDATED STATEMENTS OF EARNINGS
FOR THE 13 WEEKS ENDED JULY 4, 2021 AND JUNE 28, 2020
(UNAUDITED)
(In millions of dollars except per share data)
                %   CC %  
    2021   2020   Change   Change   Change  
                       
Revenue from services $ 1,258.1   $ 975.3   $ 282.8     29.0   % 26.2   %
                       
Cost of services   1,027.1     786.1     241.0     30.7        
                       
Gross profit   231.0     189.2     41.8     22.1     19.6    
                       
Selling, general and administrative expenses   217.3     178.1     39.2     21.9     19.8    
                       
Earnings (loss) from operations   13.7     11.1     2.6     24.1        
                       
Gain (loss) on investment in Persol Holdings   6.3     29.6     (23.3 )   (78.8 )      
                       
Other income (expense), net   (0.3 )   2.6     (2.9 )   (109.0 )      
                       
Earnings (loss) before taxes and equity in net earnings (loss) of affiliate   19.7     43.3     (23.6 )   (54.4 )      
                       
Income tax expense (benefit)   (2.6 )   0.9     (3.5 )   (406.2 )      
                       
Net earnings (loss) before equity in net earnings (loss) of affiliate   22.3     42.4     (20.1 )   (47.2 )      
                       
Equity in net earnings (loss) of affiliate   1.7     (1.3 )   3.0     NM      
                       
Net earnings (loss) $ 24.0   $ 41.1   $ (17.1 )   (41.6 )      
                       
Basic earnings (loss) per share $ 0.60   $ 1.04   $ (0.44 )   (42.3 )      
Diluted earnings (loss) per share $ 0.60   $ 1.04   $ (0.44 )   (42.3 )      
                       
                       
STATISTICS:                      
                       
Permanent placement revenue (included in revenue from services) $ 18.6   $ 7.6   $ 11.0     146.1   % 139.8   %
                       
Gross profit rate   18.4   % 19.4   % (1.0 ) pts.        
                       
Conversion rate   5.9   % 5.8   % 0.1   pts.        
                       
Adjusted EBITDA $ 22.2   $ 16.9   $ 5.3            
Adjusted EBITDA margin   1.8   % 1.7   % 0.1   pts.        
                       
Effective income tax rate   (13.5 ) % 2.0   % (15.5 ) pts.        
                       
Average number of shares outstanding (millions):                      
Basic   39.4     39.3                
Diluted   39.5     39.4                


KELLY SERVICES, INC. AND SUBSIDIARIES
CONSOLIDATED STATEMENTS OF EARNINGS
FOR THE 26 WEEKS ENDED JULY 4, 2021 AND JUNE 28, 2020
(UNAUDITED)
(In millions of dollars except per share data)
                %   CC %  
    2021   2020   Change   Change   Change  
                       
Revenue from services $ 2,464.0   $ 2,236.4   $ 227.6     10.2   % 8.3   %
                       
Cost of services   2,019.7     1,823.9     195.8     10.7        
                       
Gross profit   444.3     412.5     31.8     7.7     5.9    
                       
Selling, general and administrative expenses   420.0     397.6     22.4     5.6     4.0    
                       
Goodwill impairment charge       147.7     (147.7 )   NM      
                       
Gain on sale of assets       (32.1 )   32.1     NM      
                       
Earnings (loss) from operations   24.3     (100.7 )   125.0     NM      
                       
Gain (loss) on investment in Persol Holdings   36.3     (48.2 )   84.5     NM      
                       
Other income (expense), net   (3.7 )   4.3     (8.0 )   (185.8 )      
                       
Earnings (loss) before taxes and equity in net earnings (loss) of affiliate   56.9     (144.6 )   201.5     NM      
                       
Income tax expense (benefit)   7.9     (35.3 )   43.2     122.2        
                       
Net earnings (loss) before equity in net earnings (loss) of affiliate   49.0     (109.3 )   158.3     NM      
                       
Equity in net earnings (loss) of affiliate   0.6     (2.8 )   3.4     NM      
                       
Net earnings (loss) $ 49.6   $ (112.1 ) $ 161.7     NM      
                       
Basic earnings (loss) per share $ 1.25   $ (2.86 ) $ 4.11     NM      
Diluted earnings (loss) per share $ 1.25   $ (2.86 ) $ 4.11     NM      
                       
                       
STATISTICS:                      
                       
Permanent placement revenue (included in revenue from services) $ 34.6   $ 19.8   $ 14.8     74.1   % 70.0   %
                       
Gross profit rate   18.0   % 18.4   % (0.4 ) pts.        
                       
Conversion rate   5.5   % (24.4 ) % 29.9   pts.        
                       
Adjusted EBITDA $ 39.1   $ 35.4   $ 3.7            
Adjusted EBITDA margin   1.6   % 1.6   %   pts.        
                       
Effective income tax rate   13.8   % 24.5   % (10.7 ) pts.        
                       
Average number of shares outstanding (millions):                      
Basic   39.4     39.2                
Diluted   39.5     39.2                


KELLY SERVICES, INC. AND SUBSIDIARIES
RESULTS OF OPERATIONS BY SEGMENT
(UNAUDITED)
(In millions of dollars)
                     
    Second Quarter
                     
              %   CC %  
    2021     2020   Change   Change  
Professional & Industrial                    
Revenue from services $ 466.5     $ 406.4     14.8   % 14.0   %
Gross profit   75.2       78.9     (4.7 )   (5.5 )  
SG&A expenses excluding restructuring charges   69.0       64.6     6.8     6.2    
Restructuring charges             NM   NM  
Total SG&A expenses   69.0       64.6     6.9     6.2    
Earnings (loss) from operations   6.2       14.3     (57.0 )      
Earnings (loss) from operations excluding restructuring charges   6.2       14.3     (56.9 )      
                     
Gross profit rate   16.1   %   19.4   % (3.3 ) pts.    
                     
Science, Engineering & Technology                    
Revenue from services $ 298.2     $ 247.3     20.6   % 20.1   %
Gross profit   66.5       50.6     31.5     31.1    
SG&A expenses excluding restructuring charges   46.9       31.3     49.7     49.3    
Restructuring charges             NM   NM  
Total SG&A expenses   46.9       31.3     49.7     49.3    
Earnings (loss) from operations   19.6       19.3     1.8        
Earnings (loss) from operations excluding restructuring charges   19.6       19.3     1.8        
                     
Gross profit rate   22.3   %   20.4   % 1.9   pts.    
                     
Education                    
Revenue from services $ 105.9     $ 25.1     322.1   % 322.1   %
Gross profit   16.8       4.3     291.1     291.1    
SG&A expenses excluding restructuring charges   15.3       9.6     60.0     60.0    
Restructuring charges         (0.1 )   NM   NM  
Total SG&A expenses   15.3       9.5     60.5     60.5    
Earnings (loss) from operations   1.5       (5.2 )   NM      
Earnings (loss) from operations excluding restructuring charges   1.5       (5.3 )   NM      
                     
Gross profit rate   15.8   %   17.1   % (1.3 ) pts.    
                     
Outsourcing & Consulting                    
Revenue from services $ 107.3     $ 83.6     28.2   % 26.1   %
Gross profit   34.8       29.2     19.3     15.7    
SG&A expenses excluding restructuring charges   30.1       25.1     19.8     17.0    
Restructuring charges             NM   NM  
Total SG&A expenses   30.1       25.1     19.7     17.0    
Earnings (loss) from operations   4.7       4.1     16.2        
Earnings (loss) from operations excluding restructuring charges   4.7       4.1     15.9        
                     
Gross profit rate   32.5   %   34.9   % (2.4 ) pts.    
                     
International                    
Revenue from services $ 280.4     $ 213.0     31.6   % 21.6   %
Gross profit   37.7       26.2     43.8     32.9    
SG&A expenses excluding restructuring charges   34.6       28.3     22.3     13.3    
Restructuring charges             NM   NM  
Total SG&A expenses   34.6       28.3     22.3     13.3    
Earnings (loss) from operations   3.1       (2.1 )   NM      
Earnings (loss) from operations excluding restructuring charges   3.1       (2.1 )   NM      
                     
Gross profit rate   13.4   %   12.3   % 1.1   pts.    


KELLY SERVICES, INC. AND SUBSIDIARIES
RESULTS OF OPERATIONS BY SEGMENT
(UNAUDITED)
(In millions of dollars)
                     
    June Year to Date
                     
              %   CC %  
    2021     2020   Change   Change  
Professional & Industrial                    
Revenue from services $ 934.1     $ 900.2     3.8   % 3.2   %
Gross profit   151.1       164.0     (7.9 )   (8.4 )  
SG&A expenses excluding restructuring charges   138.4       140.7     (1.7 )   (2.1 )  
Restructuring charges         4.4     NM   NM  
Total SG&A expenses   138.4       145.1     (4.6 )   (5.0 )  
Earnings (loss) from operations   12.7       18.9     (32.9 )      
Earnings (loss) from operations excluding restructuring charges   12.7       23.3     (45.4 )      
                     
Gross profit rate   16.2   %   18.2   % (2.0 ) pts.    
                     
Science, Engineering & Technology                    
Revenue from services $ 552.9     $ 517.5     6.8   % 6.5   %
Gross profit   119.7       105.3     13.7     13.4    
SG&A expenses excluding restructuring charges   82.6       67.3     22.8     22.5    
Restructuring charges         0.5     NM   NM  
Total SG&A expenses   82.6       67.8     21.8     21.5    
Earnings (loss) from operations   37.1       37.5     (1.1 )      
Earnings (loss) from operations excluding restructuring charges   37.1       38.0     (2.5 )      
                     
Gross profit rate   21.6   %   20.3   % 1.3   pts.    
                     
Education                    
Revenue from services $ 217.5     $ 167.6     29.8   % 29.8   %
Gross profit   34.0       24.7     37.6     37.6    
SG&A expenses excluding restructuring charges   29.5       25.3     16.8     16.8    
Restructuring charges         0.8     NM   NM  
Total SG&A expenses   29.5       26.1     12.9     12.9    
Earnings (loss) from operations   4.5       (1.4 )   NM      
Earnings (loss) from operations excluding restructuring charges   4.5       (0.6 )   NM      
                     
Gross profit rate   15.6   %   14.7   % 0.9   pts.    
                     
Outsourcing & Consulting                    
Revenue from services $ 206.6     $ 173.1     19.3   % 17.5   %
Gross profit   66.1       58.0     14.1     11.0    
Total SG&A expenses   58.5       53.7     8.9     6.6    
Earnings (loss) from operations   7.6       4.3     78.9        
                     
Gross profit rate   32.0   %   33.5   % (1.5 ) pts.    
                     
International                    
Revenue from services $ 553.3     $ 478.2     15.7   % 9.0   %
Gross profit   73.4       60.5     21.3     13.9    
SG&A expenses excluding restructuring charges   67.7       60.4     12.0     5.1    
Restructuring charges         1.1     NM   NM  
Total SG&A expenses   67.7       61.5     10.1     3.3    
Earnings (loss) from operations   5.7       (1.0 )   NM      
Earnings (loss) from operations excluding restructuring charges   5.7       0.1     NM      
                     
Gross profit rate   13.3   %   12.7   % 0.6   pts.    


KELLY SERVICES, INC. AND SUBSIDIARIES
CONSOLIDATED BALANCE SHEETS
(UNAUDITED)
(In millions of dollars)
               
    July 4, 2021   January 3, 2021   June 28, 2020  
Current Assets              
Cash and equivalents $ 64.4   $ 223.0   $ 216.2    
Trade accounts receivable, less allowances of              
 $12.5, $13.3, and $11.2, respectively   1,362.5     1,265.2     1,085.0    
Prepaid expenses and other current assets   82.4     61.4     76.0    
Total current assets   1,509.3     1,549.6     1,377.2    
               
Noncurrent Assets              
Property and equipment, net   37.7     41.0     41.6    
Operating lease right-of-use assets   83.2     83.2     85.8    
Deferred taxes   302.9     282.0     265.9    
Goodwill, net   114.8     3.5        
Investment in Persol Holdings   187.7     164.2     127.2    
Investment in equity affiliate   120.0     118.5     113.6    
Other assets   391.3     319.9     307.4    
Total noncurrent assets   1,237.6     1,012.3     941.5    
               
Total Assets $ 2,746.9   $ 2,561.9   $ 2,318.7    
               
Current Liabilities              
Short-term borrowings $ 0.1   $ 0.3   $ 0.3    
Accounts payable and accrued liabilities   612.6     536.8     463.6    
Operating lease liabilities   19.6     19.6     19.5    
Accrued payroll and related taxes   337.0     293.0     210.7    
Accrued workers’ compensation and other claims   22.0     22.7     25.6    
Income and other taxes   62.6     53.2     71.7    
Total current liabilities   1,053.9     925.6     791.4    
               
Noncurrent Liabilities              
Operating lease liabilities   67.1     67.5     69.9    
Accrued payroll and related taxes   58.5     58.5     38.4    
Accrued workers’ compensation and other claims   40.8     42.2     45.6    
Accrued retirement benefits   214.6     205.8     180.8    
Other long-term liabilities   68.2     59.3     47.0    
Total noncurrent liabilities   449.2     433.3     381.7    
               
Stockholders’ Equity              
Common stock   40.1     40.1     40.1    
Treasury stock   (15.3 )   (17.1 )   (17.3 )  
Paid-in capital   22.3     21.3     20.5    
Earnings invested in the business   1,212.5     1,162.9     1,122.8    
Accumulated other comprehensive income (loss)   (15.8 )   (4.2 )   (20.5 )  
Total stockholders’ equity   1,243.8     1,203.0     1,145.6    
               
Total Liabilities and Stockholders’ Equity $ 2,746.9   $ 2,561.9   $ 2,318.7    
               
STATISTICS:              
Working Capital $ 455.4   $ 624.0   $ 585.8    
Current Ratio   1.4     1.7     1.7    
Debt-to-capital %   0.0   % 0.0   % 0.0   %
Global Days Sales Outstanding   60     64     61    
Year-to-Date Free Cash Flow $ 42.7   $ 170.5   $ 170.4    


KELLY SERVICES, INC. AND SUBSIDIARIES
CONSOLIDATED STATEMENTS OF CASH FLOWS
FOR THE 26 WEEKS ENDED JULY 4, 2021 AND JUNE 28, 2020
(UNAUDITED)
(In millions of dollars)
    2021   2020
Cash flows from operating activities:        
Net earnings (loss) $ 49.6   $ (112.1 )
Adjustments to reconcile net earnings (loss) to net cash from operating activities:        
Goodwill impairment charge       147.7  
Deferred income taxes on goodwill impairment charge       (23.0 )
Depreciation and amortization   14.1     12.0  
Operating lease asset amortization   10.7     10.5  
Provision for credit losses and sales allowances       0.1  
Stock-based compensation   2.8     2.4  
(Gain) loss on investment in Persol Holdings   (36.3 )   48.2  
Gain on sale of assets       (32.1 )
Equity in net (earnings) loss of PersolKelly Pte. Ltd.   (0.6 )   2.8  
Other, net   2.2     0.8  
Changes in operating assets and liabilities, net of acquisitions   5.1     120.8  
         
Net cash from operating activities   47.6     178.1  
         
Cash flows from investing activities:        
Capital expenditures   (4.9 )   (7.7 )
Proceeds from company-owned life insurance   10.4     2.3  
Proceeds from sale of assets       55.5  
Acquisition of companies, net of cash received   (219.0 )   (36.4 )
Proceeds (payments) related to loans with equity affiliate   5.8      
Proceeds from (investment in) equity securities   5.0      
Other investing activities   1.0     (0.4 )
         
Net cash (used in) from investing activities   (201.7 )   13.3  
         
Cash flows from financing activities:        
Net change in short-term borrowings   (0.1 )   (1.4 )
Financing lease payments   (0.3 )   (0.6 )
Payments of tax withholding for stock awards   (0.6 )   (1.1 )
Dividend payments       (3.0 )
Other financing activities       (0.1 )
         
Net cash used in financing activities   (1.0 )   (6.2 )
         
Effect of exchange rates on cash, cash equivalents and restricted cash   (2.3 )   5.7  
         
Net change in cash, cash equivalents and restricted cash   (157.4 )   190.9  
Cash, cash equivalents and restricted cash at beginning of period   228.1     31.0  
         
Cash, cash equivalents and restricted cash at end of period $ 70.7   $ 221.9  


KELLY SERVICES, INC. AND SUBSIDIARIES
REVENUE FROM SERVICES BY GEOGRAPHY
(UNAUDITED)
(In millions of dollars)
                   
    Second Quarter  
                   
            %   CC %  
    2021   2020   Change   Change  
                   
Americas                  
United States $ 894.6   $ 700.1     27.8   % 27.8   %
Canada   39.5     25.6     54.4     36.8    
Mexico   33.1     22.5     47.2     26.2    
Puerto Rico   26.9     20.0     34.3     34.3    
Brazil       6.1     NM   NM  
Total Americas Region   994.1     774.3            
                   
Europe                  
France   57.5     39.9     44.2     31.7    
Switzerland   54.0     47.4     13.8     7.5    
Portugal   40.6     23.8     70.7     55.9    
Russia   33.7     29.3     15.2     17.9    
Italy   19.4     13.3     46.1     33.6    
United Kingdom   17.7     17.8     (0.6 )   (11.8 )  
Germany   8.5     7.1     20.6     10.3    
Ireland   6.3     4.1     53.5     40.2    
Other   17.0     11.5     47.7     32.9    
Total Europe Region   254.7     194.2     31.2     22.3    
                   
Total Asia-Pacific Region   9.3     6.8     34.5     20.9    
                   
Total Kelly Services, Inc. $ 1,258.1   $ 975.3     29.0   % 26.2   %


KELLY SERVICES, INC. AND SUBSIDIARIES
REVENUE FROM SERVICES BY GEOGRAPHY
(UNAUDITED)
(In millions of dollars)
                   
    June Year to Date  
                   
            %   CC %  
    2021   2020   Change   Change  
                   
Americas                  
United States $ 1,753.1   $ 1,628.6     7.6   % 7.6   %
Canada   73.6     58.4     26.0     15.1    
Mexico   67.7     51.2     32.3     25.3    
Puerto Rico   51.1     37.7     35.3     35.3    
Brazil       15.2     NM   NM  
Total Americas Region   1,945.5     1,791.1     8.6     8.1    
                   
Europe                  
France   111.8     92.4     21.0     10.7    
Switzerland   106.7     91.6     16.4     9.6    
Portugal   84.3     67.4     25.1     14.5    
Russia   66.3     61.4     8.1     15.9    
Italy   37.5     28.0     33.9     22.6    
United Kingdom   34.7     40.1     (13.4 )   (21.4 )  
Germany   15.6     15.1     3.6     (5.2 )  
Ireland   11.4     9.1     25.6     14.9    
Other   32.6     26.7     22.1     11.9    
Total Europe Region   500.9     431.8     16.0     9.2    
                   
Total Asia-Pacific Region   17.6     13.5     29.8     16.9    
                   
Total Kelly Services, Inc. $ 2,464.0   $ 2,236.4     10.2   % 8.3   %


KELLY SERVICES, INC. AND SUBSIDIARIES
RECONCILIATION OF NON-GAAP MEASURES
SECOND QUARTER
(UNAUDITED)
(In millions of dollars)
       
  2021   2020
SG&A Expenses: As Reported   Adjusted
Professional & Industrial $ 69.0     $ 64.6  
Science, Engineering & Technology 46.9     31.3  
Education 15.3     9.6  
Outsourcing & Consulting 30.1     25.1  
International 34.6     28.3  
Corporate 21.4     19.4  
Total Company $ 217.3     $ 178.3  


  2021   2020
Earnings (loss) from Operations: As Reported   Adjusted
Professional & Industrial $ 6.2     $ 14.3  
Science, Engineering & Technology 19.6     19.3  
Education 1.5     (5.3 )
Outsourcing & Consulting 4.7     4.1  
International 3.1     (2.1 )
Corporate (21.4 )   (19.4 )
Total Company $ 13.7     $ 10.9  


KELLY SERVICES, INC. AND SUBSIDIARIES
RECONCILIATION OF NON-GAAP MEASURES
SECOND QUARTER
(UNAUDITED)
(In millions of dollars)
           
  2020
SG&A Expenses: As Reported   Restructuring(4)   Adjusted
Professional & Industrial $ 64.6     $     $ 64.6  
Science, Engineering & Technology 31.3         31.3  
Education 9.5     0.1     9.6  
Outsourcing & Consulting 25.1         25.1  
International 28.3         28.3  
Corporate 19.3     0.1     19.4  
Total Company $ 178.1     $ 0.2     $ 178.3  


  2020
Earnings (loss) from Operations: As Reported   Restructuring(4)   Adjusted
Professional & Industrial $ 14.3     $     $ 14.3  
Science, Engineering & Technology 19.3         19.3  
Education (5.2 )   (0.1 )   (5.3 )
Outsourcing & Consulting 4.1         4.1  
International (2.1 )       (2.1 )
Corporate (19.3 )   (0.1 )   (19.4 )
Total Company $ 11.1     $ (0.2 )   $ 10.9  


KELLY SERVICES, INC. AND SUBSIDIARIES
RECONCILIATION OF NON-GAAP MEASURES
JUNE YEAR TO DATE
(UNAUDITED)
(In millions of dollars)
       
  2021   2020
SG&A Expenses: As Reported   Adjusted
Professional & Industrial $ 138.4     $ 140.7  
Science, Engineering & Technology 82.6     67.3  
Education 29.5     25.3  
Outsourcing & Consulting 58.5     53.7  
International 67.7     60.4  
Corporate 43.3     41.7  
Total Company $ 420.0     $ 389.1  


  2021   2020
Earnings (loss) from Operations: As Reported   Adjusted
Professional & Industrial $ 12.7     $ 23.3  
Science, Engineering & Technology 37.1     38.0  
Education 4.5     (0.6 )
Outsourcing & Consulting 7.6     4.3  
International 5.7     0.1  
Corporate (43.3 )   (41.7 )
Total Company $ 24.3     $ 23.4  


KELLY SERVICES, INC. AND SUBSIDIARIES
RECONCILIATION OF NON-GAAP MEASURES
JUNE YEAR TO DATE
(UNAUDITED)
(In millions of dollars)
           
  2020
SG&A Expenses: As Reported   Restructuring(4)   Adjusted
Professional & Industrial $ 145.1     $ (4.4 )   $ 140.7  
Science, Engineering & Technology 67.8     (0.5 )   67.3  
Education 26.1     (0.8 )   25.3  
Outsourcing & Consulting 53.7         53.7  
International 61.5     (1.1 )   60.4  
Corporate 43.4     (1.7 )   41.7  
Total Company $ 397.6     $ (8.5 )   $ 389.1  


  2020
Earnings (loss) from Operations: As Reported   Goodwill
impairment
(1)
  Gain on sale
of assets(3)
  Restructuring(4)   Adjusted
Professional & Industrial $ 18.9     $     $     $ 4.4     $ 23.3  
Science, Engineering & Technology 37.5             0.5     38.0  
Education (1.4 )           0.8     (0.6 )
Outsourcing & Consulting 4.3                 4.3  
International (1.0 )           1.1     0.1  
Corporate (159.0 )   147.7     (32.1 )   1.7     (41.7 )
Total Company $ (100.7 )   $ 147.7     $ (32.1 )   $ 8.5     $ 23.4  


KELLY SERVICES, INC. AND SUBSIDIARIES
RECONCILIATION OF NON-GAAP MEASURES (continued)
(UNAUDITED)
(In millions of dollars except per share data)
                 
                 
    Second Quarter   June Year to Date
    2021   2020   2021   2020
Income tax expense (benefit)   $ (2.6 )   $ 0.9     $ 7.9     $ (35.3 )
Taxes on goodwill impairment charge(1)               23.0  
Taxes on investment in Persol Holdings(2)   (1.9 )   (9.0 )   (11.1 )   14.8  
Taxes on gain on sale of assets(3)               (8.1 )
Taxes on restructuring charges(4)               2.2  
Adjusted income tax expense (benefit)   $ (4.5 )   $ (8.1 )   $ (3.2 )   $ (3.4 )
                 
    Second Quarter   June Year to Date
    2021   2020   2021   2020
Net earnings (loss)   $ 24.0     $ 41.1     $ 49.6     $ (112.1 )
Goodwill impairment charge, net of taxes(1)               124.7  
(Gain) loss on investment in Persol Holdings, net of taxes(2)   (4.4 )   (20.6 )   (25.2 )   33.4  
Gain on sale of assets, net of taxes(3)               (24.0 )
Restructuring charges, net of taxes(4)       (0.2 )       6.3  
Adjusted net earnings   $ 19.6     $ 20.3     $ 24.4     $ 28.3  
                 
    Second Quarter   June Year to Date
    2021   2020   2021   2020
    Per Share   Per Share
Net earnings (loss)   $ 0.60     $ 1.04     $ 1.25     $ (2.86 )
Goodwill impairment charge, net of taxes(1)               3.18  
(Gain) loss on investment in Persol Holdings, net of taxes(2)   (0.11 )   (0.52 )   (0.63 )   0.85  
Gain on sale of assets, net of taxes(3)               (0.61 )
Restructuring charges, net of taxes(4)               0.16  
Adjusted net earnings   $ 0.49     $ 0.51     $ 0.61     $ 0.72  

Note: Earnings per share amounts for each quarter are required to be computed independently and may not equal the amounts computed for the total year.


KELLY SERVICES, INC. AND SUBSIDIARIES
RECONCILIATION OF NON-GAAP MEASURES (continued)
(UNAUDITED)
(In millions of dollars)
               
  Second Quarter   June Year to Date
  2021   2020   2021   2020
Net earnings (loss) $ 24.0       $ 41.1       $ 49.6       $ (112.1 )  
Other (income) expense, net 0.3       (2.6 )     3.7       (4.3 )  
Income tax expense (benefit) (2.6 )     0.9       7.9       (35.3 )  
Depreciation and amortization 8.5       6.0       14.8       12.0    
EBITDA 30.2       45.4       76.0       (139.7 )  
Equity in net (earnings) loss of affiliate (1.7 )     1.3       (0.6 )     2.8    
Goodwill impairment charge(1)                   147.7    
(Gain) loss on investment in Persol Holdings(2) (6.3 )     (29.6 )     (36.3 )     48.2    
Gain on sale of assets(3)                   (32.1 )  
Restructuring(4)       (0.2 )           8.5    
Adjusted EBITDA $ 22.2       $ 16.9       $ 39.1       $ 35.4    
Adjusted EBITDA margin 1.8   %   1.7   %   1.6   %   1.6   %


KELLY SERVICES, INC. AND SUBSIDIARIES
RECONCILIATION OF NON-GAAP MEASURES
(UNAUDITED)

Management believes that the non-GAAP (Generally Accepted Accounting Principles) information excluding the 2020 goodwill impairment charge, the 2021 and 2020 gains and losses on the investment in Persol Holdings, the 2020 gain on sale of assets and the 2020 restructuring charges, are useful to understand the Company’s fiscal 2021 financial performance and increases comparability. Specifically, Management believes that removing the impact of these items allows for a meaningful comparison of current period operating performance with the operating results of prior periods. Management also believes that such measures are used by those analyzing performance of companies in the staffing industry to compare current performance to prior periods and to assess future performance.

Management uses Adjusted EBITDA (adjusted earnings before interest, taxes, depreciation and amortization) and Adjusted EBITDA Margin (percent of total GAAP revenue) which Management believes is useful to compare operating performance compared to prior periods and uses it in conjunction with GAAP measures to assess performance. Our calculation of Adjusted EBITDA may not be consistent with similarly titled measures of other companies and should be used in conjunction with GAAP measurements.

These non-GAAP measures may have limitations as analytical tools because they exclude items which can have a material impact on cash flow and earnings per share. As a result, Management considers these measures, along with reported results, when it reviews and evaluates the Company’s financial performance. Management believes that these measures provide greater transparency to investors and provide insight into how Management is evaluating the Company’s financial performance. Non-GAAP measures should not be considered a substitute for, or superior to, measures of financial performance prepared in accordance with GAAP.

(1) The goodwill impairment charge is the result of an interim impairment test the Company performed during the first quarter of 2020, due to a triggering event caused by a decline in the Company’s common stock price.

(2) The gains and losses on the investment in Persol Holdings represent the change in fair value of the investment during the period presented and the related tax expense and benefit.

(3) Gain on sale of assets in 2020 primarily represents the excess of the proceeds over the cost of the headquarters properties sold during the first quarter of 2020.

(4) Restructuring charges in 2020 represent severance costs and lease terminations in preparation for the new operating model adopted in the third quarter of 2020.

CoreCivic Inc. (CXW) – Post Call Follow Up and Updated Models

Wednesday, August 11, 2021

CoreCivic, Inc. (CXW)
Post Call Follow Up and Updated Models

CoreCivic is a diversified government solutions company with the scale and experience needed to solve tough government challenges in flexible, cost-effective ways. We provide a broad range of solutions to government partners that serve the public good through corrections and detention management, a growing network of residential reentry centers to help address America’s recidivism crisis, and government real estate solutions. We are a publicly traded real estate investment trust and the nation’s largest owner of partnership correctional, detention and residential reentry facilities. We also believe we are the largest private owner of real estate used by U.S. government agencies. The Company has been a flexible and dependable partner for government for more than 35 years. Our employees are driven by a deep sense of service, high standards of professionalism and a responsibility to help government better the public good.

Joe Gomes, Senior Research Analyst, Noble Capital Markets, Inc.

Refer to the full report for the price target, fundamental analysis, and rating.

    ICE Populations and Revenue Climbing. ICE populations at CoreCivic have roughly doubled since the beginning of the year. We would note that revenue derived from ICE in the second quarter was $139.6 million, up from $135.7 million in the same period last year, and up from $131.5 million in the first quarter. Management stated that ICE populations overall remained about 2,200 below the contract minimums, although this is down from 3,200 at the end of the first quarter.

    Safety Segment Improving.  Safety segment revenue declined modestly to $419.9 million from $424.1 million. Safety’s facility net operating income, however, increased to $112.6 million from $100.4 million during the second quarter of 2020. Increased per diem rates and lower COVID related operating expenses drove the improvement. Revenue per compensated man day rose to $90.88 in the quarter, up from …


This Company Sponsored Research is provided by Noble Capital Markets, Inc., a FINRA and S.E.C. registered broker-dealer (B/D).

*Analyst certification and important disclosures included in the full report. NOTE: investment decisions should not be based upon the content of this research summary.  Proper due diligence is required before making any investment decision. 

Release – PLBY Group Closes Previously Announced Acquisition of Honey Birdette


PLBY Group Closes Previously Announced Acquisition of Honey Birdette


LOS ANGELES, Aug. 10, 2021 (GLOBE NEWSWIRE) — PLBY Group, Inc. (NASDAQ: PLBY) (“PLBY Group” or the “Company”), a leading pleasure and leisure lifestyle company and owner of Playboy, one of the most recognizable and iconic brands in the world, today announced the completion of its previously announced deal to acquire Australia-based Honey Birdette, the fast-growing, luxury lingerie and lifestyle brand.

The acquisition of 100% of the equity of Honey Birdette was completed for consideration of $235 million in cash and 2.16 million shares of PLBY Group stock. Honey Birdette generated $71 million of revenue and $17.6 million of net income for the twelve months ended June 30, 2021, representing growth of over 42% and 187%, respectively, over the prior year period.

Ben Kohn, Chief Executive Officer of PLBY Group, commented, “We are thrilled to officially welcome the Honey Birdette team to PLBY Group. This transaction will play a key role in the acceleration of our company’s expansion into new territories and product categories, specifically bolstering product design, sourcing and direct-to-consumer capabilities across our lingerie, loungewear, swimwear, sexual wellness and essentials collections. We see enormous organic growth prospects for both the Honey Birdette brand and the new Playboy-branded female focused lifestyle collections we will bring to market powered by Honey Birdette’s superior infrastructure.”

Eloise Monaghan, Founder and Managing Director of Honey Birdette, commented, “Today is a proud day for us as we officially join forces with one of the world’s most iconic brands and the lifestyle platform it represents. PLBY Group’s commitment to sexual wellness and female empowerment is everything that Honey Birdette embraces, and this partnership will help transform the company into one of the leading global lingerie and lifestyle platforms.”

About PLBY Group, Inc.

PLBY Group, Inc. connects consumers around the world with products, services, and experiences to help them look good, feel good, and have fun. PLBY Group serves consumers in four major categories: Sexual Wellness, Style & Apparel, Gaming & Lifestyle, and Beauty & Grooming. PLBY Group’s flagship consumer brand, Playboy, is one of the most recognizable, iconic brands in the world, driving billions of dollars in global consumer spending annually across approximately 180 countries. Learn more at http://www.plbygroup.com.

Forward-Looking Statements

This press release includes “forward-looking statements” within the meaning of the “safe harbor” provisions of the United States Private Securities Litigation Reform Act of 1995. The Company’s actual results may differ from their expectations, estimates, and projections and, consequently, you should not rely on these forward-looking statements as predictions of future events. Words such as “expect,” “estimate,” “project,” “budget,” “forecast,” “anticipate,” “intend,” “plan,” “may,” “will,” “could,” “should,” “believes,” “predicts,” “potential,” “continue,” and similar expressions (or the negative versions of such words or expressions) are intended to identify such forward-looking statements. These forward-looking statements include, without limitation, the Company’s expectations with respect to future performance, growth plans and anticipated financial impacts of its acquisitions.

These forward-looking statements involve significant risks and uncertainties that could cause the actual results to differ materially from those discussed in the forward-looking statements. Factors that may cause such differences include, but are not limited to: (1) the impact of the COVID-19 pandemic on the Company’s business and acquisitions; (2) the inability to maintain the listing of the Company’s shares of common stock on Nasdaq; (3) the risk that the business combination, recent acquisitions or any proposed transactions disrupt the Company’s current plans and/or operations, including the risk that the Company does not complete any such proposed transactions or achieve the expected benefits from them; (4) the ability to recognize the anticipated benefits of the business combination, acquisitions, commercial collaborations, commercialization of digital assets and proposed transactions, which may be affected by, among other things, competition, the ability of the Company to grow and manage growth profitably, and retain its key employees; (5) costs related to being a public company, acquisitions, commercial collaborations and proposed transactions; (6) changes in applicable laws or regulations; (7) the possibility that the Company may be adversely affected by other economic, business, and/or competitive factors; (8) risks relating to the uncertainty of the projected financial information of the Company; (9) risks related to the organic and inorganic growth of the Company’s business and the timing of expected business milestones; and (10) other risks and uncertainties indicated from time to time in the Company’s annual report on Form 10-K, including those under “Risk Factors” therein, and in the Company’s other filings with the Securities and Exchange Commission. The Company cautions that the foregoing list of factors is not exclusive, and readers should not place undue reliance upon any forward-looking statements, which speak only as of the date which they were made. The Company does not undertake any obligation to update or revise any forward-looking statements to reflect any change in its expectations or any change in events, conditions, or circumstances on which any such statement is based.

Contact:

Investors: investors@plbygroup.com
Media: press@plbygroup.com

Release – PLBY Group Reports Second Quarter 2021 Financial Results


PLBY Group Reports Second Quarter 2021 Financial Results


Second Quarter 2021 Revenue Grew 44% Year-Over-Year to $49.9 Million

LOS ANGELES, Aug. 10, 2021 (GLOBE NEWSWIRE) — PLBY Group, Inc. (NASDAQ: PLBY) (“PLBY Group” or the “Company”), a leading pleasure and leisure lifestyle company and owner of Playboy, one of the most recognizable and iconic brands in the world, today provided financial results for the second quarter ended June 30, 2021.

Ben Kohn, Chief Executive Officer of PLBY Group, stated, “We are pleased to report another successful quarter that demonstrates the powerful combination of our growing direct-to-consumer business, an optimized licensing operation and scalable digital offerings. On the direct-to-consumer side, we saw great traction on Playboy.com with expanded merchandise offerings and strategic influencer marketing. In addition, the second quarter marked continued strong performance in our licensing business and our entry into blockchain-powered offerings with our first NFT collection.”

Mr. Kohn continued, “We are also very excited by our acquisition of Honey Birdette, the fast-growing, luxury lingerie and lifestyle brand. We are eager to integrate Honey Birdette’s operations into our direct-to-consumer infrastructure and to help accelerate the high-end brand’s growth in new regions. The Honey Birdette team brings immense experience in product design, sourcing and direct-to-consumer strategies that will contribute to our work building the leading global pleasure and leisure lifestyle platform.”

Second Quarter 2021 Financial Highlights

  • Revenue grew 44% year-over-year, to $49.9 million, driven by growth in both direct-to-consumer and licensing revenues.
  • Direct-to-consumer revenue grew 88% year-over-year, to $28.0 million, and licensing revenue grew 12% year-over-year, to $15.4 million.
  • Net loss was $8.9 million, largely driven by $7.9 million of non-recurring expenses related to the acquisition of Honey Birdette, refinancing of debt, and amortization of a one-time non-cash inventory valuation step-up as part of the purchase accounting resulting from the acquisition of Lovers in March 2021.
  • Adjusted EBITDA was $5.9 million and was impacted by a full quarter of public company expenses, in addition to technology investments being made to provide a superior and unified direct-to-consumer experience.

Webcast Details
The Company will host a webcast at 5:00 p.m. Eastern Time today to discuss the second quarter 2021 financial results. Participants may access the live webcast on the events section of the PLBY Group, Inc. Investor Relations website at https://www.plbygroup.com/investors/events-and-presentations.

About PLBY Group, Inc.
PLBY Group connects consumers around the world with products, services, and experiences to help them look good, feel good, and have fun. PLBY Group serves consumers in four major categories: Sexual Wellness, Style & Apparel, Gaming & Lifestyle, and Beauty & Grooming. PLBY Group’s flagship consumer brand, Playboy, is one of the most recognizable, iconic brands in the world, driving billions of dollars in consumer spending annually across approximately 180 countries. Learn more at http://www.plbygroup.com.

Forward-Looking Statements
This press release includes “forward-looking statements” within the meaning of the “safe harbor” provisions of the United States Private Securities Litigation Reform Act of 1995. The Company’s actual results may differ from their expectations, estimates, and projections and, consequently, you should not rely on these forward-looking statements as predictions of future events. Words such as “expect,” “estimate,” “project,” “budget,” “forecast,” “anticipate,” “intend,” “plan,” “may,” “will,” “could,” “should,” “believes,” “predicts,” “potential,” “continue,” and similar expressions (or the negative versions of such words or expressions) are intended to identify such forward-looking statements. These forward-looking statements include, without limitation, the Company’s expectations with respect to future performance, growth plans and anticipated financial impacts of its acquisitions.

These forward-looking statements involve significant risks and uncertainties that could cause the actual results to differ materially from those discussed in the forward-looking statements. Factors that may cause such differences include, but are not limited to: (1) the impact of the COVID-19 pandemic on the Company’s business and acquisitions; (2) the inability to maintain the listing of the Company’s shares of common stock on Nasdaq; (3) the risk that the business combination, recent acquisitions or any proposed transactions disrupt the Company’s current plans and/or operations, including the risk that the Company does not complete any such proposed transactions or achieve the expected benefits from them; (4) the ability to recognize the anticipated benefits of the business combination, acquisitions, commercial collaborations, commercialization of digital assets and proposed transactions, which may be affected by, among other things, competition, the ability of the Company to grow and manage growth profitably, and retain its key employees; (5) costs related to being a public company, acquisitions, commercial collaborations and proposed transactions; (6) changes in applicable laws or regulations; (7) the possibility that the Company may be adversely affected by other economic, business, and/or competitive factors; (8) risks relating to the uncertainty of the projected financial information of the Company; (9) risks related to the organic and inorganic growth of the Company’s business and the timing of expected business milestones; and (10) other risks and uncertainties indicated from time to time in the Company’s annual report on Form 10-K, including those under “Risk Factors” therein, and in the Company’s other filings with the Securities and Exchange Commission. The Company cautions that the foregoing list of factors is not exclusive, and readers should not place undue reliance upon any forward-looking statements, which speak only as of the date which they were made. The Company does not undertake any obligation to update or revise any forward-looking statements to reflect any change in its expectations or any change in events, conditions, or circumstances on which any such statement is based.

Contact:

Investors: investors@plbygroup.com
Media: press@plbygroup.com


PLBY Group, Inc.        
Condensed Consolidated Statements of Operations
(Unaudited)
(in thousands)

  Three Months Ended
June 30,
  Six Months Ended
June 30,
  2021   2020   2021   2020
Net revenues $ 49,851     $ 34,557     $ 92,531     $ 66,331  
Costs and expenses              
Cost of sales (23,675 )   (19,096 )   (42,699 )   (35,648 )
Selling and administrative expenses (29,615 )   (13,277 )   (57,561 )   (25,727 )
Related party expenses     (250 )   (250 )   (500 )
Total costs and expenses (53,290 )   (32,623 )   (100,510 )   (61,875 )
Operating (loss) income (3,439 )   1,934     (7,979 )   4,456  
Nonoperating income (expense):              
Interest expense (2,253 )   (3,314 )   (5,550 )   (6,656 )
Loss on extinguishment of debt (1,217 )       (1,217 )    
Other (expense) income, net (3 )   42     742     29  
Total nonoperating expense (3,473 )   (3,272 )   (6,025 )   (6,627 )
Loss before income taxes (6,912 )   (1,338 )   (14,004 )   (2,171 )
Benefit (expense) from income taxes (2,003 )   (2,278 )   91     (3,854 )
Net loss (8,915 )   (3,616 )   (13,913 )   (6,025 )
Net loss attributable to redeemable noncontrolling interest              
Net loss attributable to PLBY Group, Inc. $ (8,915 )   $ (3,616 )   $ (13,913 )   $ (6,025 )
Net loss per share, basic and diluted $ (0.24 )   $ (0.16 )   $ (0.42 )   $ (0.27 )
Weighted-average shares used in computing net loss per share, basic and diluted 36,736,446     22,199,098     33,298,957     22,093,444  


PLBY Group, Inc.
Condensed Consolidated Balance Sheets
(in thousands, except share and per share amounts)

  June 30,
2021
  December 31,
2020
  (Unaudited)    
Assets      
Current assets:      
Cash and cash equivalents $ 255,529       $ 13,430    
Restricted cash       2,130    
Receivables, net of allowance for doubtful accounts 6,770       6,601    
Inventories, net 18,263       11,788    
Stock receivable       4,445    
Prepaid expenses and other current assets 14,215       8,822    
Total current assets 294,777       47,216    
Restricted cash 2,130          
Property and equipment, net 20,925       5,203    
Intangible assets, net 342,812       339,032    
Goodwill 16,814       504    
Contract assets, net of current portion 14,667       7,159    
Other noncurrent assets 12,658       13,013    
Total assets $ 704,783       $ 412,127    
Liabilities and Stockholders’ Equity      
Current liabilities:      
Accounts payable $ 15,467       $ 8,678    
Accrued salaries, wages, and employee benefits 2,377       4,870    
Deferred revenues, current portion 10,644       11,159    
Long-term debt, current portion 2,093       4,470    
Convertible promissory notes       6,230    
Other current liabilities and accrued expenses 19,359       18,556    
Total current liabilities 49,940       53,963    
Deferred revenues, net of current portion 42,891       43,792    
Long-term debt, net of current portion 159,438       154,230    
Deferred tax liabilities, net 73,797       74,909    
Other noncurrent liabilities 5,160       2,422    
Total liabilities 331,226       329,316    
Commitments and contingencies (Note 13)      
Redeemable noncontrolling interest (208 )     (208 )  
Stockholders’ equity:      
Common stock, $0.0001 par value per share, 150,000,000 shares authorized, 39,228,956 shares issued and 38,528,956 shares outstanding as of June 30, 2021; 20,626,249 shares issued and outstanding as of December 31, 2020 4       2    
Treasury stock, at cost, 700,000 shares and 0 shares as of June 30, 2021 and December 31, 2020 (4,445 )        
Additional paid-in capital 470,134       161,033    
Accumulated deficit (91,928 )     (78,016 )  
Total stockholders’ equity 373,765       83,019    
Total liabilities, redeemable noncontrolling interest, and stockholders’ equity $ 704,783       $ 412,127    

EBITDA Reconciliation

This release presents the financial measure earnings before interest, taxes, depreciation and amortization, or “EBITDA”, and Adjusted EBITDA, which are not financial measures under the accounting principles generally accepted in the United States of America (“GAAP”). “EBITDA” is defined as net income or loss before interest, income tax expense or benefit, and depreciation and amortization. “Adjusted EBITDA” is defined as EBITDA adjusted for stock-based compensation and other special items determined by management. Adjusted EBITDA is intended as a supplemental measure of our performance that is neither required by, nor presented in accordance with, GAAP. We believe that the use of EBITDA and Adjusted EBITDA provides an additional tool for investors to use in evaluating ongoing operating results and trends and in comparing our financial measures with those of comparable companies, which may present similar non-GAAP financial measures to investors. However, investors should be aware that when evaluating EBITDA and Adjusted EBITDA, we may incur future expenses similar to those excluded when calculating these measures. In addition, our presentation of these measures should not be construed as an inference that our future results will be unaffected by unusual or nonrecurring items. Our computation of Adjusted EBITDA may not be comparable to other similarly titled measures computed by other companies, because all companies may not calculate Adjusted EBITDA in the same fashion.

In addition to adjusting for non-cash stock-based compensation, we typically adjust for nonoperating expenses and income, such as management fees paid to our largest stockholder, merger related bonus payments, non-recurring special projects including the implementation of internal controls, expenses associated with financing activities, acquisition related inventory step-up amortization and costs, the expense associated with reorganization and severance resulting in the elimination or rightsizing of specific business activities or operations as we transform from a print and digital media business to a commerce centric business.

Because of these limitations, EBITDA and Adjusted EBITDA should not be considered in isolation or as a substitute for performance measures calculated in accordance with GAAP. We compensate for these limitations by relying primarily on our GAAP results and using EBITDA and Adjusted EBITDA on a supplemental basis. Investors should review the reconciliation of net loss to EBITDA and Adjusted EBITDA below and not rely on any single financial measure to evaluate our business.

The following table reconciles the Company’s net loss to EBITDA and Adjusted EBITDA:


GAAP Net Loss to Adjusted EBITDA Reconciliation
(Unaudited)
(in thousands)

  Three Months Ended June 30,   Six Months Ended June 30,
  2021   2020   2021   2020
Net loss $ (8,915 )   $ (3,616 )   $ (13,913 )   $ (6,025 )
Adjusted for:              
Interest expense 2,253     3,314     5,550     6,656  
Loss on extinguishment of debt 1,217         1,217      
Provision for income taxes 2,003     2,278     (91 )   3,854  
Depreciation and amortization 1,034     533     1,762     1,174  
EBITDA (2,408 )   2,509     (5,475 )   5,659  
Adjusted for:              
Stock-based compensation 361     1,345     3,859     2,094  
Reduction in force expenses     1,780         2,777  
Nonrecurring items 1,460     117     7,500     117  
Amortization of inventory step-up 2,250     1,615     2,250     3,230  
Management fees and expenses     250     250     500  
Nonoperating expenses     44         102  
Acquisition related costs 4,218         4,218      
Adjusted EBITDA $ 5,881     $ 7,660     $ 12,602     $ 14,479