Release – Onconova Therapeutics Reports Second Quarter 2021 Financial Results And Provides Business Update


Onconova Therapeutics Reports Second Quarter 2021 Financial Results And Provides Business Update


Conference call and live webcast at 4:30 p.m. ET today

NEWTOWN, Pa., Aug. 12, 2021 (GLOBE NEWSWIRE) — Onconova Therapeutics, Inc. (NASDAQ: ONTX) (“Onconova”), a clinical-stage biopharmaceutical company focused on discovering and developing novel products for patients with cancer, today announced financial results for the three months ended June 30, 2021 and provided a business update.

Highlights for the second quarter of 2021 and subsequent weeks include:

  • Enrollment in the first cohort of the Phase 1 solid tumor study of ON 123300 in the United States is complete with no dose limiting toxicities (DLT’s) observed. The second cohort is currently open for enrollment.
  • The Phase 1 solid tumor study of ON 123300 in China is ongoing with no DLT’s observed to date. The study is currently enrolling the third dose cohort.
  • The investigator-initiated Phase 1/2 study evaluating rigosertib in combination with the checkpoint inhibitor nivolumab in KRAS mutated non-small cell lung cancer (NSCLC) continues to progress. Initial data from the trial provide preliminary evidence of the anti-cancer activity of rigosertib-nivolumab combination therapy in patients who had previously failed all standard of care treatment, including checkpoint inhibition, and show that the maximum tolerated dose of rigosertib in combination with nivolumab was not yet determined in the three cohorts of the trial’s dose-escalation phase.
  • The first patient was dosed in an investigator-initiated Phase 2 study designed to assess the efficacy and safety of rigosertib in patients with recessive dystrophic epidermolysis bullosa (RDEB)-associated locally advanced/metastatic squamous cell carcinoma (SCC), an ultra-rare and invariably fatal condition.
  • The Company strengthened its management team with the appointment of Mark Gelder, M.D., as Chief Medical Officer.
  • Preclinical data published in the peer-reviewed journal Molecular Cancer show that rigosertib synergistically enhanced the efficacy of immune checkpoint blockade in a murine melanoma model via the induction of immune-mediated cancer cell death, supporting the continued clinical evaluation of rigosertib in combination with checkpoint inhibitors.

Management Commentary

“During the second quarter we achieved key clinical and corporate milestones,” said Steven M. Fruchtman, M.D., President and Chief Executive Officer of Onconova. “In our lead ON 123300 program, we initiated our U.S. Phase 1 study and recently opened enrollment to the second cohort, and our partner, HanX Biopharmaceuticals, is currently enrolling to the third dose cohort of the complementary Phase 1 study underway in China. Through these trials, which are evaluating different dosing administration regimens, we aim to inform the design of a future Phase 2 basket trial evaluating ON 123300 in multiple high unmet need indications, including CDK 4/6 inhibitor refractory HR+ HER2- metastatic breast cancer. Given ON 123300’s ability in preclinical studies to overcome resistance to the most widely prescribed CDK 4/6 inhibitor, we believe this novel multi-kinase inhibitor has the potential to be a best-in-class therapy for this and other cancers.”

Dr. Fruchtman continued, “Beyond our lead program, we also reported very encouraging preliminary results from the investigator-initiated study evaluating rigosertib plus nivolumab in advanced KRAS-mutated NSCLC. These results highlighted the doublet’s favorable safety profile and provided preliminary evidence of efficacy in an extremely challenging patient population. Additional preliminary data from the trial is expected to be presented at a RAS-focused medical meeting in September. Looking forward, we will continue to leverage investigator-initiated programs to further rigosertib’s clinical development, while maintaining our primary focus and resources on ON 123300. Milestones ahead for the remainder of the year include continued progress of our ON 123300 clinical trials, expansion of rigosertib investigator-initiated studies program, and potentially acquiring new assets to augment our pipeline. With a strong financial position and a talented management team that was recently bolstered by the appointment of Dr. Mark Gelder as CMO, we believe we are well positioned to take advantage of the product development opportunities presented.”

Second Quarter Financial Results

Cash and cash equivalents as of June 30, 2021 were $43.7 million, compared with $19.0 million as of December 31, 2020. The Company believes that its cash and cash equivalents will be sufficient to fund ongoing clinical trials and business operations for more than eighteen months.

Research and development expenses were $1.9 million for the second quarter of 2021, compared with $4.8 million for the second quarter of 2020. The decrease was primarily related to higher clinical trial and consulting expenses in the 2020 period due to the INSPIRE study.

General and administrative expenses were $2.9 million for the second quarter of 2021, compared with $2.6 million for the second quarter of 2020. The increase was primarily due to expenses related to special meetings by proxy in the 2021 period.

Net loss for the second quarter of 2021 was $4.2 million, or $0.27 per share on 15.8 million weighted average shares outstanding, compared with a net loss for the second quarter of 2020 of $7.4 million, or $0.65 per share on 11.3 million weighted average shares outstanding.

Conference Call and Webcast

Onconova will host an investment community conference call today beginning at 4:30 p.m. Eastern Time, during which management will discuss financial results for the second quarter of 2021, provide a business update and answer questions. Interested parties can participate by dialing (855) 428-5741 (domestic callers) or (210) 229-8823 (international callers) and using conference ID 3876025.

A live webcast of the conference call will be available in the Investors & Media section of the Company’s website at www.onconova.com. A replay of the webcast will be available on the Onconova website for 90 days following the call.

About Onconova Therapeutics, Inc.
Onconova Therapeutics is a clinical-stage biopharmaceutical company focused on discovering and developing novel products for patients with cancer. The Company has proprietary targeted anti-cancer agents designed to disrupt specific cellular pathways that are important for cancer cell proliferation.

Onconova’s novel, proprietary multi-kinase inhibitor ON 123300 is being evaluated in two separate and complementary Phase 1 dose-escalation and expansion studies. These trials are currently underway in the United States and China.

Onconova’s product candidate rigosertib is being studied in an investigator-initiated study program, including in a dose-escalation and expansion Phase 1/2a investigator-initiated study targeting patients with KRAS+ non-small cell lung cancer with oral rigosertib in combination with nivolumab.

For more information, please visit www.onconova.com.

Forward-Looking Statements
Some of the statements in this release are forward-looking statements within the meaning of Section 27A of the Securities Act of 1933, as amended, Section 21E of the Securities Exchange Act of 1934, as amended, and the Private Securities Litigation Reform Act of 1995, and involve risks and uncertainties. These statements relate to Onconova’s expectations regarding the timing of Onconova’s and investigator-initiated clinical development and data presentation plans, and the mechanisms and indications for Onconova’s product candidates. Onconova has attempted to identify forward-looking statements by terminology including “believes,” “estimates,” “anticipates,” “expects,” “plans,” “intends,” “may,” “could,” “might,” “will,” “should,” “preliminary,” “approximately” or other words that convey uncertainty of future events or outcomes. Although Onconova believes that the expectations reflected in such forward-looking statements are reasonable as of the date made, expectations may prove to have been materially different from the results expressed or implied by such forward-looking statements. These statements are only predictions and involve known and unknown risks, uncertainties, and other factors, including the success and timing of Onconova’s clinical trials, investigator-initiated trials and regulatory agency and institutional review board approvals of protocols, Onconova’s collaborations, the timing of the Company’s annual stockholder meeting, market conditions and those discussed under the heading “Risk Factors” in Onconova’s most recent Annual Report on Form 10-K and quarterly reports on Form 10-Q. Any forward-looking statements contained in this release speak only as of its date. Onconova undertakes no obligation to update any forward-looking statements contained in this release to reflect events or circumstances occurring after its date or to reflect the occurrence of unanticipated events.

Company Contact:
Avi Oler
Onconova Therapeutics, Inc.
267-759-3680
ir@onconova.us
https://www.onconova.com/contact/

Investor Contact:
Bruce Mackle
LifeSci Advisors, LLC
646-889-1200
bmackle@lifesciadvisors.com


(Tables to follow)


ONCONOVA THERAPEUTICS, INC.   
 
Condensed Consolidated Balance Sheets   
 
(in thousands)   
  June 30,   December 31,
    2021       2020  
Assets (unaudited)    
Current assets:      
    Cash and cash equivalents $ 43,709     $ 19,025  
    Receivables   27       37  
    Prepaid expenses and other current assets   457       722  
        Total current assets   44,193       19,784  
Property and equipment, net   45       52  
Other non-current assets   140       150  
Total assets $ 44,378     $ 19,986  
       
Liabilities and stockholders’ equity      
Current liabilities:      
    Accounts payable $ 4,290     $ 4,833  
    Accrued expenses and other current liabilities   2,983       4,962  
    Deferred revenue   226       226  
        Total current liabilities   7,499       10,021  
Warrant liability   530       321  
Deferred revenue, non-current   3,356       3,469  
Total liabilities   11,385       13,811  
       
Stockholders’ equity:      
    Preferred stock          
    Common stock   158       124  
    Additional paid in capital   470,335       434,593  
    Accumulated other comprehensive income   2       14  
    Accumulated deficit   (437,502 )     (428,556 )
Total stockholders’ equity   32,993       6,175  
Total liabilities and stockholders’ equity $ 44,378     $ 19,986  


 ONCONOVA THERAPEUTICS, INC.  
 
 Condensed Consolidated Statements of Operations (unaudited)
 
 (in thousands, except share and per share amounts) 
               
  Three Months Ended June 30,   Six months months ended June 30,
    2021       2020       2021       2020  
               
Revenue $ 57     $ 56     $ 113     $ 108  
Operating expenses:              
    General and administrative   2,850       2,594       5,067       4,401  
    Research and development   1,852       4,801       3,789       8,171  
        Total operating expenses   4,702       7,395       8,856       12,572  
Loss from operations   (4,645 )     (7,339 )     (8,743 )     (12,464 )
               
Change in fair value of warrant liability   427       (56 )     (209 )     (119 )
Other (loss) income, net   (13 )           6       96  
Net loss   (4,231 )     (7,395 )     (8,946 )     (12,487 )
Net loss per share of common stock, basic and diluted $ (0.27 )   $ (0.65 )   $ (0.59 )   $ (1.14 )
Basic and diluted weighted average shares outstanding   15,780,863       11,303,508       15,201,719       10,996,624  

Debt Limit Debates Impact on Stocks and U.S. Credit Ratings


Debt Ceiling Season’s Impact on Stocks and U.S. Credit Ratings


The debt ceiling wrestling match and the U.S. Treasury’s inability to meet the responsibilities of the U.S. Government are likely to cause higher market volatility in the coming months. The suspension of debt limits has just expired, this kicks off the 2021 season, and a note from Janet Yellen is about to make a lot of people concerned.

The debt ceiling (statutory debt limit) is the maximum amount of debt the United States can have outstanding in Treasury debt.  The limit had been suspended in March of 2020 to keep the economy afloat by raising money through debt for businesses and individuals. The suspension was not indefinite and has recently expired.


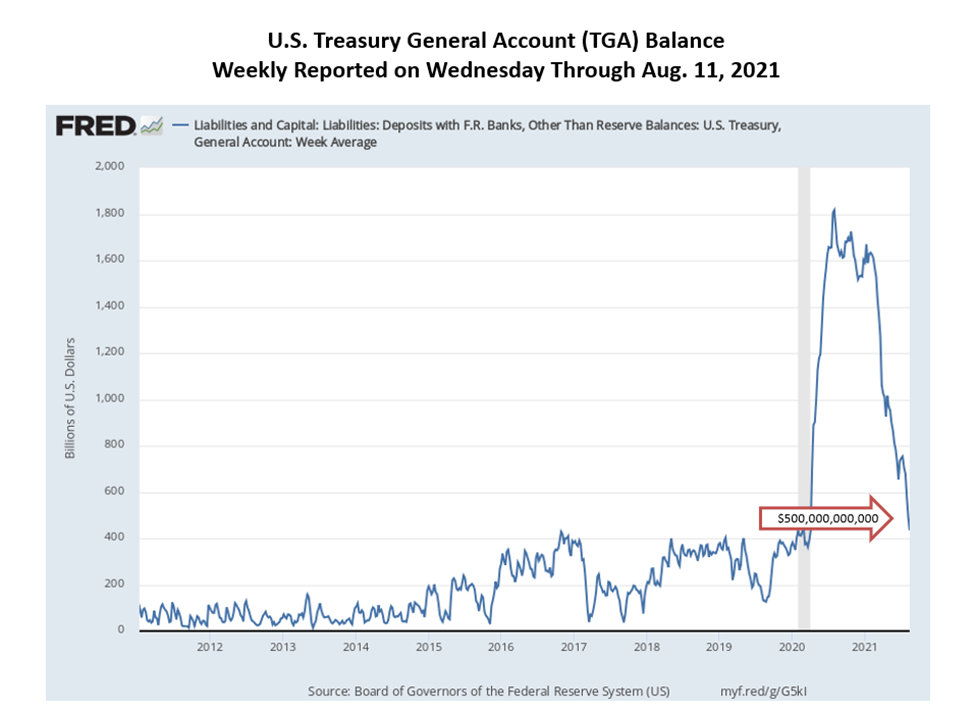
The balance in the Treasury General Account (TGA), which is effectively the checking account for bill paying by the US government, has plunged from $1 trillion at the end of April, to $435 billion this week (August 12). This steep plunge in altitude was required to comply with the end of the statutes’ hiatus. In January, the Secretary of the Treasury Yellen said it would draw down the TGA from its then level of $1.6 trillion to $500 billion by this summer. On August 1, the existing debt ceiling became effective. According to the letter Yellen wrote to the House Speaker and Senate leaders there are immediate expenses that won’t be able to get paid. 

In this letter to Congress concerning the US meeting entitlement obligations, Yellen spelled out to Congress some “extraordinary measures,” the Treasury will take to keep the US from defaulting. The three large government-funded retirement systems topped her list:

-The Civil Service Retirement and Disability Fund

-The Postal Service Retiree Health Benefits Fund.

-The Government Securities Investment Fund (G Fund) of the Thrift Savings Fund that are part of the Federal Employees’ Retirement System.

All entitlements above are required by law to be (eventually) funded and are expected to be made whole as money becomes available by Congress hiking the amount of debt the Treasury can borrow by issuing US Treasury obligations.

If the debt ceiling is not raised by Congress, (or taxes hiked and budgets slashed), this list will grow. At some point, if money isn’t made available there will be concern that the US Treasury won’t be able to meet its debt payments. This will draw a reaction by rating agencies and investors.  For example, in August of 2011, the rating agency S&P cut the U.S. credit rating to AA+ and maintained a negative outlook. With the ratings change S&P analysts cited concerns of growing budget deficits. Rating downgrades typically cause investors (lenders) to seek higher interest rates for their new perceived risk.

Rating Agencies

Fitch, a Nationally Recognized Statistical Rating Organization (NRSRO), placed the US’s credit rating on negative outlook in July of 2020. Last month while reaffirming its AAA rating Fitch expressed heightened concern of financial activity they say will push the country further from a stabilized debt burden. The NRSRO said the US could be downgraded without a plan to balance debt and spending “in the post-pandemic phase.”

In June, Moody’s expressed its views about the US debt burden. “While the coronavirus pandemic has created unprecedented challenges for the US economy and exacerbated the pace of deterioration of the government’s fiscal position, Moody’s expects the US economy to recover over time and the sovereign’s credit profile to remain resilient to the shock,”

S&P, the third NRSRO covering US debt has a stable outlook on its AA+ rating. This maintained level is based on the dollar’s reserve status and institutional strengths, as well as the credibility of the Federal Reserve.


Looking Toward History for Guidance on Debt

The current year may not follow the pattern of other years as there have been many new and inventive financial strategies the US has taken to achieve goals over the past 18 months. However, this is what has generally happened each year over the decades (the statutory debt ceiling was enacted in 1917). 

Since 1960, each time the debt ceiling needed to be raised by Congress to pay bills required by Congress, those involved in working out the solution let the activity go down to the wire thereby creating an emergency situation. Defaulting on Treasury debt would topple world bond and equity markets while likely strengthening some commodities like gold and silver. Each time this has happened concessions were made, the debt ceiling was either raised or extended (or suspended), and we moved on until the following year when debt ceiling season.

Take-Away

Debt ceiling season this year has all the ingredients it needs to be even more tumultuous. The government debt is viewed as excessive relative to GDP. Washington’s spending “guarantees” have grown dramatically, there are still some concerned about how ready workers are to return to work, and money is flowing from the Treasury’s checkbook at a pace of $100 billion per week.

During past years the talk of if there “will be a deal,” “will they vote on a deal,” “they have a deal but Congress is on vacation,” sends the stock market into a volatility-tizzy. There’s no reason to expect this year’s to not be disruptive.

Stay in touch with our updates on the economy, exciting industries, and company research by registering at no cost at Channelchek.

Paul Hoffman

Managing Editor, Channelchek


Suggested Reading:


What Metals Can Tell Us About the Economy


The Correlation Between Stocks and Unemployment


Metals & Mining – Second Quarter 2021 Review and Outlook


Energy Industry – 2021 2Q Review and Outlook


Sources:

https://home.treasury.gov/system/files/136/Debt-Limit-Letter-Congress_20210802_Pelosi.pdf

https://home.treasury.gov/news/press-releases/jy0304

https://www.federalreserve.gov/releases/h41/

https://www.bbc.com/news/world-us-canada-14428930

https://www.moodys.com/research/Moodys-affirms-United-States-Aaa-rating-maintains-stable-outlook–PR_423587


Stay up to date. Follow us:


Release – Esports Entertainment Group Signs Exclusive Content Partnership with ESTV EsportsTV


Esports Entertainment Group Signs Exclusive Content Partnership with ESTV EsportsTV


Newark, New Jersey and Los Angeles, California–(Newsfile Corp. – August 13, 2021) –  Esports Entertainment Group, Inc. (NASDAQ: GMBL) (NASDAQ: GMBLW) (or the “Company”) has signed an exclusive partnership with ESTV EsportsTV to create gaming content using their Esports Gaming League (“EGL”) tournament platform. ESTV is the first worldwide 24-7 live linear video channel dedicated to esports. Launched in May 2019, ESTV provides round-the-clock coverage of esports athletes and gaming franchises from an insider perspective.

Esports Entertainment Group will create multi-platform content based on branded tournaments featuring amateurs as well as professional sports athletes. EEG will leverage its relationships with numerous NFL, NBA, NHL and MLS teams to create compelling stories and exciting gaming action.

“We are proud to partner with Eric and the team at ESTV. Their global platform for esports and gaming content can be watched via Roku, Amazon Fire, Sling, and many other providers in over 45 countries,” said Grant Johnson, CEO of Esports Entertainment Group. “ESTV will help us and our professional sports team partners gain additional reach and engage the lucrative millennial demographic.”

“Grant and his team at EEG have done a great job aggressively expanding their offering into traditional sports teams and leagues,” said Eric Yoon, CEO of ESTV. “EEG’s content will be a great addition to ESTV programming and community engagement, allowing us to grow our partnership together in all facets as they continue to expand their sports betting platform.”

EGL enables live and online events and tournaments where gamers can compete and enjoy a wide range of content relating to esports and video games on a proprietary technology platform. Services include full turnkey esports events, live broadcast production, game launches, and online branded tournaments.

About Esports Entertainment Group

Esports Entertainment Group is a full stack esports and online gambling company fueled by the growth of video-gaming and the ascendance of esports with new generations. Our mission is to help connect the world at large with the future of sports entertainment in unique and enriching ways that bring fans and gamers together. Esports Entertainment Group and its affiliates are well-poised to help fans and players to stay connected and involved with their favorite esports. From traditional sports partnerships with professional NFL/NHL/NBA/FIFA teams, community-focused tournaments in a wide range of esports, and boots-on-the-ground LAN cafes, EEG has influence over the full-spectrum of esports and gaming at all levels. The Company maintains offices in New Jersey, the UK and Malta. For more information visit www.esportsentertainmentgroup.com.

About ESTV:

ESTV is the first 24-7 live linear video channel dedicated to esports in the U.S. Launched in May 2019, ESTV provides round-the-clock coverage of esports athletes and gaming franchises from an insider perspective. ESTV is available on the Roku® Channel (U.S. & Canada), Amazon Fire TV, Samsung TV Plus, Dish® Sling TV, VIZIO, Rakuten TV (Europe), TCL TV (worldwide), ZEASN (worldwide), Hisense Sharp (worldwide), RAD TV (Playstation, Google TV & Android TV), EASY TV (Brazil), Select TV, TikiLIVE, XOD Global (worldwide), Simul-TV in the U.S. and international territories as well as over the air network for local media market. We are also available on Twitch, YouTube and Facebook platforms and streams live linear feed and AVOD services. ESTV partners with the world’s top gaming networks and production partners for the most robust esports content lineup on linear, online and mobile. ESTV is also an exclusive media broadcast partner of the Department of Defense Joint Base Lewis McChord and NFL Alumni esports events. For more information, please visit www.estv.co.

FORWARD-LOOKING STATEMENTS

The information contained herein includes forward-looking statements. These statements relate to future events or to our future financial performance, and involve known and unknown risks, uncertainties and other factors that may cause our actual results, levels of activity, performance, or achievements to be materially different from any future results, levels of activity, performance or achievements expressed or implied by these forward-looking statements. You should not place undue reliance on forward-looking statements since they involve known and unknown risks, uncertainties and other factors which are, in some cases, beyond our control and which could, and likely will, materially affect actual results, levels of activity, performance or achievements. Any forward-looking statement reflects our current views with respect to future events and is subject to these and other risks, uncertainties and assumptions relating to our operations, results of operations, growth strategy and liquidity. We assume no obligation to publicly update or revise these forward-looking statements for any reason, or to update the reasons actual results could differ materially from those anticipated in these forward-looking statements, even if new information becomes available in the future. The safe harbor for forward-looking statements contained in the Securities Litigation Reform Act of 1995 protects companies from liability for their forward-looking statements if they comply with the requirements of the Act.

Contact:

U.S. Investor Relations
RedChip Companies, Inc.
Dave Gentry
407-491-4498
dave@redchip.com

Media & Investor Relations Inquiries
Jeff@esportsentertainmentgroup.com

Release – Gevo Reports Second Quarter 2021 Financial Results


Gevo Reports Second Quarter 2021 Financial Results


ENGLEWOOD, Colo., Aug. 12, 2021 (GLOBE NEWSWIRE) — Gevo, Inc. (NASDAQ: GEVO) today announced financial results for the second quarter of 2021 and recent corporate highlights.

Recent Corporate Highlights

  • On August 9, 2021, Gevo announced that its wholly-owned renewable natural gas (“RNG”) project company, Gevo NW Iowa RNG, LLC (“Gevo RNG”), has signed binding, definitive agreements with BP Canada Energy Marketing Corp. and BP Products North America Inc. for the sale of RNG. The RNG project is on schedule and on budget with an anticipated startup early 2022. Beginning in late 2022, Gevo RNG expects to generate cash distributions to Gevo of approximately $9 to $16 million per year.

  • On August 2, 2021, Gevo announced the appointment of Jaime Guillen to its Board of Directors. Mr. Guillen is a Managing Partner at Faros Infrastructure Partners LLC, an investment firm with offices in the United Kingdom, the United States and Mexico.
  • On April 15, 2021, Gevo closed the offering of $68,155,000 in 2021 Bonds to finance the construction of its renewable natural gas project in Iowa.

2021 Second Quarter Financial Highlights

  • Ended the quarter with cash, cash equivalents, restricted cash and marketable securities totaling $567.2 million compared to $525.3 as of the end of Q1 2021 and $6.3 million as of the end of Q2 2020
  • Revenue of $0.4 million for the quarter compared to $1.0 million in Q2 2020
  • Loss from operations (which includes $5.5 million of preliminary stage project costs for Net-Zero 1) of ($19.0) million for the quarter compared to ($5.3) million in Q2 2020
  • Non-GAAP cash EBITDA loss of ($17.1) million for the quarter compared to ($3.1) million in Q2 2020
  • Net loss per share of ($0.09) for the quarter compared to ($0.40) in Q2 2020
  • Non-GAAP adjusted net loss per share of ($0.09) for the quarter compared to ($0.39) in Q2 2020

Commenting on the second quarter of 2021 and recent corporate events, Dr. Patrick R. Gruber, Gevo’s Chief Executive Officer, said “The engineering and design work for our Net-Zero 1 Project is going well. We are figuring out the optimizations and integrations for Net-Zero 1, and how to generate more cash sooner. We are looking forward to completing the next phase of the engineering work in December of this year and moving forward towards getting the financing closed in the first half of next year.”

Second Quarter 2021 Financial Results

Revenue for the three months ended June 30, 2021 was $0.4 million compared with $1.0 million in the same period in 2020.

During the three months ended June 30, 2021, hydrocarbon revenue was $0.3 million compared with $0.9 million in the same period in 2020. Hydrocarbon sales decreased because of lower production volumes at Gevo’s demonstration plant at the South Hampton Resources, Inc. facility in Silsbee, Texas (the “South Hampton Facility”). Gevo’s hydrocarbon revenue is comprised of sales of sustainable aviation fuel and renewable premium gasoline.

As a result of COVID-19 and in response to an unfavorable commodity environment, Gevo terminated its production of ethanol and distiller grains in March 2020.  As previously announced, Gevo’s production facility in Luverne, Minnesota (the “Luverne Facility”) is currently producing isobutanol.  During the second half of 2021, Gevo expects to send finished isobutanol from the Luverne Facility to the South Hampton Facility so that renewable premium gasoline or jet fuel can be produced.

Cost of goods sold was $2.8 million for the three months ended June 30, 2021, compared with $2.6 million in the same period in 2020. Cost of goods sold includes $1.6 million associated with the maintenance of the Luverne and South Hampton Facilities and approximately $1.2 million in depreciation expense for the three months ended June 30, 2021.

Gross loss was $2.4 million for the three months ended June 30, 2021, compared with a $1.7 million gross loss in the same period in 2020.

Research and development expense increased by $0.7 million during the three months ended June 30, 2021 compared with the same period in 2020, due primarily to an increase in personnel and consultant expenses as we work to improve our process for growing and fermenting yeast strains.

Selling, general and administrative expense increased by $2.1 million during the three months ended June 30, 2021, compared with the same period in 2020, due primarily to increases in personnel, professional fees and insurance to support the growth in operations and an increase in consulting related to creating our first Environmental, Social and Governance (“ESG”) report, which will be released during the third quarter 2021, and documenting our compliance with Section 404(b) of the Sarbanes-Oxley Act.

Preliminary stage project costs increased by $5.3 million during the three months ended June 30, 2021, compared with the same period in 2020, due primarily to increased consulting for preliminary engineering costs, depreciation of the right of use assets related the agreements with the fuel supply and lease agreements and personnel expenses to support the growth in business activity at our Net-Zero projects.

Loss from operations in the three months ended June 30, 2021 was ($19.0) million, compared with a ($5.3) million loss from operations in the same period in 2020.

Non-GAAP cash EBITDA loss in the three months ended June 30, 2021 was ($17.1) million, compared with a ($3.1) million non-GAAP cash EBITDA loss in the same period in 2020.

Interest expense has decreased by $0.5 million in the three months ended June 30, 2021 as compared to the same period in 2020, due to the conversion of all of Gevo’s 12% convertible senior secured notes due 2020/2021 to common stock during 2020.

In the three months ended June 30, 2021, Gevo recognized net non-cash gain totaling less than $0.1 million due to changes in the fair value of certain of its financial instruments, such as warrants.

Gevo incurred a net loss for the three months ended June 30, 2021 of ($18.3) million, compared with a net loss of ($6.0) million during the same period in 2020. Non-GAAP adjusted net loss for the three months ended June 30, 2021 was ($18.3) million, compared with a non-GAAP adjusted net loss of ($5.8) million during the same period in 2020.

Cash, cash equivalents, restricted cash and marketable securities at June 30, 2021 was $567.2 million compared to $525.3 as of the end Q1 2021.

Webcast and Conference Call Information

Hosting today’s conference call at 4:30 p.m. EDT (2:30 p.m. MDT) will be Dr. Patrick R. Gruber, Chief Executive Officer, L. Lynn Smull, Chief Financial Officer, Carolyn M. Romero, Chief Accounting Officer, and Geoffrey T. Williams, Jr., Vice President – General Counsel & Secretary. They will review Gevo’s financial results and provide an update on recent corporate highlights.

To participate in the conference call, please dial 1 (833) 729-4776 (inside the U.S.) or 1 (830) 213-7701 (outside the U.S.) and reference the access code 2267135# or through the event weblink https://edge.media-server.com/mmc/p/8w4ypxhw .

A replay of the call and webcast will be available two hours after the conference call ends on August 12, 2021. To access the replay, please dial 1 (855) 859-2056 (inside the U.S.) or 1 (404) 537-3406 (outside the U.S.) and reference the access code 2267135#. The archived webcast will be available in the Investor Relations section of Gevo’s website at www.gevo.com .

About Gevo

Gevo’s mission is to transform renewable energy and carbon into energy-dense liquid hydrocarbons. These liquid hydrocarbons can be used for drop-in transportation fuels such as gasoline, jet fuel, and diesel fuel, that when burned have potential to yield net-zero greenhouse gas emissions when measured across the full lifecycle of the products. Gevo uses low-carbon renewable resource-based carbohydrates as raw materials, and is in an advanced state of developing renewable electricity and renewable natural gas for use in production processes, resulting in low-carbon fuels with substantially reduced carbon intensity (the level of greenhouse gas emissions compared to standard petroleum fossil-based fuels across their lifecycle). Gevo’s products perform as well or better than traditional fossil-based fuels in infrastructure and engines, but with substantially reduced greenhouse gas emissions. In addition to addressing the problems of fuels, Gevo’s technology also enables certain plastics, such as polyester, to be made with more sustainable ingredients. Gevo’s ability to penetrate the growing low-carbon fuels market depends on the price of oil and the value of abating carbon emissions that would otherwise increase greenhouse gas emissions. Gevo believes that its proven, patented, technology enabling the use of a variety of low-carbon sustainable feedstocks to produce price-competitive low carbon products such as gasoline components, jet fuel, and diesel fuel yields the potential to generate project and corporate returns that justify the build-out of a multi-billion-dollar business.

Gevo believes that Argonne National Laboratory GREET model is the best available standard of scientific based measurement for life cycle inventory or LCI.

Learn more at Gevo’s website: www.gevo.com

Forward-Looking Statements

Certain statements in this press release may constitute “forward-looking statements” within the meaning of the Private Securities Litigation Reform Act of 1995. These forward-looking statements relate to a variety of matters, including, without limitation, Gevo’s Net-Zero Projects, Gevo’s RNG Project, the engineering and design work for the Net-Zero 1 Project, Gevo’s offtake agreements, Gevo’s plans to develop its business, Gevo’s ability to successfully construct and finance its operations and growth projects, Gevo’s ability to achieve cash flow from its planned projects, the ability of Gevo’s products to contribute to lower greenhouse gas emissions, particulate and sulfur pollution and other statements that are not purely statements of historical fact. These forward-looking statements are made based on the current beliefs, expectations and assumptions of the management of Gevo and are subject to significant risks and uncertainty. Investors are cautioned not to place undue reliance on any such forward-looking statements. All such forward-looking statements speak only as of the date they are made, and Gevo undertakes no obligation to update or revise these statements, whether as a result of new information, future events or otherwise. Although Gevo believes that the expectations reflected in these forward-looking statements are reasonable, these statements involve many risks and uncertainties that may cause actual results to differ materially from what may be expressed or implied in these forward-looking statements. For a further discussion of risks and uncertainties that could cause actual results to differ from those expressed in these forward-looking statements, as well as risks relating to the business of Gevo in general, see the risk disclosures in the Annual Report on Form 10-K of Gevo for the year ended December 31, 2020 and in subsequent reports on Forms 10-Q and 8-K and other filings made with the U.S. Securities and Exchange Commission by Gevo.

Non-GAAP Financial Information

This press release contains financial measures that do not comply with U.S. generally accepted accounting principles (GAAP), including non-GAAP cash EBITDA loss, non-GAAP adjusted net loss and non-GAAP adjusted net loss per share. Non-GAAP cash EBITDA loss excludes depreciation and amortization and non-cash stock-based compensation. Non-GAAP adjusted net loss and adjusted net loss per share excludes non-cash gains and/or losses recognized in the quarter due to the changes in the fair value of certain of Gevo’s financial instruments, such as warrants, convertible debt and embedded derivatives Management believes these measures are useful to supplement its GAAP financial statements with this non-GAAP information because management uses such information internally for its operating, budgeting and financial planning purposes. These non-GAAP financial measures also facilitate management’s internal comparisons to Gevo’s historical performance as well as comparisons to the operating results of other companies. In addition, Gevo believes these non-GAAP financial measures are useful to investors because they allow for greater transparency into the indicators used by management as a basis for its financial and operational decision making. Non-GAAP information is not prepared under a comprehensive set of accounting rules and therefore, should only be read in conjunction with financial information reported under U.S. GAAP when understanding Gevo’s operating performance. A reconciliation between GAAP and non-GAAP financial information is provided in the financial statement tables below.

Cash EBITDA loss is a non-GAAP measure calculated by adding back depreciation and amortization and non-cash stock compensation to GAAP loss from operations. A reconciliation of cash EBITDA loss to GAAP loss from operations is provided in the financial statement tables following this release.

Adjusted net loss per share is a non-GAAP measure calculated by adding back non-cash gains and/or losses recognized in the quarter due to the changes in the fair value of certain of our financial instruments, such as warrants, convertible debt and embedded derivatives, to GAAP net loss per share. A reconciliation of adjusted net loss per share to GAAP net loss per share is provided in the financial statement tables following this release.

Cash EBITDA loss is a non-GAAP measure calculated by adding back depreciation and amortization and non-cash stock compensation to GAAP loss from operations. A reconciliation of cash EBITDA loss to GAAP loss from operations is provided in the financial statement tables following this release.

Adjusted net loss is a non-GAAP measure calculated by adding back non-cash gains and/or losses recognized in the quarter due to the changes in the fair value of certain of our financial instruments, such as warrants, convertible debt and embedded derivatives, to GAAP net loss. A reconciliation of adjusted net loss to GAAP net loss is provided in the financial statement tables following this release.


Gevo, Inc.

Condensed Consolidated Balance Sheets Information

(Unaudited, in thousands, except share and per share amounts)

  June 30, 2021   December 31, 2020
Assets          
Current assets          
Cash and cash equivalents $ 17,085     $ 78,338  
Marketable securities (current)   246,886       ?  
Restricted cash (current)   57,645       ?  
Accounts receivable   847       527  
Inventories   2,216       2,491  
Prepaid expenses and other current assets   4,497       1,914  
Total current assets   329,176       83,270  
           
Property, plant and equipment, net   79,243       66,408  
Long-term marketable securities   175,169       ?  
Long-term restricted cash   70,464       ?  
Operating right-of-use asset   1,770       133  
Financing right-of-use asset   27,491       176  
Deposits and other assets   2,361       2,112  


Total assets


$


685,674
   

$


152,099
 
           
Liabilities          
Current liabilities          
Accounts payable and accrued liabilities $ 16,393     $ 3,943  
Operating lease liabilities (current)   ?       172  
Finance lease liabilities (current)   4,888       10  
Loans payable – other (current)   174       807  
Total current liabilities   21,455       4,932  
           
2021 Bonds payable (long-term)   66,120       ?  
Loans payable – other (long-term)   394       447  
Operating lease liabilities (long-term)   1,783       ?  
Financing lease liabilities (long-term)   19,715       162  
Other long-term liabilities   84       179  
Total liabilities   109,551       5,720  
           
Commitments and Contingencies          
           
Stockholders’ Equity          
Common Stock, $0.01 par value per share; 250,000,000 authorized,

197,964,476 and 128,138,311 shares issued and outstanding at June

30, 2021 and December 31, 2020, respectively.
  1,980       1,282  
Additional paid-in capital   1,100,932       643,269  
Accumulated other comprehensive loss   (307 )     ?  
Accumulated deficit   (526,482 )     (498,172 )
Total stockholders’ equity   576,123       146,379  


Total liabilities and stockholders’ equity


$


685,674
   

$


152,099


Gevo, Inc.

Condensed Consolidated Statements of Operations Information

(Unaudited, in thousands, except share and per share amounts)

  Three Months Ended June 30, Six Months Ended June 30,
    2021       2020       2021       2020  
Revenue and cost of goods sold              
Ethanol sales and related products, net $ ?     $ 83     $ ?     $ 3,783  
Hydrocarbon revenue   346       859       359       984  
Grant and other revenue   76       46       156       46  
Total revenues   422       988       515       4,813  
               
Cost of goods sold   2,794       2,644       4,788       10,783  
               
Gross loss   (2,372 )     (1,656 )     (4,273 )     (5,970 )
               
Operating expenses              
Research and development expense   1,404       677       2,782       1,257  
Selling, general and administrative expense   4,820       2,698       8,692       5,325  
Preliminary stage project costs   5,472       221       8,199       377  
Loss on disposal of assets   4,954       ?       4,954       38  
Restructuring expenses   ?       5       ?       304  
Total operating expenses   16,650       3,601       24,627       7,301  
               
Loss from operations   (19,022 )     (5,257 )     (28,900 )     (13,271 )
               
Other income (expense)              
Gain on forgiveness of SBA loan   641       ?       641       ?  
Interest Expense   (6 )     (541 )     (11 )     (1,086 )
(Loss) on modification of 2020 Notes   ?       (57 )     ?       (726 )
Gain (loss) from change in fair value of derivative warrant liability  


43


1


(10


)


8
 
(Loss) from change in fair value of 2020/21 Notes embedded derivative liability   ?       (176 )     ?       (276 )
Other income (expense)   91       (13 )     (30 )     55  
Total other income (expense), net   769       (786 )     590       (2,025 )
               
Net loss $ (18,253 )   $ (6,043 )   $ (28,310 )   $ (15,296 )
               
Net loss per share – basic and diluted $ (0.09 )   $ (0.40 )   $ (0.15 )   $ (1.04 )
Weighted-average number of common shares outstanding –

basic and diluted
 

198,137,420
      15,071,105       190,892,223       14,771,952  
               

Gevo, Inc.

Condensed Consolidated Statements of Comprehensive Income

(Unaudited, in thousands, except share and per share amounts)

  Three Months Ended June 30, Six Months Ended June 30,
    2021       2020       2021       2020  
               
Net Loss $ (18,253 )   $ (6,043 )   $ (28,310 )   $ (15,296 )
Other comprehensive income (loss)              
Unrealized gains (losses) on available-for-sale securities, net of tax   (307 )     ?       (307 )     ?  
Total change in unrealized gains (losses) on marketable securities   (307 )     ?       (307 )     ?  
               
Comprehensive Loss $ (18,560 )   $ (6,043 )   $ (28,617 )   $ (15,296 )
               

Gevo, Inc.

Condensed Consolidated Statements of Stockholders’ Equity Information

(Unaudited, in thousands, except share amounts)

    Common Stock   Paid-In Capital   Accumulated Other Comprehensive Loss   Accumulated Deficit   Stockholders’ Equity
    Shares   Amount        
                                   
  Balance, December 31, 2020 128,138,311     $ 1,282     $ 643,269     $     $ (498,172 )   $ 146,379  
                                   
  Issuance of common stock, net of issue costs 68,170,579       682       457,008                   457,690  
  Issuance of common stock upon exercise of warrants 1,863,058       18       1,099                   1,117  
  Non-cash stock-based compensation             562                   562  
  Issuance of common stock under stock plans, net of taxes (121,499 )     (1 )     1                    
  Net loss                         (10,057 )     (10,057 )
                                   
  Balance, March 31, 2021 198,050,449       1,981       1,101,939             (508,229 )     595,691  
                                   
  Issuance of common stock, net of issue costs             (45 )                 (45 )
  Issuance of common stock upon exercise of warrants 3,700             4                   2  
  Non-cash stock-based compensation             858                   858  
  Issuance of common stock under stock plans, net of taxes (89,673 )     (1 )     (1,824 )                 (1,823 )
  Other comprehensive loss                   (307 )           (307 )
  Net loss                         (18,253 )     (18,253 )
                                   
  Balance, June 30, 2021 197,964,476     $ 1,980     $ 1,100,932     $ (307 )   $ (526,482 )   $ 576,123  
                                   
  Balance, December 31, 2019 14,083,232     $ 141     $ 530,349     $     $ (457,986 )   $ 72,504  
                                   
  Issuance of common stock, net of issue costs 425,776       4       902                   906  
  Non-cash stock-based compensation             336                   336  
  Issuance of common stock under stock plans, net of taxes 105,882                                
  Net loss                         (9,253 )     (9,253 )
                                   
  Balance, March 31, 2020 14,614,890       145       531,587             (467,239 )     64,493  
                                   
  Issuance of common stock, net of issue costs 917,345       9       1,238                   1,247  
  Non-cash stock-based compensation             497                   497  
  Issuance of common stock under stock plans, net of taxes (18,137 )           (307 )                 (307 )
  Net loss                         (6,043 )     (6,043 )
                                   
  Balance, June 30, 2020 15,514,098     $ 154     $ 533,015     $     $ (473,282 )   $ 59,887  


Gevo, Inc.

Condensed Consolidated Cash Flow Information

(Unaudited, in thousands)

    Three Months Ended June 30, Six Months Ended June 30,
      2021       2020       2021       2020  
Operating Activities                
Net Loss   $ (18,253 )   $ (6,043 )   $ (28,310 )   $ (15,296 )
Adjustments to reconcile net loss to net cash used in

operating activities:
               
Loss (gain) from change in fair value of derivative warrant liability   (43 )     (1 )     10       (8 )
Loss from change in fair value of 2020/21 Notes and 2020 Notes embedded derivative liability     ?       176         ?       276  
Loss on sales of property, plant and equipment     4,954       38       4,954       38  
(Gain) from forgiveness of SBA PPP loans     (641 )     ?       (641 )       ?  
Stock-based compensation     692       501       1,617       673  
Depreciation and amortization     1,223       1,629       2,372       3,278  
Non-cash lease expense     (75 )     14       (58 )     29  
Non-cash interest expense     ?       243       2       393  
Other non-cash expenses     5       ?       5         ?  
Changes in operating assets and liabilities:                
Accounts receivable     (755 )     (594 )     (320 )     389  
Inventories     236       201       275       721  
Prepaid expenses and other current assets, deposits and other assets:     1,131       331       (3,142 )     164  
Accounts payable, accrued expenses and long-term liabilities   (777 )     (338 )     3,768       (1,475 )
Net cash used in operating activities     (12,303 )     (3,843 )     (19,468 )     (10,818 )
                 
Investing Activities                
Acquisitions of property, plant and equipment     (9,537 )     (817 )     (14,167 )     (1,607 )
Purchase of marketable securities     (422,362 )     ?       (422,362 )       ?  
Net cash used in investing activities     (431,899 )     (817 )     (436,529 )     (1,607 )
                 
Financing Activities                
Proceeds from issuance of 2021 Bonds     68,995       ?       68,995         ?  
Debt and equity offering costs     (3,074 )     (63 )     (34,757 )     (115 )
Proceeds from issuance of common stock and common stock warrants   (1,824 )     1,313       487,549       2,271  
Proceeds from the exercise of warrants   2       ?       1,119         ?  
Net settlement of common stock under stock plans   27       (156 )       ?       (310 )
Payments on secured debt     (53 )     (392 )     (53 )     (392 )
Proceeds from SBA loans     ?       1,006         ?       1,006  
Net cash provided by financing activities     64,073       1,708       522,853       2,460  
                 
Net increase (decrease) in cash and cash equivalents     (380,129 )     (2,952 )     66,856       (9,965 )
                 
Cash, cash equivalents, and restricted cash                
Beginning of period     525,323       9,289       78,338       16,302  
                 
End of period   $ 145,194     $ 6,337     $ 145,194     $ 6,337  
                 

Gevo, Inc.

Reconciliation of GAAP to Non-GAAP Financial Information

(Unaudited, in thousands, except share and per share amounts)

  Three Months Ended June 30,   Six Months Ended June 30,
Non-GAAP Cash EBITDA   2021       2020       2021       2020  
               
Loss from operations $ (19,022 )   $ (5,257 )   $ (28,900 )   $ (13,271 )
Depreciation and amortization   1,223       1,629       2,372       3,278  
Stock-based compensation   692       501       1,617       673  
Non-GAAP cash EBITDA $ (17,107 )   $ (3,127 )   $ (24,911 )   $ (9,320 )
               
Non-GAAP Adjusted Net Loss              
               
Net Loss $ (18,253 )   $ (6,043 )   $ (28,310 )   $ (15,296 )
Adjustments:              
(Loss) on modification of 2020 Notes   ?       (57 )     ?       (726 )
Gain (loss) from change in fair value of derivative warrant liability   43       1       (10 )     8  
(Loss) from change in fair value of 2020/21 Notes and 2020 Notes embedded derivative liability   ?       (176 )     ?       (276 )
Total adjustments   43       (232 )     (10 )     (994 )


Non-GAAP Net Income (Loss)
$ (18,296 )   $ (5,811 )   $ (28,300 )   $ (14,302 )
Non-GAAP adjusted net loss per share –

basic and diluted
$ (0.09 )   $ (0.39 )   $ (0.15 )   $ (0.97 )
Weighted-average number of common

shares outstanding – basic and diluted
  198,137,420       15,071,105       190,892,223       14,771,952  

Investor and Media Contact

+1 720-647-9605

IR@gevo.com

Release – Ayala Pharmaceuticals Reports Second Quarter 2021 Financial Results and Provides Business Update


Ayala Pharmaceuticals Reports Second Quarter 2021 Financial Results and Provides Business Update


– Enrolled the First Patient in the Phase 2/3 Pivotal Trial of AL102 for the Treatment of Desmoid Tumors

– Multiple Near-Term Milestones Across Clinical-Stage Pipeline

– Updated ACCURACY Trial Data to Be Presented at ESMO 2021-

REHOVOT, Israel and WILMINGTON, Del., Aug. 13, 2021 (GLOBE NEWSWIRE) —  Ayala Pharmaceuticals, Inc. (Nasdaq: AYLA), a clinical-stage oncology company focused on developing and commercializing small molecule therapeutics for patients suffering from rare and aggressive cancers, primarily in genetically defined patient populations, today reported financial results for the period ended June 30, 2021 and highlighted recent progress and upcoming milestones for its pipeline programs.

“Ayala is well positioned for strong clinical progress throughout the remainder of this year. In the second quarter, we continued to advance our pipeline programs and we are gearing up for a data readout from AL101 in our ACCURACY trial in adenoid cystic carcinoma at the upcoming ESMO meeting in September, while also advancing our AL102 clinical trials in desmoid tumors and multiple myeloma,” said Roni Mamluk, Ph.D., Chief Executive Officer of Ayala. “Our science is deeply rooted in the promise of predicting, identifying and addressing tumorigenic drivers of cancer and we continue to see value in our approach combining bioinformatics and next-generation sequencing. There remains a significant unmet need among patients with genetically defined cancers and we believe that our pipeline has the potential to address the ongoing shortfalls of existing therapies.”

Recent Business Highlights and Upcoming Milestones:

  • Enrolled First Patient in the Phase 2/3 RINGSIDE Trial of AL102 for the Treatment of Desmoid Tumors: Ayala recently enrolled the first patient in its pivotal Phase 2/3 RINGSIDE trial of AL102 for the treatment of desmoid tumors with multiple sites open in the U.S. and globallyAyala expects to report an initial interim data read-out from part A of the trial in mid-2022, with part B of the study commencing thereafter.
  • Dosed First Patient in the Phase 1 Trial of AL102 in Combination with Novartis’ BCMA Targeting Agent, WVT087 for the Treatment of Relapsed/Refractory Multiple Myeloma: In April 2021, Ayala announced the dosing of the first patient in the Phase 1 combination trial of AL102 with Novartis’ investigational anti-B-cell maturation antigen (BCMA) agent, WVT078, for the treatment of relapsed and/or refractory (R/R) multiple myeloma (MM).
  • Phase 2 TENACITY Trial of AL101 for the Treatment of Triple Negative Breast Cancer Continues to Progress: Ayala continues to enroll patients in the Phase 2 TENACITY clinical trial of its potent, selective small molecule gamma secretase inhibitor (GSI), AL101, for the treatment of patients with Notch-activated recurrent or metastatic (R/M) triple negative breast cancer (TNBC). The Company expects to report preliminary data from this ongoing trial in 2022.
  • On Track to Report Additional ACCURACY Phase 2 Data; Patient Enrollment in 6mg Cohort of Phase 2 ACCURACY Study Completed: Ayala completed enrollment of patients in the 6mg cohort of the Phase 2 ACCURACY study of AL101 for the treatment of R/M adenoid cystic carcinoma (ACC), which includes 42 subjects. Further trial progress updates, including additional data, will be presented at the upcoming European Society for Medical Oncology (ESMO) 2021 Congress being held virtually September 16-21, 2021.

Second Quarter 2021 Financial Results

  • Cash Position: Cash and cash equivalents were $44.4 million as of June 30, 2021, as compared to $42.0 million as of December 31, 2020.
  • Collaboration Revenue: Collaboration revenue was $0.8 million for the second quarter of 2021, as compared to $1.0 million for the same period in 2020.
  • R&D Expenses: Research and development expenses were $8.1 million for the second quarter of 2021, compared to $5.1 million for the same period in 2020. The increase was primarily driven by the advancement of Ayala’s clinical programs.
  • G&A Expenses: General and administrative expenses were $2.5 million for the second quarter of 2021, compared to $1.5 million for the same period in 2020. The increase was primarily related to costs associated with becoming a public company.
  • Net Loss: Net loss was $10.8 million for the second quarter of 2021, resulting in a basic and diluted net loss per share of $0.75 Net loss was $6.7 million for the same period in 2020, resulting in a basic and diluted net loss per share of $0.74.

About Ayala Pharmaceuticals

Ayala Pharmaceuticals, Inc. is a clinical-stage oncology company focused on developing and commercializing small molecule therapeutics for patients suffering from rare and aggressive cancers, primarily in genetically defined patient populations. Ayala’s approach is focused on predicating, identifying and addressing tumorigenic drivers of cancer through a combination of its bioinformatics platform and next-generation sequencing to deliver targeted therapies to underserved patient populations. The company has two product candidates under development, AL101 and AL102, targeting the aberrant activation of the Notch pathway with gamma secretase inhibitors to treat a variety of tumors including Adenoid Cystic Carcinoma, Triple Negative Breast Cancer (TNBC), T-cell Acute Lymphoblastic Leukemia (T-ALL), Desmoid Tumors and Multiple Myeloma (MM) (in collaboration with Novartis). AL101, has received Fast Track Designation and Orphan Drug Designation from the U.S. FDA and is currently in a Phase 2 clinical trial for patients with ACC (ACCURACY) bearing Notch activating mutations and in a Phase 2 clinical trial for patients with TNBC (TENACITY) bearing Notch activating mutations and other gene rearrangements. AL102 is currently in a Pivotal Phase 2/3 clinical trials for patients with desmoid tumors (RINGSIDE) and is being evaluated in a Phase 1 clinical trial in combination with Novartis’ BMCA targeting agent, WVT078, in Patients with relapsed/refractory Multiple Myeloma. For more information, visit www.ayalapharma.com.

Investors:
Julie Seidel
Stern Investor Relations, Inc.
+1-212-362-1200
Julie.seidel@sternir.com

Ayala Pharmaceuticals:
+1-857-444-0553
info@ayalapharma.com

Forward-Looking Statements
This press release contains forward-looking statements within the meaning of the Private Securities Litigation Reform Act of 1995. All statements contained in this press release that do not relate to matters of historical fact should be considered forward-looking statements, including statements relating to our development of AL101 and AL102, the promise and potential impact of our preclinical or clinical trial data, the timing of and plans to initiate additional clinical trials of AL101 and AL102, upcoming milestones, including without limitation the timing and results of any clinical trials or readouts, patient enrollment and the sufficiency of cash to fund operations. These forward-looking statements are based on management’s current expectations. The words “may,” “will,” “should,” “expect,” “plan,” “anticipate,” “could,” “intend,” “target,” “project,” “estimate,” “believe,” “predict,” “potential” or “continue” or the negative of these terms or other similar expressions are intended to identify forward-looking statements, although not all forward-looking statements contain these identifying words. These statements are neither promises nor guarantees, but involve known and unknown risks, uncertainties and other important factors that may cause our actual results, performance or achievements to be materially different from any future results, performance or achievements expressed or implied by the forward-looking statements, including, but not limited to, the following: the impact of the COVID-19 pandemic on our operations, including our preclinical studies and clinical trials, and the continuity of our business; we have incurred significant losses, are not currently profitable and may never become profitable; our need for additional funding; our cash runway; our limited operating history and the prospects for our future viability; the lengthy, expensive, and uncertain process of clinical drug development, including potential delays in regulatory approval; our requirement to pay significant payments under product candidate licenses; the approach we are taking to discover and develop product candidates and whether it will lead to marketable products; the expense, time-consuming nature and uncertainty of clinical trials; enrollment and retention of patients; potential side effects of our product candidates; our ability to develop or to collaborate with others to develop appropriate diagnostic tests; protection of our proprietary technology and the confidentiality of our trade secrets; potential lawsuits for, or claims of, infringement of third-party intellectual property or challenges to the ownership of our intellectual property; risks associated with international operations; our ability to retain key personnel and to manage our growth; the potential volatility of our common stock; costs and resources of operating as a public company; unfavorable or no analyst research or reports; and securities class action litigation against us. These and other important factors discussed under the caption “Risk Factors” in our Annual Report on Form 10-K for the year ended December 31, 2020 filed with the U.S. Securities and Exchange Commission (SEC) on March 24, 2021 and our other filings with the SEC could cause actual results to differ materially from those indicated by the forward-looking statements made in this press release. Any such forward-looking statements represent management’s estimates as of the date of this press release. New risk factors and uncertainties may emerge from time to time, and it is not possible to predict all risk factors and uncertainties. While we may elect to update such forward-looking statements at some point in the future, except as required by law, we disclaim any obligation to do so, even if subsequent events cause our views to change. Although we believe the expectations reflected in such forward-looking statements are reasonable, we can give no assurance that such expectations will prove to be correct. These forward-looking statements should not be relied upon as representing our views as of any date subsequent to the date of this press release.

AYALA PHARMACEUTICALS, INC. 
CONSOLIDATED BALANCE SHEETS 
U.S. dollars in thousands (except share and per share data)

    June 30
  December 31
      2021       2020  
    (Unaudited)
         
CURRENT ASSETS:                
Cash and Cash Equivalents   $ 44,412     $ 42,025  
Short-term Restricted Bank Deposits     119       90  
Trade Receivables     929       681  
Prepaid Expenses and other Current Assets     1,550       1,444  
Total Current Assets     47,010       44,240  
LONG-TERM ASSETS:                
Other Assets   $ 270     $ 305  
Property and Equipment, Net     1,192       1,283  
Total Long-Term Assets     1,462       1,588  
Total Assets   $ 48,472     $ 45,828  
LIABILITIES AND STOCKHOLDERS’ EQUITY:                    
CURRENT LIABILITIES:                
Trade Payables   $ 2,833     $ 3,726  
Other Accounts Payables     2,377       3,151  
Total Current Liabilities     5,210       6,877  
LONG TERM LIABILITIES:                
Long-term Rent Liability     502       553  
Total Long-Term Liabilities   $ 502     $ 553  
STOCKHOLDERS’ STOCKHOLDERS’ EQUITY:                
Common Stock of $0.01 par value per share; 200,000,000 shares authorized at June 30, 2021 and December 31,                
2020; 13,240,961 and 12,824,463 shares issued at June 30, 2021 and, respectively December 31, 2020; 13,092,925                
and 12,728,446 shares outstanding at June 30, 2021 and December 31, 2020, respectively   $ 131     $ 128  
Additional Paid-in Capital     133,925       109,157  
Accumulated Deficit     (91,296 )     (70,887 )
Total Stockholders’ Equity     42,760       38,398  
Total Liabilities and Stockholders’ Equity   $ 48,472     $ 45,828  
                 

AYALA PHARMACEUTICALS, INC. 
CONDENSED CONSOLIDATED STATEMENTS OF OPERATIONS 
(Unaudited) 
(In thousands, except share & per share amounts)

     For the Three Months Ended
   For the Six Months Ended
     June 30,
   June 30,
      2021       2020       2021       2020  
                                 
Revenues from licensing agreement   $ 761     $ 1,045     $ 1,735     $ 2,046  
Cost of services     (761 )     (1,045 )     (1,735 )     (2,046 )
                                 
Gross profit                        
Operating expenses:                                
Research and development     8,121       5,067       15,046       10,195  
General and administrative     2,536       1,546       4,839       2,857  
                                 
Operating loss     (10,657 )     (6,613 )     (19,885 )     (13,052 )
Financial Income (Loss), net     (22 )     40       (114 )     2  
                                 
Loss before income tax     (10,679 )     (6,573 )     (19,999 )     (13,050 )
Taxes on income     (162 )     (139 )     (410 )     (260 )
                                 
Net loss attributable to common stockholders     (10,841 )     (6,712 )     (20,409 )     (13,310 )
Net Loss per share attributable to common stockholders, basic and diluted   $ (0.75 )   $ (0.74 )   $ (1.46 )   $ (1.90 )
Weighted average common shares outstanding, basic and diluted     14,417,423       9,018,637       13,954,676       6,989,762  

Whats in the Infrastructure Bill for US Battery Production?


Image Credit: Tom Fisk (Pexels)


What’s in the Infrastructure Bill for US Battery Production?


The Infrastructure Bill that just passed the Senate and is headed to the House for a possible vote this Fall is undoubtedly helpful for metals producers. However, not all will benefit. If passed, there’d be billions for upgrading highways, railways, and power grids. So steel, copper, and aluminum are obvious winners, but as written, for minerals used in batteries such as lithium or cobalt, the bill will not only increase domestic demand but aims to increase supply as well.

There is $6 billion earmarked for battery materials processing and manufacturing projects and an additional $140 million allocated to what is called a rare earths demonstration plant. This is part of a greater investment drive across the full metallic supply chain.

The “investment” within the bill works to place importance on production capacity of critical metals and “green” the overall infrastructure of the country while making a solid effort to “buy American.” A tall order considering the country’s reliance on imports.

Rare Earth Metals

The United States’ supply of rare earth compounds can best be described as imported. Almost 80% of shipments come from China, according to the United States Geological Survey (USGS).

The Department of Energy (DOE) is already steering funds into research and development on the necessary materials needed, from primary processing to recycling, the infrastructure bill makes the commitment much larger with a $140 million grant to build a facility, “to demonstrate the commercial feasibility of a full-scale integrated rare earth element extraction and separation facility and refinery”.


A partner from academia is expected to “provide environmental benefits through use of feedstock derived from acid mine drainage, mine waste, or other deleterious material.” The US is considered vulnerable in its not being able to supply enough critical minerals for what is expected to provide the energy needs of the near future.

Critical mineral recycling also gets money through this bill as it allocates $100 million per year through 2024 in grants for developing, processing, and recycling critical minerals. Recycling projects will get a minimum of 30%. Any project based in the United States will be prioritized and none will be allowed to export to “a foreign entity of concern”.

Battery Metals

There is $7.5 billion allocated in the bill for EV charging. The House is rumored to be looking to refine the bill and bolster some of these numbers for them to approve a revised version.

While the plan is to move quickly forward with electric vehicles, currently the country will not have enough domestic production of lithium, nickel, and cobalt to make the batteries needed to power those vehicles. This may be remedied by the bill’s allocations of $3 billion for each of the following: battery materials processing, and battery manufacturing projects. Grants in each case will be for either demonstration plants, full commercial facilities or the retrofitting of existing facilities in the United States. Grants are only offered to U.S. owned organizations. The winners of grants will be subject to North American intellectual property rights with a commitment not to “use battery material supplied by or originating from a foreign entity of concern.” 

Permitting

Getting US-funded new mines for nickel, lithium, or cobalt refining can be a slow process given the current complexity of the permitting processes. Far too slow if the country is going meet the stated targets. The bill notes, “The Federal permitting process has been identified as an impediment to mineral production and the mineral security of the United States,” it calls for the implementing performance metrics as a condition of approving critical mines that are part of the program.

Environmental opposition to these metal mining projects is another impediment. This will be part of what is addressed; it remains to be seen just how quickly permitting can be put through, given the obvious counter-productive nature of mining.

The Dirty Mining Issue

“Whole-concept” or “total mining” is addressed in the infrastructure bill. Despite the shorter deadlines and grant periods, the bill allows a 10-year deadline for the United States Geological Survey (USGS) to provide a comprehensive survey of national mineral resources. The intent is “using a whole ore body approach rather than a single commodity approach, to emphasize all of the recoverable critical minerals in a given surface or subsurface deposit”.

The bill also calls for the USGS to “map and collect data for areas containing mine waste to increase understanding of above-ground critical mineral resources in previously disturbed areas.” These wastes are expected to feed the proposed new rare earths processing plants.

Brand new mines will remain a problem for critical minerals planners; going back to what has already been mined seems more sensible.

Take-Away

The infrastructure bill is an obvious win for construction materials but will also provide a strong framework and a lot of R&D money for miners and academia alike. The top take from the as yet not fully passed or signed bill is that it will focus on companies in the U.S. This will mean many current mining and recycling companies within our borders will have tremendous potential to grow at a rapid pace.

Discover US-based mining companies to explore here on Channelchek. Then subscribe to our YouTube channel to listen to interviews with the top brass from metal producers.

Suggested Reading:


ESG Scores and How to Use Them


Lithium Battery vs Hydrogen Fuel Cell


Ford’s Announcement is Another Reason for Copper Producers to Smile


Debt Ceiling Debate Impact on Stocks and US Treasury Credit Rating

Sources:


https://www.reuters.com/article/us-critical-minerals-ahome/column-u-s-infrastructure-bill-targets-critical-minerals-supply-idUSKBN2FD1GU

https://www.cnn.com/2021/07/28/politics/infrastructure-bill-explained/index.html

https://www.sciencemag.org/news/2021/08/big-step-forward-energy-expert-analyzes-new-us-infrastructure-bill


Stay up to date. Follow us:


Capstone Green Energy Corporation (CGRN) – June-quarter sales disappointing but growth is coming

Thursday, August 12, 2021

Capstone Green Energy Corporation (CGRN)
June-quarter sales disappointing but growth is coming

Capstone Green Energy Corp is the producer of low-emission microturbine systems.The company develops, manufactures, markets and services microturbine technology solutions for use in stationary distributed power generation applications. Capstone Turbine’s products include onboard generation for hybrid electric vehicles; conversion of oil field and biomass waste gases into electricity; combined heat, power, and chilling solutions; capacity addition; and standby power.

Michael Heim, Senior Research Analyst, Noble Capital Markets, Inc.

Refer to the full report for the price target, fundamental analysis, and rating.

    June quarter sales were below our expectations. The company reported revenues of $16.1 million up 13% year over year but down 4.5% sequentially and below our $18.5 million forecast. The company is in the middle of a transition towards rental and service business, which will provide for more steady revenues but will have less of the big ticket items that sometimes boost sales in a given quarter. Management believes rentals and sales are still being negatively impacted by COVID and supply chain issues specifically pointing to Italy, India and Brazil where Capstone does business.

    Costs rose causing margins and cash flow to shrink.  Adjusted EBIDTA was ($2.3) million versus $0.1 million. Cost of goods sold rose to $13.4 million versus $10.8 million pushing gross margins down to $2.6 million (16%) versus $3.4 million (24%). We had hoped for the gross margin percent to remain at 24%. Operating costs were $6.2 million versus $3.9 million last year. Net income was ($4.8) million …


This Company Sponsored Research is provided by Noble Capital Markets, Inc., a FINRA and S.E.C. registered broker-dealer (B/D).

*Analyst certification and important disclosures included in the full report. NOTE: investment decisions should not be based upon the content of this research summary.  Proper due diligence is required before making any investment decision. 

Endeavour Silver (EXK)(EDR:CA) – Operating Cost Profile Expected to Improve in the Second Half

Thursday, August 12, 2021

Endeavour Silver (EXK)(EDR:CA)
Operating Cost Profile Expected to Improve in the Second Half

As of April 24, 2020, Noble Capital Markets research on Endeavour Silver is published under ticker symbols (EXK and EDR:CA). The price target is in USD and based on ticker symbol EXK. Research reports dated prior to April 24, 2020 may not follow these guidelines and could account for a variance in the price target.

Endeavour Silver Corp is a precious metal mining company. The company is primarily engaged in silver mining and owns three high-grade, underground, silver-gold mines in Mexico. Its other business activities include acquisition, exploration, development, extraction, processing, refining and reclamation. The company is organized into four operating mining segments, Guanacevi, Bolanitos, El Cubo, and El Compas, which are located in Mexico as well as Exploration and Corporate segments. Its Exploration segment consists of projects in the exploration and evaluation phases in Mexico and Chile.

Mark Reichman, Senior Research Analyst of Natural Resources, Noble Capital Markets, Inc.

Refer to the full report for the price target, fundamental analysis, and rating.

    Second quarter 2021 results. Endeavour reported second quarter 2021 net income of $6.7 million, or $0.04 per share, compared to a loss of $3.3 million, or $(0.02) per share during the prior year period. Excluding a gain on the sale of the El Cubo mine, the company generated net income of $0.8 million, or $0.01 per share. We had projected net income of $6.9 million or $0.04 per share. Revenue was in line with our estimates although operating costs were higher than expected due to inflationary pressures, including increased labor costs. Cash costs per silver ounce and all-in sustaining costs per ounce increased to $13.03 and $25.30, respectively, compared to $7.86 and $19.94 in the first quarter of 2021.

    Updating estimates.  We have trimmed our 2021 EPS and EBITDA estimates to $0.03 and $47.5 million from $0.06 and $52.5 million, respectively. Our 2022 EPS and EBITDA estimates are $0.18 and $75.5 million, respectively. While our 2022 estimates are largely unchanged, our 2021 estimates reflect second quarter results although we anticipate some margin improvement in the second half of the year. There …


This research is provided by Noble Capital Markets, Inc., a FINRA and S.E.C. registered broker-dealer (B/D).

*Analyst certification and important disclosures included in the full report. NOTE: investment decisions should not be based upon the content of this research summary.  Proper due diligence is required before making any investment decision. 

Euroseas Ltd. (ESEA) – Strong 2Q2021 Results and Term Charter on Diamantis

Thursday, August 12, 2021

Euroseas Ltd. (ESEA)
Strong 2Q2021 Results and Term Charter on Diamantis

Euroseas Ltd. provides ocean-going transportation services worldwide. The company owns and operates containerships that transport dry and refrigerated containerized cargoes, including manufactured products and perishables; and drybulk carriers that transport iron ore, coal, grains, bauxite, phosphate, and fertilizers. As of March 31, 2017, it had a fleet of seven containerships; and six drybulk carriers, including three Panamax drybulk carriers, one Handymax drybulk carrier, one Kamsarmax drybulk carrier, and one Ultramax drybulk carrier. The company was founded in 2005 and is based in Maroussi, Greece.

Poe Fratt, Senior Research Analyst, Noble Capital Markets, Inc.

Refer to the full report for the price target, fundamental analysis, and rating.

    Adjusted 2Q2021 EBITDA of $10.5 million in line with expectations after adjusting for claim award on a failed 1Q2020 sale of the Manolis P.  Call with management today at 9am EST—number is (877) 553-9962 and code is Euroseas. TCE revenue of $18.8 million increased from $14.7 million in 1Q2021 due to a $2,719 move up in TCE rates to $14,853/day from $12,134/day and higher shipping days of 1,273 versus 1,219 in 1Q2021, with only one idle day versus 41 in 1Q2021.

    Another feeder secured term charter at higher TCE rate.  The Diamantis P, a 1998-built 2,008 TEU feeder, secured a charter through October 2024 (min of 36 months and max of 40 months) at a TCE rate of $27.0k/day (up from $6.6k/day). Three feeders (Corfu/Evridiki/Astoria) and one intermediate (Oakland) are available for charter over the next six months, and recent charters on the Oakland intermediate …


This research is provided by Noble Capital Markets, Inc., a FINRA and S.E.C. registered broker-dealer (B/D).

*Analyst certification and important disclosures included in the full report. NOTE: investment decisions should not be based upon the content of this research summary.  Proper due diligence is required before making any investment decision. 

InPlay Oil (IPOOF)(IPO:CA) – Outstanding quarter due to operational improvements

Thursday, August 12, 2021

InPlay Oil (IPOOF)(IPO:CA)
Outstanding quarter due to operational improvements

As of April 24, 2020, Noble Capital Markets research on InPlay Oil is published under ticker symbols (IPOOF and IPO:CA). The price target is in USD and based on ticker symbol IPOOF. Research reports dated prior to April 24, 2020 may not follow these guidelines and could account for a variance in the price target. InPlay Oil is a junior oil and gas exploration and production company with operations in Alberta focused on light oil production. The company operates long-lived, low-decline properties with drilling development and enhanced oil recovery potential as well as undeveloped lands with exploration possibilities. The common shares of InPlay trade on the Toronto Stock Exchange under the symbol IPO and the OTCQZ Exchange under the symbol IPOOF.

Michael Heim, Senior Research Analyst, Noble Capital Markets, Inc.

Refer to the full report for the price target, fundamental analysis, and rating.

    Production is soaring due to the performance of recently drilled wells. InPlay reported average production of 5,380 boe/d in the June quarter, up 71% versus last year and above our forecast of 5,167 boe/d. The jump in production reflect strong performance by three Pembina wells drilled in the first quarter that continue to blow through type curve projections. Well flow shows no signs of decreasing after 120 days and the wells have paid for themselves in 3-4 months. In addition, three new wells in Pembina came on in July and are even outperforming the wells drilled in the first quarter. Management announced that it now plans to replace three wells planned for the Willesden Green with wells in the Pembina play.

    High production means high cash flow and earnings.  Adjusted funds flow (AFF) for the quarter was $8.2 million ($0.12) up 730% y-o-y and 34% sequentially and above the $6.4 million ($0.09) in our models. Net income was $0.8 million ($0.02) after excluding nonrecurring items, well surpassing previous periods and our forecast of ($0.7 million) or ($0.01). Realized prices and operating netbacks were …


This Company Sponsored Research is provided by Noble Capital Markets, Inc., a FINRA and S.E.C. registered broker-dealer (B/D).

*Analyst certification and important disclosures included in the full report. NOTE: investment decisions should not be based upon the content of this research summary.  Proper due diligence is required before making any investment decision. 

Seanergy Maritime (SHIP) – Stock Buyback Another Sign of Financial Stability

Thursday, August 12, 2021

Seanergy Maritime (SHIP)
Stock Buyback Another Sign of Financial Stability

Seanergy Maritime Holdings Corp., an international shipping company, provides marine dry bulk transportation services through the ownership and operation of dry bulk vessels. Seanergy Maritime Holdings Corp. is the only pure-play Capesize shipping company listed in the US capital markets. Seanergy provides marine dry bulk transportation services through a modern fleet of 10 Capesize vessels, with total capacity of approximately 1,748,581 dwt and an average fleet age of about 9.8 years. The Company is incorporated in the Marshall Islands with executive offices in Athens, Greece and an office in Hong Kong. The Company’s common shares trade on the Nasdaq Capital Market under the symbol “SHIP” and class A warrants under “SHIPW”.

Poe Fratt, Senior Research Analyst, Noble Capital Markets, Inc.

Refer to the full report for the price target, fundamental analysis, and rating.

    Stock buy back program announced. The Board of Directors approved a stock buy back program of up to $17 million. At the current price, the buy back equals ~16.4 million shares, or close to 10% of the current shares outstanding of ~168.5 million. We believe that this positive move should help support the stock price, especially if the buy back program is active.

    Buy back program reinforces our view that equity issuance near the current price is unlikely.  As highlighted in recent notes, the financial position has improved markedly, and we believe that no additional equity will be issued despite the F-3 filing on July 2nd. After pending transactions close, pro forma 3Q2021 cash should be $45-$50 million, or close to 2Q2021 cash of $56 million. Financial …


This research is provided by Noble Capital Markets, Inc., a FINRA and S.E.C. registered broker-dealer (B/D).

*Analyst certification and important disclosures included in the full report. NOTE: investment decisions should not be based upon the content of this research summary.  Proper due diligence is required before making any investment decision. 

Release – Capstone Green Energy (NASDAQ:CGRN) Reports First Quarter Fiscal 2022 Financial Results


Capstone Green Energy (NASDAQ:CGRN) Reports First Quarter Fiscal 2022 Financial Results


Total Revenue Grew 13% Year-Over-Year

Cash and Cash Equivalents of $49.2M

Book-to-Bill Ratio of 1:1 for the Quarter with New Gross Product Orders of $8.2M

Webcast to be Held Today, August 11, 2021 at 1:45 PM PT; 4:45 PM ET

VAN NUYS, CA / ACCESSWIRE / August 11, 2021 / Capstone Green Energy Corporation (NASDAQ:CGRN), formerly Capstone Turbine Corporation (NASDAQ:CPST) (“Capstone,” the “Company,” “we” or “us”), a global leader in carbon reduction and on-site resilient green energy solutions, today announced financial results for its fiscal year 2022 first quarter ended June 30, 2021.

Financial Highlights of Fiscal Year 2022 First Quarter:

  • Total revenue in the quarter was $16.1 million, up 13%, compared to $14.2 million in the first quarter last year as orders and shipments gradually started to rebound despite continued negative impacts from the ongoing COVID-19 global pandemic.
  • The book-to-bill ratio was 1:1 for the quarter, and new gross product orders were $8.2 million despite continued negative global impacts from the ongoing COVID-19 global pandemic in key markets like Europe, Latin America, Asia, and Australia.
  • The long-term microturbine rental fleet increased 1.5 megawatts (MWs) to 12.1 MWs from 10.6 MWs during the quarter as the Company continues to execute against its plan to increase the fleet to 21.1 MWs by March 31, 2022.
  • Total cash and cash equivalents as of June 30, 2021, were $49.2 million, a decrease of $0.3 million, compared to $49.5 million as of March 31, 2021.
  • Cash provided by financing activities was $11.0 million during the quarter, as the Company continued to focus on strengthening liquidity as it accelerates the expansion of the long-term rental fleet.
  • Net loss of $2.2 million for the quarter, compared to a net loss of $1.8 million in the first quarter of fiscal 2021.
  • Adjusted EBITDA of negative $2.3 million, compared to Adjusted EBITDA of $0.1 million in the first quarter of fiscal 2021.

“I am pleased that we were again able to drive year-over-year revenue growth as the global recovery from the COVID-19 global pandemic continued to evolve, and we executed upon our revenue growth strategy,” said Darren Jamison, President and Chief Executive Officer of Capstone Green Energy. “We also announced during the quarter that we expanded our long-term rental fleet from 10.6 megawatts to 12.1 megawatts as we march towards our goal of growing the fleet to 21.1 megawatts by the end of our fiscal year. This remains a key driver in our long-term strategy, as rental-related revenue drives a much higher margin than a typical product sale. This, along with our Factory Protection Plan program, are important supporting pillars in growing our Energy as a Service business,” added Mr. Jamison.

“We also took steps during the quarter to expand our direct solutions sales team as their effort in the field is creating a robust project pipeline. We are excited for the second half of the year as we expect to start to close on potential projects deploying not only our existing microturbine technology, but the new energy products and service offerings we added on the back of our evolution into Capstone Green Energy Corporation, announced on Earth Day in April 2021,” concluded Mr. Jamison.

Financial Results for Fiscal Year 2022 First Quarter

Total revenue for the quarter increased $1.9 million to $16.1 million, compared with total revenue of $14.2 million in the year-ago quarter. The increase in revenue was the result of higher MWs shipped, as the year-ago quarter was more negatively impacted by the global COVID-19 pandemic.

Gross margin decreased $0.8 million, to $2.6 million in the first quarter compared to $3.4 million in the same period last year, primarily due to lower overhead expenses in the prior period as a result of the Company’s COVID-19 Business Continuity Plan, which consisted of pay cuts, furloughs, and other cost-cutting measures.

Gross margin as a percentage of revenue decreased to 16% in the first quarter, compared to 24% in the same period last year, primarily due to lower overhead expenses in the prior period as a result of the Company’s COVID-19 Business Continuity Plan. Additionally, Factory Protection Plan margins were higher in the prior-year period primarily due to site shutdowns caused by the pandemic, which delayed servicing events.

Operating expenses in the first quarter of fiscal year 2022 were $6.2 million, an increase of $2.3 million from $3.9 million in the year-ago quarter, as the year-ago quarter had reduced expenses from the COVID-19 Business Continuity Plan, which reduced operating expenses and increased working capital during the pandemic.

Net loss was $2.2 million for the first quarter of fiscal year 2022, compared to a net loss of $1.8 million in the year-ago quarter. Net loss per share improved to $0.16 cents per share compared to $0.17 cents in the year-ago quarter. Adjusted EBITDA was negative $2.3 million for the first quarter of fiscal year 2022, compared to an adjusted EBITDA of $0.1 million in the year-ago quarter.

Cash and cash equivalents were $49.2 million as of June 30, 2021, compared to $49.5 million as of March 31, 2021.

Conference Call and Webcast

Capstone will host a live webcast on August 11, 2021, at 1:45 PM Pacific Time (4:45 PM Eastern Time) to provide the results of the fiscal year 2022 first quarter ended June 30, 2021. Capstone will discuss its financial results and will provide an update on its business activities. At the end of the conference call, Capstone will host a question-and-answer session to provide an opportunity for financial analysts to ask questions. Investors and interested individuals are invited to listen to the webcast by logging on to Capstone’s investor relation’s webpage at www.CapstoneGreenEnergy.com. A replay of the webcast will be available on the website for 30 days.

About Capstone Green Energy

Capstone Green Energy (NASDAQ:CGRN) is a leading provider of customized microgrid solutions and on-site energy technology systems focused on helping customers around the globe meet their environmental, energy savings, and resiliency goals. Capstone Green Energy focuses on four key business lines. Through its Energy as a Service (EaaS) business, it offers rental solutions utilizing its microturbine energy systems and battery storage systems, comprehensive Factory Protection Plan (FPP) service contracts that guarantee life-cycle costs, as well as aftermarket parts. Energy Conversion Products are driven by the Company’s industry-leading, highly efficient, low-emission, resilient microturbine energy systems offering scalable solutions in addition to a broad range of customer-tailored solutions, including hybrid energy systems and larger frame industrial turbines. The Energy Storage Products business line designs and installs microgrid storage systems creating customized solutions using a combination of battery technologies and monitoring software. Through Hydrogen Energy Solutions, Capstone Green Energy offers customers a variety of hydrogen products, including the Company’s microturbine energy systems.

For customers with limited capital or short-term needs, Capstone offers rental systems; for more information, contact: rentals@CGRNenergy.com. To date, Capstone has shipped over 10,000 units to 83 countries and estimates that, in FY21, it saved customers over $217 million in annual energy costs and approximately 397,000 tons of carbon. Total savings over the last three years are estimated to be approximately $698 million in energy savings and approximately 1,115,100 tons of carbon savings.

For more information about the Company, please visit: www.CapstoneGreenEnergy.com. Follow Capstone Green Energy on TwitterLinkedInInstagramFacebook, and YouTube.

Cautionary Note Regarding Forward-Looking Statements

This release contains forward-looking statements as defined in the Private Securities Litigation Reform Act of 1995, including statements regarding expectations for green initiatives and execution on the Company’s growth strategy and other statements regarding the Company’s expectations, beliefs, plans, intentions, and strategies. The Company has tried to identify these forward-looking statements by using words such as “expect,” “anticipate,” “believe,” “could,” “should,” “estimate,” “intend,” “may,” “will,” “plan,” “goal” and similar terms and phrases, but such words, terms and phrases are not the exclusive means of identifying such statements. Actual results, performance and achievements could differ materially from those expressed in, or implied by, these forward-looking statements due to a variety of risks, uncertainties and other factors, including, but not limited to, the following: the ongoing effects of the COVID-19 pandemic; the availability of credit and compliance with the agreements governing the Company’s indebtedness; the Company’s ability to develop new products and enhance existing products; product quality issues, including the adequacy of reserves therefor and warranty cost exposure; intense competition; financial performance of the oil and natural gas industry and other general business, industry and economic conditions; the Company’s ability to adequately protect its intellectual property rights; and the impact of pending or threatened litigation. For a detailed discussion of factors that could affect the Company’s future operating results, please see the Company’s filings with the Securities and Exchange Commission, including the disclosures under “Risk Factors” in those filings. Except as expressly required by the federal securities laws, the Company undertakes no obligation to update or revise any forward-looking statements, whether as a result of new information, changed circumstances or future events, or for any other reason.

Financial Tables to Follow

CAPSTONE GREEN ENERGY CORPORATION AND SUBSIDIARIES
CONDENSED CONSOLIDATED BALANCE SHEETS
(In thousands, except share amounts)
(Unaudited)
June 30, March 31,
2021 2021
Assets
Current Assets:
Cash and cash equivalents
$ 49,216 $ 49,533
Accounts receivable, net of allowances of $324 at June 30, 2021 and $314 at March 31, 2021
23,871 20,593
Inventories, net
14,937 11,829
Prepaid expenses and other current assets
5,718 4,953
Total current assets
93,742 86,908
Property, plant, equipment and rental assets, net
10,669 9,630
Non-current portion of inventories
1,802 1,845
Other assets
7,497 7,639
Total assets
$ 113,710 $ 106,022
Liabilities and Stockholders’ Equity
Current Liabilities:
Accounts payable and accrued expenses
$ 22,396 $ 19,767
Accrued salaries and wages
1,565 1,889
Accrued warranty reserve
3,904 5,850
Deferred revenue
6,000 6,374
Current portion of notes payable and lease obligations
1,097 576
Total current liabilities
34,962 34,456
Deferred revenue – non-current
734 765
Term note payable, net
50,923 52,865
Long-term portion of notes payable and lease obligations
4,589 4,762
Total liabilities
91,208 92,848
Commitments and contingencies
Stockholders’ Equity:
Preferred stock, $.001 par value; 1,000,000 shares authorized; none issued
Common stock, $.001 par value; 51,500,000 shares authorized, 15,206,891 shares issued and 15,128,731 shares outstanding at June 30, 2021; 12,898,144 shares issued and 12,824,190 shares outstanding at March 31, 2021
15 13
Additional paid-in capital
945,918 934,381
Accumulated deficit
(921,453 ) (919,271 )
Treasury stock, at cost; 78,160 shares at June 30, 2021 and 73,954 shares at March 31, 2021
(1,978 ) (1,949 )
Total stockholders’ equity
22,502 13,174
Total liabilities and stockholders’ equity
$ 113,710 $ 106,022
CAPSTONE GREEN ENERGY CORPORATION AND SUBSIDIARIES
CONDENSED CONSOLIDATED STATEMENTS OF OPERATIONS
(In thousands, except per share data)
(Unaudited)
Three Months Ended
June 30,
2021 2020
Revenue:
Product and accessories
$ 8,389 $ 6,606
Parts and service
7,693 7,587
Total revenue
16,082 14,193
Cost of goods sold:
Product and accessories
8,992 6,800
Parts and service
4,442 4,020
Total cost of goods sold
13,434 10,820
Gross margin
2,648 3,373
Operating expenses:
Research and development
883 370
Selling, general and administrative
5,324 3,546
Total operating expenses
6,207 3,916
Loss from operations
(3,559 ) (543 )
Other income
665 4
Interest income
5 8
Interest expense
(1,235 ) (1,291 )
Gain on debt extinguishment
1,950
Loss before provision for income taxes
(2,174 ) (1,822 )
Provision for income taxes
8 1
Net loss
(2,182 ) (1,823 )
Net loss per common share attributable to common stockholders-basic and diluted
$ (0.16 ) $ (0.17 )
Weighted average shares used to calculate basic and diluted net loss per common share attributable to common stockholders
13,226 10,598
CAPSTONE GREEN ENERGY CORPORATION AND SUBSIDIARIES
RECONCILIATION OF NON-GAAP FINANCIAL MEASURE
(In thousands, except per share data)
(Unaudited)

Three months ended
Reconciliation of Reported Net Loss to EBITDA and Adjusted EBITDA
June 30,
2021 2020
Net loss, as reported
$ (2,182 ) $ (1,823 )
Interest expense
1,235 1,291
Provision for income taxes
8 1
Depreciation and amortization
386 354
EBITDA
$ (553 ) $ (177 )
Gain on debt extinguishment
(1,950 )
Additional PPP loan forgiveness
(660 )
Stock-based compensation and other expense
870 298
Adjusted EBITDA
$ (2,293 ) $ 121

To supplement the company’s unaudited financial data presented on a generally accepted accounting principles (GAAP) basis, management has presented Adjusted EBITDA, a non-GAAP financial measure. This non-GAAP financial measure is among the indicators management uses as a basis for evaluating the company’s financial performance as well as for forecasting future periods. Management establishes performance targets, annual budgets and makes operating decisions based in part upon this metric. Accordingly, disclosure of this non-GAAP financial measure provides investors with the same information that management uses to understand the company’s economic performance year-over-year.

EBITDA is defined as net income before interest, provision for income taxes, and depreciation and amortization expense. Adjusted EBITDA is defined as EBITDA before gain on debt extinguishment, additional PPP loan forgiveness and stock-based compensation and other expense. Gain on debt extinguishment and additional PPP loan forgiveness relates to the Paycheck Protection Program loan forgiveness. Stock-based compensation and other expense includes expense related to stock issued to employees, directors, and vendors.

Adjusted EBITDA is not a measure of the company’s liquidity or financial performance under GAAP and should not be considered as an alternative to, net income or any other performance measure derived in accordance with GAAP, or as an alternative to cash flows from operating activities as a measure of its liquidity.

While management believes that the non-GAAP financial measure provides useful supplemental information to investors, there are limitations associated with the use of this measure. The measures are not prepared in accordance with GAAP and may not be directly comparable to similarly titled measures of other companies due to potential differences in the exact method of calculation. Management compensates for these limitations by relying primarily on the company’s GAAP results and by using Adjusted EBITDA only supplementally and by reviewing the reconciliations of the non-GAAP financial measure to its most comparable GAAP financial measure.

Non-GAAP financial measures are not in accordance with, or an alternative for, generally accepted accounting principles in the United States. The company’s non-GAAP financial measures are not meant to be considered in isolation or as a substitute for comparable GAAP financial measures and should be read only in conjunction with the company’s consolidated financial statements prepared in accordance with GAAP.

CONTACT:
Capstone Green Energy
Investor and investment media inquiries:
818-407-3628
ir@CGRNenergy.com

SOURCE: Capstone Green Energy Corporation

Release – Kelly Reports Second-Quarter 2021 Earnings and Announces Dividend


Kelly Reports Second-Quarter 2021 Earnings and Announces Dividend


Financial Highlights

  • Q2 revenue up 29.0%; 26.2% in constant currency
  • Q2 operating earnings of $13.7 million; up 24.1% from a year ago
  • Q2 earnings per share of $0.60 down from $1.04 a year ago; adjusted EPS of $0.49 compared to $0.51

TROY, Mich., Aug. 12, 2021 (GLOBE NEWSWIRE) — Kelly (Nasdaq: KELYA) (Nasdaq: KELYB), a leading specialty talent solutions provider, today announced results for the second quarter of 2021.

Peter Quigley, president and chief executive officer, announced revenue for the second quarter of 2021 totaled $1.3 billion, a 29.0% increase compared to the corresponding quarter of 2020. Revenue improved year-over-year in the quarter reflecting increased customer demand compared to the COVID-19-impacted prior year period.

Earnings from operations in the second quarter of 2021 totaled $13.7 million, compared to earnings of $11.1 million reported in the second quarter of 2020.

Diluted earnings per share in the second quarter of 2021 were $0.60 compared to $1.04 per share in the second quarter of 2020. Included in the earnings per share is a non-cash gain per share, net of tax, on Kelly’s investment in Persol Holdings common stock of $0.11 in the second quarter of 2021 and $0.52 in the second quarter of 2020. On an adjusted basis, earnings per share were $0.49 in the second quarter of 2021 compared to $0.51 in the corresponding quarter of 2020.

“All five of our operating segments—Professional & Industrial (P&I); Science, Engineering & Technology (SET); Education; OCG; and International—delivered organic year-over-year revenue growth in the second quarter as the recovery gained momentum,” said Quigley. “OCG continues to exceed pre-COVID growth rates; Education exited the quarter on track with 2019 revenue; our International and SET segments delivered solid specialty growth; and our Softworld acquisition is already delivering top- and bottom-line results for the enterprise. Demand is strong in our P&I segment, though it will take longer to fully recover. We’re encouraged by the healthy sales pipelines and new wins we’re seeing across all of our businesses. Our reinstatement of a dividend for the quarter reflects the progress we’re making with our specialization and M&A strategies, and our confidence in the economic recovery. Kelly is well-positioned for the future and ready for what’s next.”

Kelly also reported that on August 11, its board of directors declared a dividend of $0.05 per share. The dividend is payable on September 7, 2021 to stockholders of record as of the close of business on August 25, 2021.

In conjunction with its second quarter earnings release, Kelly has published a financial presentation on the Investor Relations page of its public website and will host a conference call at 9 a.m. ET on August 12 to review the results and answer questions. The call may be accessed in one of the following ways:

Via the Internet:
Kellyservices.com

Via the Telephone
(877) 692-8955 (toll free) or (234) 720-6979 (caller paid)
Enter access code 5728672
After the prompt, please enter “#”

A recording of the conference call will be available after 2:30 p.m. ET on August 12, 2021, at (866) 207-1041 (toll-free) and (402) 970-0847 (caller-paid). The access code is 8454029#. The recording will also be available at kellyservices.com during this period.

This release contains statements that are forward looking in nature and, accordingly, are subject to risks and uncertainties. These factors include, but are not limited to, changing market and economic conditions, the recent novel coronavirus (COVID-19) outbreak, competitive market pressures including pricing and technology introductions and disruptions, disruption in the labor market and weakened demand for human capital resulting from technological advances, competition law risks, the impact of changes in laws and regulations (including federal, state and international tax laws), unexpected changes in claim trends on workers’ compensation, unemployment, disability and medical benefit plans, or the risk of additional tax liabilities in excess of our estimates, our ability to achieve our business strategy, our ability to successfully develop new service offerings, material changes in demand from or loss of large corporate customers as well as changes in their buying practices, risks particular to doing business with government or government contractors, the risk of damage to our brand, our exposure to risks associated with services outside traditional staffing, including business process outsourcing, services of licensed professionals and services connecting talent to independent work, our increasing dependency on third parties for the execution of critical functions, our ability to effectively implement and manage our information technology strategy, the risks associated with past and future acquisitions, including risk of related impairment of goodwill and intangible assets, exposure to risks associated with investments in equity affiliates including PersolKelly Pte. Ltd., risks associated with conducting business in foreign countries, including foreign currency fluctuations, the exposure to potential market and currency exchange risks relating to our investment in Persol Holdings, risks associated with violations of anti-corruption, trade protection and other laws and regulations, availability of qualified full-time employees, availability of temporary workers with appropriate skills required by customers, liabilities for employment-related claims and losses, including class action lawsuits and collective actions, our ability to sustain critical business applications through our key data centers, risks arising from failure to preserve the privacy of information entrusted to us or to meet our obligations under global privacy laws, the risk of cyberattacks or other breaches of network or information technology security, our ability to realize value from our tax credit and net operating loss carryforwards, our ability to maintain specified financial covenants in our bank facilities to continue to access credit markets, and other risks, uncertainties and factors discussed in this release and in the Company’s filings with the Securities and Exchange Commission. Actual results may differ materially from any forward-looking statements contained herein, and we undertake no duty to update any forward-looking statement to conform the statement to actual results or changes in the Company’s expectations.

About Kelly®

Kelly Services, Inc. (Nasdaq: KELYA, KELYB) connects talented people to companies in need of their skills in areas including Science, Engineering, Education, Office, Contact Center, Light Industrial, and more. We’re always thinking about what’s next in the evolving world of work, and we help people ditch the script on old ways of thinking and embrace the value of all workstyles in the workplace. We directly employ nearly 370,000 people around the world, and we connect thousands more with work through our global network of talent suppliers and partners in our outsourcing and consulting practice. Revenue in 2020 was $4.5 billion. Visit kellyservices.com and let us help with what’s next for you.


MEDIA CONTACT:     ANALYST CONTACT:
Jane Stehney     James Polehna
(248) 765-6864     (248) 244-4586
stehnja@kellyservices.com     james.polehna@kellyservices.com


KELLY SERVICES, INC. AND SUBSIDIARIES
CONSOLIDATED STATEMENTS OF EARNINGS
FOR THE 13 WEEKS ENDED JULY 4, 2021 AND JUNE 28, 2020
(UNAUDITED)
(In millions of dollars except per share data)
                %   CC %  
    2021   2020   Change   Change   Change  
                       
Revenue from services $ 1,258.1   $ 975.3   $ 282.8     29.0   % 26.2   %
                       
Cost of services   1,027.1     786.1     241.0     30.7        
                       
Gross profit   231.0     189.2     41.8     22.1     19.6    
                       
Selling, general and administrative expenses   217.3     178.1     39.2     21.9     19.8    
                       
Earnings (loss) from operations   13.7     11.1     2.6     24.1        
                       
Gain (loss) on investment in Persol Holdings   6.3     29.6     (23.3 )   (78.8 )      
                       
Other income (expense), net   (0.3 )   2.6     (2.9 )   (109.0 )      
                       
Earnings (loss) before taxes and equity in net earnings (loss) of affiliate   19.7     43.3     (23.6 )   (54.4 )      
                       
Income tax expense (benefit)   (2.6 )   0.9     (3.5 )   (406.2 )      
                       
Net earnings (loss) before equity in net earnings (loss) of affiliate   22.3     42.4     (20.1 )   (47.2 )      
                       
Equity in net earnings (loss) of affiliate   1.7     (1.3 )   3.0     NM      
                       
Net earnings (loss) $ 24.0   $ 41.1   $ (17.1 )   (41.6 )      
                       
Basic earnings (loss) per share $ 0.60   $ 1.04   $ (0.44 )   (42.3 )      
Diluted earnings (loss) per share $ 0.60   $ 1.04   $ (0.44 )   (42.3 )      
                       
                       
STATISTICS:                      
                       
Permanent placement revenue (included in revenue from services) $ 18.6   $ 7.6   $ 11.0     146.1   % 139.8   %
                       
Gross profit rate   18.4   % 19.4   % (1.0 ) pts.        
                       
Conversion rate   5.9   % 5.8   % 0.1   pts.        
                       
Adjusted EBITDA $ 22.2   $ 16.9   $ 5.3            
Adjusted EBITDA margin   1.8   % 1.7   % 0.1   pts.        
                       
Effective income tax rate   (13.5 ) % 2.0   % (15.5 ) pts.        
                       
Average number of shares outstanding (millions):                      
Basic   39.4     39.3                
Diluted   39.5     39.4                


KELLY SERVICES, INC. AND SUBSIDIARIES
CONSOLIDATED STATEMENTS OF EARNINGS
FOR THE 26 WEEKS ENDED JULY 4, 2021 AND JUNE 28, 2020
(UNAUDITED)
(In millions of dollars except per share data)
                %   CC %  
    2021   2020   Change   Change   Change  
                       
Revenue from services $ 2,464.0   $ 2,236.4   $ 227.6     10.2   % 8.3   %
                       
Cost of services   2,019.7     1,823.9     195.8     10.7        
                       
Gross profit   444.3     412.5     31.8     7.7     5.9    
                       
Selling, general and administrative expenses   420.0     397.6     22.4     5.6     4.0    
                       
Goodwill impairment charge       147.7     (147.7 )   NM      
                       
Gain on sale of assets       (32.1 )   32.1     NM      
                       
Earnings (loss) from operations   24.3     (100.7 )   125.0     NM      
                       
Gain (loss) on investment in Persol Holdings   36.3     (48.2 )   84.5     NM      
                       
Other income (expense), net   (3.7 )   4.3     (8.0 )   (185.8 )      
                       
Earnings (loss) before taxes and equity in net earnings (loss) of affiliate   56.9     (144.6 )   201.5     NM      
                       
Income tax expense (benefit)   7.9     (35.3 )   43.2     122.2        
                       
Net earnings (loss) before equity in net earnings (loss) of affiliate   49.0     (109.3 )   158.3     NM      
                       
Equity in net earnings (loss) of affiliate   0.6     (2.8 )   3.4     NM      
                       
Net earnings (loss) $ 49.6   $ (112.1 ) $ 161.7     NM      
                       
Basic earnings (loss) per share $ 1.25   $ (2.86 ) $ 4.11     NM      
Diluted earnings (loss) per share $ 1.25   $ (2.86 ) $ 4.11     NM      
                       
                       
STATISTICS:                      
                       
Permanent placement revenue (included in revenue from services) $ 34.6   $ 19.8   $ 14.8     74.1   % 70.0   %
                       
Gross profit rate   18.0   % 18.4   % (0.4 ) pts.        
                       
Conversion rate   5.5   % (24.4 ) % 29.9   pts.        
                       
Adjusted EBITDA $ 39.1   $ 35.4   $ 3.7            
Adjusted EBITDA margin   1.6   % 1.6   %   pts.        
                       
Effective income tax rate   13.8   % 24.5   % (10.7 ) pts.        
                       
Average number of shares outstanding (millions):                      
Basic   39.4     39.2                
Diluted   39.5     39.2                


KELLY SERVICES, INC. AND SUBSIDIARIES
RESULTS OF OPERATIONS BY SEGMENT
(UNAUDITED)
(In millions of dollars)
                     
    Second Quarter
                     
              %   CC %  
    2021     2020   Change   Change  
Professional & Industrial                    
Revenue from services $ 466.5     $ 406.4     14.8   % 14.0   %
Gross profit   75.2       78.9     (4.7 )   (5.5 )  
SG&A expenses excluding restructuring charges   69.0       64.6     6.8     6.2    
Restructuring charges             NM   NM  
Total SG&A expenses   69.0       64.6     6.9     6.2    
Earnings (loss) from operations   6.2       14.3     (57.0 )      
Earnings (loss) from operations excluding restructuring charges   6.2       14.3     (56.9 )      
                     
Gross profit rate   16.1   %   19.4   % (3.3 ) pts.    
                     
Science, Engineering & Technology                    
Revenue from services $ 298.2     $ 247.3     20.6   % 20.1   %
Gross profit   66.5       50.6     31.5     31.1    
SG&A expenses excluding restructuring charges   46.9       31.3     49.7     49.3    
Restructuring charges             NM   NM  
Total SG&A expenses   46.9       31.3     49.7     49.3    
Earnings (loss) from operations   19.6       19.3     1.8        
Earnings (loss) from operations excluding restructuring charges   19.6       19.3     1.8        
                     
Gross profit rate   22.3   %   20.4   % 1.9   pts.    
                     
Education                    
Revenue from services $ 105.9     $ 25.1     322.1   % 322.1   %
Gross profit   16.8       4.3     291.1     291.1    
SG&A expenses excluding restructuring charges   15.3       9.6     60.0     60.0    
Restructuring charges         (0.1 )   NM   NM  
Total SG&A expenses   15.3       9.5     60.5     60.5    
Earnings (loss) from operations   1.5       (5.2 )   NM      
Earnings (loss) from operations excluding restructuring charges   1.5       (5.3 )   NM      
                     
Gross profit rate   15.8   %   17.1   % (1.3 ) pts.    
                     
Outsourcing & Consulting                    
Revenue from services $ 107.3     $ 83.6     28.2   % 26.1   %
Gross profit   34.8       29.2     19.3     15.7    
SG&A expenses excluding restructuring charges   30.1       25.1     19.8     17.0    
Restructuring charges             NM   NM  
Total SG&A expenses   30.1       25.1     19.7     17.0    
Earnings (loss) from operations   4.7       4.1     16.2        
Earnings (loss) from operations excluding restructuring charges   4.7       4.1     15.9        
                     
Gross profit rate   32.5   %   34.9   % (2.4 ) pts.    
                     
International                    
Revenue from services $ 280.4     $ 213.0     31.6   % 21.6   %
Gross profit   37.7       26.2     43.8     32.9    
SG&A expenses excluding restructuring charges   34.6       28.3     22.3     13.3    
Restructuring charges             NM   NM  
Total SG&A expenses   34.6       28.3     22.3     13.3    
Earnings (loss) from operations   3.1       (2.1 )   NM      
Earnings (loss) from operations excluding restructuring charges   3.1       (2.1 )   NM      
                     
Gross profit rate   13.4   %   12.3   % 1.1   pts.    


KELLY SERVICES, INC. AND SUBSIDIARIES
RESULTS OF OPERATIONS BY SEGMENT
(UNAUDITED)
(In millions of dollars)
                     
    June Year to Date
                     
              %   CC %  
    2021     2020   Change   Change  
Professional & Industrial                    
Revenue from services $ 934.1     $ 900.2     3.8   % 3.2   %
Gross profit   151.1       164.0     (7.9 )   (8.4 )  
SG&A expenses excluding restructuring charges   138.4       140.7     (1.7 )   (2.1 )  
Restructuring charges         4.4     NM   NM  
Total SG&A expenses   138.4       145.1     (4.6 )   (5.0 )  
Earnings (loss) from operations   12.7       18.9     (32.9 )      
Earnings (loss) from operations excluding restructuring charges   12.7       23.3     (45.4 )      
                     
Gross profit rate   16.2   %   18.2   % (2.0 ) pts.    
                     
Science, Engineering & Technology                    
Revenue from services $ 552.9     $ 517.5     6.8   % 6.5   %
Gross profit   119.7       105.3     13.7     13.4    
SG&A expenses excluding restructuring charges   82.6       67.3     22.8     22.5    
Restructuring charges         0.5     NM   NM  
Total SG&A expenses   82.6       67.8     21.8     21.5    
Earnings (loss) from operations   37.1       37.5     (1.1 )      
Earnings (loss) from operations excluding restructuring charges   37.1       38.0     (2.5 )      
                     
Gross profit rate   21.6   %   20.3   % 1.3   pts.    
                     
Education                    
Revenue from services $ 217.5     $ 167.6     29.8   % 29.8   %
Gross profit   34.0       24.7     37.6     37.6    
SG&A expenses excluding restructuring charges   29.5       25.3     16.8     16.8    
Restructuring charges         0.8     NM   NM  
Total SG&A expenses   29.5       26.1     12.9     12.9    
Earnings (loss) from operations   4.5       (1.4 )   NM      
Earnings (loss) from operations excluding restructuring charges   4.5       (0.6 )   NM      
                     
Gross profit rate   15.6   %   14.7   % 0.9   pts.    
                     
Outsourcing & Consulting                    
Revenue from services $ 206.6     $ 173.1     19.3   % 17.5   %
Gross profit   66.1       58.0     14.1     11.0    
Total SG&A expenses   58.5       53.7     8.9     6.6    
Earnings (loss) from operations   7.6       4.3     78.9        
                     
Gross profit rate   32.0   %   33.5   % (1.5 ) pts.    
                     
International                    
Revenue from services $ 553.3     $ 478.2     15.7   % 9.0   %
Gross profit   73.4       60.5     21.3     13.9    
SG&A expenses excluding restructuring charges   67.7       60.4     12.0     5.1    
Restructuring charges         1.1     NM   NM  
Total SG&A expenses   67.7       61.5     10.1     3.3    
Earnings (loss) from operations   5.7       (1.0 )   NM      
Earnings (loss) from operations excluding restructuring charges   5.7       0.1     NM      
                     
Gross profit rate   13.3   %   12.7   % 0.6   pts.    


KELLY SERVICES, INC. AND SUBSIDIARIES
CONSOLIDATED BALANCE SHEETS
(UNAUDITED)
(In millions of dollars)
               
    July 4, 2021   January 3, 2021   June 28, 2020  
Current Assets              
Cash and equivalents $ 64.4   $ 223.0   $ 216.2    
Trade accounts receivable, less allowances of              
 $12.5, $13.3, and $11.2, respectively   1,362.5     1,265.2     1,085.0    
Prepaid expenses and other current assets   82.4     61.4     76.0    
Total current assets   1,509.3     1,549.6     1,377.2    
               
Noncurrent Assets              
Property and equipment, net   37.7     41.0     41.6    
Operating lease right-of-use assets   83.2     83.2     85.8    
Deferred taxes   302.9     282.0     265.9    
Goodwill, net   114.8     3.5        
Investment in Persol Holdings   187.7     164.2     127.2    
Investment in equity affiliate   120.0     118.5     113.6    
Other assets   391.3     319.9     307.4    
Total noncurrent assets   1,237.6     1,012.3     941.5    
               
Total Assets $ 2,746.9   $ 2,561.9   $ 2,318.7    
               
Current Liabilities              
Short-term borrowings $ 0.1   $ 0.3   $ 0.3    
Accounts payable and accrued liabilities   612.6     536.8     463.6    
Operating lease liabilities   19.6     19.6     19.5    
Accrued payroll and related taxes   337.0     293.0     210.7    
Accrued workers’ compensation and other claims   22.0     22.7     25.6    
Income and other taxes   62.6     53.2     71.7    
Total current liabilities   1,053.9     925.6     791.4    
               
Noncurrent Liabilities              
Operating lease liabilities   67.1     67.5     69.9    
Accrued payroll and related taxes   58.5     58.5     38.4    
Accrued workers’ compensation and other claims   40.8     42.2     45.6    
Accrued retirement benefits   214.6     205.8     180.8    
Other long-term liabilities   68.2     59.3     47.0    
Total noncurrent liabilities   449.2     433.3     381.7    
               
Stockholders’ Equity              
Common stock   40.1     40.1     40.1    
Treasury stock   (15.3 )   (17.1 )   (17.3 )  
Paid-in capital   22.3     21.3     20.5    
Earnings invested in the business   1,212.5     1,162.9     1,122.8    
Accumulated other comprehensive income (loss)   (15.8 )   (4.2 )   (20.5 )  
Total stockholders’ equity   1,243.8     1,203.0     1,145.6    
               
Total Liabilities and Stockholders’ Equity $ 2,746.9   $ 2,561.9   $ 2,318.7    
               
STATISTICS:              
Working Capital $ 455.4   $ 624.0   $ 585.8    
Current Ratio   1.4     1.7     1.7    
Debt-to-capital %   0.0   % 0.0   % 0.0   %
Global Days Sales Outstanding   60     64     61    
Year-to-Date Free Cash Flow $ 42.7   $ 170.5   $ 170.4    


KELLY SERVICES, INC. AND SUBSIDIARIES
CONSOLIDATED STATEMENTS OF CASH FLOWS
FOR THE 26 WEEKS ENDED JULY 4, 2021 AND JUNE 28, 2020
(UNAUDITED)
(In millions of dollars)
    2021   2020
Cash flows from operating activities:        
Net earnings (loss) $ 49.6   $ (112.1 )
Adjustments to reconcile net earnings (loss) to net cash from operating activities:        
Goodwill impairment charge       147.7  
Deferred income taxes on goodwill impairment charge       (23.0 )
Depreciation and amortization   14.1     12.0  
Operating lease asset amortization   10.7     10.5  
Provision for credit losses and sales allowances       0.1  
Stock-based compensation   2.8     2.4  
(Gain) loss on investment in Persol Holdings   (36.3 )   48.2  
Gain on sale of assets       (32.1 )
Equity in net (earnings) loss of PersolKelly Pte. Ltd.   (0.6 )   2.8  
Other, net   2.2     0.8  
Changes in operating assets and liabilities, net of acquisitions   5.1     120.8  
         
Net cash from operating activities   47.6     178.1  
         
Cash flows from investing activities:        
Capital expenditures   (4.9 )   (7.7 )
Proceeds from company-owned life insurance   10.4     2.3  
Proceeds from sale of assets       55.5  
Acquisition of companies, net of cash received   (219.0 )   (36.4 )
Proceeds (payments) related to loans with equity affiliate   5.8      
Proceeds from (investment in) equity securities   5.0      
Other investing activities   1.0     (0.4 )
         
Net cash (used in) from investing activities   (201.7 )   13.3  
         
Cash flows from financing activities:        
Net change in short-term borrowings   (0.1 )   (1.4 )
Financing lease payments   (0.3 )   (0.6 )
Payments of tax withholding for stock awards   (0.6 )   (1.1 )
Dividend payments       (3.0 )
Other financing activities       (0.1 )
         
Net cash used in financing activities   (1.0 )   (6.2 )
         
Effect of exchange rates on cash, cash equivalents and restricted cash   (2.3 )   5.7  
         
Net change in cash, cash equivalents and restricted cash   (157.4 )   190.9  
Cash, cash equivalents and restricted cash at beginning of period   228.1     31.0  
         
Cash, cash equivalents and restricted cash at end of period $ 70.7   $ 221.9  


KELLY SERVICES, INC. AND SUBSIDIARIES
REVENUE FROM SERVICES BY GEOGRAPHY
(UNAUDITED)
(In millions of dollars)
                   
    Second Quarter  
                   
            %   CC %  
    2021   2020   Change   Change  
                   
Americas                  
United States $ 894.6   $ 700.1     27.8   % 27.8   %
Canada   39.5     25.6     54.4     36.8    
Mexico   33.1     22.5     47.2     26.2    
Puerto Rico   26.9     20.0     34.3     34.3    
Brazil       6.1     NM   NM  
Total Americas Region   994.1     774.3            
                   
Europe                  
France   57.5     39.9     44.2     31.7    
Switzerland   54.0     47.4     13.8     7.5    
Portugal   40.6     23.8     70.7     55.9    
Russia   33.7     29.3     15.2     17.9    
Italy   19.4     13.3     46.1     33.6    
United Kingdom   17.7     17.8     (0.6 )   (11.8 )  
Germany   8.5     7.1     20.6     10.3    
Ireland   6.3     4.1     53.5     40.2    
Other   17.0     11.5     47.7     32.9    
Total Europe Region   254.7     194.2     31.2     22.3    
                   
Total Asia-Pacific Region   9.3     6.8     34.5     20.9    
                   
Total Kelly Services, Inc. $ 1,258.1   $ 975.3     29.0   % 26.2   %


KELLY SERVICES, INC. AND SUBSIDIARIES
REVENUE FROM SERVICES BY GEOGRAPHY
(UNAUDITED)
(In millions of dollars)
                   
    June Year to Date  
                   
            %   CC %  
    2021   2020   Change   Change  
                   
Americas                  
United States $ 1,753.1   $ 1,628.6     7.6   % 7.6   %
Canada   73.6     58.4     26.0     15.1    
Mexico   67.7     51.2     32.3     25.3    
Puerto Rico   51.1     37.7     35.3     35.3    
Brazil       15.2     NM   NM  
Total Americas Region   1,945.5     1,791.1     8.6     8.1    
                   
Europe                  
France   111.8     92.4     21.0     10.7    
Switzerland   106.7     91.6     16.4     9.6    
Portugal   84.3     67.4     25.1     14.5    
Russia   66.3     61.4     8.1     15.9    
Italy   37.5     28.0     33.9     22.6    
United Kingdom   34.7     40.1     (13.4 )   (21.4 )  
Germany   15.6     15.1     3.6     (5.2 )  
Ireland   11.4     9.1     25.6     14.9    
Other   32.6     26.7     22.1     11.9    
Total Europe Region   500.9     431.8     16.0     9.2    
                   
Total Asia-Pacific Region   17.6     13.5     29.8     16.9    
                   
Total Kelly Services, Inc. $ 2,464.0   $ 2,236.4     10.2   % 8.3   %


KELLY SERVICES, INC. AND SUBSIDIARIES
RECONCILIATION OF NON-GAAP MEASURES
SECOND QUARTER
(UNAUDITED)
(In millions of dollars)
       
  2021   2020
SG&A Expenses: As Reported   Adjusted
Professional & Industrial $ 69.0     $ 64.6  
Science, Engineering & Technology 46.9     31.3  
Education 15.3     9.6  
Outsourcing & Consulting 30.1     25.1  
International 34.6     28.3  
Corporate 21.4     19.4  
Total Company $ 217.3     $ 178.3  


  2021   2020
Earnings (loss) from Operations: As Reported   Adjusted
Professional & Industrial $ 6.2     $ 14.3  
Science, Engineering & Technology 19.6     19.3  
Education 1.5     (5.3 )
Outsourcing & Consulting 4.7     4.1  
International 3.1     (2.1 )
Corporate (21.4 )   (19.4 )
Total Company $ 13.7     $ 10.9  


KELLY SERVICES, INC. AND SUBSIDIARIES
RECONCILIATION OF NON-GAAP MEASURES
SECOND QUARTER
(UNAUDITED)
(In millions of dollars)
           
  2020
SG&A Expenses: As Reported   Restructuring(4)   Adjusted
Professional & Industrial $ 64.6     $     $ 64.6  
Science, Engineering & Technology 31.3         31.3  
Education 9.5     0.1     9.6  
Outsourcing & Consulting 25.1         25.1  
International 28.3         28.3  
Corporate 19.3     0.1     19.4  
Total Company $ 178.1     $ 0.2     $ 178.3  


  2020
Earnings (loss) from Operations: As Reported   Restructuring(4)   Adjusted
Professional & Industrial $ 14.3     $     $ 14.3  
Science, Engineering & Technology 19.3         19.3  
Education (5.2 )   (0.1 )   (5.3 )
Outsourcing & Consulting 4.1         4.1  
International (2.1 )       (2.1 )
Corporate (19.3 )   (0.1 )   (19.4 )
Total Company $ 11.1     $ (0.2 )   $ 10.9  


KELLY SERVICES, INC. AND SUBSIDIARIES
RECONCILIATION OF NON-GAAP MEASURES
JUNE YEAR TO DATE
(UNAUDITED)
(In millions of dollars)
       
  2021   2020
SG&A Expenses: As Reported   Adjusted
Professional & Industrial $ 138.4     $ 140.7  
Science, Engineering & Technology 82.6     67.3  
Education 29.5     25.3  
Outsourcing & Consulting 58.5     53.7  
International 67.7     60.4  
Corporate 43.3     41.7  
Total Company $ 420.0     $ 389.1  


  2021   2020
Earnings (loss) from Operations: As Reported   Adjusted
Professional & Industrial $ 12.7     $ 23.3  
Science, Engineering & Technology 37.1     38.0  
Education 4.5     (0.6 )
Outsourcing & Consulting 7.6     4.3  
International 5.7     0.1  
Corporate (43.3 )   (41.7 )
Total Company $ 24.3     $ 23.4  


KELLY SERVICES, INC. AND SUBSIDIARIES
RECONCILIATION OF NON-GAAP MEASURES
JUNE YEAR TO DATE
(UNAUDITED)
(In millions of dollars)
           
  2020
SG&A Expenses: As Reported   Restructuring(4)   Adjusted
Professional & Industrial $ 145.1     $ (4.4 )   $ 140.7  
Science, Engineering & Technology 67.8     (0.5 )   67.3  
Education 26.1     (0.8 )   25.3  
Outsourcing & Consulting 53.7         53.7  
International 61.5     (1.1 )   60.4  
Corporate 43.4     (1.7 )   41.7  
Total Company $ 397.6     $ (8.5 )   $ 389.1  


  2020
Earnings (loss) from Operations: As Reported   Goodwill
impairment
(1)
  Gain on sale
of assets(3)
  Restructuring(4)   Adjusted
Professional & Industrial $ 18.9     $     $     $ 4.4     $ 23.3  
Science, Engineering & Technology 37.5             0.5     38.0  
Education (1.4 )           0.8     (0.6 )
Outsourcing & Consulting 4.3                 4.3  
International (1.0 )           1.1     0.1  
Corporate (159.0 )   147.7     (32.1 )   1.7     (41.7 )
Total Company $ (100.7 )   $ 147.7     $ (32.1 )   $ 8.5     $ 23.4  


KELLY SERVICES, INC. AND SUBSIDIARIES
RECONCILIATION OF NON-GAAP MEASURES (continued)
(UNAUDITED)
(In millions of dollars except per share data)
                 
                 
    Second Quarter   June Year to Date
    2021   2020   2021   2020
Income tax expense (benefit)   $ (2.6 )   $ 0.9     $ 7.9     $ (35.3 )
Taxes on goodwill impairment charge(1)               23.0  
Taxes on investment in Persol Holdings(2)   (1.9 )   (9.0 )   (11.1 )   14.8  
Taxes on gain on sale of assets(3)               (8.1 )
Taxes on restructuring charges(4)               2.2  
Adjusted income tax expense (benefit)   $ (4.5 )   $ (8.1 )   $ (3.2 )   $ (3.4 )
                 
    Second Quarter   June Year to Date
    2021   2020   2021   2020
Net earnings (loss)   $ 24.0     $ 41.1     $ 49.6     $ (112.1 )
Goodwill impairment charge, net of taxes(1)               124.7  
(Gain) loss on investment in Persol Holdings, net of taxes(2)   (4.4 )   (20.6 )   (25.2 )   33.4  
Gain on sale of assets, net of taxes(3)               (24.0 )
Restructuring charges, net of taxes(4)       (0.2 )       6.3  
Adjusted net earnings   $ 19.6     $ 20.3     $ 24.4     $ 28.3  
                 
    Second Quarter   June Year to Date
    2021   2020   2021   2020
    Per Share   Per Share
Net earnings (loss)   $ 0.60     $ 1.04     $ 1.25     $ (2.86 )
Goodwill impairment charge, net of taxes(1)               3.18  
(Gain) loss on investment in Persol Holdings, net of taxes(2)   (0.11 )   (0.52 )   (0.63 )   0.85  
Gain on sale of assets, net of taxes(3)               (0.61 )
Restructuring charges, net of taxes(4)               0.16  
Adjusted net earnings   $ 0.49     $ 0.51     $ 0.61     $ 0.72  

Note: Earnings per share amounts for each quarter are required to be computed independently and may not equal the amounts computed for the total year.


KELLY SERVICES, INC. AND SUBSIDIARIES
RECONCILIATION OF NON-GAAP MEASURES (continued)
(UNAUDITED)
(In millions of dollars)
               
  Second Quarter   June Year to Date
  2021   2020   2021   2020
Net earnings (loss) $ 24.0       $ 41.1       $ 49.6       $ (112.1 )  
Other (income) expense, net 0.3       (2.6 )     3.7       (4.3 )  
Income tax expense (benefit) (2.6 )     0.9       7.9       (35.3 )  
Depreciation and amortization 8.5       6.0       14.8       12.0    
EBITDA 30.2       45.4       76.0       (139.7 )  
Equity in net (earnings) loss of affiliate (1.7 )     1.3       (0.6 )     2.8    
Goodwill impairment charge(1)                   147.7    
(Gain) loss on investment in Persol Holdings(2) (6.3 )     (29.6 )     (36.3 )     48.2    
Gain on sale of assets(3)                   (32.1 )  
Restructuring(4)       (0.2 )           8.5    
Adjusted EBITDA $ 22.2       $ 16.9       $ 39.1       $ 35.4    
Adjusted EBITDA margin 1.8   %   1.7   %   1.6   %   1.6   %


KELLY SERVICES, INC. AND SUBSIDIARIES
RECONCILIATION OF NON-GAAP MEASURES
(UNAUDITED)

Management believes that the non-GAAP (Generally Accepted Accounting Principles) information excluding the 2020 goodwill impairment charge, the 2021 and 2020 gains and losses on the investment in Persol Holdings, the 2020 gain on sale of assets and the 2020 restructuring charges, are useful to understand the Company’s fiscal 2021 financial performance and increases comparability. Specifically, Management believes that removing the impact of these items allows for a meaningful comparison of current period operating performance with the operating results of prior periods. Management also believes that such measures are used by those analyzing performance of companies in the staffing industry to compare current performance to prior periods and to assess future performance.

Management uses Adjusted EBITDA (adjusted earnings before interest, taxes, depreciation and amortization) and Adjusted EBITDA Margin (percent of total GAAP revenue) which Management believes is useful to compare operating performance compared to prior periods and uses it in conjunction with GAAP measures to assess performance. Our calculation of Adjusted EBITDA may not be consistent with similarly titled measures of other companies and should be used in conjunction with GAAP measurements.

These non-GAAP measures may have limitations as analytical tools because they exclude items which can have a material impact on cash flow and earnings per share. As a result, Management considers these measures, along with reported results, when it reviews and evaluates the Company’s financial performance. Management believes that these measures provide greater transparency to investors and provide insight into how Management is evaluating the Company’s financial performance. Non-GAAP measures should not be considered a substitute for, or superior to, measures of financial performance prepared in accordance with GAAP.

(1) The goodwill impairment charge is the result of an interim impairment test the Company performed during the first quarter of 2020, due to a triggering event caused by a decline in the Company’s common stock price.

(2) The gains and losses on the investment in Persol Holdings represent the change in fair value of the investment during the period presented and the related tax expense and benefit.

(3) Gain on sale of assets in 2020 primarily represents the excess of the proceeds over the cost of the headquarters properties sold during the first quarter of 2020.

(4) Restructuring charges in 2020 represent severance costs and lease terminations in preparation for the new operating model adopted in the third quarter of 2020.