COLA Increases for Seniors in 2022 Will Likely Top $68 Billion


Image Credit: Ron Latch (Pexels)


With Inflation Pushing Up the COLA on Social Security, Investing Where Seniors Spend Could Pay Off!


Retirees are likely to get a cost of living (COLA) increase greater than the last three years combined come January 2022. This will add up to an enormous amount of money. Many seniors have pent-up needs, after all, they’ve been tightening their belts as interest rates were pushed to near zero.  An inflation report last week (Aug. 11) released by the Bureau of Labor Statistics is the first of three which decides how much additional cash they’ll have to spend. It’s looking good for those over 62.


COLA Math

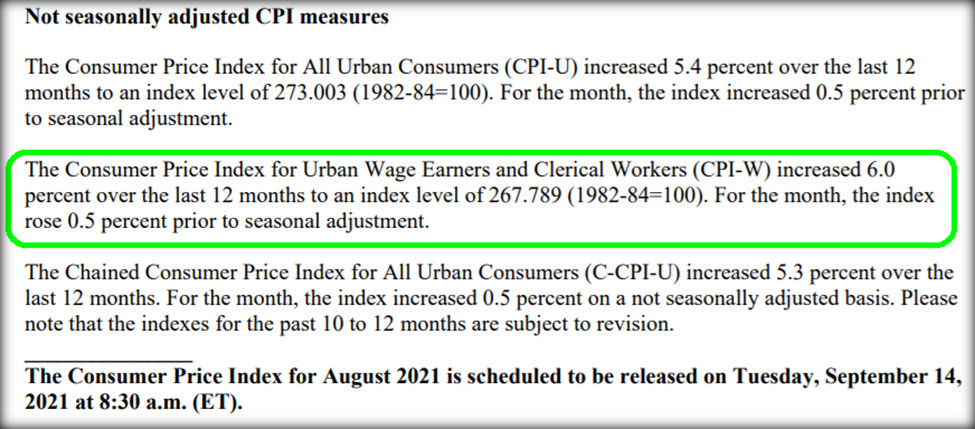
According to the Social Security (SSA) website, the basis for increasing Social Security payments is the change in inflation measured by CPI-W for the months of July, August, and September. These months are averaged for the current year and that average is the effective COLA beginning in January of the following year.


Source: Bureau of Labor Statistics CPI Report, Released August 11, 2021

On page 4 of the BLS report released last Wednesday, we can see that for the month of July, the first month that is weighted in the formula, the basket of goods measured has increased by 6%. If CPI-W drops to 0% for August and September, recipients will still get a 2% increase. This is already higher than last year (1.3%) and the year before (1.6%). Estimates are that August and September won’t see price increases slow, this has led to a range of forecasts for the Social Security COLA to be close to 6%. In June CPI-W increased by 6.1%. If the trend holds, a near 6% increase would add to more than the last three COLA adjustments combined.

The SSA website shows that for the last three years recipients received 2.8% in 2018, 1.6% in 2019, and 1.3% in 2020. The increases, even with compounding, only multiplies out to 5.80%.  

The average social security recipient receives $1,553.68 per month. A 6% increase for this group would be $93 additional monthly. On the high end, the maximum paid is $3,895 which would increase by $233.70. Neither of these is enough to lease a new Tesla, so what will Seniors be buying? The amount of money isn’t as small as it looks. The number of Americans collecting Social Security payments is 61.5 million. At an average increase of $93 per month, this will place an additional $68.6 billion into the economy next year, all primarily 62-years old and up.


Take-Away

The inflation that the economy has been experiencing, regardless of whether it is transitory or persistent, is likely to supply over 68 billion in additional cash to the hands of seniors next year. This is not an insignificant number. If there are specific demands among this group, for example, travel, new car, electronic updates, medical supplies, fitness, those sectors could do well. That is to suggest if there are commonalities among this demographic as to where money will be spent, investing in “gray” sectors may be worth exploring as we approach 2022.

To comment on this and other articles, find us on the popular social media sites below.

Paul Hoffman

Managing Editor, Channelchek


Suggested Reading:


Understanding Family Offices


IRA Investments and Small Cap Stocks


Investment Portfolios are Checked Twice as Often by Millennials


Inflations Impact on Stocks, Four Scenarios


Sources:

https://www.ssa.gov/oact/cola/latestCOLA.html#:~:text=How%20is%20a%20COLA%20calculated%3F&text=A%20COLA%20effective%20for%20December,which%20a%20COLA%20became%20effective.

https://www.ssa.gov/oact/STATS/cpiw.html

https://www.nasi.org/education/who-gets-social-security/#:~:text=About%2061%20million%20people%20collect,is%20receiving%20Social%20Security%20benefits.

https://www.bls.gov/news.release/pdf/cpi.pdf


Stay up to date. Follow us:


Gevo Reports Second Quarter 2021 Financial Results


Gevo Reports Second Quarter 2021 Financial Results


ENGLEWOOD, Colo., Aug. 12, 2021 (GLOBE NEWSWIRE) — Gevo, Inc. (NASDAQ: GEVO) today announced financial results for the second quarter of 2021 and recent corporate highlights.

Recent Corporate Highlights

  • On August 9, 2021, Gevo announced that its wholly-owned renewable natural gas (“RNG”) project company, Gevo NW Iowa RNG, LLC (“Gevo RNG”), has signed binding, definitive agreements with BP Canada Energy Marketing Corp. and BP Products North America Inc. for the sale of RNG. The RNG project is on schedule and on budget with an anticipated startup early 2022. Beginning in late 2022, Gevo RNG expects to generate cash distributions to Gevo of approximately $9 to $16 million per year.

  • On August 2, 2021, Gevo announced the appointment of Jaime Guillen to its Board of Directors. Mr. Guillen is a Managing Partner at Faros Infrastructure Partners LLC, an investment firm with offices in the United Kingdom, the United States and Mexico.
  • On April 15, 2021, Gevo closed the offering of $68,155,000 in 2021 Bonds to finance the construction of its renewable natural gas project in Iowa.

2021 Second Quarter Financial Highlights

  • Ended the quarter with cash, cash equivalents, restricted cash and marketable securities totaling $567.2 million compared to $525.3 as of the end of Q1 2021 and $6.3 million as of the end of Q2 2020
  • Revenue of $0.4 million for the quarter compared to $1.0 million in Q2 2020
  • Loss from operations (which includes $5.5 million of preliminary stage project costs for Net-Zero 1) of ($19.0) million for the quarter compared to ($5.3) million in Q2 2020
  • Non-GAAP cash EBITDA loss of ($17.1) million for the quarter compared to ($3.1) million in Q2 2020
  • Net loss per share of ($0.09) for the quarter compared to ($0.40) in Q2 2020
  • Non-GAAP adjusted net loss per share of ($0.09) for the quarter compared to ($0.39) in Q2 2020

Commenting on the second quarter of 2021 and recent corporate events, Dr. Patrick R. Gruber, Gevo’s Chief Executive Officer, said “The engineering and design work for our Net-Zero 1 Project is going well. We are figuring out the optimizations and integrations for Net-Zero 1, and how to generate more cash sooner. We are looking forward to completing the next phase of the engineering work in December of this year and moving forward towards getting the financing closed in the first half of next year.”

Second Quarter 2021 Financial Results

Revenue for the three months ended June 30, 2021 was $0.4 million compared with $1.0 million in the same period in 2020.

During the three months ended June 30, 2021, hydrocarbon revenue was $0.3 million compared with $0.9 million in the same period in 2020. Hydrocarbon sales decreased because of lower production volumes at Gevo’s demonstration plant at the South Hampton Resources, Inc. facility in Silsbee, Texas (the “South Hampton Facility”). Gevo’s hydrocarbon revenue is comprised of sales of sustainable aviation fuel and renewable premium gasoline.

As a result of COVID-19 and in response to an unfavorable commodity environment, Gevo terminated its production of ethanol and distiller grains in March 2020.  As previously announced, Gevo’s production facility in Luverne, Minnesota (the “Luverne Facility”) is currently producing isobutanol.  During the second half of 2021, Gevo expects to send finished isobutanol from the Luverne Facility to the South Hampton Facility so that renewable premium gasoline or jet fuel can be produced.

Cost of goods sold was $2.8 million for the three months ended June 30, 2021, compared with $2.6 million in the same period in 2020. Cost of goods sold includes $1.6 million associated with the maintenance of the Luverne and South Hampton Facilities and approximately $1.2 million in depreciation expense for the three months ended June 30, 2021.

Gross loss was $2.4 million for the three months ended June 30, 2021, compared with a $1.7 million gross loss in the same period in 2020.

Research and development expense increased by $0.7 million during the three months ended June 30, 2021 compared with the same period in 2020, due primarily to an increase in personnel and consultant expenses as we work to improve our process for growing and fermenting yeast strains.

Selling, general and administrative expense increased by $2.1 million during the three months ended June 30, 2021, compared with the same period in 2020, due primarily to increases in personnel, professional fees and insurance to support the growth in operations and an increase in consulting related to creating our first Environmental, Social and Governance (“ESG”) report, which will be released during the third quarter 2021, and documenting our compliance with Section 404(b) of the Sarbanes-Oxley Act.

Preliminary stage project costs increased by $5.3 million during the three months ended June 30, 2021, compared with the same period in 2020, due primarily to increased consulting for preliminary engineering costs, depreciation of the right of use assets related the agreements with the fuel supply and lease agreements and personnel expenses to support the growth in business activity at our Net-Zero projects.

Loss from operations in the three months ended June 30, 2021 was ($19.0) million, compared with a ($5.3) million loss from operations in the same period in 2020.

Non-GAAP cash EBITDA loss in the three months ended June 30, 2021 was ($17.1) million, compared with a ($3.1) million non-GAAP cash EBITDA loss in the same period in 2020.

Interest expense has decreased by $0.5 million in the three months ended June 30, 2021 as compared to the same period in 2020, due to the conversion of all of Gevo’s 12% convertible senior secured notes due 2020/2021 to common stock during 2020.

In the three months ended June 30, 2021, Gevo recognized net non-cash gain totaling less than $0.1 million due to changes in the fair value of certain of its financial instruments, such as warrants.

Gevo incurred a net loss for the three months ended June 30, 2021 of ($18.3) million, compared with a net loss of ($6.0) million during the same period in 2020. Non-GAAP adjusted net loss for the three months ended June 30, 2021 was ($18.3) million, compared with a non-GAAP adjusted net loss of ($5.8) million during the same period in 2020.

Cash, cash equivalents, restricted cash and marketable securities at June 30, 2021 was $567.2 million compared to $525.3 as of the end Q1 2021.

Webcast and Conference Call Information

Hosting today’s conference call at 4:30 p.m. EDT (2:30 p.m. MDT) will be Dr. Patrick R. Gruber, Chief Executive Officer, L. Lynn Smull, Chief Financial Officer, Carolyn M. Romero, Chief Accounting Officer, and Geoffrey T. Williams, Jr., Vice President – General Counsel & Secretary. They will review Gevo’s financial results and provide an update on recent corporate highlights.

To participate in the conference call, please dial 1 (833) 729-4776 (inside the U.S.) or 1 (830) 213-7701 (outside the U.S.) and reference the access code 2267135# or through the event weblink https://edge.media-server.com/mmc/p/8w4ypxhw .

A replay of the call and webcast will be available two hours after the conference call ends on August 12, 2021. To access the replay, please dial 1 (855) 859-2056 (inside the U.S.) or 1 (404) 537-3406 (outside the U.S.) and reference the access code 2267135#. The archived webcast will be available in the Investor Relations section of Gevo’s website at www.gevo.com .

About Gevo

Gevo’s mission is to transform renewable energy and carbon into energy-dense liquid hydrocarbons. These liquid hydrocarbons can be used for drop-in transportation fuels such as gasoline, jet fuel, and diesel fuel, that when burned have potential to yield net-zero greenhouse gas emissions when measured across the full lifecycle of the products. Gevo uses low-carbon renewable resource-based carbohydrates as raw materials, and is in an advanced state of developing renewable electricity and renewable natural gas for use in production processes, resulting in low-carbon fuels with substantially reduced carbon intensity (the level of greenhouse gas emissions compared to standard petroleum fossil-based fuels across their lifecycle). Gevo’s products perform as well or better than traditional fossil-based fuels in infrastructure and engines, but with substantially reduced greenhouse gas emissions. In addition to addressing the problems of fuels, Gevo’s technology also enables certain plastics, such as polyester, to be made with more sustainable ingredients. Gevo’s ability to penetrate the growing low-carbon fuels market depends on the price of oil and the value of abating carbon emissions that would otherwise increase greenhouse gas emissions. Gevo believes that its proven, patented, technology enabling the use of a variety of low-carbon sustainable feedstocks to produce price-competitive low carbon products such as gasoline components, jet fuel, and diesel fuel yields the potential to generate project and corporate returns that justify the build-out of a multi-billion-dollar business.

Gevo believes that Argonne National Laboratory GREET model is the best available standard of scientific based measurement for life cycle inventory or LCI.

Learn more at Gevo’s website: www.gevo.com

Forward-Looking Statements

Certain statements in this press release may constitute “forward-looking statements” within the meaning of the Private Securities Litigation Reform Act of 1995. These forward-looking statements relate to a variety of matters, including, without limitation, Gevo’s Net-Zero Projects, Gevo’s RNG Project, the engineering and design work for the Net-Zero 1 Project, Gevo’s offtake agreements, Gevo’s plans to develop its business, Gevo’s ability to successfully construct and finance its operations and growth projects, Gevo’s ability to achieve cash flow from its planned projects, the ability of Gevo’s products to contribute to lower greenhouse gas emissions, particulate and sulfur pollution and other statements that are not purely statements of historical fact. These forward-looking statements are made based on the current beliefs, expectations and assumptions of the management of Gevo and are subject to significant risks and uncertainty. Investors are cautioned not to place undue reliance on any such forward-looking statements. All such forward-looking statements speak only as of the date they are made, and Gevo undertakes no obligation to update or revise these statements, whether as a result of new information, future events or otherwise. Although Gevo believes that the expectations reflected in these forward-looking statements are reasonable, these statements involve many risks and uncertainties that may cause actual results to differ materially from what may be expressed or implied in these forward-looking statements. For a further discussion of risks and uncertainties that could cause actual results to differ from those expressed in these forward-looking statements, as well as risks relating to the business of Gevo in general, see the risk disclosures in the Annual Report on Form 10-K of Gevo for the year ended December 31, 2020 and in subsequent reports on Forms 10-Q and 8-K and other filings made with the U.S. Securities and Exchange Commission by Gevo.

Non-GAAP Financial Information

This press release contains financial measures that do not comply with U.S. generally accepted accounting principles (GAAP), including non-GAAP cash EBITDA loss, non-GAAP adjusted net loss and non-GAAP adjusted net loss per share. Non-GAAP cash EBITDA loss excludes depreciation and amortization and non-cash stock-based compensation. Non-GAAP adjusted net loss and adjusted net loss per share excludes non-cash gains and/or losses recognized in the quarter due to the changes in the fair value of certain of Gevo’s financial instruments, such as warrants, convertible debt and embedded derivatives Management believes these measures are useful to supplement its GAAP financial statements with this non-GAAP information because management uses such information internally for its operating, budgeting and financial planning purposes. These non-GAAP financial measures also facilitate management’s internal comparisons to Gevo’s historical performance as well as comparisons to the operating results of other companies. In addition, Gevo believes these non-GAAP financial measures are useful to investors because they allow for greater transparency into the indicators used by management as a basis for its financial and operational decision making. Non-GAAP information is not prepared under a comprehensive set of accounting rules and therefore, should only be read in conjunction with financial information reported under U.S. GAAP when understanding Gevo’s operating performance. A reconciliation between GAAP and non-GAAP financial information is provided in the financial statement tables below.

Cash EBITDA loss is a non-GAAP measure calculated by adding back depreciation and amortization and non-cash stock compensation to GAAP loss from operations. A reconciliation of cash EBITDA loss to GAAP loss from operations is provided in the financial statement tables following this release.

Adjusted net loss per share is a non-GAAP measure calculated by adding back non-cash gains and/or losses recognized in the quarter due to the changes in the fair value of certain of our financial instruments, such as warrants, convertible debt and embedded derivatives, to GAAP net loss per share. A reconciliation of adjusted net loss per share to GAAP net loss per share is provided in the financial statement tables following this release.

Cash EBITDA loss is a non-GAAP measure calculated by adding back depreciation and amortization and non-cash stock compensation to GAAP loss from operations. A reconciliation of cash EBITDA loss to GAAP loss from operations is provided in the financial statement tables following this release.

Adjusted net loss is a non-GAAP measure calculated by adding back non-cash gains and/or losses recognized in the quarter due to the changes in the fair value of certain of our financial instruments, such as warrants, convertible debt and embedded derivatives, to GAAP net loss. A reconciliation of adjusted net loss to GAAP net loss is provided in the financial statement tables following this release.


Gevo, Inc.

Condensed Consolidated Balance Sheets Information

(Unaudited, in thousands, except share and per share amounts)

  June 30, 2021   December 31, 2020
Assets          
Current assets          
Cash and cash equivalents $ 17,085     $ 78,338  
Marketable securities (current)   246,886       ?  
Restricted cash (current)   57,645       ?  
Accounts receivable   847       527  
Inventories   2,216       2,491  
Prepaid expenses and other current assets   4,497       1,914  
Total current assets   329,176       83,270  
           
Property, plant and equipment, net   79,243       66,408  
Long-term marketable securities   175,169       ?  
Long-term restricted cash   70,464       ?  
Operating right-of-use asset   1,770       133  
Financing right-of-use asset   27,491       176  
Deposits and other assets   2,361       2,112  


Total assets


$


685,674
   

$


152,099
 
           
Liabilities          
Current liabilities          
Accounts payable and accrued liabilities $ 16,393     $ 3,943  
Operating lease liabilities (current)   ?       172  
Finance lease liabilities (current)   4,888       10  
Loans payable – other (current)   174       807  
Total current liabilities   21,455       4,932  
           
2021 Bonds payable (long-term)   66,120       ?  
Loans payable – other (long-term)   394       447  
Operating lease liabilities (long-term)   1,783       ?  
Financing lease liabilities (long-term)   19,715       162  
Other long-term liabilities   84       179  
Total liabilities   109,551       5,720  
           
Commitments and Contingencies          
           
Stockholders’ Equity          
Common Stock, $0.01 par value per share; 250,000,000 authorized,

197,964,476 and 128,138,311 shares issued and outstanding at June

30, 2021 and December 31, 2020, respectively.
  1,980       1,282  
Additional paid-in capital   1,100,932       643,269  
Accumulated other comprehensive loss   (307 )     ?  
Accumulated deficit   (526,482 )     (498,172 )
Total stockholders’ equity   576,123       146,379  


Total liabilities and stockholders’ equity


$


685,674
   

$


152,099


Gevo, Inc.

Condensed Consolidated Statements of Operations Information

(Unaudited, in thousands, except share and per share amounts)

  Three Months Ended June 30, Six Months Ended June 30,
    2021       2020       2021       2020  
Revenue and cost of goods sold              
Ethanol sales and related products, net $ ?     $ 83     $ ?     $ 3,783  
Hydrocarbon revenue   346       859       359       984  
Grant and other revenue   76       46       156       46  
Total revenues   422       988       515       4,813  
               
Cost of goods sold   2,794       2,644       4,788       10,783  
               
Gross loss   (2,372 )     (1,656 )     (4,273 )     (5,970 )
               
Operating expenses              
Research and development expense   1,404       677       2,782       1,257  
Selling, general and administrative expense   4,820       2,698       8,692       5,325  
Preliminary stage project costs   5,472       221       8,199       377  
Loss on disposal of assets   4,954       ?       4,954       38  
Restructuring expenses   ?       5       ?       304  
Total operating expenses   16,650       3,601       24,627       7,301  
               
Loss from operations   (19,022 )     (5,257 )     (28,900 )     (13,271 )
               
Other income (expense)              
Gain on forgiveness of SBA loan   641       ?       641       ?  
Interest Expense   (6 )     (541 )     (11 )     (1,086 )
(Loss) on modification of 2020 Notes   ?       (57 )     ?       (726 )
Gain (loss) from change in fair value of derivative warrant liability  


43


1


(10


)


8
 
(Loss) from change in fair value of 2020/21 Notes embedded derivative liability   ?       (176 )     ?       (276 )
Other income (expense)   91       (13 )     (30 )     55  
Total other income (expense), net   769       (786 )     590       (2,025 )
               
Net loss $ (18,253 )   $ (6,043 )   $ (28,310 )   $ (15,296 )
               
Net loss per share – basic and diluted $ (0.09 )   $ (0.40 )   $ (0.15 )   $ (1.04 )
Weighted-average number of common shares outstanding –

basic and diluted
 

198,137,420
      15,071,105       190,892,223       14,771,952  
               

Gevo, Inc.

Condensed Consolidated Statements of Comprehensive Income

(Unaudited, in thousands, except share and per share amounts)

  Three Months Ended June 30, Six Months Ended June 30,
    2021       2020       2021       2020  
               
Net Loss $ (18,253 )   $ (6,043 )   $ (28,310 )   $ (15,296 )
Other comprehensive income (loss)              
Unrealized gains (losses) on available-for-sale securities, net of tax   (307 )     ?       (307 )     ?  
Total change in unrealized gains (losses) on marketable securities   (307 )     ?       (307 )     ?  
               
Comprehensive Loss $ (18,560 )   $ (6,043 )   $ (28,617 )   $ (15,296 )
               

Gevo, Inc.

Condensed Consolidated Statements of Stockholders’ Equity Information

(Unaudited, in thousands, except share amounts)

    Common Stock   Paid-In Capital   Accumulated Other Comprehensive Loss   Accumulated Deficit   Stockholders’ Equity
    Shares   Amount        
                                   
  Balance, December 31, 2020 128,138,311     $ 1,282     $ 643,269     $     $ (498,172 )   $ 146,379  
                                   
  Issuance of common stock, net of issue costs 68,170,579       682       457,008                   457,690  
  Issuance of common stock upon exercise of warrants 1,863,058       18       1,099                   1,117  
  Non-cash stock-based compensation             562                   562  
  Issuance of common stock under stock plans, net of taxes (121,499 )     (1 )     1                    
  Net loss                         (10,057 )     (10,057 )
                                   
  Balance, March 31, 2021 198,050,449       1,981       1,101,939             (508,229 )     595,691  
                                   
  Issuance of common stock, net of issue costs             (45 )                 (45 )
  Issuance of common stock upon exercise of warrants 3,700             4                   2  
  Non-cash stock-based compensation             858                   858  
  Issuance of common stock under stock plans, net of taxes (89,673 )     (1 )     (1,824 )                 (1,823 )
  Other comprehensive loss                   (307 )           (307 )
  Net loss                         (18,253 )     (18,253 )
                                   
  Balance, June 30, 2021 197,964,476     $ 1,980     $ 1,100,932     $ (307 )   $ (526,482 )   $ 576,123  
                                   
  Balance, December 31, 2019 14,083,232     $ 141     $ 530,349     $     $ (457,986 )   $ 72,504  
                                   
  Issuance of common stock, net of issue costs 425,776       4       902                   906  
  Non-cash stock-based compensation             336                   336  
  Issuance of common stock under stock plans, net of taxes 105,882                                
  Net loss                         (9,253 )     (9,253 )
                                   
  Balance, March 31, 2020 14,614,890       145       531,587             (467,239 )     64,493  
                                   
  Issuance of common stock, net of issue costs 917,345       9       1,238                   1,247  
  Non-cash stock-based compensation             497                   497  
  Issuance of common stock under stock plans, net of taxes (18,137 )           (307 )                 (307 )
  Net loss                         (6,043 )     (6,043 )
                                   
  Balance, June 30, 2020 15,514,098     $ 154     $ 533,015     $     $ (473,282 )   $ 59,887  


Gevo, Inc.

Condensed Consolidated Cash Flow Information

(Unaudited, in thousands)

    Three Months Ended June 30, Six Months Ended June 30,
      2021       2020       2021       2020  
Operating Activities                
Net Loss   $ (18,253 )   $ (6,043 )   $ (28,310 )   $ (15,296 )
Adjustments to reconcile net loss to net cash used in

operating activities:
               
Loss (gain) from change in fair value of derivative warrant liability   (43 )     (1 )     10       (8 )
Loss from change in fair value of 2020/21 Notes and 2020 Notes embedded derivative liability     ?       176         ?       276  
Loss on sales of property, plant and equipment     4,954       38       4,954       38  
(Gain) from forgiveness of SBA PPP loans     (641 )     ?       (641 )       ?  
Stock-based compensation     692       501       1,617       673  
Depreciation and amortization     1,223       1,629       2,372       3,278  
Non-cash lease expense     (75 )     14       (58 )     29  
Non-cash interest expense     ?       243       2       393  
Other non-cash expenses     5       ?       5         ?  
Changes in operating assets and liabilities:                
Accounts receivable     (755 )     (594 )     (320 )     389  
Inventories     236       201       275       721  
Prepaid expenses and other current assets, deposits and other assets:     1,131       331       (3,142 )     164  
Accounts payable, accrued expenses and long-term liabilities   (777 )     (338 )     3,768       (1,475 )
Net cash used in operating activities     (12,303 )     (3,843 )     (19,468 )     (10,818 )
                 
Investing Activities                
Acquisitions of property, plant and equipment     (9,537 )     (817 )     (14,167 )     (1,607 )
Purchase of marketable securities     (422,362 )     ?       (422,362 )       ?  
Net cash used in investing activities     (431,899 )     (817 )     (436,529 )     (1,607 )
                 
Financing Activities                
Proceeds from issuance of 2021 Bonds     68,995       ?       68,995         ?  
Debt and equity offering costs     (3,074 )     (63 )     (34,757 )     (115 )
Proceeds from issuance of common stock and common stock warrants   (1,824 )     1,313       487,549       2,271  
Proceeds from the exercise of warrants   2       ?       1,119         ?  
Net settlement of common stock under stock plans   27       (156 )       ?       (310 )
Payments on secured debt     (53 )     (392 )     (53 )     (392 )
Proceeds from SBA loans     ?       1,006         ?       1,006  
Net cash provided by financing activities     64,073       1,708       522,853       2,460  
                 
Net increase (decrease) in cash and cash equivalents     (380,129 )     (2,952 )     66,856       (9,965 )
                 
Cash, cash equivalents, and restricted cash                
Beginning of period     525,323       9,289       78,338       16,302  
                 
End of period   $ 145,194     $ 6,337     $ 145,194     $ 6,337  
                 

Gevo, Inc.

Reconciliation of GAAP to Non-GAAP Financial Information

(Unaudited, in thousands, except share and per share amounts)

  Three Months Ended June 30,   Six Months Ended June 30,
Non-GAAP Cash EBITDA   2021       2020       2021       2020  
               
Loss from operations $ (19,022 )   $ (5,257 )   $ (28,900 )   $ (13,271 )
Depreciation and amortization   1,223       1,629       2,372       3,278  
Stock-based compensation   692       501       1,617       673  
Non-GAAP cash EBITDA $ (17,107 )   $ (3,127 )   $ (24,911 )   $ (9,320 )
               
Non-GAAP Adjusted Net Loss              
               
Net Loss $ (18,253 )   $ (6,043 )   $ (28,310 )   $ (15,296 )
Adjustments:              
(Loss) on modification of 2020 Notes   ?       (57 )     ?       (726 )
Gain (loss) from change in fair value of derivative warrant liability   43       1       (10 )     8  
(Loss) from change in fair value of 2020/21 Notes and 2020 Notes embedded derivative liability   ?       (176 )     ?       (276 )
Total adjustments   43       (232 )     (10 )     (994 )


Non-GAAP Net Income (Loss)
$ (18,296 )   $ (5,811 )   $ (28,300 )   $ (14,302 )
Non-GAAP adjusted net loss per share –

basic and diluted
$ (0.09 )   $ (0.39 )   $ (0.15 )   $ (0.97 )
Weighted-average number of common

shares outstanding – basic and diluted
  198,137,420       15,071,105       190,892,223       14,771,952  

Investor and Media Contact

+1 720-647-9605

IR@gevo.com
QuoteMedia (QMCI) – A Slow Walk Toward Margin Improvement

Friday, August 13, 2021

QuoteMedia (QMCI)
A Slow Walk Toward Margin Improvement

QuoteMedia, based in Fountain Hills, Arizona, provides cloud-based financial data, market news feeds, and financial software solutions.  Its customers include financial service companies, online brokerages, clearing firms, banks, media portals, public corporations and individual investors.  The company provides a single source solution providing products such as streaming quotes, charting, historical data, technical analysis, news and research.  Information can customized and provided to multiple platforms including terminals and mobile devices.

Michael Kupinski, Director of Research, Noble Capital Markets, Inc.

Refer to the full report for the price target, fundamental analysis, and rating.

    Mixed Q2 results: Revenues were modestly better than expected by 1.9%, $3.833 million, up 26.5% from the year earlier quarter, versus our estimate of $3.760 million. The largest upside revenue variance was due to better than expected Interactive Content & Data revenue, $1.607 million versus our $1.565 million estimate. While adjusted EBITDA increased 45.7% to $311,000, it was 22% below our expectation of $399,000.

    Still waiting: While the acceleration in revenue growth is encouraging, we are still awaiting the prospect of improving gross and adjusted EBITDA margins.  Unfortunately, the growth in revenues have come at a cost, as gross margins have declined from a high of 51% for the full year 2019 to 46% in 2020 to 42.8% in the latest quarter. Q2 gross margins were relatively flat to Q1 at 43%. Management …


This Company Sponsored Research is provided by Noble Capital Markets, Inc., a FINRA and S.E.C. registered broker-dealer (B/D).

*Analyst certification and important disclosures included in the full report. NOTE: investment decisions should not be based upon the content of this research summary.  Proper due diligence is required before making any investment decision. 

QuickChek – August 13, 2021


Esports Entertainment Group Signs Exclusive Content Partnership with ESTV EsportsTV

Esports Entertainment Group announced it has signed an exclusive partnership with ESTV EsportsTV to create gaming content using their Esports Gaming League tournament platform

Research, News & Market Data on EEG

Watch recent presentation from EEG


Ayala Pharmaceuticals Reports Second Quarter 2021 Financial Results and Provides Business Update

Ayala announced financial results for the period ended June 30, 2021

Research, News & Market Data on Ayala Pharmaceuticals


OSS Reports Q2 2021 Revenue up 28% to $14.9 Million, Delivering Income of $1.7 Million or $0.09 per Share

One Stop Systems reported results for the second quarter ended June 30, 2021

See today’s OSS research report from Joe Gomes, Senior Research Analyst at Noble Capital Markets

Research, News & Market Data on One Stop Systems

Watch recent presentation from One Stop Systems


Helius Medical Technologies, Inc. Reports Second Quarter 2021 Financial Results

Helius Medical Technologies reported financial results for the quarter ended June 30, 2021

Research, News & Market Data on Helius

Watch recent presentation from Helius


Onconova Therapeutics Reports Second Quarter 2021 Financial Results And Provides Business Update

Onconova announced financial results for the three months ended June 30, 2021 and provided a business update

See today’s ONTX research report from Robert LeBoyer, Senior Research Analyst at Noble Capital Markets

Research, News & Market Data on Onconova


Harte Hanks Reports Second Quarter 2021 Financial Results

Harte Hanks announced financial results for the second quarter ended June 30, 2021

See today’s HRTH research report from Michael Kupinski, Director of Research at Noble Capital Markets

Research, News & Market Data on Harte Hanks


Gevo Reports Second Quarter 2021 Financial Results

Gevo announced financial results for the second quarter of 2021 and recent corporate highlights

Research, News & Market Data on Gevo

Watch recent presentation from Gevo


Schwazze to Host Second Quarter 2021 Conference Call & Webcast – August 16, 2021

Schwazze announced that it will host a second quarter 2021 conference call and webcast on August 16, 2021 at 4:30 p.m. ET

Research, News & Market Data on Schwazze

Watch recent presentation from Schwazze


Stay up to date. Follow us:


PDS Biotechnology Corp (PDSB) – Moving Forward With Clinical Milestones On The Horizon

Friday, August 13, 2021

PDS Biotechnology Corp (PDSB)
Moving Forward With Clinical Milestones On The Horizon

PDS Biotechnology Corp operates as a clinical stage biotechnology company, principally involved in drug discovery in the United States. It is primarily engaged in the treatment of various early-stage and late-stage cancers, including head and neck cancer, prostate cancer, breast cancer, cervical cancer, anal cancer, and other cancers. Its products are based on the proprietary Versamune platform technology, which activates and directs the human immune system to unleash a powerful and targeted attack against cancer cells.

Robert LeBoyer, Senior Research Analyst, Noble Capital Markets, Inc.

Refer to the full report for the price target, fundamental analysis, and rating.

    Significant Data Was Presented In 2Q21.  PDS Biotechnology reported 2Q21 loss of $0.6 million or $(0.03) per share. Importantly, interim Phase 2 data from the lead trial for PDS0101 presented at the ASCO conference showed strong indications of efficacy. Additional data from this PDS0101 trial and two other Phase 2 trials are expected to be announced around 4Q/1H22.

    Increased Cash Allows Clinical Trials To Move Forward.  During 2Q21, the company completed an offering that raised about $52 million in gross proceeds. Cash on hand at June 30, 2021 was $74.7 million. This gives the company sufficient operating cash to continue current operations and new clinical trials. Two additional Versamune platform products, PDS102 and PDS103, are expected to move to clinical …


This Company Sponsored Research is provided by Noble Capital Markets, Inc., a FINRA and S.E.C. registered broker-dealer (B/D).

*Analyst certification and important disclosures included in the full report. NOTE: investment decisions should not be based upon the content of this research summary.  Proper due diligence is required before making any investment decision. 

Pangaea Logistics Solutions Ltd. (PANL) – Strong Quarter and 2H2021 Off to Good Start

Friday, August 13, 2021

Pangaea Logistics Solutions Ltd. (PANL)
Strong Quarter and 2H2021 Off to Good Start

Pangaea Logistics Solutions Ltd and its subsidiaries provide seaborne drybulk transportation services. It transports drybulk cargos including grains, coal, iron, ore, pig, iron, hot briquetted iron, bauxite, alumina, cement clinker, dolomite and limestone. The firm’s services include cargo loading, cargo discharge, vessel chartering, voyage planning and technical vessel management. The company derives all of its revenues from contracts of affreightment, voyage charters and time charters. Its strategy depends on focusing on increasing strategic contracts of affreightment, expanding capacity and flexibility by increasing its owned fleet and increasing backhaul focus and fleet efficiency.

Poe Fratt, Senior Research Analyst, Noble Capital Markets, Inc.

Refer to the full report for the price target, fundamental analysis, and rating.

    2Q2021 Results Above Expectations and 3Q2021 Off to Good Start. 2Q2021 EBITDA of $21.4 million was above expectations by $3.4 million mainly due to lower opex and charter hire expenses which more than offset variances in TCE rates and shipping days of 4,723. It is challenging to keep up in rising rate environments so TCE rates of $21.1k/day lagged the panamax and supramax index of $24.2k/day.

    Increasing 2021 EBITDA estimate to $76.0 million based on TCE rates of $22.2k/day from $68.2 million based on TCE rates of $21.7k/day and total shipping days of 19,260.  The 2H2021 outlook remains firm and we moved our quarterly TCE rate estimates higher to $27.0k/day in 3Q2021 and $23.5k/day in 4Q2021 …


This Company Sponsored Research is provided by Noble Capital Markets, Inc., a FINRA and S.E.C. registered broker-dealer (B/D).

*Analyst certification and important disclosures included in the full report. NOTE: investment decisions should not be based upon the content of this research summary.  Proper due diligence is required before making any investment decision. 

Fireside Chat with Entravision Communications (EVC) CFO Chris Young


Noble Capital Markets Director of Research Michael Kupinski hosts this exclusive fireside chat with Entravision Communications CFO Chris Young. The discussion features questions asked by the live audience throughout the event.

Research, News, and Advanced Market Data on EVC


Information on upcoming live virtual roadshows

About Entravision Communications Corporation

Entravision is a diversified global media, marketing and technology company serving clients throughout the United States and in 32 countries across Latin America, Europe, and Asia. Entravision has 54 television stations and is the largest affiliate group of the Univision and UniMás television networks, and 47 Spanish-language radio stations that feature nationally recognized, award-winning talent. Our dynamic digital portfolio includes Entravision Digital, which serves SMBs in high-density U.S. Latino markets and provides cutting-edge mobile programmatic solutions and demand-side platforms that allow advertisers to execute performance campaigns using machine-learned bidding algorithms, along with Cisneros Interactive, a leader in digital advertising solutions in the Latin American and U.S. Hispanic markets representing major technology platforms, and MediaDonuts, a leader in programmatic digital solutions in Southeast Asia. Shares of Entravision Class A Common Stock trade on The New York Stock Exchange under the ticker symbol: EVC. Learn more about all of our marketing, media, and technology offerings at entravision.com or connect with us on LinkedIn and Facebook

What’s in the Infrastructure Bill for US Battery Production?


Image Credit: Tom Fisk (Pexels)


What’s in the Infrastructure Bill for US Battery Production?


The Infrastructure Bill that just passed the Senate and is headed to the House for a possible vote this Fall is undoubtedly helpful for metals producers. However, not all will benefit. If passed, there’d be billions for upgrading highways, railways, and power grids. So steel, copper, and aluminum are obvious winners, but as written, for minerals used in batteries such as lithium or cobalt, the bill will not only increase domestic demand but aims to increase supply as well.

There is $6 billion earmarked for battery materials processing and manufacturing projects and an additional $140 million allocated to what is called a rare earths demonstration plant. This is part of a greater investment drive across the full metallic supply chain.

The “investment” within the bill works to place importance on production capacity of critical metals and “green” the overall infrastructure of the country while making a solid effort to “buy American.” A tall order considering the country’s reliance on imports.

Rare Earth Metals

The United States’ supply of rare earth compounds can best be described as imported. Almost 80% of shipments come from China, according to the United States Geological Survey (USGS).

The Department of Energy (DOE) is already steering funds into research and development on the necessary materials needed, from primary processing to recycling, the infrastructure bill makes the commitment much larger with a $140 million grant to build a facility, “to demonstrate the commercial feasibility of a full-scale integrated rare earth element extraction and separation facility and refinery”.


A partner from academia is expected to “provide environmental benefits through use of feedstock derived from acid mine drainage, mine waste, or other deleterious material.” The US is considered vulnerable in its not being able to supply enough critical minerals for what is expected to provide the energy needs of the near future.

Critical mineral recycling also gets money through this bill as it allocates $100 million per year through 2024 in grants for developing, processing, and recycling critical minerals. Recycling projects will get a minimum of 30%. Any project based in the United States will be prioritized and none will be allowed to export to “a foreign entity of concern”.

Battery Metals

There is $7.5 billion allocated in the bill for EV charging. The House is rumored to be looking to refine the bill and bolster some of these numbers for them to approve a revised version.

While the plan is to move quickly forward with electric vehicles, currently the country will not have enough domestic production of lithium, nickel, and cobalt to make the batteries needed to power those vehicles. This may be remedied by the bill’s allocations of $3 billion for each of the following: battery materials processing, and battery manufacturing projects. Grants in each case will be for either demonstration plants, full commercial facilities or the retrofitting of existing facilities in the United States. Grants are only offered to U.S. owned organizations. The winners of grants will be subject to North American intellectual property rights with a commitment not to “use battery material supplied by or originating from a foreign entity of concern.” 

Permitting

Getting US-funded new mines for nickel, lithium, or cobalt refining can be a slow process given the current complexity of the permitting processes. Far too slow if the country is going meet the stated targets. The bill notes, “The Federal permitting process has been identified as an impediment to mineral production and the mineral security of the United States,” it calls for the implementing performance metrics as a condition of approving critical mines that are part of the program.

Environmental opposition to these metal mining projects is another impediment. This will be part of what is addressed; it remains to be seen just how quickly permitting can be put through, given the obvious counter-productive nature of mining.

The Dirty Mining Issue

“Whole-concept” or “total mining” is addressed in the infrastructure bill. Despite the shorter deadlines and grant periods, the bill allows a 10-year deadline for the United States Geological Survey (USGS) to provide a comprehensive survey of national mineral resources. The intent is “using a whole ore body approach rather than a single commodity approach, to emphasize all of the recoverable critical minerals in a given surface or subsurface deposit”.

The bill also calls for the USGS to “map and collect data for areas containing mine waste to increase understanding of above-ground critical mineral resources in previously disturbed areas.” These wastes are expected to feed the proposed new rare earths processing plants.

Brand new mines will remain a problem for critical minerals planners; going back to what has already been mined seems more sensible.

Take-Away

The infrastructure bill is an obvious win for construction materials but will also provide a strong framework and a lot of R&D money for miners and academia alike. The top take from the as yet not fully passed or signed bill is that it will focus on companies in the U.S. This will mean many current mining and recycling companies within our borders will have tremendous potential to grow at a rapid pace.

Discover US-based mining companies to explore here on Channelchek. Then subscribe to our YouTube channel to listen to interviews with the top brass from metal producers.

Suggested Reading:


ESG Scores and How to Use Them


Lithium Battery vs Hydrogen Fuel Cell


Ford’s Announcement is Another Reason for Copper Producers to Smile


Debt Ceiling Debate Impact on Stocks and US Treasury Credit Rating

Sources:


https://www.reuters.com/article/us-critical-minerals-ahome/column-u-s-infrastructure-bill-targets-critical-minerals-supply-idUSKBN2FD1GU

https://www.cnn.com/2021/07/28/politics/infrastructure-bill-explained/index.html

https://www.sciencemag.org/news/2021/08/big-step-forward-energy-expert-analyzes-new-us-infrastructure-bill


Stay up to date. Follow us:


Whats in the Infrastructure Bill for US Battery Production?


Image Credit: Tom Fisk (Pexels)


What’s in the Infrastructure Bill for US Battery Production?


The Infrastructure Bill that just passed the Senate and is headed to the House for a possible vote this Fall is undoubtedly helpful for metals producers. However, not all will benefit. If passed, there’d be billions for upgrading highways, railways, and power grids. So steel, copper, and aluminum are obvious winners, but as written, for minerals used in batteries such as lithium or cobalt, the bill will not only increase domestic demand but aims to increase supply as well.

There is $6 billion earmarked for battery materials processing and manufacturing projects and an additional $140 million allocated to what is called a rare earths demonstration plant. This is part of a greater investment drive across the full metallic supply chain.

The “investment” within the bill works to place importance on production capacity of critical metals and “green” the overall infrastructure of the country while making a solid effort to “buy American.” A tall order considering the country’s reliance on imports.

Rare Earth Metals

The United States’ supply of rare earth compounds can best be described as imported. Almost 80% of shipments come from China, according to the United States Geological Survey (USGS).

The Department of Energy (DOE) is already steering funds into research and development on the necessary materials needed, from primary processing to recycling, the infrastructure bill makes the commitment much larger with a $140 million grant to build a facility, “to demonstrate the commercial feasibility of a full-scale integrated rare earth element extraction and separation facility and refinery”.


A partner from academia is expected to “provide environmental benefits through use of feedstock derived from acid mine drainage, mine waste, or other deleterious material.” The US is considered vulnerable in its not being able to supply enough critical minerals for what is expected to provide the energy needs of the near future.

Critical mineral recycling also gets money through this bill as it allocates $100 million per year through 2024 in grants for developing, processing, and recycling critical minerals. Recycling projects will get a minimum of 30%. Any project based in the United States will be prioritized and none will be allowed to export to “a foreign entity of concern”.

Battery Metals

There is $7.5 billion allocated in the bill for EV charging. The House is rumored to be looking to refine the bill and bolster some of these numbers for them to approve a revised version.

While the plan is to move quickly forward with electric vehicles, currently the country will not have enough domestic production of lithium, nickel, and cobalt to make the batteries needed to power those vehicles. This may be remedied by the bill’s allocations of $3 billion for each of the following: battery materials processing, and battery manufacturing projects. Grants in each case will be for either demonstration plants, full commercial facilities or the retrofitting of existing facilities in the United States. Grants are only offered to U.S. owned organizations. The winners of grants will be subject to North American intellectual property rights with a commitment not to “use battery material supplied by or originating from a foreign entity of concern.” 

Permitting

Getting US-funded new mines for nickel, lithium, or cobalt refining can be a slow process given the current complexity of the permitting processes. Far too slow if the country is going meet the stated targets. The bill notes, “The Federal permitting process has been identified as an impediment to mineral production and the mineral security of the United States,” it calls for the implementing performance metrics as a condition of approving critical mines that are part of the program.

Environmental opposition to these metal mining projects is another impediment. This will be part of what is addressed; it remains to be seen just how quickly permitting can be put through, given the obvious counter-productive nature of mining.

The Dirty Mining Issue

“Whole-concept” or “total mining” is addressed in the infrastructure bill. Despite the shorter deadlines and grant periods, the bill allows a 10-year deadline for the United States Geological Survey (USGS) to provide a comprehensive survey of national mineral resources. The intent is “using a whole ore body approach rather than a single commodity approach, to emphasize all of the recoverable critical minerals in a given surface or subsurface deposit”.

The bill also calls for the USGS to “map and collect data for areas containing mine waste to increase understanding of above-ground critical mineral resources in previously disturbed areas.” These wastes are expected to feed the proposed new rare earths processing plants.

Brand new mines will remain a problem for critical minerals planners; going back to what has already been mined seems more sensible.

Take-Away

The infrastructure bill is an obvious win for construction materials but will also provide a strong framework and a lot of R&D money for miners and academia alike. The top take from the as yet not fully passed or signed bill is that it will focus on companies in the U.S. This will mean many current mining and recycling companies within our borders will have tremendous potential to grow at a rapid pace.

Discover US-based mining companies to explore here on Channelchek. Then subscribe to our YouTube channel to listen to interviews with the top brass from metal producers.

Suggested Reading:


ESG Scores and How to Use Them


Lithium Battery vs Hydrogen Fuel Cell


Ford’s Announcement is Another Reason for Copper Producers to Smile


Debt Ceiling Debate Impact on Stocks and US Treasury Credit Rating

Sources:


https://www.reuters.com/article/us-critical-minerals-ahome/column-u-s-infrastructure-bill-targets-critical-minerals-supply-idUSKBN2FD1GU

https://www.cnn.com/2021/07/28/politics/infrastructure-bill-explained/index.html

https://www.sciencemag.org/news/2021/08/big-step-forward-energy-expert-analyzes-new-us-infrastructure-bill


Stay up to date. Follow us:


Release – Ayala Pharmaceuticals Reports Second Quarter 2021 Financial Results and Provides Business Update


Ayala Pharmaceuticals Reports Second Quarter 2021 Financial Results and Provides Business Update


– Enrolled the First Patient in the Phase 2/3 Pivotal Trial of AL102 for the Treatment of Desmoid Tumors

– Multiple Near-Term Milestones Across Clinical-Stage Pipeline

– Updated ACCURACY Trial Data to Be Presented at ESMO 2021-

REHOVOT, Israel and WILMINGTON, Del., Aug. 13, 2021 (GLOBE NEWSWIRE) —  Ayala Pharmaceuticals, Inc. (Nasdaq: AYLA), a clinical-stage oncology company focused on developing and commercializing small molecule therapeutics for patients suffering from rare and aggressive cancers, primarily in genetically defined patient populations, today reported financial results for the period ended June 30, 2021 and highlighted recent progress and upcoming milestones for its pipeline programs.

“Ayala is well positioned for strong clinical progress throughout the remainder of this year. In the second quarter, we continued to advance our pipeline programs and we are gearing up for a data readout from AL101 in our ACCURACY trial in adenoid cystic carcinoma at the upcoming ESMO meeting in September, while also advancing our AL102 clinical trials in desmoid tumors and multiple myeloma,” said Roni Mamluk, Ph.D., Chief Executive Officer of Ayala. “Our science is deeply rooted in the promise of predicting, identifying and addressing tumorigenic drivers of cancer and we continue to see value in our approach combining bioinformatics and next-generation sequencing. There remains a significant unmet need among patients with genetically defined cancers and we believe that our pipeline has the potential to address the ongoing shortfalls of existing therapies.”

Recent Business Highlights and Upcoming Milestones:

  • Enrolled First Patient in the Phase 2/3 RINGSIDE Trial of AL102 for the Treatment of Desmoid Tumors: Ayala recently enrolled the first patient in its pivotal Phase 2/3 RINGSIDE trial of AL102 for the treatment of desmoid tumors with multiple sites open in the U.S. and globallyAyala expects to report an initial interim data read-out from part A of the trial in mid-2022, with part B of the study commencing thereafter.
  • Dosed First Patient in the Phase 1 Trial of AL102 in Combination with Novartis’ BCMA Targeting Agent, WVT087 for the Treatment of Relapsed/Refractory Multiple Myeloma: In April 2021, Ayala announced the dosing of the first patient in the Phase 1 combination trial of AL102 with Novartis’ investigational anti-B-cell maturation antigen (BCMA) agent, WVT078, for the treatment of relapsed and/or refractory (R/R) multiple myeloma (MM).
  • Phase 2 TENACITY Trial of AL101 for the Treatment of Triple Negative Breast Cancer Continues to Progress: Ayala continues to enroll patients in the Phase 2 TENACITY clinical trial of its potent, selective small molecule gamma secretase inhibitor (GSI), AL101, for the treatment of patients with Notch-activated recurrent or metastatic (R/M) triple negative breast cancer (TNBC). The Company expects to report preliminary data from this ongoing trial in 2022.
  • On Track to Report Additional ACCURACY Phase 2 Data; Patient Enrollment in 6mg Cohort of Phase 2 ACCURACY Study Completed: Ayala completed enrollment of patients in the 6mg cohort of the Phase 2 ACCURACY study of AL101 for the treatment of R/M adenoid cystic carcinoma (ACC), which includes 42 subjects. Further trial progress updates, including additional data, will be presented at the upcoming European Society for Medical Oncology (ESMO) 2021 Congress being held virtually September 16-21, 2021.

Second Quarter 2021 Financial Results

  • Cash Position: Cash and cash equivalents were $44.4 million as of June 30, 2021, as compared to $42.0 million as of December 31, 2020.
  • Collaboration Revenue: Collaboration revenue was $0.8 million for the second quarter of 2021, as compared to $1.0 million for the same period in 2020.
  • R&D Expenses: Research and development expenses were $8.1 million for the second quarter of 2021, compared to $5.1 million for the same period in 2020. The increase was primarily driven by the advancement of Ayala’s clinical programs.
  • G&A Expenses: General and administrative expenses were $2.5 million for the second quarter of 2021, compared to $1.5 million for the same period in 2020. The increase was primarily related to costs associated with becoming a public company.
  • Net Loss: Net loss was $10.8 million for the second quarter of 2021, resulting in a basic and diluted net loss per share of $0.75 Net loss was $6.7 million for the same period in 2020, resulting in a basic and diluted net loss per share of $0.74.

About Ayala Pharmaceuticals

Ayala Pharmaceuticals, Inc. is a clinical-stage oncology company focused on developing and commercializing small molecule therapeutics for patients suffering from rare and aggressive cancers, primarily in genetically defined patient populations. Ayala’s approach is focused on predicating, identifying and addressing tumorigenic drivers of cancer through a combination of its bioinformatics platform and next-generation sequencing to deliver targeted therapies to underserved patient populations. The company has two product candidates under development, AL101 and AL102, targeting the aberrant activation of the Notch pathway with gamma secretase inhibitors to treat a variety of tumors including Adenoid Cystic Carcinoma, Triple Negative Breast Cancer (TNBC), T-cell Acute Lymphoblastic Leukemia (T-ALL), Desmoid Tumors and Multiple Myeloma (MM) (in collaboration with Novartis). AL101, has received Fast Track Designation and Orphan Drug Designation from the U.S. FDA and is currently in a Phase 2 clinical trial for patients with ACC (ACCURACY) bearing Notch activating mutations and in a Phase 2 clinical trial for patients with TNBC (TENACITY) bearing Notch activating mutations and other gene rearrangements. AL102 is currently in a Pivotal Phase 2/3 clinical trials for patients with desmoid tumors (RINGSIDE) and is being evaluated in a Phase 1 clinical trial in combination with Novartis’ BMCA targeting agent, WVT078, in Patients with relapsed/refractory Multiple Myeloma. For more information, visit www.ayalapharma.com.

Investors:
Julie Seidel
Stern Investor Relations, Inc.
+1-212-362-1200
Julie.seidel@sternir.com
Ayala Pharmaceuticals:
+1-857-444-0553
info@ayalapharma.com

Forward-Looking Statements
This press release contains forward-looking statements within the meaning of the Private Securities Litigation Reform Act of 1995. All statements contained in this press release that do not relate to matters of historical fact should be considered forward-looking statements, including statements relating to our development of AL101 and AL102, the promise and potential impact of our preclinical or clinical trial data, the timing of and plans to initiate additional clinical trials of AL101 and AL102, upcoming milestones, including without limitation the timing and results of any clinical trials or readouts, patient enrollment and the sufficiency of cash to fund operations. These forward-looking statements are based on management’s current expectations. The words “may,” “will,” “should,” “expect,” “plan,” “anticipate,” “could,” “intend,” “target,” “project,” “estimate,” “believe,” “predict,” “potential” or “continue” or the negative of these terms or other similar expressions are intended to identify forward-looking statements, although not all forward-looking statements contain these identifying words. These statements are neither promises nor guarantees, but involve known and unknown risks, uncertainties and other important factors that may cause our actual results, performance or achievements to be materially different from any future results, performance or achievements expressed or implied by the forward-looking statements, including, but not limited to, the following: the impact of the COVID-19 pandemic on our operations, including our preclinical studies and clinical trials, and the continuity of our business; we have incurred significant losses, are not currently profitable and may never become profitable; our need for additional funding; our cash runway; our limited operating history and the prospects for our future viability; the lengthy, expensive, and uncertain process of clinical drug development, including potential delays in regulatory approval; our requirement to pay significant payments under product candidate licenses; the approach we are taking to discover and develop product candidates and whether it will lead to marketable products; the expense, time-consuming nature and uncertainty of clinical trials; enrollment and retention of patients; potential side effects of our product candidates; our ability to develop or to collaborate with others to develop appropriate diagnostic tests; protection of our proprietary technology and the confidentiality of our trade secrets; potential lawsuits for, or claims of, infringement of third-party intellectual property or challenges to the ownership of our intellectual property; risks associated with international operations; our ability to retain key personnel and to manage our growth; the potential volatility of our common stock; costs and resources of operating as a public company; unfavorable or no analyst research or reports; and securities class action litigation against us. These and other important factors discussed under the caption “Risk Factors” in our Annual Report on Form 10-K for the year ended December 31, 2020 filed with the U.S. Securities and Exchange Commission (SEC) on March 24, 2021 and our other filings with the SEC could cause actual results to differ materially from those indicated by the forward-looking statements made in this press release. Any such forward-looking statements represent management’s estimates as of the date of this press release. New risk factors and uncertainties may emerge from time to time, and it is not possible to predict all risk factors and uncertainties. While we may elect to update such forward-looking statements at some point in the future, except as required by law, we disclaim any obligation to do so, even if subsequent events cause our views to change. Although we believe the expectations reflected in such forward-looking statements are reasonable, we can give no assurance that such expectations will prove to be correct. These forward-looking statements should not be relied upon as representing our views as of any date subsequent to the date of this press release.

AYALA PHARMACEUTICALS, INC. 
CONSOLIDATED BALANCE SHEETS 
U.S. dollars in thousands (except share and per share data)

    June 30
  December 31
      2021       2020  
    (Unaudited)
         
CURRENT ASSETS:                
Cash and Cash Equivalents   $ 44,412     $ 42,025  
Short-term Restricted Bank Deposits     119       90  
Trade Receivables     929       681  
Prepaid Expenses and other Current Assets     1,550       1,444  
Total Current Assets     47,010       44,240  
LONG-TERM ASSETS:                
Other Assets   $ 270     $ 305  
Property and Equipment, Net     1,192       1,283  
Total Long-Term Assets     1,462       1,588  
Total Assets   $ 48,472     $ 45,828  
LIABILITIES AND STOCKHOLDERS’ EQUITY:                    
CURRENT LIABILITIES:                
Trade Payables   $ 2,833     $ 3,726  
Other Accounts Payables     2,377       3,151  
Total Current Liabilities     5,210       6,877  
LONG TERM LIABILITIES:                
Long-term Rent Liability     502       553  
Total Long-Term Liabilities   $ 502     $ 553  
STOCKHOLDERS’ STOCKHOLDERS’ EQUITY:                
Common Stock of $0.01 par value per share; 200,000,000 shares authorized at June 30, 2021 and December 31,                
2020; 13,240,961 and 12,824,463 shares issued at June 30, 2021 and, respectively December 31, 2020; 13,092,925                
and 12,728,446 shares outstanding at June 30, 2021 and December 31, 2020, respectively   $ 131     $ 128  
Additional Paid-in Capital     133,925       109,157  
Accumulated Deficit     (91,296 )     (70,887 )
Total Stockholders’ Equity     42,760       38,398  
Total Liabilities and Stockholders’ Equity   $ 48,472     $ 45,828  
                 

AYALA PHARMACEUTICALS, INC. 
CONDENSED CONSOLIDATED STATEMENTS OF OPERATIONS 
(Unaudited) 
(In thousands, except share & per share amounts)

     For the Three Months Ended
   For the Six Months Ended
     June 30,
   June 30,
      2021       2020       2021       2020  
                                 
Revenues from licensing agreement   $ 761     $ 1,045     $ 1,735     $ 2,046  
Cost of services     (761 )     (1,045 )     (1,735 )     (2,046 )
                                 
Gross profit                        
Operating expenses:                                
Research and development     8,121       5,067       15,046       10,195  
General and administrative     2,536       1,546       4,839       2,857  
                                 
Operating loss     (10,657 )     (6,613 )     (19,885 )     (13,052 )
Financial Income (Loss), net     (22 )     40       (114 )     2  
                                 
Loss before income tax     (10,679 )     (6,573 )     (19,999 )     (13,050 )
Taxes on income     (162 )     (139 )     (410 )     (260 )
                                 
Net loss attributable to common stockholders     (10,841 )     (6,712 )     (20,409 )     (13,310 )
Net Loss per share attributable to common stockholders, basic and diluted   $ (0.75 )   $ (0.74 )   $ (1.46 )   $ (1.90 )
Weighted average common shares outstanding, basic and diluted     14,417,423       9,018,637       13,954,676       6,989,762  

Release – Helius Medical Technologies, Inc. Reports Second Quarter 2021 Financial Results


Helius Medical Technologies, Inc. Reports Second Quarter 2021 Financial Results


NEWTOWN, Pa., Aug. 12, 2021 (GLOBE NEWSWIRE) — Helius Medical Technologies, Inc. (Nasdaq:HSDT) (TSX:HSM) (“Helius” or the “Company”), a neurotech company focused on neurological wellness, today reported financial results for the quarter ended June 30, 2021.

Second Quarter and Recent Business Updates

  • Frederick Fantazzia appointed Vice President of Sales & Marketing, North America, June 1, 2021
  • Dane Andreeff and Jeffrey Mathiesen appointed President & Chief Executive Officer and Chief Financial Officer, respectively, June 14, 2021
  • Antonella Favit-Van Pelt, M.D., Ph.D. appointed Chief Medical Officer, July 7, 2021
  • New website launched for U.S.-based patients and physicians: https://ponstreatment.com

Second Quarter 2021 Financial Summary

  • Revenue: $71 thousand, vs. $133 thousand in Q2 2020
  • Operating loss: $6.2 million vs. $3.7 million in Q2 2020
    • Q2 2021 included $1.9 million of increased non-cash stock-based compensation expense comprised of a one-time fully vested stock option grant valued at $1.0 million and stock options granted to key management and sales executives
  • Net loss: $6.0 million vs. $3.4 million in Q2 2020
  • Cash balance: $7.4 million at June 30, 2021 vs. $3.3 million at December 31, 2020

“Helius made important progress during the second quarter and in recent weeks in preparing for U.S. commercialization, following the receipt of U.S. marketing authorization of our PoNS device for MS in late March,” said Dane Andreeff, President and Chief Executive Officer of Helius. “Most notably, we enhanced and expanded our senior leadership team with the appointment of several highly qualified individuals, including a Vice President of Sales and Marketing for North America who will inform and lead our strategy to commercialize in the U.S. We also secured many of the required state licenses that will enable us to distribute and sell our PoNS device and are now cleared to sell in approximately 85% of states in the U.S. Lastly, we continued to develop our go-to-market strategy by refining our plan to initially target the estimated 130,000 MS patients with gait deficit who may require physical therapy. With respect to our operations in Canada, although the country remained severely impacted by the effects of the COVID-19 pandemic during the second quarter, with restrictions on both the clinics and patients we serve, we are cautiously optimistic that these headwinds will moderate in the second half of 2021 as the operating environment begins to recover.”

Mr. Andreeff continued: “During the second half of this year, we will remain keenly focused on pursuing our pre-commercial activities in order to meet our goal of beginning U.S. commercialization of our PoNS Treatment during the first quarter of 2022. Specifically, we plan to begin building our commercial team and appropriately engage centers of excellence to allow them to gain experience with PoNS in the target population, with the goal that they will then disseminate their experience with PoNS to colleagues and health care providers. The focus of these efforts will include the 10 states we have identified that comprise more than 50% of the targeted MS patients. We will also be engaging with payers in our pursuit to establish PoNS pricing in line with benchmark pricing for comparable devices used in the neurorehabilitation space. By executing on these near-term initiatives, we aim to bring our innovative PoNS technology to the aid of U.S. patients as quickly and efficiently as possible, which we believe represents the best path to creating value for our shareholders.”

Second Quarter 2021 Financial Results

Total revenue for the second quarter of 2021 was $71 thousand, compared to $133 thousand in the second quarter of 2020. Product sales represented 89% of total revenue in the second quarter of 2021 compared to 95% in the prior year period. Product sales in both periods were generated through sales of the PoNS device pursuant to supply agreements with PoNS Authorized clinic locations in Canada. License and fee revenue represented 11% of sales in the second quarter of 2021, compared with 5% of sales in the prior year period.

Gross profit for the second quarter of 2021 was $4 thousand, compared to gross profit of $69 thousand in the second quarter of 2020.

Operating expenses for the second quarter of 2021 increased $2.4 million, or 63% year-over-year, to $6.2 million, compared to $3.8 million in the second quarter of 2020. Operating expenses in the second quarter of 2021 included a $1.9 million increase in non-cash stock-based compensation expense comprised of a one-time fully vested stock option grant valued at $1.0 million and stock options granted in conjunction with the addition of key management and sales executives.

Operating loss for the second quarter of 2021 increased $2.5 million, or 66% year-over-year, to $6.2 million, compared to $3.7 million in the second quarter of 2020.

Total other income for the second quarter of 2021 was $185 thousand, compared to total other income of $361 thousand in the second quarter of 2020.

Net loss for the second quarter of 2021 was $6.0 million, or $(2.58) per basic and diluted common share, compared to a net loss of $3.4 million, or $(2.90) per basic and diluted common share, in the second quarter of 2020. Weighted average shares used to compute basic and diluted net loss per common share were 2.3 million and 1.2 million for the second quarter of 2021 and 2020, respectively.

Six Months Ended June 30, 2021 Financial Results

Total revenue for the six months ended June 30, 2021 was $155 thousand, compared to $339 thousand for the six months ended June 30, 2020. Product sales represented 90% of total revenue for the six months ended June 30, 2021, compared to 94% of total revenue for the six months ended June 30, 2020. Product sales in both periods were generated through sales of the PoNS device pursuant to supply agreements with PoNS Authorized clinic locations in Canada. License and fee revenue represented 10% of total revenue for the six months ended June 30, 2021, compared to 6% of total revenue for the six months ended June 30, 2020.

Gross profit for the six months ended June 30, 2021 was $72 thousand, compared to gross profit of $174 thousand for the six months ended June 30, 2020. Operating expenses for the six months ended June 30, 2021 increased $1.8 million, or 23% year-over-year, to $9.7 million, compared to $7.9 million for the six months ended June 30, 2020.

Operating loss for the six months ended June 30, 2021 increased $2.0 million, or 25% year-over-year, to $9.7 million, compared to operating loss of $7.7 million for the six months ended June 30, 2020. Operating expenses in the six months ended June 30, 2021 included a $1.7 million increase in stock-based compensation expense comprised of a one-time fully vested stock option grant valued at $1.0 million and stock options granted in conjunction with the addition of key management and sales executives.

Total other income for the six months ended June 30, 2021 was $324 thousand, compared to $394 thousand of total other expense for the six months ended June 30, 2020.

Net loss for the six months ended June 30, 2021 was $9.3 million, or $(4.29) per basic and diluted common share, compared to net loss of $8.1 million, or $(7.85) per basic and diluted common share, for the six months ended June 30, 2020. Weighted average shares used to compute basic and diluted net per share were 2.2 million and 1.0 million for the six months ended June 30, 2021 and the six months ended June 30, 2020, respectively.

Net cash provided by financing activities during the six months ended June 30, 2021 was $10.8 million.

As of June 30, 2021, the Company had cash of $7.4 million, compared to $3.3 million at December 31, 2020. The Company had no debt outstanding at June 30, 2021.

Conference Call

Management will host a conference call at 5:00 p.m. Eastern Time on August 12, 2021 to discuss the results of the quarter and business outlook. Those who would like to participate may dial 877-407-2988 (201-389-0923 for international callers) and provide access code 13721027. A live webcast of the call will also be provided on the Events section of the Company’s investor relations website at:

https://heliusmedical.com/index.php/investor-relations/events/upcoming-events.

For those unable to participate, a replay of the call will be available for two weeks at 877-660-6853 (201-612-7415 for international callers); access code 13721027. The webcast will be archived on the Events section of the Company’s investor relations website.

About Helius Medical Technologies, Inc.

Helius Medical Technologies is a neurotech company focused on neurological wellness. The Company’s purpose is to develop, license and acquire unique and non-invasive platform technologies that amplify the brain’s ability to heal itself. The Company’s first commercial product is the Portable Neuromodulation Stimulator (PoNS™). For more information, visit www.heliusmedical.com.

About the PoNS™ Device and PoNS Treatment™

The Portable Neuromodulation Stimulator (PoNS™) is an innovative non-surgical device, inclusive of a controller and mouthpiece, which delivers electrical stimulation to the surface of the tongue to provide treatment of gait deficit. The PoNS device is indicated for use in the United States as a short term treatment of gait deficit due to mild-to-moderate symptoms from multiple sclerosis (“MS”) and is to be used as an adjunct to a supervised therapeutic exercise program in patients 22 years of age and over by prescription only. It is authorized for sale in Canada as a class II, non-implantable, medical device intended as a short term treatment (14 weeks) of gait deficit due to mild and moderate symptoms from MS, and chronic balance deficit due to mild-to-moderate traumatic brain injury (“mmTBI”) and is to be used in conjunction with physical therapy. The PoNS™ is an investigational medical device in the European Union (“EU”) and Australia (“AUS”). It is currently under premarket review by the AUS Therapeutic Goods Administration.

Cautionary Disclaimer Statement: 

Certain statements in this news release are not based on historical facts and constitute forward-looking statements or forward-looking information within the meaning of the U.S. Private Securities Litigation Reform Act of 1995 and Canadian securities laws. All statements other than statements of historical fact included in this news release are forward-looking statements that involve risks and uncertainties. Forward-looking statements are often identified by terms such as “believe,” “continue,” “will,” “goal,” “aim to” and similar expressions. Such forward-looking statements include, among others, statements regarding the COVID-19 pandemic, including its impact on the Company, the Company’s future growth and operational progress, including pre-commercial activities for the PoNS device, and expected time to begin commercialization of the PoNS device in the U.S..

There can be no assurance that such statements will prove to be accurate and actual results and future events could differ materially from those expressed or implied by such statements. Important factors that could cause actual results to differ materially from the Company’s expectations include uncertainties associated with the Company’s capital requirements to achieve its business objectives, the impact of the COVID-19 pandemic, the Company’s ability to train physical therapists in the supervision of the use of the PoNS Treatment, the Company’s ability to secure contracts with rehabilitation clinics, the Company’s ability to obtain national Medicare coverage and to obtain a reimbursement code so that the PoNS device is covered by Medicare and Medicaid, the Company’s ability to build internal commercial infrastructure, secure state distribution licenses, build a commercial team and build relationships with Key Opinion Leaders, neurology experts and neurorehabilitation centers, market awareness of the PoNS device, future clinical trials and the clinical development process, manufacturing and supply chain risks, potential changes to the MCIT program resulting from the 60-day deferral of the program implementation, the product development process and FDA regulatory submission review and approval process, other development activities, ongoing government regulation, and other risks detailed from time to time in the “Risk Factors” section of the Company’s Annual Report on Form 10-K for the year ended December 31, 2020, its Quarterly Report on Form 10-Q for the quarter ended June 30, 2021 and its other filings with the United States Securities and Exchange Commission and the Canadian securities regulators, which can be obtained from either at www.sec.gov or www.sedar.com.

The reader is cautioned not to place undue reliance on any forward-looking statement. The forward-looking statements contained in this news release are made as of the date of this news release and the Company assumes no obligation to update any forward-looking statement or to update the reasons why actual results could differ from such statements except to the extent required by law.

The Toronto Stock Exchange has not reviewed and does not accept responsibility for the adequacy or accuracy of the content of this news release.

Helius Medical Technologies, Inc.
Unaudited Consolidated Balance Sheets
(Except for share data, amounts in thousands)

  June 30, 2021     December 31, 2020  
ASSETS              
Current assets              
Cash $ 7,425     $ 3,331  
Accounts receivable, net   51       74  
Other receivables   169       156  
Inventory, net   507       389  
Prepaid expenses   833       735  
Total current assets   8,985       4,685  
Property and equipment, net   449       486  
Other assets              
Goodwill   783       759  
Intangible assets, net   438       527  
Operating lease right-of-use asset, net   62       90  
Total other assets   1,283       1,376  
TOTAL ASSETS $ 10,717     $ 6,547  
LIABILITIES AND STOCKHOLDERS’ EQUITY              
Current liabilities              
Accounts payable $ 912     $ 747  
Accrued liabilities   873       1,337  
Operating lease liability   62       59  
Deferred revenue   290       281  
Total current liabilities   2,137       2,424  
Non-current liabilities              
Operating lease liability         32  
Deferred revenue   213       220  
TOTAL LIABILITIES   2,350       2,676  
STOCKHOLDERS’ EQUITY              
Preferred stock, $0.001 par value; 10,000,000 shares authorized; no shares issued and outstanding as of June 30, 2021 and December 31, 2020          
Class A Common stock, $0.001 par value; 150,000,000 shares authorized; 2,317,772 and 1,484,362 shares issued and outstanding as of June 30, 2021 and December 31, 2020, respectively   2       1  
Additional paid-in capital   138,023       123,872  
Accumulated other comprehensive loss   (1,412 )     (1,099 )
Accumulated deficit   (128,246 )     (118,903 )
TOTAL STOCKHOLDERS’ EQUITY   8,367       3,871  
TOTAL LIABILITIES AND STOCKHOLDERS’ EQUITY $ 10,717     $ 6,547  

Helius Medical Technologies, Inc.
Unaudited Consolidated Statements of Operations and Comprehensive Loss
(Amounts in thousands except share and per share data)

  Three Months Ended     Six Months Ended  
  June 30,     June 30,  
  2021     2020     2021     2020  
Revenue:                              
Product sales $ 63     $ 126     $ 140     $ 317  
Fee revenue                     9  
License revenue   8       7       15       13  
Total operating revenue   71       133       155       339  
Cost of sales:                              
Cost of product sales   67       64       83       165  
Gross profit   4       69       72       174  
Operating expenses:                              
Research and development   1,377       1,308       2,694       2,428  
Selling, general and administrative   4,744       2,394       6,939       5,255  
Amortization expense   49       89       106       215  
Total operating expenses   6,170       3,791       9,739       7,898  
Operating loss   (6,166 )     (3,722 )     (9,667 )     (7,724 )
Other income (expense):                              
Other income         56             63  
Change in fair value of derivative financial instruments         (1 )           3  
Foreign exchange gain (loss)   185       306       324       (460 )
Total other income (expense)   185       361       324       (394 )
Net loss   (5,981 )     (3,361 )     (9,343 )     (8,118 )
Other comprehensive loss:                              
Foreign currency translation adjustments   (185 )     (255 )     (313 )     381  
Comprehensive loss $ (6,166 )   $ (3,616 )   $ (9,656 )   $ (7,737 )
Net loss per share                              
Basic $ (2.58 )   $ (2.90 )   $ (4.29 )   $ (7.85 )
Diluted $ (2.58 )   $ (2.90 )   $ (4.29 )   $ (7.85 )
Weighted average shares outstanding                              
Basic   2,317,389       1,160,661       2,179,878       1,033,692  
Diluted   2,317,389       1,160,661       2,179,878       1,033,692  

Helius Medical Technologies, Inc.
Unaudited Condensed Consolidated Statements of Cash Flows
(Amounts in thousands)

  Six Months Ended  
  June 30,  
  2021     2020  
Cash flows from operating activities:              
Net loss $ (9,343 )   $ (8,118 )
Adjustments to reconcile net loss to net cash used in operating activities:              
Change in fair value of derivative financial instruments         (3 )
Stock-based compensation expense   3,156       1,571  
Unrealized foreign exchange (gain) loss   (323 )     433  
Depreciation expense   56       67  
Amortization expense   106       215  
(Recovery of) provision for doubtful accounts   (11 )     153  
Non-cash lease expense   30       196  
Intangible asset impairment         181  
Loss from disposal of property and equipment         110  
Gain from lease modification         (56 )
Changes in operating assets and liabilities:              
Accounts receivable   34       1  
Other receivables   (13 )     226  
Inventory   (118 )     28  
Prepaid expenses   (98 )     (105 )
Operating lease liability   (31 )     (126 )
Accounts payable   229       (1,288 )
Accrued liabilities   (366 )     (381 )
Deferred revenue   2       (83 )
Net cash used in operating activities   (6,690 )     (6,979 )
Cash flows from investing activities:              
Purchase of property and equipment   (19 )     (3 )
Proceeds from sale of property and equipment         61  
Internally developed software   (2 )     (7 )
Net cash (used in) provided by investing activities   (21 )     51  
Cash flows from financing activities:              
Proceeds from the issuance of common stock and accompanying warrants   11,037       7,233  
Share issuance costs   (1,523 )     (506 )
Proceeds from the exercise of warrants   1,320        
Proceeds from Paycheck Protection Program Loan         323  
Repayment of Paycheck Protection Program Loan         (323 )
Net cash provided by financing activities   10,834       6,727  
Effect of foreign exchange rate changes on cash   (29 )     6  
Net increase (decrease) in cash   4,094       (195 )
Cash at beginning of year   3,331       5,459  
Cash at end of year $ 7,425     $ 5,264  
CONTACT: Investor Relations Contact:

Westwicke on behalf of Helius Medical Technologies, Inc.
Jack Powell, Vice President
investorrelations@heliusmedical.com

Release – Onconova Therapeutics Reports Second Quarter 2021 Financial Results And Provides Business Update


Onconova Therapeutics Reports Second Quarter 2021 Financial Results And Provides Business Update


Conference call and live webcast at 4:30 p.m. ET today

NEWTOWN, Pa., Aug. 12, 2021 (GLOBE NEWSWIRE) — Onconova Therapeutics, Inc. (NASDAQ: ONTX) (“Onconova”), a clinical-stage biopharmaceutical company focused on discovering and developing novel products for patients with cancer, today announced financial results for the three months ended June 30, 2021 and provided a business update.

Highlights for the second quarter of 2021 and subsequent weeks include:

  • Enrollment in the first cohort of the Phase 1 solid tumor study of ON 123300 in the United States is complete with no dose limiting toxicities (DLT’s) observed. The second cohort is currently open for enrollment.
  • The Phase 1 solid tumor study of ON 123300 in China is ongoing with no DLT’s observed to date. The study is currently enrolling the third dose cohort.
  • The investigator-initiated Phase 1/2 study evaluating rigosertib in combination with the checkpoint inhibitor nivolumab in KRAS mutated non-small cell lung cancer (NSCLC) continues to progress. Initial data from the trial provide preliminary evidence of the anti-cancer activity of rigosertib-nivolumab combination therapy in patients who had previously failed all standard of care treatment, including checkpoint inhibition, and show that the maximum tolerated dose of rigosertib in combination with nivolumab was not yet determined in the three cohorts of the trial’s dose-escalation phase.
  • The first patient was dosed in an investigator-initiated Phase 2 study designed to assess the efficacy and safety of rigosertib in patients with recessive dystrophic epidermolysis bullosa (RDEB)-associated locally advanced/metastatic squamous cell carcinoma (SCC), an ultra-rare and invariably fatal condition.
  • The Company strengthened its management team with the appointment of Mark Gelder, M.D., as Chief Medical Officer.
  • Preclinical data published in the peer-reviewed journal Molecular Cancer show that rigosertib synergistically enhanced the efficacy of immune checkpoint blockade in a murine melanoma model via the induction of immune-mediated cancer cell death, supporting the continued clinical evaluation of rigosertib in combination with checkpoint inhibitors.

Management Commentary

“During the second quarter we achieved key clinical and corporate milestones,” said Steven M. Fruchtman, M.D., President and Chief Executive Officer of Onconova. “In our lead ON 123300 program, we initiated our U.S. Phase 1 study and recently opened enrollment to the second cohort, and our partner, HanX Biopharmaceuticals, is currently enrolling to the third dose cohort of the complementary Phase 1 study underway in China. Through these trials, which are evaluating different dosing administration regimens, we aim to inform the design of a future Phase 2 basket trial evaluating ON 123300 in multiple high unmet need indications, including CDK 4/6 inhibitor refractory HR+ HER2- metastatic breast cancer. Given ON 123300’s ability in preclinical studies to overcome resistance to the most widely prescribed CDK 4/6 inhibitor, we believe this novel multi-kinase inhibitor has the potential to be a best-in-class therapy for this and other cancers.”

Dr. Fruchtman continued, “Beyond our lead program, we also reported very encouraging preliminary results from the investigator-initiated study evaluating rigosertib plus nivolumab in advanced KRAS-mutated NSCLC. These results highlighted the doublet’s favorable safety profile and provided preliminary evidence of efficacy in an extremely challenging patient population. Additional preliminary data from the trial is expected to be presented at a RAS-focused medical meeting in September. Looking forward, we will continue to leverage investigator-initiated programs to further rigosertib’s clinical development, while maintaining our primary focus and resources on ON 123300. Milestones ahead for the remainder of the year include continued progress of our ON 123300 clinical trials, expansion of rigosertib investigator-initiated studies program, and potentially acquiring new assets to augment our pipeline. With a strong financial position and a talented management team that was recently bolstered by the appointment of Dr. Mark Gelder as CMO, we believe we are well positioned to take advantage of the product development opportunities presented.”

Second Quarter Financial Results

Cash and cash equivalents as of June 30, 2021 were $43.7 million, compared with $19.0 million as of December 31, 2020. The Company believes that its cash and cash equivalents will be sufficient to fund ongoing clinical trials and business operations for more than eighteen months.

Research and development expenses were $1.9 million for the second quarter of 2021, compared with $4.8 million for the second quarter of 2020. The decrease was primarily related to higher clinical trial and consulting expenses in the 2020 period due to the INSPIRE study.

General and administrative expenses were $2.9 million for the second quarter of 2021, compared with $2.6 million for the second quarter of 2020. The increase was primarily due to expenses related to special meetings by proxy in the 2021 period.

Net loss for the second quarter of 2021 was $4.2 million, or $0.27 per share on 15.8 million weighted average shares outstanding, compared with a net loss for the second quarter of 2020 of $7.4 million, or $0.65 per share on 11.3 million weighted average shares outstanding.

Conference Call and Webcast

Onconova will host an investment community conference call today beginning at 4:30 p.m. Eastern Time, during which management will discuss financial results for the second quarter of 2021, provide a business update and answer questions. Interested parties can participate by dialing (855) 428-5741 (domestic callers) or (210) 229-8823 (international callers) and using conference ID 3876025.

A live webcast of the conference call will be available in the Investors & Media section of the Company’s website at www.onconova.com. A replay of the webcast will be available on the Onconova website for 90 days following the call.

About Onconova Therapeutics, Inc.
Onconova Therapeutics is a clinical-stage biopharmaceutical company focused on discovering and developing novel products for patients with cancer. The Company has proprietary targeted anti-cancer agents designed to disrupt specific cellular pathways that are important for cancer cell proliferation.

Onconova’s novel, proprietary multi-kinase inhibitor ON 123300 is being evaluated in two separate and complementary Phase 1 dose-escalation and expansion studies. These trials are currently underway in the United States and China.

Onconova’s product candidate rigosertib is being studied in an investigator-initiated study program, including in a dose-escalation and expansion Phase 1/2a investigator-initiated study targeting patients with KRAS+ non-small cell lung cancer with oral rigosertib in combination with nivolumab.

For more information, please visit www.onconova.com.

Forward-Looking Statements
Some of the statements in this release are forward-looking statements within the meaning of Section 27A of the Securities Act of 1933, as amended, Section 21E of the Securities Exchange Act of 1934, as amended, and the Private Securities Litigation Reform Act of 1995, and involve risks and uncertainties. These statements relate to Onconova’s expectations regarding the timing of Onconova’s and investigator-initiated clinical development and data presentation plans, and the mechanisms and indications for Onconova’s product candidates. Onconova has attempted to identify forward-looking statements by terminology including “believes,” “estimates,” “anticipates,” “expects,” “plans,” “intends,” “may,” “could,” “might,” “will,” “should,” “preliminary,” “approximately” or other words that convey uncertainty of future events or outcomes. Although Onconova believes that the expectations reflected in such forward-looking statements are reasonable as of the date made, expectations may prove to have been materially different from the results expressed or implied by such forward-looking statements. These statements are only predictions and involve known and unknown risks, uncertainties, and other factors, including the success and timing of Onconova’s clinical trials, investigator-initiated trials and regulatory agency and institutional review board approvals of protocols, Onconova’s collaborations, the timing of the Company’s annual stockholder meeting, market conditions and those discussed under the heading “Risk Factors” in Onconova’s most recent Annual Report on Form 10-K and quarterly reports on Form 10-Q. Any forward-looking statements contained in this release speak only as of its date. Onconova undertakes no obligation to update any forward-looking statements contained in this release to reflect events or circumstances occurring after its date or to reflect the occurrence of unanticipated events.

Company Contact:
Avi Oler
Onconova Therapeutics, Inc.
267-759-3680
ir@onconova.us
https://www.onconova.com/contact/

Investor Contact:
Bruce Mackle
LifeSci Advisors, LLC
646-889-1200
bmackle@lifesciadvisors.com


(Tables to follow)


ONCONOVA THERAPEUTICS, INC.   
 
Condensed Consolidated Balance Sheets   
 
(in thousands)   
  June 30,   December 31,
    2021       2020  
Assets (unaudited)    
Current assets:      
    Cash and cash equivalents $ 43,709     $ 19,025  
    Receivables   27       37  
    Prepaid expenses and other current assets   457       722  
        Total current assets   44,193       19,784  
Property and equipment, net   45       52  
Other non-current assets   140       150  
Total assets $ 44,378     $ 19,986  
       
Liabilities and stockholders’ equity      
Current liabilities:      
    Accounts payable $ 4,290     $ 4,833  
    Accrued expenses and other current liabilities   2,983       4,962  
    Deferred revenue   226       226  
        Total current liabilities   7,499       10,021  
Warrant liability   530       321  
Deferred revenue, non-current   3,356       3,469  
Total liabilities   11,385       13,811  
       
Stockholders’ equity:      
    Preferred stock          
    Common stock   158       124  
    Additional paid in capital   470,335       434,593  
    Accumulated other comprehensive income   2       14  
    Accumulated deficit   (437,502 )     (428,556 )
Total stockholders’ equity   32,993       6,175  
Total liabilities and stockholders’ equity $ 44,378     $ 19,986  


 ONCONOVA THERAPEUTICS, INC.  
 
 Condensed Consolidated Statements of Operations (unaudited)
 
 (in thousands, except share and per share amounts) 
               
  Three Months Ended June 30,   Six months months ended June 30,
    2021       2020       2021       2020  
               
Revenue $ 57     $ 56     $ 113     $ 108  
Operating expenses:              
    General and administrative   2,850       2,594       5,067       4,401  
    Research and development   1,852       4,801       3,789       8,171  
        Total operating expenses   4,702       7,395       8,856       12,572  
Loss from operations   (4,645 )     (7,339 )     (8,743 )     (12,464 )
               
Change in fair value of warrant liability   427       (56 )     (209 )     (119 )
Other (loss) income, net   (13 )           6       96  
Net loss   (4,231 )     (7,395 )     (8,946 )     (12,487 )
Net loss per share of common stock, basic and diluted $ (0.27 )   $ (0.65 )   $ (0.59 )   $ (1.14 )
Basic and diluted weighted average shares outstanding   15,780,863       11,303,508       15,201,719       10,996,624  

Debt Limit Debates Impact on Stocks and U.S. Credit Ratings


Debt Ceiling Season’s Impact on Stocks and U.S. Credit Ratings


The debt ceiling wrestling match and the U.S. Treasury’s inability to meet the responsibilities of the U.S. Government are likely to cause higher market volatility in the coming months. The suspension of debt limits has just expired, this kicks off the 2021 season, and a note from Janet Yellen is about to make a lot of people concerned.

The debt ceiling (statutory debt limit) is the maximum amount of debt the United States can have outstanding in Treasury debt.  The limit had been suspended in March of 2020 to keep the economy afloat by raising money through debt for businesses and individuals. The suspension was not indefinite and has recently expired.


The balance in the Treasury General Account (TGA), which is effectively the checking account for bill paying by the US government, has plunged from $1 trillion at the end of April, to $435 billion this week (August 12). This steep plunge in altitude was required to comply with the end of the statutes’ hiatus. In January, the Secretary of the Treasury Yellen said it would draw down the TGA from its then level of $1.6 trillion to $500 billion by this summer. On August 1, the existing debt ceiling became effective. According to the letter Yellen wrote to the House Speaker and Senate leaders there are immediate expenses that won’t be able to get paid. 

In this letter to Congress concerning the US meeting entitlement obligations, Yellen spelled out to Congress some “extraordinary measures,” the Treasury will take to keep the US from defaulting. The three large government-funded retirement systems topped her list:

-The Civil Service Retirement and Disability Fund

-The Postal Service Retiree Health Benefits Fund.

-The Government Securities Investment Fund (G Fund) of the Thrift Savings Fund that are part of the Federal Employees’ Retirement System.

All entitlements above are required by law to be (eventually) funded and are expected to be made whole as money becomes available by Congress hiking the amount of debt the Treasury can borrow by issuing US Treasury obligations.

If the debt ceiling is not raised by Congress, (or taxes hiked and budgets slashed), this list will grow. At some point, if money isn’t made available there will be concern that the US Treasury won’t be able to meet its debt payments. This will draw a reaction by rating agencies and investors.  For example, in August of 2011, the rating agency S&P cut the U.S. credit rating to AA+ and maintained a negative outlook. With the ratings change S&P analysts cited concerns of growing budget deficits. Rating downgrades typically cause investors (lenders) to seek higher interest rates for their new perceived risk.

Rating Agencies

Fitch, a Nationally Recognized Statistical Rating Organization (NRSRO), placed the US’s credit rating on negative outlook in July of 2020. Last month while reaffirming its AAA rating Fitch expressed heightened concern of financial activity they say will push the country further from a stabilized debt burden. The NRSRO said the US could be downgraded without a plan to balance debt and spending “in the post-pandemic phase.”

In June, Moody’s expressed its views about the US debt burden. “While the coronavirus pandemic has created unprecedented challenges for the US economy and exacerbated the pace of deterioration of the government’s fiscal position, Moody’s expects the US economy to recover over time and the sovereign’s credit profile to remain resilient to the shock,”

S&P, the third NRSRO covering US debt has a stable outlook on its AA+ rating. This maintained level is based on the dollar’s reserve status and institutional strengths, as well as the credibility of the Federal Reserve.


Looking Toward History for Guidance on Debt

The current year may not follow the pattern of other years as there have been many new and inventive financial strategies the US has taken to achieve goals over the past 18 months. However, this is what has generally happened each year over the decades (the statutory debt ceiling was enacted in 1917). 

Since 1960, each time the debt ceiling needed to be raised by Congress to pay bills required by Congress, those involved in working out the solution let the activity go down to the wire thereby creating an emergency situation. Defaulting on Treasury debt would topple world bond and equity markets while likely strengthening some commodities like gold and silver. Each time this has happened concessions were made, the debt ceiling was either raised or extended (or suspended), and we moved on until the following year when debt ceiling season.

Take-Away

Debt ceiling season this year has all the ingredients it needs to be even more tumultuous. The government debt is viewed as excessive relative to GDP. Washington’s spending “guarantees” have grown dramatically, there are still some concerned about how ready workers are to return to work, and money is flowing from the Treasury’s checkbook at a pace of $100 billion per week.

During past years the talk of if there “will be a deal,” “will they vote on a deal,” “they have a deal but Congress is on vacation,” sends the stock market into a volatility-tizzy. There’s no reason to expect this year’s to not be disruptive.

Stay in touch with our updates on the economy, exciting industries, and company research by registering at no cost at Channelchek.

Paul Hoffman

Managing Editor, Channelchek


Suggested Reading:


What Metals Can Tell Us About the Economy


The Correlation Between Stocks and Unemployment


Metals & Mining – Second Quarter 2021 Review and Outlook


Energy Industry – 2021 2Q Review and Outlook


Sources:

https://home.treasury.gov/system/files/136/Debt-Limit-Letter-Congress_20210802_Pelosi.pdf

https://home.treasury.gov/news/press-releases/jy0304

https://www.federalreserve.gov/releases/h41/

https://www.bbc.com/news/world-us-canada-14428930

https://www.moodys.com/research/Moodys-affirms-United-States-Aaa-rating-maintains-stable-outlook–PR_423587


Stay up to date. Follow us: