|
|
|
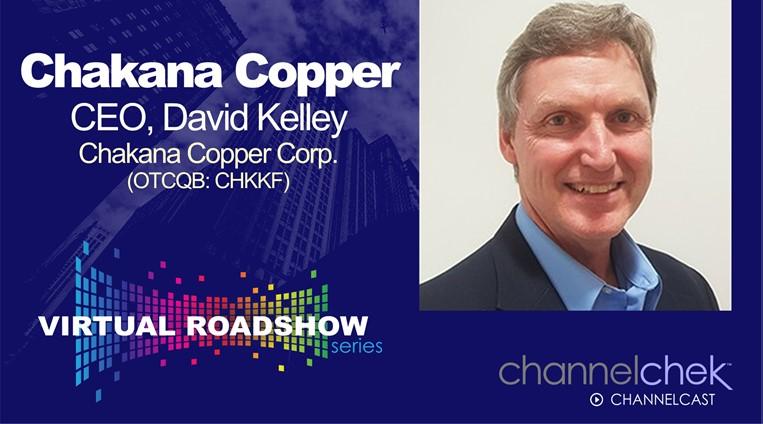
Chakana Copper CEO David Kelley makes a formal corporate presentation. Afterwards, he is joined by Noble Capital Markets Senior Research Analyst Mark Reichman for a Q & A session. Research, News, and Advanced Market Data on CHKKFInformation on upcoming live virtual roadshows
About Chakana Copper Chakana Copper Corp is a Canadian-based minerals exploration company that is currently advancing the Soledad Project located in the Ancash region of Peru, a highly favorable mining jurisdiction with supportive communities. The Soledad Project consists of high-grade gold-copper-silver mineralization hosted in tourmaline breccia pipes. A total of 55,000 metres of exploration and resource definition drilling has been completed since 2017, testing 15 of 110 total exploration targets, confirming that Soledad is a large, well-endowed mineral system with strong exploration upside. Chakana’s investors are uniquely positioned as the Soledad Project provides exposure to several metals including copper, gold, and silver. For more information on the Soledad project, please visit the website at www.chakanacopper.com. |
Month: July 2021
Release – Coeur Reports Second Quarter 2021 Results
Coeur Reports Second Quarter 2021 Results
Reaffirms Production Guidance; Updates Cost and Capital Expenditure Guidance
Contacts
Coeur Mining, Inc.
104 S. Michigan Avenue, Suite 900
Chicago, IL 60603
Attention: Paul DePartout, Director, Investor Relations
Phone: (312) 489-5800
www.coeur.com
Heres How the 100 Most Recognizable Companies Compare in Terms of Brand Reputation
I
Here’s How the 100 Most Recognizable Companies Compare in Terms of Brand Reputation
How was Brand Reputation Measured?
Nearly 43,000 Americans were polled nationally to find out which 100 companies emerge as top of mind—both positive and negative.
The polling was conducted by Axios Harris and asked
which two companies the respondent felt excelled or faltered in the U.S.—in other words, which companies were the most “visible” in their eyes.
The top 100 brands that emerged from this framework were then judged by poll respondents across seven dimensions, over three key pillars:
- Character
Includes a company’s culture, ethics, and citizenship (whether a consumer shares a company’s values or the company supports good causes) - Trajectory
Includes a company’s growth prospects, vision for the future, and product and service offerings (whether they are innovative, and of high quality) - Trust
Does a consumer trust the brand in the first place?
Once these dimensions are taken into account, the final scores portray how these “visible brands” rank in terms of their reputation among a representative sample of Americans:
- Score range: 80.0 and above
Reputation: Excellent - Score range: 75.0-79.9
Reputation: Very Good - Score range: 70.0-74.9
Reputation: Good - Score range: 65.0-69.9
Reputation: Fair - Score range: 64.9 and below
Reputation: Poor
Companies with a Very Poor reputation (a score below 50) didn’t make it on the list. Here’s how the 100 most visible companies stack up in terms of brand reputation:

Source:
Release – Comstock Forms Joint Venture with Lakeview Energy

Comstock Forms Joint Venture with Lakeview Energy
Acquires 50% Stake in 200,000 Pound Per Day Hemp Extraction, Remediation, and Refinement Facility
VIRGINIA CITY, NEVADA, July 29, 2021 – Comstock Mining Inc. (NYSE: LODE) (“Comstock” and the “Company”) today announced the execution of a series of agreements with Lakeview Energy LLC (“Lakeview”) and its subsidiaries, pursuant to which the Company acquired 50% of the equity of Lakeview’s subsidiary, LP Biosciences LLC (“LPB”), and agreed to provide the financing needed to retrofit LPB’s pre-existing industrial scale solvent extraction and valorization facility in Merrill, Iowa (“LPB Facility”), for the production of an array of wholesale products from up to 200,000 pounds per day of industrial hemp. Comstock issued 3,500,000 restricted shares of its common stock to LPB in connection with its acquisition and financing commitments, and simultaneously acquired 100% of MANA Corporation (“MANA”), an industrial hemp technology development, marketing, and management company, for 4,200,000 restricted shares of Comstock common stock.
Industrial Scale Infrastructure
Industrial hemp is an extraordinary natural resource with tens of thousands of known applications, including food, feed, fuel, and fiber, and an array of emerging applications in batteries, bioplastics, and other renewable alternatives to fossil fuel derived products. However, hemp’s ability to produce over 400 natural phytochemicals, such as cannabidiol (“CBD”) and cannabigerol (“CBG”), has recently garnered significant attention as some of those chemicals are seen to have compelling potential in health and wellness applications. The corresponding green rush propelled global demand and sales of industrial hemp products to an estimated $1.9 billion as of 2020, and the industry is expected to grow to $6.9 billion worldwide by 2025, according to Hemp Industry Daily.
“The processing infrastructure needed to achieve those aspirations does not exist today at the scales and sophistication expected of mature supply chains for comparable commodities,” said MANA’s Chief Executive Officer, William McCarthy. “The absence of large scale capacity represents the hemp industry’s most significant bottleneck today. MANA is addressing that deficiency by acquiring and partnering with experienced agriproducts management teams and pre-existing industrial scale facilities in adjacent agricultural markets. We are excited to do so today with Comstock, Lakeview, and the LPB Facility, and we’re looking forward to making a market leading contribution to the debottlenecking and evolution of the industry.”
Mature Agriproducts Management
Lakeview is an experienced agriproducts management company that owns and operates three renewable fuels facilities, including two 55 million gallon dry mill corn ethanol facilities located in Ohio and Iowa, and a 10 million gallon per year biodiesel production facility located in Missouri. Importantly, LPB’s LPB Facility is ideally co-located with Lakeview’s ethanol facility in Iowa, where the two facilities can exploit operational and other synergies to maximize throughput, profitability, and cash flow. Comstock’s and MANA’s agreements with Lakeview call for Lakeview to provide construction, operating, administrative, logistics, commodities, risk management and other services to LPB as the parties work together to build, operate and grow the LPB Facility. MANA additionally agreed to provide a suite of complimentary technology, marketing and other management services, with a focus on acquiring and using pre-existing and new feedstock and offtake arrangements to fill the LPB Facility.
“Industrial hemp has remarkable potential in several important respects, including its potential for new jobs and stimulating economic, environmental and social value creation in our community,” said Jim Galvin, Lakeview’s Chief Executive Officer. “We’re pleased to partner with Comstock and MANA as we upgrade and use the LPB Facility to provide comprehensive hemp extraction, remediation, and refinement services at scales that are currently unheard of in the hemp industry.”
Industry Leading Scale, Quality, Compliance, and Flexibility
Comstock’s Executive Chairman and Chief Executive Officer, Corrado DeGasperis, added: “We are proud to have assembled a world class asset with a team of industry veterans, process engineers, and partners to rapidly retrofit and commence operations with the LPB Facility, thereby setting a global standard for quality, compliance, consistency, flexibility and speed at an extraordinary scale. Once retrofits are complete in mid-2022, the LPB Facility will generate significant free cash flow by servicing the most astute, demanding, and rapidly growing buyers of wholesale hemp products with custom tailored solutions.”
The LPB Facility is conservatively expected to scale up to its initial nameplate capacity exceeding 200,000 pounds per day and 36,500 tons per year of industrial hemp over its first three years of operations, as it extracts, remediates, and refines oil from industrial hemp to generate annualized revenues exceeding $53,000,000, $154,000,000, and $409,000,000 per year during LPB’s first, second, and third full years of operations, respectively, as shown in the following excerpt from LPB’s internal projections:
Ecosystem of Strategic Feedstocks, Processes and Products
DeGasperis concluded: “Comstock is focused on the rapid and simultaneous maximization of financial, natural, and social impact, in large part by building an ecosystem of strategic extraction and valorization facilities with complimentary feedstocks and products. In this example, the LPB Facility’s revenue estimates are based only on the oil fraction of industrial hemp, which corresponds to a small portion of total feedstock biomass. The rest of that biomass is mostly comprised of cellulose with many known co-product applications, as well as some very exciting new applications that we are actively evaluating for use in our existing and planned new decarbonization efforts.”
About Comstock Mining Inc.
Comstock Mining Inc. (NYSE: LODE) (the “Company”) is an emerging innovator and leader in the sustainable extraction, valorization, and production of scarce natural resources, with a focus on high value strategic materials that are essential to meeting the rapidly increasing global demand for clean energy, carbon-neutrality, and natural products. To learn more, please visit www.comstockmining.com.
Forward-Looking Statements
This press release and any related calls or discussions may include forward-looking statements within the meaning of Section 27A of the Securities Act of 1933, as amended, and Section 21E of the Securities Exchange Act of 1934, as amended. All statements, other than statements of historical facts, are forward-looking statements. The words “believe,” “expect,” “anticipate,” “estimate,” “project,” “plan,” “should,” “intend,” “may,” “will,” “would,” “potential” and similar expressions identify forward-looking statements, but are not the exclusive means of doing so. Forward-looking statements include statements about matters such as: consummation of all pending transactions; project, asset or Company valuations; future industry market conditions; future explorations, acquisitions, investments and asset sales; future performance of and closings under various agreements; future changes in our exploration activities; future estimated mineral resources; future prices and sales of, and demand for, our products; future operating margins; available resources; environmental conservation outcomes; future impacts of land entitlements and uses; future permitting activities and needs therefor; future production capacity and operations; future operating and overhead costs; future capital expenditures and their impact on us; future impacts of operational and management changes (including changes in the board of directors); future changes in business strategies, planning and tactics and impacts of recent or future changes; future employment and contributions of personnel, including consultants; future land sales, investments, acquisitions, joint ventures, strategic alliances, business combinations, operational, tax, financial and restructuring initiatives; the nature and timing of and accounting for restructuring charges and derivative liabilities and the impact thereof; contingencies; future environmental compliance and changes in the regulatory environment; future offerings of equity or debt securities; asset sales and associated costs; future working capital, costs, revenues, business opportunities, debt levels, cash flows, margins, earnings and growth. These statements are based on assumptions and assessments made by our management in light of their experience and their perception of historical and current trends, current conditions, possible future developments and other factors they believe to be appropriate. Forward-looking statements are not guarantees, representations or warranties and are subject to risks and uncertainties, many of which are unforeseeable and beyond our control and could cause actual results, developments and business decisions to differ materially from those contemplated by such forward-looking statements. Some of those risks and uncertainties include the risk factors set forth in our filings with the SEC and the following: counterparty risks; capital markets’ valuation and pricing risks; adverse effects of climate changes or natural disasters; global economic and capital market uncertainties; the speculative nature of gold or mineral exploration, including risks of diminishing quantities or grades of qualified resources; operational or technical difficulties in connection with exploration or mining activities; contests over title to properties; potential dilution to our stockholders from our stock issuances and recapitalization and balance sheet restructuring activities; potential inability to comply with applicable government regulations or law; adoption of or changes in legislation or regulations adversely affecting businesses; permitting constraints or delays; decisions regarding business opportunities that may be presented to, or pursued by, us or others; the impact of, or the non-performance by parties under agreements relating to, acquisitions, joint ventures, strategic alliances, business combinations, asset sales, leases, options and investments to which we may be party; changes in the United States or other monetary or fiscal policies or regulations; interruptions in production capabilities due to capital constraints; equipment failures; fluctuation of prices for gold or certain other commodities (such as silver, zinc, cyanide, water, diesel fuel and electricity); changes in generally accepted accounting principles; adverse effects of terrorism and geopolitical events; potential inability to implement business strategies; potential inability to grow revenues; potential inability to attract and retain key personnel; interruptions in delivery of critical supplies, equipment and raw materials due to credit or other limitations imposed by vendors or others; assertion of claims, lawsuits and proceedings; potential inability to satisfy debt and lease obligations; potential inability to maintain an effective system of internal controls over financial reporting; potential inability or failure to timely file periodic reports with the SEC; potential inability to list our securities on any securities exchange or market; inability to maintain the listing of our securities; and work stoppages or other labor difficulties. Occurrence of such events or circumstances could have a material adverse effect on our business, financial condition, results of operations or cash flows or the market price of our securities. All subsequent written and oral forward-looking statements by or attributable to us or persons acting on our behalf are expressly qualified in their entirety by these factors. Except as may be required by securities or other law, we undertake no obligation to publicly update or revise any forward-looking statements, whether as a result of new information, future events, or otherwise.
Neither this press release nor any related calls or discussions constitutes an offer to sell, the solicitation of an offer to buy or a recommendation with respect to any securities of the Company, the fund or any other issuer.
| Contact Information | ||
| Comstock Mining Inc.
P.O. Box 1118 Virginia City, NV 89440 |
Corrado De Gasperis
Executive Chairman & CEO Tel (775) 847-4755 degasperis@comstockmining.com |
Zach Spencer
Director of External Relations Tel (775) 847-5272 Ext.151 questions@comstockmining.com |
Comtech Telecommunications Corp. Awarded Multi-Million Dollar Order for New Ground Station Development Contract

Comtech Telecommunications Corp. Awarded Multi-Million Dollar Order for New Ground Station Development Contract
“We are pleased that our long-term customer continues to rely on
The contract was awarded to Comtech’s Space and Component Technology (“SCT”) division, which specializes in providing ground station services in the form of turnkey site development, infrastructure, operations and maintenance of several range tracking stations in the
Certain information in this press release contains statements that are forward-looking in nature and involve certain significant risks and uncertainties. Actual results could differ materially from such forward-looking information. The Company’s
Comtech Investor Relations:
631-962-7005
investors@comtech.com
Source:
Release – Seanergy Maritime Holdings Corp. Reports Financial Results for the Second Quarter and Six Months Ended June 30 2021

Seanergy Maritime Holdings Corp. Reports Financial Results for the Second Quarter and Six Months Ended June 30, 2021
Seanergy Maritime Holdings Corp. Reports Financial Results for the Second Quarter and Six Months Ended June 30, 2021
Highlights of the Second Quarter of 2021:
- Gross revenues: $28.9 million in Q2 2021 compared to $9.3 million in Q2 2020, up 209%
- Net income: $2.0 million in Q2 2021, as compared to a net loss of $11.3 million in Q2 2020
- EBITDA1: $10.8 million in Q2 2021, as compared to negative $2.1 million in Q2 2020
- Adjusted EBITDA1: $11.3 million in Q2 2021, as compared to negative $1.8 million in Q2 2020
Highlights of First Six Months of 2021:
- Gross revenues: $50.0 million in 6M 2021 compared to $23.1 million in 6M 2020, up 116%
- Net income: $0.6 million in 6M 2021, as compared to a net loss of $19.6 million in 6M 2020
- EBITDA1: $17.3 million in 6M 2021 as compared to negative $1.1 million in 6M 2020
- Adjusted EBITDA1: $19.2 6M 2021, as compared to negative $0.5 million in 6M 2020
Second Quarter of 2021 and Recent Developments:
- Fleet increase by 45% with the delivery of 5 modern Japanese Capesizes
- Fleet modernization through substitution of the fleet’s oldest Capesize with an eight year younger vessel
- New time charter agreements with prominent charterers
- Financing and refinancing transactions of $117.3 million including a $30.9 million sale and leaseback & new loan commitment
July 29, 2021 – Athens, Greece – Seanergy Maritime Holdings Corp. (the “Company”) (NASDAQ: SHIP), announced today its financial results for the second quarter ended June 30, 2021.
For the quarter ended June 30, 2021, the Company generated gross revenues of $28.9 million, a 209% increase compared to the second quarter of 2020. Adjusted EBITDA for the quarter was $11.3 million, from negative $1.8 million in the same period of 2020. Net income for the second quarter was $2.0 million compared to net loss of $11.3 million in the second quarter of 2020. The daily Time Charter Equivalent (“TCE”)1 of the fleet for the second quarter of 2021 was $20,095, marking a 270% increase compared $5,424 for the second quarter of 2020.
For the six-month period ended June 30, 2021, gross revenues were $50.0 million, increased by 116% when compared to $23.1 million in same period of 2020. Adjusted EBITDA for the first six months of 2021 was $19.2 million, compared to a negative adjusted EBITDA of $0.5 million in the same period of 2020. The daily TCE of the fleet for the first six months of 2021 was $18,327 compared to $6,985 in the first six months of 2020. The average daily OPEX was $5,766 compared to $5,353 of the respective period of 2020.
Cash and cash-equivalents, restricted cash and term deposits as of June 30, 2021 stood at $56.4 million. Shareholders’ equity at the end of the second quarter was $199.4 million, vs. $95.7 million in December 31, 2020. Long-term debt (senior and junior loans and financial leases) stood at $203.8 million as of June 30, 2021, from $169.8 million as of the end of 2020. In the same period, following the addition of four of our new acquisitions, the book value of our fleet (including vessels held for sale and advances for vessel acquisitions) increased by 43.3% to $367.9 million from $256.7 million.
Third Quarter 2021 TCE Guidance:
As of the date hereof, approximately 94% of the Company fleet’s expected operating days in the third quarter of 2021 have been fixed at an estimated TCE of approximately $28,8802, or 63% higher than the TCE recorded in the first half of the year. Our TCE guidance for the third quarter of 2021 includes certain conversions (8 vessels) of index-linked charters to fixed for the 3-month period ending on September 30, 2021 which were concluded in the first and second quarter of 2021 as part of our freight hedging strategy. The following table provides the break-down:
| Operating Days | TCE | |
| TCE – fixed rate (index-linked conversion) | 719.6 | $28,049 |
| TCE – fixed rate | 136.6 | $28,782 |
| TCE – index linked & spot | 591.9 | $29,913 |
| Total / Average | 1,448.1 | $28,880 |
Stamatis Tsantanis, the Company’s Chairman & Chief Executive Officer, stated:
“The six-month period that ended on June 30, 2021, marks a significant turning point for Seanergy, with strong financial performance, being the first profitable first-half since the Company’s relaunching in 2015. Most importantly, we have successfully concluded many milestone transactions that saw Seanergy’s fleet growing by more than 60% while solidifying our financial standing.
Concerning our results for the second quarter of 2021, our daily TCE was approximately $20,000, marking an increase of 270% compared to the TCE of the second quarter of 2020. The TCE of the fleet for the first 6 months of 2021 was about $18,300 per day as compared to a daily TCE of approximately $7,000 in the first half of 2020. As discussed in our last earnings release, our TCE performance in the second quarter was affected by certain less favorable conversions of index-linked charters to fixed which were concluded in the fourth quarter of 2020 as part of our freight hedging strategy. However, our Q3 guidance is very strong at close to $29,000 per day. Adjusted EBITDA for the second quarter and first half of 2021 was $11.3 million and $19.2 million respectively, as compared to negative adjusted EBITDA by $1.85 million and $0.5 million in the respective periods of 2020. Net result for the quarter was a profit of $2.0 million, which was sufficient to reverse the slight losses of the first quarter of the year resulting in a profitable first half for our Company.
Regarding our fleet growth and renewal strategy, since the beginning of the year, our investment in our fleet has totaled approximately $160 million, and we have agreed to acquire 6 high-quality Japanese Capesize bulkers of an average age of 10.5 years, with the most recent acquisition being that of the 2009 built M/V Friendship. This vessel will essentially replace the oldest vessel in our fleet, the 2001 built M/V Leadership, which we agreed to sell to third-party buyers. This asset swap is improving the age profile of our fleet and enhances its competitiveness and compliance with the upcoming environmental regulations.
To date we have taken delivery of five out of the six new acquisitions and the last vessel, the 2012 built Worldship is scheduled to be delivered to us in August, followed by the delivery of the M/V Leadership to her new owners in September. The total investment capex of about $160 million has been fully funded by our cash reserves, which remain strong following these acquisitions, and newly concluded debt financing arrangements.
On the debt financing front, in the first half of 2021, we have successfully concluded new financings and refinancings of $104.3 million whilst making $69.7 million prepayments and repayments on our legacy debt facilities. The resulting net increase in our debt by $34.6 million, against an increase in the book value of our fleet by $158.9 million, implies a 22% effective loan-to-value on our new acquisitions. Next to the significant deleveraging of the balance sheet, the retirement of expensive debt and its replacement with competitively priced financings reflects positively on our bottom line. Indicatively, the weighted average interest rate on the facilities that were fully prepaid was 8.4% as compared to 3.35% for the new $104.3 million financings. We also expect that the terms of our financings will improve further going forward.
Concerning the commercial deployment of our fleet, in 2021 to date, we have concluded seven new period employment agreements ranging from 12 months to 5 years. All time-charters have been concluded with world-leading charterers in the Capesize sector, including NYK, Cargill, Anglo American and Ssangyong. The underlying rates are mainly index-linked, in most cases with options to convert to fixed based on the prevailing freight futures curve, allowing us to capitalize on potential spikes in the day-rates. Taking advantage of the strong market conditions, we have concluded fixed rate T/Cs at rates exceeding $31,000 per day for periods ranging from 12 to 18 months for two vessels. We continue to position our fleet optimally for what we believe to be an unfolding commodities super-cycle, which will underscore the importance of dry bulk shipping and especially that of the Capesize sector in global seaborne trade.
With respect to the implementation of our ESG agenda and as part of our continuous efforts to improve the energy efficiency rating of our fleet, we have installed Energy Saving Devices (“ESDs”) on an additional vessel and we have agreed with Cargill to install ESDs on another vessel in the coming months. Moreover, we have partnered with DeepSea for the installation of Artificial Intelligence performance systems on our fleet with proven benefit on fuel consumption. Finally we are in progressed discussions with other charterers for similar ESD projects, as well as for biofuel blend trials, which we believe to be one of the most efficient ways to transition into a greener future for shipping.
Regarding current market conditions, we are very pleased to see a consistent positive trend in our sector with daily rates above $20,000/ day since the beginning of April. Looking ahead, we are entering the seasonally “strong” period for Brazilian iron ore exports as local miners are ramping up production, supported by favorable weather conditions and “clean” plant maintenance schedules. At the same time coal prices are at the highest level of the last decade resulting in steadily rising seaborne coal volumes – a positive trend that defies the seasonal patterns of the last years. On that basis, and considering the favorable vessel-supply fundamentals of our sector with the orderbook standing at the lowest level of the last 25 years, as amplified by the catalytic effect of the upcoming environmental regulations, we feel confident about the prospects of the Capesize market.
As mentioned earlier, our daily TCE for the third quarter, based on 94% of our available days, stands at approximately $29,000, which is 63% higher than our 1H TCE. As part of our forward rates hedging strategy, we have triggered the “floating to fixed” feature on 8 of our index-linked charterers at an average net daily rate of approximately $28,050. This in combination with the solid outlook for our sector will form the basis for what we expect to be a further improved financial performance in the next quarter.
On a closing note, we have worked tirelessly and determinedly over the last 18 months to execute consistently on our strategic initiatives and place Seanergy amongst the most prominent Capesize owners globally. We remain committed to delivering additional value for our shareholders.”
Company Fleet following vessels’ deliveries and the sale of the M/V Leadership:
| Vessel Name | Vessel Size Class | Capacity (DWT) | Year Built | Yard | Scrubber Fitted | Employment Type | Minimum T/C duration | |||
| Partnership | Capesize | 179,213 | 2012 | Hyundai | Yes | T/C Index Linked (1) | 3 years | |||
| Championship | Capesize | 179,238 | 2011 | Sungdong | Yes | T/C Index Linked (2) | 5 years | |||
| Lordship | Capesize | 178,838 | 2010 | Hyundai | Yes | T/C Index Linked (3) | 3 years | |||
| Premiership | Capesize | 170,024 | 2010 | Sungdong | Yes | T/C Index Linked (4) | 3 years | |||
| Squireship | Capesize | 170,018 | 2010 | Sungdong | Yes | T/C Index Linked (5) | 3 years | |||
| Knightship | Capesize | 178,978 | 2010 | Hyundai | Yes | T/C Index Linked (6) | 3 years | |||
| Gloriuship | Capesize | 171,314 | 2004 | Hyundai | No | T/C Index Linked (7) | 10 months | |||
| Fellowship | Capesize | 179,701 | 2010 | Daewoo | No | T/C Index Linked (8) | 1 year | |||
| Geniuship | Capesize | 170,058 | 2010 | Sungdong | No | T/C Index Linked (9) | 11 months | |||
| Hellasship | Capesize | 181,325 | 2012 | Imabari | No | T/C Index Linked (10) | 11 months | |||
| Flagship | Capesize | 176,387 | 2013 | Mitsui | No | T/C Index Linked (11) | 5 years | |||
| Patriotship | Capesize | 181,709 | 2010 | Saijo – Imabari | Yes | T/C Fixed Rate-$31,000/day (12) | 1 year | |||
| Tradership | Capesize | 176,925 | 2006 | Namura | No | T/C Index Linked(13) | 11 months | |||
| Friendship | Capesize | 176,952 | 2009 | Namura | No | T/C Index Linked(14) | 17 months | |||
| Goodship | Capesize | 177,536 | 2005 | Mitsui | No | Voyage/Spot | ||||
| Worldship (15) | Capesize | 181,415 | 2012 | Japanese Shipyard | Yes | T/C Fixed Rate -$31,750/day(16) | 1 year | |||
| Total / Average age | 2,829,631 11.4 | |||||||||
(1) Chartered by a major European utility and energy company and delivered to the charterer on September 11, 2019 for a period of minimum 33 to maximum 37 months with an optional period of about 11 to maximum 13 months. The daily charter hire is based on the BCI. In addition, the Company has the option to convert to a fixed rate for a period of between 3 and 12 months, based on the prevailing Capesize Forward Freight Agreement Rate (“FFA”) for the selected period.
(2) Chartered by Cargill. The vessel was delivered to the charterer on November 7, 2018 for a period of employment of 60 months, with an additional period of about 24 to about 27 months at the charterer’s option. The daily charter hire is based on the BCI plus a net daily scrubber premium of $1,740. In addition, the time charter provides the option to convert the index linked rate to a fixed rate for a period of between 3 and 12 months based on the Capesize FFA for the selected period.
(3) Chartered by a major European utility and energy company and delivered on August 4, 2019 for a period of minimum 33 to maximum 37 months with an optional period of 11-13 months. The daily charter hire is based on the BCI plus a net daily scrubber premium of $3,735 until May 2021. In addition, the Company has the option to convert to a fixed rate for a period of between three and 12 months, based on the prevailing Capesize FFA for the selected period.
(4) Chartered by Glencore and was delivered to the charterer on November 29, 2019 for a period of minimum 36 to maximum 42 months with two optional periods of minimum 11 to maximum 13 months. The daily charter hire is based on the BCI plus a net daily scrubber premium of $2,055.
(5) Chartered by Glencore and was delivered to the charterer on December 19, 2019 for a period of minimum 36 to maximum 42 months with two optional periods of minimum 11 to maximum 13 months. The daily charter hire is based on the BCI plus a net daily scrubber premium of $2,055.
(6) Chartered by Glencore and was delivered to the charterer on May 15, 2020 for a period of about 36 to about 42 months with two optional periods of minimum 11 to maximum 13 months. The daily charter hire is based on the BCI.
(7) Chartered by Pacbulk Shipping and delivered to the charterer on April 23, 2020 initially for a period of about 10 to about 14 months. Upon expiration of the current T/C period, in June 2021, the vessel commenced the second extension period up to minimum January 1, 2022 to maximum April 30, 2022. The daily charter hire is based on the BCI. In addition, the Company has the option to convert to a fixed rate, based on the prevailing Capesize FFA for the selected period.
(8) Chartered by Anglo American, a leading global mining company, and expected to be delivered to the charterer towards the beginning of June 2021 for a period of minimum 12 to maximum 15 months from the delivery date. The daily charter hire is based on the BCI. In addition, the Company has the option to convert to a fixed rate for a period of minimum three and maximum 12 months, based on the prevailing Capesize FFA for the selected period.
(9) Chartered by Pacbulk Shipping and was delivered to the charterer on March 22, 2021 for a period of about 11 to about 14 months from the delivery date. The daily charter hire is based on the BCI. In addition, the Company has the option to convert to a fixed rate based on the prevailing Capesize FFA for the selected period.
(10) Chartered by NYK Line and was delivered to the charterer on May 10, 2021 for a period of minimum 11 to maximum 15 months. The daily charter hire is based at a premium over the BCI.
(11) Chartered by Cargill. The vessel was delivered to the charterer on May 10, 2021 for a period of 60 months. The daily charter hire is based at a premium over the BCI minus $1,325 per day. In addition, the time charter provides the option to convert the index linked rate to a fixed rate for a period of minimum 3 to maximum 12 months based on the Capesize FFA for the selected period.
(12) Chartered by a European cargo operator and was delivered to the charterer on June 7, 2021 for a period of minimum 12 to maximum 18 months. The daily charter hire is fixed at $31,000.
(13) Chartered by a major South Korean industrial company and was delivered to the charterer on June 15, 2021 for a period employment of 11 to 15 months. The daily charter hire is based on the BCI.
(14) Chartered by NYK Line and was delivered to the charterer on July 29, 2021 for a period of minimum 17 to maximum 24 months. The daily charter hire is based at a premium over the BCI.
(15) Prompt delivery
(16) Chartered by a U.S. commodity trading company and will be delivered to the charterer upon its delivery for a period of about 12 to 16 months. The daily charter hire is fixed at $31,750.
Fleet Data:
(U.S. Dollars in thousands)
| Q2 2021 | Q2 2020 | 6M 2021 | 6M 2020 | |
| Ownership days (1) | 1,164 | 910 | 2,155 | 1,820 |
| Operating days (2) | 1,122 | 863 | 2,055 | 1,764 |
| Fleet utilization (3) | 96.4% | 94.8% | 95.4% | 96.9% |
| TCE rate (4) | $20,095 | $5,424 | $18,327 | $6,985 |
| Daily Vessel Operating Expenses (5) | $5,908 | $5,140 | $5,766 | $5,353 |
(1) Ownership days are the total number of calendar days in a period during which the vessels in a fleet have been owned or chartered in. Ownership days are an indicator of the size of the Company’s fleet over a period and affect both the amount of revenues and the amount of expenses that the Company recorded during a period.
(2) Operating days are the number of available days in a period less the aggregate number of days that the vessels are off-hire due to unforeseen circumstances. Operating days includes the days that our vessels are in ballast voyages without having finalized agreements for their next employment.
(3) Fleet utilization is the percentage of time that the vessels are generating revenue and is determined by dividing operating days by ownership days for the relevant period.
(4) TCE rate is defined as the Company’s net revenue less voyage expenses during a period divided by the number of the Company’s operating days during the period. Voyage expenses include port charges, bunker (fuel oil and diesel oil) expenses, canal charges and other commissions. The Company includes the TCE rate, a non-GAAP measure, as it believes it provides additional meaningful information in conjunction with net revenues from vessels, the most directly comparable U.S. GAAP measure, and because it assists the Company’s management in making decisions regarding the deployment and use of the Company’s vessels and in evaluating their financial performance. The Company’s calculation of TCE rate may not be comparable to that reported by other companies. The following table reconciles the Company’s net revenues from vessels to the TCE rate.
(In thousands of U.S. Dollars, except operating days and TCE rate)
| Q2 2021 | Q2 2020 | 6M 2021 | 6M 2020 | |
| Net revenues from vessels | 27,832 | 9,042 | 48,230 | 22,381 |
| Less: Voyage expenses | 5,285 | 4,361 | 10,567 | 10,060 |
| Net operating revenues | 22,547 | 4,681 | 37,663 | 12,321 |
| Operating days | 1,122 | 863 | 2,055 | 1,764 |
| TCE rate | $20,095 | $5,424 | $18,327 | $6,985 |
(5) Vessel operating expenses include crew costs, provisions, deck and engine stores, lubricants, insurance, maintenance and repairs. Daily Vessel Operating Expenses are calculated by dividing vessel operating expenses by ownership days for the relevant time periods. The Company’s calculation of daily vessel operating expenses may not be comparable to that reported by other companies. The following table reconciles the Company’s vessel operating expenses to daily vessel operating expenses.
(In thousands of U.S. Dollars, except ownership days and Daily Vessel Operating Expenses)
| Q2 2021 | Q2 2020 | 6M 2021 | 6M 2020 | |
| Vessel operating expenses | 8,879 | 4,677 | 14,428 | 9,742 |
| Less: Pre-delivery expenses | 2,002 | – | 2,002 | – |
| Vessel operating expenses excluding pre-delivery expenses | 6,877 | 4,677 | 12,426 | 9,742 |
| Ownership days | 1,164 | 910 | 2,155 | 1,820 |
| Daily Vessel Operating Expenses | 5,908 | 5,140 | 5,766 | 5,353 |
Net Loss to EBITDA and Adjusted EBITDA Reconciliation:
(In thousands of U.S. Dollars)
| Q2 2021 | Q2 2020 | 6M 2021 | 6M 2020 | |
| Net income/(loss) | 1,961 | (11,286) | 640 | (19,629) |
| Add: Net interest and finance cost | 4,277 | 5,556 | 8,307 | 11,244 |
| Add: Depreciation and amortization | 4,520 | 3,674 | 8,337 | 7,308 |
| EBITDA | 10,758 | (2,056) | 17,284 | (1,077) |
| Add: stock based compensation | 528 | 207 | 1,931 | 589 |
| Adjusted EBITDA | 11,286 | (1,849) | 19,215 | (488) |
Earnings Before Interest, Taxes, Depreciation and Amortization (“EBITDA”) represents the sum of net income / (loss), interest and finance costs, interest income, depreciation and amortization and, if any, income taxes during a period. EBITDA is not a recognized measurement under U.S. GAAP. Adjusted EBITDA represents EBITDA adjusted to exclude stock based compensation, which the Company believes is not indicative of the ongoing performance of its core operations.
EBITDA and adjusted EBITDA are presented as we believe that these measures are useful to investors as a widely used means of evaluating operating profitability. EBITDA and adjusted EBITDA as presented here may not be comparable to similarly titled measures presented by other companies. These non-GAAP measures should not be considered in isolation from, as a substitute for, or superior to, financial measures prepared in accordance with U.S. GAAP.
Interest and Finance Costs to Cash Interest and Finance Costs Reconciliation:
(In thousands of U.S. Dollars)
| Q2 2021 | Q2 2020 | 6M 2021 | 6M 2020 | |
| Interest and finance costs, net | (4,277) | (5,556) | (8,307) | (11,244) |
| Add: Amortization of deferred finance charges | 985 | 177 | 1,702 | 349 |
| Add: Amortization of convertible note beneficial conversion feature | 61 | 1,279 | 1,238 | 2,416 |
| Add: Amortization of other deferred charges | 333 | 149 | 174 | 302 |
| Cash interest and finance costs | (2,898) | (3,951) | (5,193) | (8,177) |
Second Quarter and Recent Developments:
Update on Vessel Acquisitions and Time-Charter Agreements
Deliveries and Time Charters Commencement
During the first half, the Company has agreed to acquire six high-quality Japanese Capesize bulkers and has taken delivery of five, while the sixth vessel is scheduled to be delivered in August. All newly acquired units have been fixed on medium to long-term time charters as of their respective deliveries.
M/V Hellasship
In May 2021, the Company took delivery of the 181,325 dwt Capesize bulk carrier, built in 2012 in Japan, which was renamed M/V Hellasship. The M/V Hellasship was fixed on a time charter with NYK Line, a leading Japanese shipping company and operator. The T/C commenced on May 10, 2021 and will have a term of minimum 11 to maximum 15 months. The gross daily rate of the T/C is based at a premium over the BCI.
M/V Flagship
In May 2021, the Company took delivery of the 176,387 dwt Capesize bulk carrier, built in 2013 in Japan, which was renamed M/V Flagship. The M/V Flagship is the second vessel of the Company’s fleet time-chartered to Cargill International S.A. (“Cargill”). The daily hire is based on the BCI, while the Company has the option to convert the index-linked hire to fixed for a minimum period of three months to a maximum of 12 months based on the prevailing Capesize FFA curve. The rate is 102% of the BCI minus $1,325 per day. The term of the T/C is 5 years from the delivery of the vessel to Cargill, which took place on May 10, 2021.
M/V Patriotship
In June 2021, the Company took delivery of the 181,709 dwt Capesize bulk carrier, built in 2010 in Japan, which was renamed M/V Patriotship. The M/V Patriotship has been fixed on a time charter with a major European cargo operator. The T/C commenced on June 7, 2021 and will have a term of minimum 12 to maximum 15 months. The gross daily hire is $31,000.
M/V Tradership
In June 2021, the Company took delivery of the 176,925 dwt Capesize bulk carrier, built in 2006 in Japan, which was renamed M/V Tradership. The M/V Tradership has been fixed on a time charter with a major South Korean industrial company. The T/C commenced on June 15, 2021 and will have a term of minimum 11 to maximum 15 months. The gross daily rate of the T/C is based on the BCI.
M/V Worldship
In May 2021, the Company agreed to acquire a 181,415 dwt Capesize bulk carrier, built in 2012 in Japan, which will be renamed M/V Worldship. The M/V Worldship has been fixed on a T/C with a world-leading U.S. commodity trading company, at a gross daily rate of $31,750 for a period of minimum 12 to maximum16 months. The T/C is expected to commence immediately upon the vessel’s upcoming delivery, which is anticipated within August 2021.
Vessel Replacement
M/V Friendship
In July 2021, the Company took delivery of the 176,952 dwt Capesize bulk carrier, built in 2009 in Japan, which was renamed M/V Friendship. The M/V Friendship has been fixed on a time charter with NYK Line, a leading Japanese shipping company and operator. The T/C will commence promptly, upon finalization of the customary handover process and will have a term of minimum 17 to maximum 24 months. The gross daily rate of the T/C is based on 102% of the BCI.
M/V Leadership
Additionally, the Company has agreed to sell the 2001-built M/V Leadership to an unaffiliated party for a net sale price of $12.0 million. The substitution will improve the average age of the Company’s fleet. The vessel’s delivery to her new owners is anticipated within September 2021.
Financing Updates
During the second quarter, the Company has successfully concluded new financings and refinancing of $104.3 million and has received a commitment letter for a loan facility of up to $13.0 million.
Alpha Bank S.A.
On May 20, 2021, the Company entered into a $37.45 million credit facility to (i) refinance the existing facilities of $25.5 million secured by the M/V Leadership and the M/V Squireship and (ii) finance the previously unencumbered M/V Lordship. The earliest maturity date of the facility will be in December 2024 and the interest rate is 3.5% plus LIBOR per annum.
Aegean Baltic Bank S.A.
On April 22, 2021, the Company entered into a credit facility for an amount of $15.5 million secured by the M/V Goodship and the M/V Tradership. The facility has a term of 4.5 years, with latest maturity date falling in December 2025 and bears interest of LIBOR plus 4% per annum.
Cargill International S.A.
On May 11, 2021, the Company entered into a sale and leaseback transaction with Cargill to partially fund the acquisition cost of the M/V Flagship. The financing amount is $20.5 million at an implied interest rate of approximately 2% all-in, fixed for five years.
New Financing Agreement of $30.9 million
In June 2021, the Company successfully concluded the financing of two of its new acquisitions, the 2012-built Capesize M/V Hellasship and the 2010-built M/V Patriotship through a sale and leaseback agreement with a major Chinese financial institution. The vessels were sold and chartered back on a bareboat basis for a five-year period, the combined financing amount is $30.9 million and the applicable interest rate is LIBOR + 3.50% p.a.
Alpha Bank Commitment Letter – Friendship
In July 2021, the Company obtained a commitment letter from Alpha Bank S.A. for a loan facility of up to $13.0 million, in order to finance the acquisition of the 2009-built Capesize M/V Friendship. The interest rate will be LIBOR plus 3.25% p.a., and the term of the loan will be four years. The facility will be repaid through 4 quarterly instalments of $0.7 million followed by 12 quarterly instalments of $0.38 million and a balloon of $5.7 million payable together with the last instalment. The new loan facility will be structured as an additional loan tranche in the existing Alpha Bank facility secured by the M/Vs Lordship, Squireship and Leadership mentioned above.
Seanergy Maritime Holdings Corp.
Unaudited Condensed Consolidated Balance Sheets
(In thousands of U.S. Dollars)
| June 30, 2021 |
December 31, 2020* | |||||
| ASSETS | ||||||
| Cash and cash equivalents, restricted cash and term deposits | 56,394 | 23,651 | ||||
| Vessels, vessel held for sale and advances for vessels’ acquisitions, net | 367,897 | 256,737 | ||||
| Other assets | 16,483 | 14,857 | ||||
| TOTAL ASSETS | 440,774 | 295,245 | ||||
| LIABILITIES AND STOCKHOLDERS’ EQUITY | ||||||
| Long-term debt and other financial liabilities | 203,829 | 169,762 | ||||
| Convertible notes | 16,196 | 14,516 | ||||
| Other liabilities | 21,335 | 15,273 | ||||
| Stockholders’ equity | 199,414 | 95,694 | ||||
| TOTAL LIABILITIES AND STOCKHOLDERS’ EQUITY | 440,774 | 295,245 |
* Derived from the audited consolidated financial statements as of the period as of that date
Seanergy Maritime Holdings Corp.
Unaudited Condensed Consolidated Statements of Operations
(In thousands of U.S. Dollars, except for share and per share data, unless otherwise stated)
| |
Three months ended June 30, |
Six months ended June 30, |
|||||||||
| 2021 | 2020 | 2021 | 2020 | ||||||||
| Revenues: | |||||||||||
| Vessel revenues | 28,867 | 9,341 | 50,023 | 23,148 | |||||||
| Commissions | (1,035 | ) | (299 | ) | (1,793 | ) | (767 | ) | |||
| Vessel revenue, net | 27,832 | 9,042 | 48,230 | 22,381 | |||||||
| Expenses: | |||||||||||
| Voyage expenses | (5,285 | ) | (4,361 | ) | (10,567 | ) | (10,060 | ) | |||
| Vessel operating expenses | (8,879 | ) | (4,677 | ) | (14,428 | ) | (9,742 | ) | |||
| Management fees | (348 | ) | (251 | ) | (629 | ) | (503 | ) | |||
| General and administrative expenses | (2,566 | ) | (1,786 | ) | (5,296 | ) | (3,145 | ) | |||
| Depreciation and amortization | (4,520 | ) | (3,674 | ) | (8,337 | ) | (7,308 | ) | |||
| Operating income/(loss) | 6,234 | (5,707 | ) | 8,973 | (8,377 | ) | |||||
| Other income / (expenses): | |||||||||||
| Interest and finance costs, net | (4,277 | ) | (5,556 | ) | (8,307 | ) | (11,244 | ) | |||
| Other, net | 4 | (23 | ) | (26 | ) | (8 | ) | ||||
| Total other expenses, net: | (4,273 | ) | (5,579 | ) | (8,333 | ) | (11,252 | ) | |||
| Net income/(loss) | 1,961 | (11,286 | ) | 640 | (19,629 | ) | |||||
| Net income/(loss) per common share, basic and diluted | 0.01 | (0.65 | ) | 0.01 | (2.05 | ) | |||||
| Weighted average number of common shares outstanding, basic | 160,171,874 | 17,478,283 | 137,590,311 | 9,588,854 | |||||||
| Weighted average number of common shares outstanding, diluted | 174,592,644 | 17,478,283 | 152,052,538 | 9,588,854 | |||||||
About Seanergy Maritime Holdings Corp.
Seanergy Maritime Holdings Corp. is the only pure-play Capesize ship-owner publicly listed in the US. Seanergy provides marine dry bulk transportation services through a modern fleet of Capesize vessels. On a ‘fully-delivered’ basis, the Company’s fleet will consist of 16 Capesize vessels with an average age of 11.4 years and aggregate cargo carrying capacity of 2,829,631 dwt.
The Company is incorporated in the Marshall Islands and has executive offices in Glyfada, Greece. The Company’s common shares trade on the Nasdaq Capital Market under the symbol “SHIP”, its Class A warrants under “SHIPW” and its Class B warrants under “SHIPZ”.
Please visit our company website at: www.seanergymaritime.com.
Forward-Looking Statements
This press release contains forward-looking statements (as defined in Section 27A of the Securities Act of 1933, as amended, and Section 21E of the Securities Exchange Act of 1934, as amended) concerning future events. Words such as “may”, “should”, “expects”, “intends”, “plans”, “believes”, “anticipates”, “hopes”, “estimates” and variations of such words and similar expressions are intended to identify forward-looking statements. These statements involve known and unknown risks and are based upon a number of assumptions and estimates, which are inherently subject to significant uncertainties and contingencies, many of which are beyond the control of the Company. Actual results may differ materially from those expressed or implied by such forward-looking statements. Factors that could cause actual results to differ materially include, but are not limited to, the Company’s operating or financial results; the Company’s liquidity, including its ability to service its indebtedness; competitive factors in the market in which the Company operates; shipping industry trends, including charter rates, vessel values and factors affecting vessel supply and demand; future, pending or recent acquisitions and dispositions, business strategy, areas of possible expansion or contraction, and expected capital spending or operating expenses; risks associated with operations outside the United States; risks associated with the length and severity of the ongoing novel coronavirus (COVID-19) outbreak, including its effects on demand for dry bulk products and the transportation thereof; and other factors listed from time to time in the Company’s filings with the SEC, including its most recent annual report on Form 20-F. The Company’s filings can be obtained free of charge on the SEC’s website at www.sec.gov. Except to the extent required by law, the Company expressly disclaims any obligations or undertaking to release publicly any updates or revisions to any forward-looking statements contained herein to reflect any change in the Company’s expectations with respect thereto or any change in events, conditions or circumstances on which any statement is based.
For further information please contact:
Seanergy Investor Relations
Tel: +30 213 0181 522
E-mail: ir@seanergy.gr
Capital Link, Inc.
Daniela Guerrero
230 Park Avenue Suite 1536
New York, NY 10169
Tel: (212) 661-7566
E-mail: seanergy@capitallink.com
1 EBITDA and Time Charter Equivalent (“TCE”) rate are non-GAAP measures. Please see the reconciliation below of EBITDA to net loss and TCE rate to net revenues from vessels, in each case the most directly comparable U.S. GAAP measure.
2 This guidance is based on certain assumptions and there can be no assurance that these TCE estimates or projected utilization will be realized. TCE estimates include certain floating (index) to fixed rate conversions concluded in previous periods. For vessels on index-linked T/Cs, the TCE realized will vary with the underlying index, and for the purposes of this guidance, the TCE assumed for the remaining operating days of an index-linked T/C is equal to the last invoiced average of the BCI for the respective T/C, which is approximately equal to $30,000 as compared to an average FFA rate of $36,000 per day for August and September 2021 as of July 26, 2021. Spot estimates are provided using the load-to-discharge method of accounting. Load-to-discharge accounting recognizes revenues over fewer days as opposed to the discharge-to-discharge method of accounting used prior to 2018, resulting in higher rates for these days and only voyage expenses being recorded in the ballast days. Over the duration of the voyage (discharge-to-discharge) there is no difference in the total revenues and costs to be recognized. The rates quoted are for days currently contracted. Increased ballast days at the end of the quarter will reduce the additional revenues that can be booked based on the accounting cut-offs and therefore the resulting TCE will be reduced accordingly.
Cocrystal Pharma’s SARS-CoV-2 3CL Protease Lead CDI-45205 Demonstrates Broad-Spectrum Activity Against the SARS-CoV-2 Delta and Gamma Variants

Cocrystal Pharma’s SARS-CoV-2 3CL Protease Lead CDI-45205 Demonstrates Broad-Spectrum Activity Against the SARS-CoV-2 Delta and Gamma Variants
BOTHELL, Wash., July 29, 2021 (GLOBE NEWSWIRE) — Cocrystal Pharma, Inc. (Nasdaq: COCP) (“Cocrystal” or the “Company”) announces that its SARS-CoV-2 3CL protease lead CDI-45205 and several analogs showed potent in vitro activity against the SARS-CoV-2 Delta (India/B.1.617.2) and Gamma (Brazil/P.1) variants. Cocrystal previously announced that CDI-45205 and analogs exhibited broad-spectrum activity against the SARS-CoV-2 Alpha (United Kingdom/B.1.1.7) and Beta (South African/B.1.351) variants, surpassing the activity observed with the Wuhan strain.
“These in vitro SARS-CoV-2 results further indicate that Cocrystal’s SARS-CoV-2 3CL protease inhibitor CDI-45205 may be an effective treatment for COVID-19 caused by SARS-CoV-2 and its emerging variants, including the fast-spreading Delta variant that is becoming the dominant COVID-19 variant globally,” said Sam Lee, Ph.D., Cocrystal’s President and interim co-CEO. “The broad-spectrum activity against these SARS-CoV-2 variants is highly encouraging as CDI-45205 previously demonstrated excellent in vivo efficacy in a MERS-CoV-2 infected animal model.”
“CDI-45205 has now shown antiviral activity in preclinical testing against SARS-CoV-2 and all four major variants,” said James Martin, CFO and interim co-CEO, “Our next steps are to scale-up synthesis and manufacture active pharmaceutical ingredient (API) to support Investigational New Drug (IND)-enabling studies to advance CDI-45205 into clinical trials.”
The Company continues to develop SARS-CoV-2 oral protease inhibitors and replication inhibitors using its proprietary drug discovery platform technology. Cocrystal’s approach to drug discovery provides a unique path for designing broad-spectrum coronavirus antivirals against SARS-CoV-2 and emerging variants.
About CDI-45205
Cocrystal announced agreements in February and April 2020 with Kansas State University Research Foundation (KSURF) for certain proprietary broad-spectrum CL3 antiviral compounds for the treatment of norovirus and coronavirus infections. In December 2020 Cocrystal announced the selection of CDI-45205 as its lead coronavirus development candidate from a group of protease inhibitors obtained under the KSURF agreements. CDI-45205 showed good bioavailability in mouse and rat pharmacokinetic studies via intraperitoneal injection, and also no cytotoxicity against a variety of human cell lines. CDI-45205 has also demonstrated a strong synergistic effect with remdesivir. Additionally, a proof-of-concept animal study demonstrated that daily injection of CDI-45205 exhibited favorable in vivo efficacy in MERS-CoV-infected mice. Cocrystal has obtained promising preliminary pharmacokinetic results and is continuing to evaluate CDI-45205.
About Cocrystal Pharma, Inc.
Cocrystal Pharma, Inc. is a clinical-stage biotechnology company discovering and developing novel antiviral therapeutics that target the replication process of coronaviruses (including SARS-CoV-2), influenza viruses, hepatitis C virus and noroviruses. Cocrystal employs unique structure-based technologies and Nobel Prize-winning expertise to create first- and best-in-class antiviral drugs. For further information about Cocrystal, please visit www.cocrystalpharma.com.
Cautionary Note Regarding Forward-Looking Statements
This press release contains forward-looking statements within the meaning of the Private Securities Litigation Reform Act of 1995, including statements regarding our beliefs related to the effectiveness of CDI-45205 against SARS-CoV-2 and its major variants, and the anticipated clinical development of CDI-45205. The words “believe,” “may,” “estimate,” “continue,” “anticipate,” “intend,” “should,” “plan,” “could,” “target,” “potential,” “is likely,” “will,” “expect” and similar expressions, as they relate to us, are intended to identify forward-looking statements. We have based these forward-looking statements largely on our current expectations and projections about future events. Some or all of the events anticipated by these forward-looking statements may not occur. Important factors that could cause actual results to differ from those in the forward-looking statements include, but are not limited to, the risks and uncertainties arising from the impact of the COVID-19 pandemic on the national and global economy and on our Company, including supply chain disruptions and our continued ability to proceed with our programs, including our coronavirus program, our ability to complete the preclinical and clinical trials of CDI-45205, the results of such future preclinical and clinical studies, and general risks arising from clinical trials and more generally, the development of investigational drugs. Further information on our risk factors is contained in our filings with the SEC, including our Annual Report on Form 10-K for the year ended December 31, 2020. Any forward-looking statement made by us herein speaks only as of the date on which it is made. Factors or events that could cause our actual results to differ may emerge from time to time, and it is not possible for us to predict all of them. We undertake no obligation to publicly update any forward-looking statement, whether as a result of new information, future developments or otherwise, except as may be required by law.
Investor Contact:
LHA Investor Relations
Jody Cain
310-691-7100
jcain@lhai.com
Source: Cocrystal Pharma, Inc.
Comstock Forms Joint Venture with Lakeview Energy

Comstock Forms Joint Venture with Lakeview Energy
Acquires 50% Stake in 200,000 Pound Per Day Hemp Extraction, Remediation, and Refinement Facility
VIRGINIA CITY, NEVADA, July 29, 2021 – Comstock Mining Inc. (NYSE: LODE) (“Comstock” and the “Company”) today announced the execution of a series of agreements with Lakeview Energy LLC (“Lakeview”) and its subsidiaries, pursuant to which the Company acquired 50% of the equity of Lakeview’s subsidiary, LP Biosciences LLC (“LPB”), and agreed to provide the financing needed to retrofit LPB’s pre-existing industrial scale solvent extraction and valorization facility in Merrill, Iowa (“LPB Facility”), for the production of an array of wholesale products from up to 200,000 pounds per day of industrial hemp. Comstock issued 3,500,000 restricted shares of its common stock to LPB in connection with its acquisition and financing commitments, and simultaneously acquired 100% of MANA Corporation (“MANA”), an industrial hemp technology development, marketing, and management company, for 4,200,000 restricted shares of Comstock common stock.
Industrial Scale Infrastructure
Industrial hemp is an extraordinary natural resource with tens of thousands of known applications, including food, feed, fuel, and fiber, and an array of emerging applications in batteries, bioplastics, and other renewable alternatives to fossil fuel derived products. However, hemp’s ability to produce over 400 natural phytochemicals, such as cannabidiol (“CBD”) and cannabigerol (“CBG”), has recently garnered significant attention as some of those chemicals are seen to have compelling potential in health and wellness applications. The corresponding green rush propelled global demand and sales of industrial hemp products to an estimated $1.9 billion as of 2020, and the industry is expected to grow to $6.9 billion worldwide by 2025, according to Hemp Industry Daily.
“The processing infrastructure needed to achieve those aspirations does not exist today at the scales and sophistication expected of mature supply chains for comparable commodities,” said MANA’s Chief Executive Officer, William McCarthy. “The absence of large scale capacity represents the hemp industry’s most significant bottleneck today. MANA is addressing that deficiency by acquiring and partnering with experienced agriproducts management teams and pre-existing industrial scale facilities in adjacent agricultural markets. We are excited to do so today with Comstock, Lakeview, and the LPB Facility, and we’re looking forward to making a market leading contribution to the debottlenecking and evolution of the industry.”
Mature Agriproducts Management
Lakeview is an experienced agriproducts management company that owns and operates three renewable fuels facilities, including two 55 million gallon dry mill corn ethanol facilities located in Ohio and Iowa, and a 10 million gallon per year biodiesel production facility located in Missouri. Importantly, LPB’s LPB Facility is ideally co-located with Lakeview’s ethanol facility in Iowa, where the two facilities can exploit operational and other synergies to maximize throughput, profitability, and cash flow. Comstock’s and MANA’s agreements with Lakeview call for Lakeview to provide construction, operating, administrative, logistics, commodities, risk management and other services to LPB as the parties work together to build, operate and grow the LPB Facility. MANA additionally agreed to provide a suite of complimentary technology, marketing and other management services, with a focus on acquiring and using pre-existing and new feedstock and offtake arrangements to fill the LPB Facility.
“Industrial hemp has remarkable potential in several important respects, including its potential for new jobs and stimulating economic, environmental and social value creation in our community,” said Jim Galvin, Lakeview’s Chief Executive Officer. “We’re pleased to partner with Comstock and MANA as we upgrade and use the LPB Facility to provide comprehensive hemp extraction, remediation, and refinement services at scales that are currently unheard of in the hemp industry.”
Industry Leading Scale, Quality, Compliance, and Flexibility
Comstock’s Executive Chairman and Chief Executive Officer, Corrado DeGasperis, added: “We are proud to have assembled a world class asset with a team of industry veterans, process engineers, and partners to rapidly retrofit and commence operations with the LPB Facility, thereby setting a global standard for quality, compliance, consistency, flexibility and speed at an extraordinary scale. Once retrofits are complete in mid-2022, the LPB Facility will generate significant free cash flow by servicing the most astute, demanding, and rapidly growing buyers of wholesale hemp products with custom tailored solutions.”
The LPB Facility is conservatively expected to scale up to its initial nameplate capacity exceeding 200,000 pounds per day and 36,500 tons per year of industrial hemp over its first three years of operations, as it extracts, remediates, and refines oil from industrial hemp to generate annualized revenues exceeding $53,000,000, $154,000,000, and $409,000,000 per year during LPB’s first, second, and third full years of operations, respectively, as shown in the following excerpt from LPB’s internal projections:
Ecosystem of Strategic Feedstocks, Processes and Products
DeGasperis concluded: “Comstock is focused on the rapid and simultaneous maximization of financial, natural, and social impact, in large part by building an ecosystem of strategic extraction and valorization facilities with complimentary feedstocks and products. In this example, the LPB Facility’s revenue estimates are based only on the oil fraction of industrial hemp, which corresponds to a small portion of total feedstock biomass. The rest of that biomass is mostly comprised of cellulose with many known co-product applications, as well as some very exciting new applications that we are actively evaluating for use in our existing and planned new decarbonization efforts.”
About Comstock Mining Inc.
Comstock Mining Inc. (NYSE: LODE) (the “Company”) is an emerging innovator and leader in the sustainable extraction, valorization, and production of scarce natural resources, with a focus on high value strategic materials that are essential to meeting the rapidly increasing global demand for clean energy, carbon-neutrality, and natural products. To learn more, please visit www.comstockmining.com.
Forward-Looking Statements
This press release and any related calls or discussions may include forward-looking statements within the meaning of Section 27A of the Securities Act of 1933, as amended, and Section 21E of the Securities Exchange Act of 1934, as amended. All statements, other than statements of historical facts, are forward-looking statements. The words “believe,” “expect,” “anticipate,” “estimate,” “project,” “plan,” “should,” “intend,” “may,” “will,” “would,” “potential” and similar expressions identify forward-looking statements, but are not the exclusive means of doing so. Forward-looking statements include statements about matters such as: consummation of all pending transactions; project, asset or Company valuations; future industry market conditions; future explorations, acquisitions, investments and asset sales; future performance of and closings under various agreements; future changes in our exploration activities; future estimated mineral resources; future prices and sales of, and demand for, our products; future operating margins; available resources; environmental conservation outcomes; future impacts of land entitlements and uses; future permitting activities and needs therefor; future production capacity and operations; future operating and overhead costs; future capital expenditures and their impact on us; future impacts of operational and management changes (including changes in the board of directors); future changes in business strategies, planning and tactics and impacts of recent or future changes; future employment and contributions of personnel, including consultants; future land sales, investments, acquisitions, joint ventures, strategic alliances, business combinations, operational, tax, financial and restructuring initiatives; the nature and timing of and accounting for restructuring charges and derivative liabilities and the impact thereof; contingencies; future environmental compliance and changes in the regulatory environment; future offerings of equity or debt securities; asset sales and associated costs; future working capital, costs, revenues, business opportunities, debt levels, cash flows, margins, earnings and growth. These statements are based on assumptions and assessments made by our management in light of their experience and their perception of historical and current trends, current conditions, possible future developments and other factors they believe to be appropriate. Forward-looking statements are not guarantees, representations or warranties and are subject to risks and uncertainties, many of which are unforeseeable and beyond our control and could cause actual results, developments and business decisions to differ materially from those contemplated by such forward-looking statements. Some of those risks and uncertainties include the risk factors set forth in our filings with the SEC and the following: counterparty risks; capital markets’ valuation and pricing risks; adverse effects of climate changes or natural disasters; global economic and capital market uncertainties; the speculative nature of gold or mineral exploration, including risks of diminishing quantities or grades of qualified resources; operational or technical difficulties in connection with exploration or mining activities; contests over title to properties; potential dilution to our stockholders from our stock issuances and recapitalization and balance sheet restructuring activities; potential inability to comply with applicable government regulations or law; adoption of or changes in legislation or regulations adversely affecting businesses; permitting constraints or delays; decisions regarding business opportunities that may be presented to, or pursued by, us or others; the impact of, or the non-performance by parties under agreements relating to, acquisitions, joint ventures, strategic alliances, business combinations, asset sales, leases, options and investments to which we may be party; changes in the United States or other monetary or fiscal policies or regulations; interruptions in production capabilities due to capital constraints; equipment failures; fluctuation of prices for gold or certain other commodities (such as silver, zinc, cyanide, water, diesel fuel and electricity); changes in generally accepted accounting principles; adverse effects of terrorism and geopolitical events; potential inability to implement business strategies; potential inability to grow revenues; potential inability to attract and retain key personnel; interruptions in delivery of critical supplies, equipment and raw materials due to credit or other limitations imposed by vendors or others; assertion of claims, lawsuits and proceedings; potential inability to satisfy debt and lease obligations; potential inability to maintain an effective system of internal controls over financial reporting; potential inability or failure to timely file periodic reports with the SEC; potential inability to list our securities on any securities exchange or market; inability to maintain the listing of our securities; and work stoppages or other labor difficulties. Occurrence of such events or circumstances could have a material adverse effect on our business, financial condition, results of operations or cash flows or the market price of our securities. All subsequent written and oral forward-looking statements by or attributable to us or persons acting on our behalf are expressly qualified in their entirety by these factors. Except as may be required by securities or other law, we undertake no obligation to publicly update or revise any forward-looking statements, whether as a result of new information, future events, or otherwise.
Neither this press release nor any related calls or discussions constitutes an offer to sell, the solicitation of an offer to buy or a recommendation with respect to any securities of the Company, the fund or any other issuer.
| Contact Information | ||
| Comstock Mining Inc.
P.O. Box 1118 Virginia City, NV 89440 |
Corrado De Gasperis
Executive Chairman & CEO Tel (775) 847-4755 degasperis@comstockmining.com |
Zach Spencer
Director of External Relations Tel (775) 847-5272 Ext.151 questions@comstockmining.com |
The FOMC and Senate Help Copper Advance
The Case for Copper May Have Just Become Stronger
Fed Chairman Jerome Powell’s dovish announcement concerning Fed monetary policy after the July meeting, combined with a version of the infrastructure bill moving forward in the Senate, had an uplifting effect on copper prices. Copper has advanced since the announcements in part because the dollar has declined (vs. the DXY). The Added impetus for copper’s rise is the senate version of a $1 trillion infrastructure bill passing with bipartisan support.
The Fed
Chairman Powell said in a press conference following a two-day FOMC meeting that although the economy is making progress towards its goals, it has a way to go before the Fed will scale back its easy policies. The overnight Fed Funds rate was left unchanged as per unanimous vote. On the subject of inflation, which also could impact commodity prices, Powell said, “Inflation has increased notably and will likely remain elevated in the coming months,” He blamed these price increases on supply chain disruptions related to temporary reduced economic activity in response to Covid. The dollar declined, this causes copper that’s produced and sold in U.S. dollars cheaper against those produced under richer currencies.
Infrastructure Spending
A roughly $1 trillion infrastructure bill advanced in a senate vote Wednesday (July 28). The bill is a scaled-down version of one introduced by the House and would still need House approval. The bill that was voted on includes $110 billion for roads, $73 billion for power grid spending, $66 billion for railways, $65 to expand broadband access, $55 billion for clean drinking water, $39 billion for public transit, and $25 billion for airports. There is also $50 billion in the bill for environmental resiliency, defined as the capacity of an ecosystem to respond to disturbances by resisting damage, recovering quickly while retaining the same function and identity.
If put in place, it’s expected many of these infrastructure projects would create an increase in demand, perhaps even stress the supply of copper and other raw materials.
Other Drivers of Copper’s Price in the U.S.
In a virtual roadshow presented last week through Channelchek, David Kelly, President, and CEO of Chakana Copper Corp. (CHKKF) had this to say, “Copper itself is a great commodity to be investing in. Even before all the clean energy initiatives and electric vehicle proliferation, there was a looming supply gap.” (Chakana Virtual
Roadshow replay).
The visual below is a slide from David Kelly’s presentation highlighting the various drivers working to produce the mismatch between copper demand and supply.
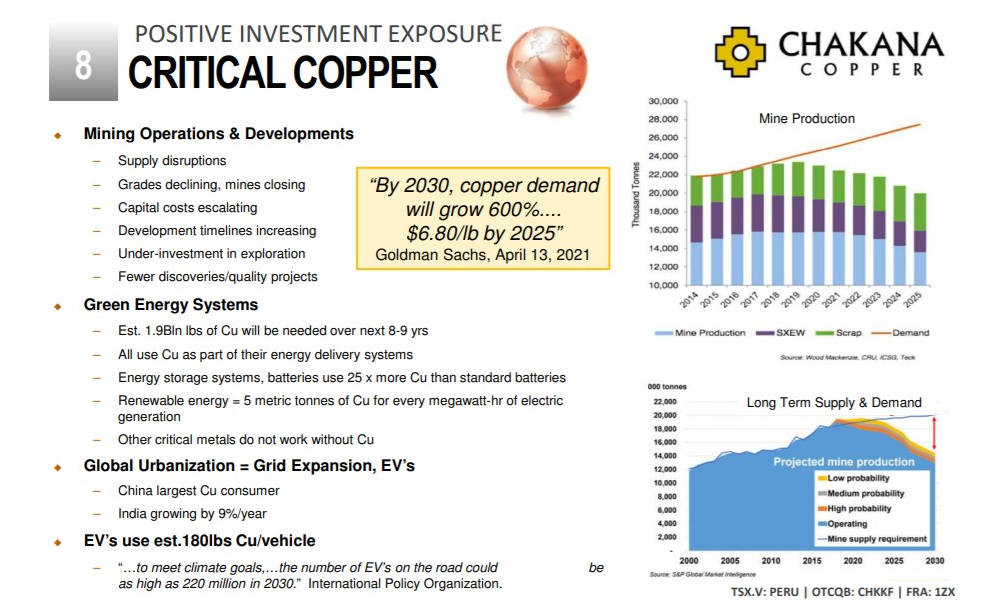
Source: Chakana Copper Website
Supply disruptions were touched on above – copper prices are also experiencing upward pressure from global urbanization, renewable energy needs, EV production growth, electrical storage, distribution systems, and mines closing. These factors would suggest positive price pressure for the commodity and producers such as mining companies.
Take-Away
During the last week of July 2021, investors in copper, copper mining companies, and other related production companies were handed two news pieces that create further upward price pressure on the commodity. This is on top of an environment that already keeps adding to strength to the argument to add exposure to copper investments.
Suggested Reading:
 Virtual Roadshow With Chakana Copper (Video)
|
 Unhyped Hydrogen Investments
|
 China fighting Cost Push Inflation With Metal Reserves
|
 Metals and Mining Second Quarter Industry Report
|
Sources:
https://www.youtube.com/watch?v=ajbPE0i0eOA&t=509s
https://www.cnbc.com/quotes/@HG.1
https://www.nytimes.com/2021/07/28/us/politics/senate-infrastructure-deal.html
https://www.federalreserve.gov/newsevents/pressreleases/monetary20210728a.htm
Stay up to date. Follow us:

|
Here’s How the 100 Most Recognizable Companies Compare in Terms of Brand Reputation
I
Here’s How the 100 Most Recognizable Companies Compare in Terms of Brand Reputation
How was Brand Reputation Measured?
Nearly 43,000 Americans were polled nationally to find out which 100 companies emerge as top of mind—both positive and negative.
The polling was conducted by Axios Harris and asked
which two companies the respondent felt excelled or faltered in the U.S.—in other words, which companies were the most “visible” in their eyes.
The top 100 brands that emerged from this framework were then judged by poll respondents across seven dimensions, over three key pillars:
- Character
Includes a company’s culture, ethics, and citizenship (whether a consumer shares a company’s values or the company supports good causes) - Trajectory
Includes a company’s growth prospects, vision for the future, and product and service offerings (whether they are innovative, and of high quality) - Trust
Does a consumer trust the brand in the first place?
Once these dimensions are taken into account, the final scores portray how these “visible brands” rank in terms of their reputation among a representative sample of Americans:
- Score range: 80.0 and above
Reputation: Excellent - Score range: 75.0-79.9
Reputation: Very Good - Score range: 70.0-74.9
Reputation: Good - Score range: 65.0-69.9
Reputation: Fair - Score range: 64.9 and below
Reputation: Poor
Companies with a Very Poor reputation (a score below 50) didn’t make it on the list. Here’s how the 100 most visible companies stack up in terms of brand reputation:

Source:
Capstone Green Energy (NASDAQ:CGRN) Signs a 10-Year Service Contract on 1.2 MWs of Microturbines Installed in the Fourth-Tallest Building in New York City

Capstone Green Energy (NASDAQ:CGRN) Signs a 10-Year Service Contract on 1.2 MWs of Microturbines Installed in the Fourth-Tallest Building in New York City
Energy Fuels Announces Strategic Alliance with RadTran, LLC for the Recovery of Isotopes Needed for Emerging Cancer Therapeutics

Energy Fuels Announces Strategic Alliance with RadTran, LLC for the Recovery of Isotopes Needed for Emerging Cancer Therapeutics
Alliance has the potential to develop commercial technologies and sources of isotopes needed for a new domestic medical supply chain
LAKEWOOD, Colo., July 29, 2021 /CNW/ – Energy Fuels Inc. (NYSE American: UUUU) (TSX: EFR) (“Energy Fuels” or the “Company”) is pleased to announce the execution of a Strategic Alliance Agreement (“Alliance”) with RadTran, LLC (“RadTran”) to evaluate the recovery of thorium, and potentially radium, from the Company’s existing rare earth carbonate (“RE Carbonate“) and uranium process streams for use in the production of medical isotopes for emerging targeted alpha therapy (“TAT“) cancer therapeutics. This initiative will complement the Company’s existing uranium and RE Carbonate businesses, as it will investigate the recovery of isotopes in existing process streams at Energy Fuels’ White Mesa Mill in Utah (the “Mill”) for medical purposes. RadTran is a Denver, Colorado-based technology development company focused on closing critical gaps in the procurement of medical isotopes for these applications.
Uranium and thorium are long-lived (long “half life”), naturally occurring radioactive elements that decay into a series of different elements through the successive loss of alpha or beta particles. Certain elements in or derived from the uranium and thorium decay chains have short half-lives and emit alpha particles. These alpha emitting isotopes are currently being studied by major pharmaceutical companies developing therapies to treat cancer on a cellular level, while minimizing damage to surrounding healthy tissue. However, existing domestic and global supplies of these isotopes are in short supply, and existing methods of production are costly and currently unable to scale-up to meet widespread demand as new drugs are developed and approved in the U.S., Europe and around the World. These are major roadblocks in the research and development of new TAT drugs, as pharmaceutical companies wait for scalable and affordable production technologies to become available.
The Mill can represent a possible solution to this medical supply chain issue. The Mill is the only licensed and operating conventional uranium mill in the U.S., and it recently began production of RE Carbonate from natural monazite sands. Monazite sands, natural uranium ores, and certain other feed sources for the Mill contain thorium-232 (“Th-232”) and radium-226 (“Ra-226”), which would normally be disposed of permanently in the Mill’s tailings impoundments following processing for uranium and RE Carbonate recovery. As an initial step in this medical isotope initiative, Energy Fuels and RadTran will evaluate the technical and economic feasibility of recovering Th-232, and potentially Ra-226, from the Mill’s natural monazite and other existing feeds, subject to receipt of any required licenses, permits and regulatory approvals. These isotopes are a necessary precursor to the specific medical isotopes needed by pharmaceutical companies for their emerging TAT cancer therapeutics, making this initiative the potential beginning of an important new domestic medical supply chain.
If this initial step is feasible, and subject to receipt of any required licenses, permits and regulatory approvals, Energy Fuels and RadTran will then evaluate the feasibility of recovering radium-228 (“Ra-228”) from the Th-232 and thorium-228 (“Th-228”) from the Ra-228 at the Mill using RadTran technologies, with the backing of the Pacific Northwest National Laboratory (“PNNL”) in Richland, Washington. The recovered Ra-228, Th-228, and potentially Ra-226, would then be sold to pharmaceutical companies and others to produce the short-lived isotopes which are the leading medically attractive TAT isotopes for the treatment of cancer, including lead-212 (“Pb-212”), actinium-225 (“Ac-225”), bismuth-213 (“Bi-213”), radium-224 (“Ra-224”), and radium-223 (“Ra-223”).
“The Alliance between Energy Fuels and RadTran is remarkable as it aims to alleviate the major bottleneck in the targeted alpha therapy market. Upon the successful production of these isotopes at the Mill, this Alliance will allow pharmaceutical companies who are devoping targeted alpha therapies to progress through clinical trials and deploy therapeutics commercially without the hinderance of isotope supply,” stated Dr. Saleem Drera, Founder and CEO of RadTran.
If successful, this Alliance has the potential to generate significant future cashflow for Energy Fuels in the medical isotope industry. In addition, Energy Fuels can support cancer research and the creation of a new, U.S.-based medical supply chain that adheres to the highest global standards for human rights, sustainability, safety and environmental protection. This initiative is also highly complementary to the Company’s existing businesses, as the uranium and rare earth feeds Energy Fuels currently processes contain the required thorium and radium. Energy Fuels is seeking to put these isotopes to beneficial human use, rather than losing them to permanent disposal.
“At its heart, the Energy Fuels’ Alliance with RadTran is about maximizing the value and human benefit of our existing uranium and rare earth feeds at the White Mesa Mill,” stated Mark S. Chalmers, President and CEO of Energy Fuels. “Energy Fuels has a long track record of ethically and responsibly processing a wide variety of naturally occurring radioactive materials at the White Mesa Mill for the recovery of uranium, and more recently, rare earths. In our view, recovering medical isotopes from these same streams, that would otherwise be lost to direct disposal, is a great way to maximally use all of our feeds. Indeed, we are essentially replicating China’s ‘monazite plan.’ China purchases monazite from around the globe, recovers the uranium for use in their nuclear industry, recovers the thorium presumably for use in their nuclear and pharmaceutical industries, and recovers the rare earths for processing into advanced materials needed for various clean energy and advanced technologies. Our White Mesa Mill is a facility unique to the United States that has the potential to do the same thing at world standards.
“We believe Energy Fuels has the potential to create a domestic supply of thorium and possibly radium that can be harvested using RadTran’s technologies for use in the production of the next generation of cancer therapies, a potentially multi-billion dollar industry. And we would be accomplishing this in a way that is environmentally beneficial and highly congruent with Energy Fuels’ recycling and sustainability goals. We look forward to working with RadTran on this important initiative.”
ABOUT ENERGY FUELS
Energy Fuels is a leading U.S.-based uranium mining company, supplying U3O8 to major nuclear utilities. Energy Fuels also produces vanadium from certain of its projects, as market conditions warrant, and is ramping up to commercial-scale production of REE carbonate in 2021. Its corporate offices are in Lakewood, Colorado, near Denver, and all of its assets and employees are in the United States. Energy Fuels holds three of America’s key uranium production centers: the White Mesa Mill in Utah, the Nichols Ranch in-situ recovery (“ISR”) Project in Wyoming, and the Alta Mesa ISR Project in Texas. The White Mesa Mill is the only conventional uranium mill operating in the U.S. today, has a licensed capacity of over 8 million pounds of U3O8 per year, has the ability to produce vanadium when market conditions warrant, as well as REE carbonate from various uranium-bearing ores. The Nichols Ranch ISR Project is on standby and has a licensed capacity of 2 million pounds of U3O8 per year. The Alta Mesa ISR Project is also on standby and has a licensed capacity of 1.5 million pounds of U3O8per year. In addition to the above production facilities, Energy Fuels also has one of the largest NI 43-101 compliant uranium resource portfolios in the U.S. and several uranium and uranium/vanadium mining projects on standby and in various stages of permitting and development. The primary trading market for Energy Fuels’ common shares is the NYSE American under the trading symbol “UUUU,” and the Company’s common shares are also listed on the Toronto Stock Exchange under the trading symbol “EFR.” Energy Fuels’ website is www.energyfuels.com.
CAUTIONARY STATEMENTS REGARDING FORWARD LOOKING STATEMENTS
This news release contains “forward-looking information” within the meaning of applicable securities laws in Canada and the United States. Forward-looking information may relate to future events or future performance of Energy Fuels. All statements in this release, other than statements of historical facts, with respect to Energy Fuels’ objectives and goals, as well as statements with respect to its beliefs, plans, objectives, expectations, anticipations, estimates, and intentions, are forward-looking information. Specific forward-looking statements in this discussion include, but are not limited to, the following: any expectation that the Company’s evaluation of thorium and potentially radium recovery at the Mill will be successful; any expectation that the potential recovery of any other isotopes from any thorium and radium recovered at the Mill will be feasible; any expectation that any thorium, radium and other isotopes can be recovered at the Mill and sold on a commercial basis; any expectation that this initiative will alleviate the major bottleneck in the targeted alpha therapy market; any expectation that, upon the successful production of these isotopes at the Mill, this initiative will allow pharmaceutical companies who are devoping targeted alpha therapies to progress through clinical trials and deploy therapeutics commercially without the hinderance of isotope supply; any expectation that this initiative has the potential to generate significant future cashflow for Energy Fuels in the medical isotope industry, or that this next generation of cancer therapies could be a potentially multi-billion dollar industry; any expectation that all required licenses, permits and regulatory approvals will be obtained on a timely basis or at all; and any expectation that this initiative may result in the creation of a new, U.S.-based medical supply chain that adheres to the highest global standards for human rights, sustainability, safety and environmental protection. Often, but not always, forward-looking information can be identified by the use of words such as “plans”, “expects”, “is expected”, “budget”, “scheduled”, “estimates”, “continues”, “forecasts”, “projects”, “predicts”, “intends”, “anticipates” or “believes”, or variations of, or the negatives of, such words and phrases, or state that certain actions, events or results “may”, “could”, “would”, “should”, “might” or “will” be taken, occur or be achieved. This information involves known and unknown risks, uncertainties and other factors that may cause actual results or events to differ materially from those anticipated in such forward-looking information. Factors that could cause actual results to differ materially from those anticipated in these forward-looking statements include risks associated with: processing difficulties and upsets; available supplies of monazite sands; the capital and operating costs associated with the recovery of thorium, radium and other isotopes at the Mill; licensing, permitting and regulatory delays; litigation risks; competition from others; and market factors, including future demand for and prices realized from the sale of radium, thorium or other isotopes produced at the Mill. Forward-looking statements contained herein are made as of the date of this news release, and Energy Fuels disclaims, other than as required by law, any obligation to update any forward-looking statements whether as a result of new information, results, future events, circumstances, or if management’s estimates or opinions should change, or otherwise. There can be no assurance that forward-looking statements will prove to be accurate, as actual results and future events could differ materially from those anticipated in such statements. Accordingly, the reader is cautioned not to place undue reliance on forward-looking statements. Energy Fuels assume no obligation to update the information in this communication, except as otherwise required by law.
SOURCE Energy Fuels Inc.
Cumulus Media Inc. (CMLS) – A Wynn Win

Thursday, July 29, 2021
Cumulus Media Inc. (CMLS)
A Wynn Win
CUMULUS MEDIA, Inc. (NASDAQ: CMLS) is a leading audio-first media and entertainment company delivering premium content to over a quarter billion people every month — wherever and whenever they want it. CUMULUS MEDIA engages listeners with high-quality local programming through 428 owned-and-operated stations across 87 markets; delivers nationally-syndicated sports, news, talk, and entertainment programming from iconic brands including the NFL, the NCAA, the Masters, the Olympics, the GRAMMYS, the American Country Music Awards, and many other world-class partners across nearly 8,000 affiliated stations through Westwood One, the largest audio network in America; and inspires listeners through its rapidly growing network of original podcasts that are smart, entertaining and thought-provoking. CUMULUS MEDIA provides advertisers with local impact and national reach through on-air, digital, mobile, and voice-activated media solutions, as well as access to integrated digital marketing services, powerful influencers, and live event experiences. CUMULUS MEDIA is the only audio media company to provide marketers with local and national advertising performance guarantees.
Michael Kupinski, Director of Research, Noble Capital Markets, Inc.
Refer to the full report for the price target, fundamental analysis, and rating.
Wins significant advertising support. Cumulus Media struck a partnership with WynnBET, a mobile sports betting app from Wynn Resorts, becoming one of the company’s largest advertisers. The value of the agreement was undisclosed, but is expected to include both cash, (the majority of the deal), and stock in WynnBET. The partnership is expected to support multiple platforms at the company including the Westwood One Networks and its Digital and Local Radio brands.
Inside the partnership’s details. The deal is a significant win for Cumulus given that Wynn was not a significant advertiser at the company. Furthermore, this is a non-exclusive agreement and management indicated that there is significant advertising inventory for additional relationships, including other sports betting companies. In addition, the partnership is expected to be a multi-year …
This research is provided by Noble Capital Markets, Inc., a FINRA and S.E.C. registered broker-dealer (B/D).
*Analyst certification and important disclosures included in the full report. NOTE: investment decisions should not be based upon the content of this research summary. Proper due diligence is required before making any investment decision.
