Release – Ocugen to Host Conference Call on Friday August 6


Ocugen to Host Conference Call on Friday, August 6 at 8:30 a.m. ET to Discuss Second Quarter 2021 Financial Results and Provide Business Update


MALVERN, Pa., July 30, 2021 (GLOBE NEWSWIRE) — Ocugen, Inc. (NASDAQ: OCGN), a biopharmaceutical company focused on discovering, developing, and commercializing gene therapies to cure blindness diseases and developing a vaccine to save lives from COVID-19, today announced that it will host a conference call to discuss its second quarter 2021 financial results and provide a business update at 8:30 a.m. ET on Friday, August 6, 2021.

Ocugen will issue a pre-market earnings announcement on the same day. Investors are invited to participate on the call using the following details:

  • Dial-In Number: (844) 873-7330 (U.S.) or (602) 563-8473 (international)
  • Conference ID: 6663619
  • Webcast: Available in the “Investors” section of the Ocugen website and archived for approximately 45 days following the call

About?Ocugen, Inc.
Ocugen, Inc. is a biopharmaceutical company focused on discovering, developing, and commercializing gene therapies to cure blindness diseases and developing?a vaccine to?save lives from COVID-19. Our breakthrough modifier gene therapy platform has the potential to treat multiple retinal diseases with one drug – “one to many” and our novel biologic product candidate aims to offer better therapy to patients with underserved diseases such as wet age-related macular degeneration, diabetic macular edema, and diabetic retinopathy.?We are co-developing Bharat Biotech’s COVAXIN™ vaccine candidate for COVID-19 in the U.S. and Canadian markets.?For more information, please visit www.ocugen.com.

Cautionary Note on Forward-Looking Statements
This press release contains forward-looking statements within the meaning of The Private Securities Litigation Reform Act of 1995, which are subject to risks and uncertainties. Such forward-looking statements within this press release include, without limitation, the intended use of net proceeds from the registered direct offering. We may, in some cases, use terms such as “predicts,” “believes,” “potential,” “proposed,” “continue,” “estimates,” “anticipates,” “expects,” “plans,” “intends,” “may,” “could,” “might,” “will,” “should” or other words that convey uncertainty of future events or outcomes to identify these forward-looking statements. Such statements are subject to numerous important factors, risks and uncertainties that may cause actual events or results to differ materially from our current expectations, such as market and other conditions. These and other risks and uncertainties are more fully described in our periodic filings with the Securities and Exchange Commission (the “SEC”), including the risk factors described in the section entitled “Risk Factors” in the quarterly and annual reports that we file with the SEC. Any forward-looking statements that we make in this press release speak only as of the date of this press release. Except as required by law, we assume no obligation to update forward-looking statements contained in this press release whether as a result of new information, future events or otherwise, after the date of this press release.

Ocugen Contact: 
Ken Inchausti
Head, Investor Relations & Communications
IR@Ocugen.com 

Please submit investor-related inquiries to: IR@ocugen.com

Coeur Mining (CDE) – Under Construction

Friday, July 30, 2021

Coeur Mining (CDE)
Under Construction

Coeur Mining Inc is a metals producer focused on mining precious minerals in the Americas. It is involved in the discovery and mining of gold and silver and generates the vast majority of revenue from the sale of these precious metals. The operating mines of the company are palmarejo, rochester, wharf, and kensington. Its projects are located in the United States, Canada and Mexico, and North America.

Mark Reichman, Senior Research Analyst of Natural Resources, Noble Capital Markets, Inc.

Refer to the full report for the price target, fundamental analysis, and rating.

    Second quarter 2021 financial results. Coeur reported a second quarter adjusted loss of $840 thousand, or ($0.00) per share, compared with earnings of $2.6 million, or $0.01 per share during the prior year period. Adjusted EBITDA were $52.7 million versus $42.2 million during the second quarter of 2020. We had forecast earnings of $11.7 million, or $0.09 per share, and EBITDA of $68.5 million. Including $39.8 million of fair value adjustments such as unrealized mark-to-market gains on Coeur’s investment in Victoria Gold, unadjusted EPS and EBITDA were $0.13 and $84.6 million. Free cash flow amounted to $(20.2) million.

    Updating estimates.  We have lowered our 2021 EPS and EBITDA estimates to $0.21 and $249.0 million from $0.35 and $280.9 million. While our production estimates are unchanged, our revised estimates incorporate second quarter earnings and the company’s updated guidance with respect to certain expenses. We forecast 2022 EPS and EBITDA of $0.35 and $279.2 million, respectively …


This research is provided by Noble Capital Markets, Inc., a FINRA and S.E.C. registered broker-dealer (B/D).

*Analyst certification and important disclosures included in the full report. NOTE: investment decisions should not be based upon the content of this research summary.  Proper due diligence is required before making any investment decision. 

Nuclear Powers New Paradigm Includes Microreactors


The Plug-and-Play Nuclear Battery Solution


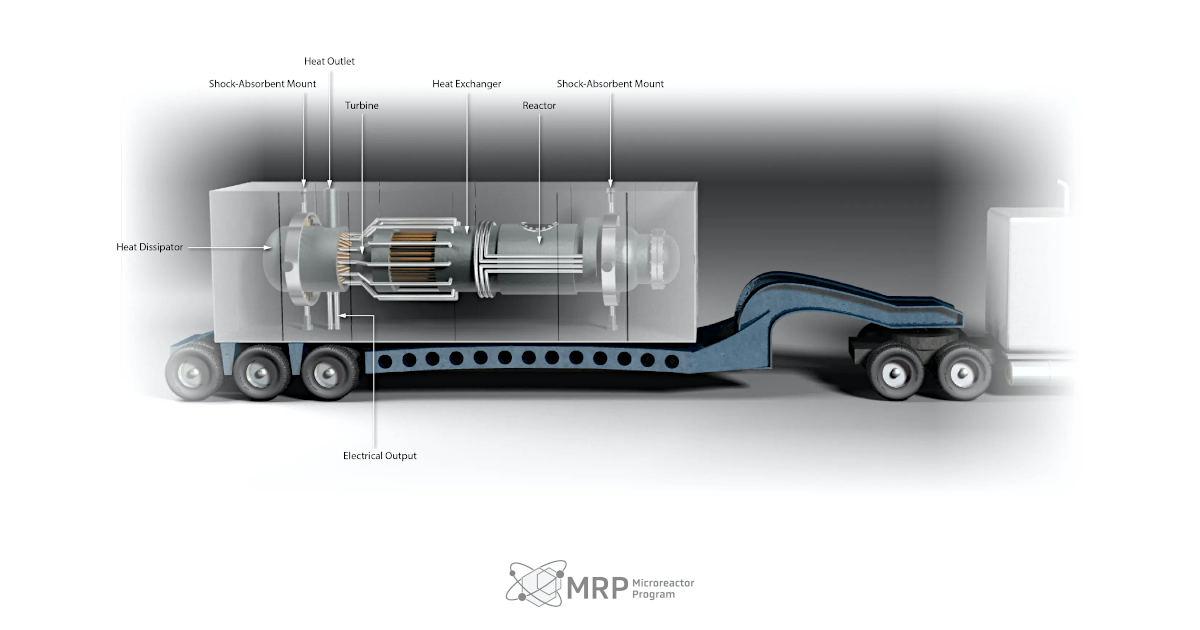
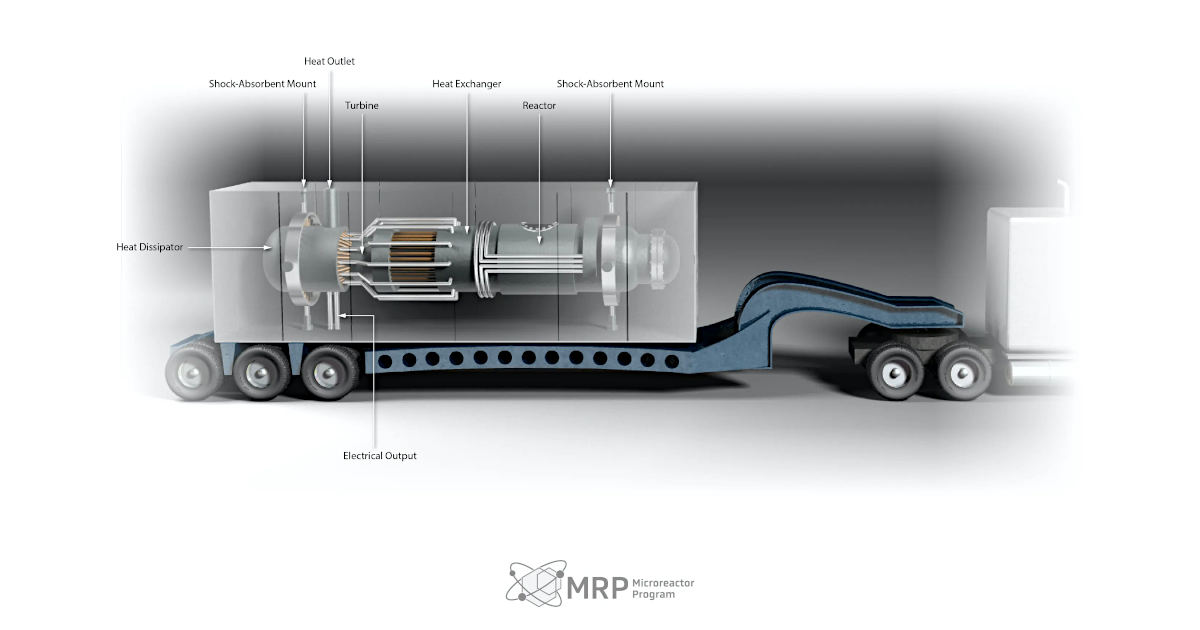
“Nuclear Batteries,” or microreactors, is a proposed system that would be able to run unattended for five or ten years, provide heat for industrial processes, or electric production for communities, then be refurbished. The technological progression expected is similar to what computers experienced. Processing power that once filled rooms is now condensed into a handheld device. For nuclear generation, there’s a movement toward relatively tiny and inexpensive factory-built reactors, designed for autonomous plug-and-play. These may one day be conveniently be put into service.

Concept

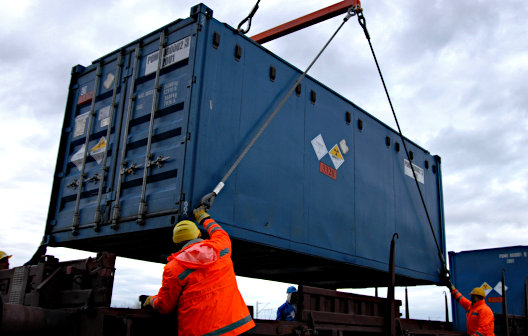
In a paper published last month titled “A Strategy to Unlock the Potential of Nuclear Energy for a New and Resilient Global Energy-Industrial Paradigm,” a group of nuclear specialists presented a case for nuclear battery (NB) design and production. The idea of smaller modular nuclear reactors has been around for a while, but this proposal takes the idea even further. The authors Jacopo Buongiorno, TEPCO Professor of Nuclear Science and Engineering, MIT – Robert Freda of GE Nuclear – Steven Aumeier, Sr. Advisor for Nuclear Energy Programs at Idaho National Lab – and Kevin Chilton, Ret. Air Force Commander of U.S. Strategic Command, believe units can be made and delivered similar to modular homes. Modular units, fabricated in a factory and placed in a shipping container for delivery and quick installation.

The concept is different than previous proposals of smaller reactors in that NBs are small and complete when they leave the factory. The machines are able to generate approximately 10 megawatts of power and are transportable on one truck or container. This would provide many economic benefits. Nuclear batteries would not require a large construction site, this can eliminate cost overruns. Nuclear power plant construction has been riddled with budget-busting surprise costs for decades.  The microreactor is installed quickly, perhaps just a few weeks, and can be looked at as an energy on-demand service. Nuclear batteries would make providing nuclear energy a product, not a mega-project.


Nuclear Battery Advantages

The advantages are easy to understand:

  • A single 10-Megawatt NB can power about 7000 – 8000 homes, a mining project, a midsize data center, or produce enough ongoing desalinated freshwater for over 150,000 people.
  • Can bring electricity to power most anything with no need for a continuous fuel supply.
  • Completely onsite, eliminating the need for long-distance transmission or grid infrastructure.
  • Simple design, fully standardized, mass-produced, fueled at the factory with few moving parts.
  • They combine a small nuclear reactor and a turbine to supply significant amounts of heat and/or power (on the order of 15–30 MWt or 5–10 MWe) while taking up very little real estate.
  • They are compact enough to fit in standard shipping containers for transport to the site of interest, where a unit can be installed and made operational in a matter of days or weeks.
  • Embedded intelligence and established advanced monitoring paradigms enable semiautonomous and remotely monitored operation, inherent digital security, and the potential for highly efficient global fleet operational models.
  • They use low-enriched uranium fuel.
  • “Exhausted” and properly cooled NBs can be safely shipped back to a centralized facility for refueling and refurbishment.
  • There is no need for high-level radioactive waste handling or storage at the user site.[3]

The combination of low-enriched fuel, simple design, mass manufacturing, minimal site preparation, and semiautonomous operation is expected to provide an economically competitive system that can be installed fast.


Safety

It’s hard to mention the word nuclear without “safety” coming to mind. The NBs would be designed with three safety functions not requiring operator intervention:

  1. Rapid shutdown of the fission chain reaction in the event of an unexpected condition.
  2. Adequate cooling of the nuclear fuel during shutdown.
  3. No uncontrolled release of materials into the biosphere.

These three features are expected to significantly reduce the possibility of accidents like those experienced at Three Mile Island, Chernobyl, and Fukushima.

Physical security for microreactors would come from a combination of design features like a strong fuel and containment shell and remote monitoring.  With cybersecurity as a growing concern, vulnerability could be reduced as the design and build would be such that even a knowledgeable operator would be unable to damage the nuclear fuel or cause a radioactive release. Further, most NB designs under consideration make it physically impossible to cause a runaway reaction.

Public
Companies Involved

There are half a dozen companies developing their own Microreactor designs. These include NucNet, GE Hitachi, Radiant, and BMX Technologies. Westinghouse is working on a design that uses heat pipe technology for cooling. The company plans to run a pilot plant as a demonstration unit at one of the national laboratories in three years. Idaho National Laboratory has a number of facilities that are being modified to accommodate small reactors so they can perform testing on them.

Take-Away

We may be on the brink of a new paradigm for nuclear power.

The number of ways the future may include uranium as a power source is increasing.  Add nuclear batteries to the list as they are well suited to provide for the needs of industry and many other sectors of the economy by providing a steady, dependable source of carbon-free electricity and heat that can be located on location where power or heat is needed.

Implementation would be a few years away but demand for uranium is increasing while this and other nuclear projects such as the natrium plant in Montana are becoming a reality.

Suggested Reading:


Can You Invest in Uranium Directly?


How Does the Gates Buffett Natrium Reactor Work?


Is the Future of Nuclear Power, Small Modular Reactors?


Energy Industry Report (Q2, 2021)


Sources:

https://www.nae.edu/255810/A-Strategy-to-Unlock-the-Potential-of-Nuclear-Energy-for-a-New-and-Resilient-Global-EnergyIndustrial-Paradigm

https://news.mit.edu/2021/nuclear-batteries-decarbon-0625

https://inl.gov/trending-topic/microreactors/#:~:text=WHAT%20ARE%20MICROREACTORS%3F,provide%20heat%20for%20industrial%20applications.

https://www.nucnet.org/news/us-defence-department-awards-contracts-worth-usd39-million-3-2-2020


Stay up to date. Follow us:


Cocrystal Pharma Inc. (COCP) – CDI-45205 Shows Broad Activity Against COVID-19 Variants

Friday, July 30, 2021

Cocrystal Pharma Inc. (COCP)
CDI-45205 Shows Broad Activity Against COVID-19 Variants

Cocrystal Pharma Inc is a clinical stage biotechnology company discovering and developing novel antiviral therapeutics that target the replication machinery of influenza viruses, hepatitis C viruses, and noroviruses. The company employs structure-based technologies and Nobel Prize-winning expertise to create first-and best-in-class antiviral drugs. It is developing CC-31244, an investigational, oral, broad-spectrum replication inhibitor called a non-nucleoside inhibitor (NNI). CC-31244 is currently being evaluated in a Phase 2a study for the treatment of hepatitis C as part of a cocktail for ultra-short therapy of 4 to 6 weeks.

Robert LeBoyer, Senior Research Analyst, Noble Capital Markets, Inc.

Refer to the full report for the price target, fundamental analysis, and rating.

    CDI-45205 Shows Efficacy Against Delta Variant.  Cocrystal announced that its protease inhibitor against the COVID-19 virus, CDI-45205, showed potent in vitro activity against all four major variants.  These include the Delta (India or B.1.617.2), Alpha (UK or B.1.1.7), Beta (South African or B.1.351) and Gamma (Brazil or P.1). We believe these data show that the company’s technology platform for developing RNA protease inhibitors that block viral replication has broad efficacy.

    Efficacy Data Provides Proof of Concept.  CDI-45205 is based on Cocrystal’s proprietary platform for developing molecules to inhibit RNA polymerases needed for viral replication.  Inhibition of these enzymes is an early step in the viral reproductive cycle that prevents replication and stops production of new viral particles. This differs from the current COVID-19 vaccines that stimulate an immune …


This Company Sponsored Research is provided by Noble Capital Markets, Inc., a FINRA and S.E.C. registered broker-dealer (B/D).

*Analyst certification and important disclosures included in the full report. NOTE: investment decisions should not be based upon the content of this research summary.  Proper due diligence is required before making any investment decision. 

QuickChek – July 30, 2021


Namaste Technologies Reports Second Quarter 2021 Financial Results

Namaste Technologies announced its financial results for the second quarter ended May 31, 2021

Research, News & Market Data on Namaste Technologies

Watch recent presentation from Namaste Technologies


Ocugen to Host Conference Call on Friday, August 6 at 8:30 a.m. ET

Ocugen announced that it will host a conference call to discuss its second quarter 2021 financial results and provide a business update

Research, News & Market Data on Ocugen

Watch recent presentation from Ocugen


Bunker Hill Achieves U.S. Market Upgrade to OTCQB

Bunker Hill Mining announced approval of its application for an upgrade to the OTCQB® Venture Market

Research, News & Market Data on Bunker Hill Mining


Stay up to date. Follow us:


Release – Comtech Telecommunications Corp. Awarded Multi-Million Dollar Order for New Ground Station Development Contract


Comtech Telecommunications Corp. Awarded Multi-Million Dollar Order for New Ground Station Development Contract


MELVILLE, N.Y.–(BUSINESS WIRE)–Jul. 29, 2021– 
July 29, 2021— 
Comtech Telecommunications Corp. (NASDAQ: CMTL), a global leading provider of next-generation 911 emergency systems and secure wireless communications technologies, announced today, that during its fourth quarter of fiscal year 2021, it was awarded a multi-million dollar contract from an overseas agency for development of a large transportable launch tracking ground station.

“We are pleased that our long-term customer continues to rely on 
Comtech for yet another ground station development contract,” said  Fred Kornberg, Chairman of the Board and Chief Executive Officer of 
Comtech Telecommunications Corp.

The contract was awarded to Comtech’s Space and Component Technology (“SCT”) division, which specializes in providing ground station services in the form of turnkey site development, infrastructure, operations and maintenance of several range tracking stations in the 
South Pacific. Using the concepts of product families and platform-based product development to increase variety, shorten lead-times and reduce costs without compromising system performance, SCT provides turnkey ground station solutions for both launch vehicle and satellite tracking. SCT also supplies high reliability microelectronics (for use in satellite, launch vehicle and manned space applications) as well as the most extensive line of LEO/MEO X/Y tracking antennas in the industry. For more information, visit www.comtechspace.com.

Comtech Telecommunications Corp. is a leading provider of next-generation 911 emergency systems and critical wireless communication technologies to commercial and government customers around the world. Headquartered in 
Melville, New York and with a passion for customer success, 
Comtech designs, produces and markets advanced and secure wireless solutions to customers in more than 100 countries. For more information, please visit www.comtechtel.com.

Certain information in this press release contains statements that are forward-looking in nature and involve certain significant risks and uncertainties. Actual results could differ materially from such forward-looking information. The Company’s 
Securities and Exchange Commission filings identify many such risks and uncertainties. Any forward-looking information in this press release is qualified in its entirety by the risks and uncertainties described in such 
Securities and Exchange Commission filings.

Comtech Investor Relations:
631-962-7005
investors@comtech.com

Source: 
Comtech Telecommunications Corp.

Release – Seanergy Maritime Holdings Corp. Reports Financial Results for the Second Quarter and Six Months Ended June 30 2021


Seanergy Maritime Holdings Corp. Reports Financial Results for the Second Quarter and Six Months Ended June 30, 2021


Seanergy Maritime Holdings Corp. Reports Financial Results for the Second Quarter and Six Months Ended June 30, 2021

Highlights of the Second Quarter of 2021:

  • Gross revenues: $28.9 million in Q2 2021 compared to $9.3 million in Q2 2020, up 209%
  • Net income: $2.0 million in Q2 2021, as compared to a net loss of $11.3 million in Q2 2020
  • EBITDA1: $10.8 million in Q2 2021, as compared to negative $2.1 million in Q2 2020
  • Adjusted EBITDA1$11.3 million in Q2 2021, as compared to negative $1.8 million in Q2 2020

Highlights of First Six Months of 2021:

  • Gross revenues: $50.0 million in 6M 2021 compared to $23.1 million in 6M 2020, up 116%
  • Net income: $0.6 million in 6M 2021, as compared to a net loss of $19.6 million in 6M 2020
  • EBITDA1: $17.3 million in 6M 2021 as compared to negative $1.1 million in 6M 2020
  • Adjusted EBITDA1$19.2 6M 2021, as compared to negative $0.5 million in 6M 2020

Second Quarter of 2021 and Recent Developments:

  • Fleet increase by 45% with the delivery of 5 modern Japanese Capesizes
  • Fleet modernization through substitution of the fleet’s oldest Capesize with aeight year younger vessel
  • New time charter agreements with prominent charterers
  • Financing and refinancing transactions of $117.3 million including a $30.9 million sale and leaseback & new loan commitment

July 29, 2021 – Athens, Greece – Seanergy Maritime Holdings Corp. (the “Company”) (NASDAQ: SHIP), announced today its financial results for the second quarter ended June 30, 2021.

For the quarter ended June 30, 2021, the Company generated gross revenues of $28.9 million, a 209% increase compared to the second quarter of 2020. Adjusted EBITDA for the quarter was $11.3 million, from negative $1.8 million in the same period of 2020. Net income for the second quarter was $2.0 million compared to net loss of $11.3 million in the second quarter of 2020. The daily Time Charter Equivalent (“TCE”)1 of the fleet for the second quarter of 2021 was $20,095, marking a 270% increase compared $5,424 for the second quarter of 2020.

For the six-month period ended June 30, 2021, gross revenues were $50.0 million, increased by 116% when compared to $23.1 million in same period of 2020. Adjusted EBITDA for the first six months of 2021 was $19.2 million, compared to a negative adjusted EBITDA of $0.5 million in the same period of 2020. The daily TCE of the fleet for the first six months of 2021 was $18,327 compared to $6,985 in the first six months of 2020. The average daily OPEX was $5,766 compared to $5,353 of the respective period of 2020.

Cash and cash-equivalents, restricted cash and term deposits as of June 30, 2021 stood at $56.4 million. Shareholders’ equity at the end of the second quarter was $199.4 million, vs. $95.7 million in December 31, 2020. Long-term debt (senior and junior loans and financial leases) stood at $203.8 million as of June 30, 2021, from $169.8 million as of the end of 2020. In the same period, following the addition of four of our new acquisitions, the book value of our fleet (including vessels held for sale and advances for vessel acquisitions) increased by 43.3% to $367.9 million from $256.7 million.

Third Quarter 2021 TCE Guidance:

As of the date hereof, approximately 94% of the Company fleet’s expected operating days in the third quarter of 2021 have been fixed at an estimated TCE of approximately $28,8802, or 63% higher than the TCE recorded in the first half of the year. Our TCE guidance for the third quarter of 2021 includes certain conversions (8 vessels) of index-linked charters to fixed for the 3-month period ending on September 30, 2021 which were concluded in the first and second quarter of 2021 as part of our freight hedging strategy. The following table provides the break-down:

  Operating Days TCE
TCE – fixed rate (index-linked conversion) 719.6 $28,049
TCE – fixed rate 136.6 $28,782
TCE – index linked & spot 591.9 $29,913
Total / Average 1,448.1 $28,880

Stamatis Tsantanis, the Company’s Chairman & Chief Executive Officer, stated:

“The six-month period that ended on June 30, 2021, marks a significant turning point for Seanergy, with strong financial performance, being the first profitable first-half since the Company’s relaunching in 2015. Most importantly, we have successfully concluded many milestone transactions that saw Seanergy’s fleet growing by more than 60% while solidifying our financial standing.

Concerning our results for the second quarter of 2021, our daily TCE was approximately $20,000, marking an increase of 270% compared to the TCE of the second quarter of 2020. The TCE of the fleet for the first 6 months of 2021 was about $18,300 per day as compared to a daily TCE of approximately $7,000 in the first half of 2020. As discussed in our last earnings release, our TCE performance in the second quarter was affected by certain less favorable conversions of index-linked charters to fixed which were concluded in the fourth quarter of 2020 as part of our freight hedging strategy. However, our Q3 guidance is very strong at close to $29,000 per day. Adjusted EBITDA for the second quarter and first half of 2021 was $11.3 million and $19.2 million respectively, as compared to negative adjusted EBITDA by $1.85 million and $0.5 million in the respective periods of 2020. Net result for the quarter was a profit of $2.0 million, which was sufficient to reverse the slight losses of the first quarter of the year resulting in a profitable first half for our Company.  

Regarding our fleet growth and renewal strategy, since the beginning of the year, our investment in our fleet has totaled approximately $160 million, and we have agreed to acquire 6 high-quality Japanese Capesize bulkers of an average age of 10.5 years, with the most recent acquisition being that of the 2009 built M/V Friendship. This vessel will essentially replace the oldest vessel in our fleet, the 2001 built M/V Leadership, which we agreed to sell to third-party buyers. This asset swap is improving the age profile of our fleet and enhances its competitiveness and compliance with the upcoming environmental regulations.

To date we have taken delivery of five out of the six new acquisitions and the last vessel, the 2012 built Worldship is scheduled to be delivered to us in August, followed by the delivery of the M/V Leadership to her new owners in September. The total investment capex of about $160 million has been fully funded by our cash reserves, which remain strong following these acquisitions, and newly concluded debt financing arrangements.

On the debt financing front, in the first half of 2021, we have successfully concluded new financings and refinancings of $104.3 million whilst making $69.7 million prepayments and repayments on our legacy debt facilities. The resulting net increase in our debt by $34.6 million, against an increase in the book value of our fleet by $158.9 million, implies a 22% effective loan-to-value on our new acquisitions. Next to the significant deleveraging of the balance sheet, the retirement of expensive debt and its replacement with competitively priced financings reflects positively on our bottom line. Indicatively, the weighted average interest rate on the facilities that were fully prepaid was 8.4% as compared to 3.35% for the new $104.3 million financings. We also expect that the terms of our financings will improve further going forward.

Concerning the commercial deployment of our fleet, in 2021 to date, we have concluded seven new period employment agreements ranging from 12 months to 5 years. All time-charters have been concluded with world-leading charterers in the Capesize sector, including NYK, Cargill, Anglo American and Ssangyong. The underlying rates are mainly index-linked, in most cases with options to convert to fixed based on the prevailing freight futures curve, allowing us to capitalize on potential spikes in the day-rates. Taking advantage of the strong market conditions, we have concluded fixed rate T/Cs at rates exceeding $31,000 per day for periods ranging from 12 to 18 months for two vessels. We continue to position our fleet optimally for what we believe to be an unfolding commodities super-cycle, which will underscore the importance of dry bulk shipping and especially that of the Capesize sector in global seaborne trade.

With respect to the implementation of our ESG agenda and as part of our continuous efforts to improve the energy efficiency rating of our fleet, we have installed Energy Saving Devices (“ESDs”) on an additional vessel and we have agreed with Cargill to install ESDs on another vessel in the coming months. Moreover, we have partnered with DeepSea for the installation of Artificial Intelligence performance systems on our fleet with proven benefit on fuel consumption. Finally we are in progressed discussions with other charterers for similar ESD projects, as well as for biofuel blend trials, which we believe to be one of the most efficient ways to transition into a greener future for shipping.

Regarding current market conditions, we are very pleased to see a consistent positive trend in our sector with daily rates above $20,000/ day since the beginning of April. Looking ahead, we are entering the seasonally “strong” period for Brazilian iron ore exports as local miners are ramping up production, supported by favorable weather conditions and “clean” plant maintenance schedules. At the same time coal prices are at the highest level of the last decade resulting in steadily rising seaborne coal volumes – a positive trend that defies the seasonal patterns of the last years. On that basis, and considering the favorable vessel-supply fundamentals of our sector with the orderbook standing at the lowest level of the last 25 years, as amplified by the catalytic effect of the upcoming environmental regulations, we feel confident about the prospects of the Capesize market.

As mentioned earlier, our daily TCE for the third quarter, based on 94% of our available days, stands at approximately $29,000, which is 63% higher than our 1H TCE. As part of our forward rates hedging strategy, we have triggered the “floating to fixed” feature on 8 of our index-linked charterers at an average net daily rate of approximately $28,050. This in combination with the solid outlook for our sector will form the basis for what we expect to be a further improved financial performance in the next quarter.

On a closing note, we have worked tirelessly and determinedly over the last 18 months to execute consistently on our strategic initiatives and place Seanergy amongst the most prominent Capesize owners globally. We remain committed to delivering additional value for our shareholders.”

Company Fleet following vessels’ deliveries and the sale of the M/V Leadership:

Vessel Name Vessel Size Class Capacity (DWT) Year Built Yard Scrubber Fitted Employment Type Minimum T/C duration
Partnership Capesize 179,213 2012 Hyundai Yes T/C Index Linked (1) 3 years
Championship Capesize 179,238 2011 Sungdong Yes T/C Index Linked (2) 5 years
Lordship Capesize 178,838 2010 Hyundai Yes T/C Index Linked (3) 3 years
Premiership Capesize 170,024 2010 Sungdong Yes T/C Index Linked (4) 3 years
Squireship Capesize 170,018 2010 Sungdong Yes T/C Index Linked (5) 3 years
Knightship Capesize 178,978 2010 Hyundai Yes T/C Index Linked (6) 3 years
Gloriuship Capesize 171,314 2004 Hyundai No T/C Index Linked (7) 10 months
Fellowship Capesize 179,701 2010 Daewoo No T/C Index Linked (8) 1 year
Geniuship Capesize 170,058 2010 Sungdong No T/C Index Linked (9) 11 months
Hellasship Capesize 181,325 2012 Imabari No T/C Index Linked (10) 11 months
Flagship Capesize 176,387 2013 Mitsui No T/C Index Linked (11) 5 years
Patriotship Capesize 181,709 2010 Saijo – Imabari Yes T/C Fixed Rate-$31,000/day (12) 1 year
Tradership Capesize 176,925 2006 Namura No T/C Index Linked(13) 11 months
Friendship Capesize 176,952 2009 Namura No T/C Index Linked(14) 17 months
Goodship Capesize 177,536 2005 Mitsui No Voyage/Spot  
Worldship (15) Capesize 181,415 2012 Japanese Shipyard Yes T/C Fixed Rate -$31,750/day(16) 1 year
Total / Average age 2,829,631                              11.4                       

(1)   Chartered by a major European utility and energy company and delivered to the charterer on September 11, 2019 for a period of minimum 33 to maximum 37 months with an optional period of about 11 to maximum 13 months. The daily charter hire is based on the BCI. In addition, the Company has the option to convert to a fixed rate for a period of between 3 and 12 months, based on the prevailing Capesize Forward Freight Agreement Rate (“FFA”) for the selected period.

(2)   Chartered by Cargill. The vessel was delivered to the charterer on November 7, 2018 for a period of employment of 60 months, with an additional period of about 24 to about 27 months at the charterer’s option. The daily charter hire is based on the BCI plus a net daily scrubber premium of $1,740. In addition, the time charter provides the option to convert the index linked rate to a fixed rate for a period of between 3 and 12 months based on the Capesize FFA for the selected period.

(3)   Chartered by a major European utility and energy company and delivered on August 4, 2019 for a period of minimum 33 to maximum 37 months with an optional period of 11-13 months. The daily charter hire is based on the BCI plus a net daily scrubber premium of $3,735 until May 2021. In addition, the Company has the option to convert to a fixed rate for a period of between three and 12 months, based on the prevailing Capesize FFA for the selected period.

(4)   Chartered by Glencore and was delivered to the charterer on November 29, 2019 for a period of minimum 36 to maximum 42 months with two optional periods of minimum 11 to maximum 13 months. The daily charter hire is based on the BCI plus a net daily scrubber premium of $2,055.

(5)   Chartered by Glencore and was delivered to the charterer on December 19, 2019 for a period of minimum 36 to maximum 42 months with two optional periods of minimum 11 to maximum 13 months. The daily charter hire is based on the BCI plus a net daily scrubber premium of $2,055.

(6)   Chartered by Glencore and was delivered to the charterer on May 15, 2020 for a period of about 36 to about 42 months with two optional periods of minimum 11 to maximum 13 months. The daily charter hire is based on the BCI.

(7)   Chartered by Pacbulk Shipping and delivered to the charterer on April 23, 2020 initially for a period of about 10 to about 14 months. Upon expiration of the current T/C period, in June 2021, the vessel commenced the second extension period up to minimum January 1, 2022 to maximum April 30, 2022. The daily charter hire is based on the BCI. In addition, the Company has the option to convert to a fixed rate, based on the prevailing Capesize FFA for the selected period.

(8)   Chartered by Anglo American, a leading global mining company, and expected to be delivered to the charterer towards the beginning of June 2021 for a period of minimum 12 to maximum 15 months from the delivery date. The daily charter hire is based on the BCI. In addition, the Company has the option to convert to a fixed rate for a period of minimum three and maximum 12 months, based on the prevailing Capesize FFA for the selected period.

(9)   Chartered by Pacbulk Shipping and was delivered to the charterer on March 22, 2021 for a period of about 11 to about 14 months from the delivery date. The daily charter hire is based on the BCI. In addition, the Company has the option to convert to a fixed rate based on the prevailing Capesize FFA for the selected period.

(10)   Chartered by NYK Line and was delivered to the charterer on May 10, 2021 for a period of minimum 11 to maximum 15 months. The daily charter hire is based at a premium over the BCI.

(11)   Chartered by Cargill. The vessel was delivered to the charterer on May 10, 2021 for a period of 60 months. The daily charter hire is based at a premium over the BCI minus $1,325 per day. In addition, the time charter provides the option to convert the index linked rate to a fixed rate for a period of minimum 3 to maximum 12 months based on the Capesize FFA for the selected period.

(12)   Chartered by a European cargo operator and was delivered to the charterer on June 7, 2021 for a period of minimum 12 to maximum 18 months. The daily charter hire is fixed at $31,000.

(13)   Chartered by a major South Korean industrial company and was delivered to the charterer on June 15, 2021 for a period employment of 11 to 15 months. The daily charter hire is based on the BCI.

(14)   Chartered by NYK Line and was delivered to the charterer on July 29, 2021 for a period of minimum 17 to maximum 24 months. The daily charter hire is based at a premium over the BCI.

(15)   Prompt delivery

(16)   Chartered by a U.S. commodity trading company and will be delivered to the charterer upon its delivery for a period of about 12 to 16 months. The daily charter hire is fixed at $31,750.

Fleet Data:

(U.S. Dollars in thousands)

  Q2 2021 Q2 2020 6M 2021 6M 2020
Ownership days (1) 1,164 910 2,155 1,820
Operating days (2) 1,122 863 2,055 1,764
Fleet utilization (3) 96.4% 94.8% 95.4% 96.9%
TCE rate (4) $20,095 $5,424 $18,327 $6,985
Daily Vessel Operating Expenses (5) $5,908 $5,140 $5,766 $5,353

(1)   Ownership days are the total number of calendar days in a period during which the vessels in a fleet have been owned or chartered in. Ownership days are an indicator of the size of the Company’s fleet over a period and affect both the amount of revenues and the amount of expenses that the Company recorded during a period.

(2)   Operating days are the number of available days in a period less the aggregate number of days that the vessels are off-hire due to unforeseen circumstances. Operating days includes the days that our vessels are in ballast voyages without having finalized agreements for their next employment.

(3)   Fleet utilization is the percentage of time that the vessels are generating revenue and is determined by dividing operating days by ownership days for the relevant period.

(4)   TCE rate is defined as the Company’s net revenue less voyage expenses during a period divided by the number of the Company’s operating days during the period. Voyage expenses include port charges, bunker (fuel oil and diesel oil) expenses, canal charges and other commissions. The Company includes the TCE rate, a non-GAAP measure, as it believes it provides additional meaningful information in conjunction with net revenues from vessels, the most directly comparable U.S. GAAP measure, and because it assists the Company’s management in making decisions regarding the deployment and use of the Company’s vessels and in evaluating their financial performance. The Company’s calculation of TCE rate may not be comparable to that reported by other companies. The following table reconciles the Company’s net revenues from vessels to the TCE rate.

(In thousands of U.S. Dollars, except operating days and TCE rate)

  Q2 2021 Q2 2020 6M 2021 6M 2020
Net revenues from vessels 27,832 9,042 48,230 22,381
Less: Voyage expenses 5,285 4,361 10,567 10,060
Net operating revenues 22,547 4,681 37,663 12,321
Operating days 1,122 863 2,055 1,764
TCE rate $20,095 $5,424 $18,327 $6,985

(5)   Vessel operating expenses include crew costs, provisions, deck and engine stores, lubricants, insurance, maintenance and repairs. Daily Vessel Operating Expenses are calculated by dividing vessel operating expenses by ownership days for the relevant time periods. The Company’s calculation of daily vessel operating expenses may not be comparable to that reported by other companies. The following table reconciles the Company’s vessel operating expenses to daily vessel operating expenses.


(In thousands of U.S. Dollars, except ownership days and Daily Vessel Operating Expenses)

  Q2 2021 Q2 2020 6M 2021 6M 2020
Vessel operating expenses 8,879 4,677 14,428 9,742
Less: Pre-delivery expenses 2,002 2,002
Vessel operating expenses excluding pre-delivery expenses 6,877 4,677 12,426 9,742
Ownership days 1,164 910 2,155 1,820
Daily Vessel Operating Expenses 5,908 5,140 5,766 5,353

Net Loss to EBITDA and Adjusted EBITDA Reconciliation:

(In thousands of U.S. Dollars)

  Q2 2021 Q2 2020 6M 2021 6M 2020
Net income/(loss) 1,961 (11,286) 640 (19,629)
Add: Net interest and finance cost 4,277 5,556 8,307 11,244
Add: Depreciation and amortization 4,520 3,674 8,337 7,308
EBITDA 10,758 (2,056) 17,284 (1,077)
Add: stock based compensation 528 207 1,931 589
Adjusted EBITDA 11,286 (1,849) 19,215 (488)

Earnings Before Interest, Taxes, Depreciation and Amortization (“EBITDA”) represents the sum of net income / (loss), interest and finance costs, interest income, depreciation and amortization and, if any, income taxes during a period. EBITDA is not a recognized measurement under U.S. GAAP. Adjusted EBITDA represents EBITDA adjusted to exclude stock based compensation, which the Company believes is not indicative of the ongoing performance of its core operations.

EBITDA and adjusted EBITDA are presented as we believe that these measures are useful to investors as a widely used means of evaluating operating profitability. EBITDA and adjusted EBITDA as presented here may not be comparable to similarly titled measures presented by other companies. These non-GAAP measures should not be considered in isolation from, as a substitute for, or superior to, financial measures prepared in accordance with U.S. GAAP.

Interest and Finance Costs to Cash Interest and Finance Costs Reconciliation:

(In thousands of U.S. Dollars)

  Q2 2021 Q2 2020 6M 2021 6M 2020
Interest and finance costs, net (4,277) (5,556) (8,307) (11,244)
Add: Amortization of deferred finance charges 985 177 1,702 349
Add: Amortization of convertible note beneficial conversion feature 61 1,279 1,238 2,416
Add: Amortization of other deferred charges 333 149 174 302
Cash interest and finance costs (2,898) (3,951) (5,193) (8,177)

Second Quarter and Recent Developments:

Update on Vessel Acquisitions and Time-Charter Agreements

Deliveries and Time Charters Commencement

During the first half, the Company has agreed to acquire six high-quality Japanese Capesize bulkers and has taken delivery of five, while the sixth vessel is scheduled to be delivered in August. All newly acquired units have been fixed on medium to long-term time charters as of their respective deliveries.

M/V Hellasship

In May 2021, the Company took delivery of the 181,325 dwt Capesize bulk carrier, built in 2012 in Japan, which was renamed M/V Hellasship. The M/V Hellasship was fixed on a time charter with NYK Line, a leading Japanese shipping company and operator. The T/C commenced on May 10, 2021 and will have a term of minimum 11 to maximum 15 months. The gross daily rate of the T/C is based at a premium over the BCI.

M/V Flagship

In May 2021, the Company took delivery of the 176,387 dwt Capesize bulk carrier, built in 2013 in Japan, which was renamed M/V Flagship. The M/V Flagship is the second vessel of the Company’s fleet time-chartered to Cargill International S.A. (“Cargill”). The daily hire is based on the BCI, while the Company has the option to convert the index-linked hire to fixed for a minimum period of three months to a maximum of 12 months based on the prevailing Capesize FFA curve. The rate is 102% of the BCI minus $1,325 per day. The term of the T/C is 5 years from the delivery of the vessel to Cargill, which took place on May 10, 2021.

M/V Patriotship

In June 2021, the Company took delivery of the 181,709 dwt Capesize bulk carrier, built in 2010 in Japan, which was renamed M/V Patriotship. The M/V Patriotship has been fixed on a time charter with a major European cargo operator. The T/C commenced on June 7, 2021 and will have a term of minimum 12 to maximum 15 months. The gross daily hire is $31,000.

M/V Tradership

In June 2021, the Company took delivery of the 176,925 dwt Capesize bulk carrier, built in 2006 in Japan, which was renamed M/V Tradership. The M/V Tradership has been fixed on a time charter with a major South Korean industrial company. The T/C commenced on June 15, 2021 and will have a term of minimum 11 to maximum 15 months. The gross daily rate of the T/C is based on the BCI.

M/V Worldship

In May 2021, the Company agreed to acquire a 181,415 dwt Capesize bulk carrier, built in 2012 in Japan, which will be renamed M/V Worldship. The M/V Worldship has been fixed on a T/C with a world-leading U.S. commodity trading company, at a gross daily rate of $31,750 for a period of minimum 12 to maximum16 months. The T/C is expected to commence immediately upon the vessel’s upcoming delivery, which is anticipated within August 2021.

Vessel Replacement

M/V Friendship

In July 2021, the Company took delivery of the 176,952 dwt Capesize bulk carrier, built in 2009 in Japan, which was renamed M/V Friendship. The M/V Friendship has been fixed on a time charter with NYK Line, a leading Japanese shipping company and operator. The T/C will commence promptly, upon finalization of the customary handover process and will have a term of minimum 17 to maximum 24 months. The gross daily rate of the T/C is based on 102% of the BCI.

M/V Leadership

Additionally, the Company has agreed to sell the 2001-built M/V Leadership to an unaffiliated party for a net sale price of $12.0 million. The substitution will improve the average age of the Company’s fleet. The vessel’s delivery to her new owners is anticipated within September 2021.

Financing Updates

During the second quarter, the Company has successfully concluded new financings and refinancing of $104.3 million and has received a commitment letter for a loan facility of up to $13.0 million.

Alpha Bank S.A.

On May 20, 2021, the Company entered into a $37.45 million credit facility to (i) refinance the existing facilities of $25.5 million secured by the M/V Leadership and the M/V Squireship and (ii) finance the previously unencumbered M/V Lordship. The earliest maturity date of the facility will be in December 2024 and the interest rate is 3.5% plus LIBOR per annum.

Aegean Baltic Bank S.A.

On April 22, 2021, the Company entered into a credit facility for an amount of $15.5 million secured by the M/V Goodship and the M/V Tradership. The facility has a term of 4.5 years, with latest maturity date falling in December 2025 and bears interest of LIBOR plus 4% per annum.

Cargill International S.A.

On May 11, 2021, the Company entered into a sale and leaseback transaction with Cargill to partially fund the acquisition cost of the M/V Flagship. The financing amount is $20.5 million at an implied interest rate of approximately 2% all-in, fixed for five years.

New Financing Agreement of $30.9 million

In June 2021, the Company successfully concluded the financing of two of its new acquisitions, the 2012-built Capesize M/V Hellasship and the 2010-built M/V Patriotship through a sale and leaseback agreement with a major Chinese financial institution. The vessels were sold and chartered back on a bareboat basis for a five-year period, the combined financing amount is $30.9 million and the applicable interest rate is LIBOR + 3.50% p.a.

Alpha Bank Commitment Letter – Friendship

In July 2021, the Company obtained a commitment letter from Alpha Bank S.A. for a loan facility of up to $13.0 million, in order to finance the acquisition of the 2009-built Capesize M/V Friendship. The interest rate will be LIBOR plus 3.25% p.a., and the term of the loan will be four years. The facility will be repaid through 4 quarterly instalments of $0.7 million followed by 12 quarterly instalments of $0.38 million and a balloon of $5.7 million payable together with the last instalment. The new loan facility will be structured as an additional loan tranche in the existing Alpha Bank facility secured by the M/Vs Lordship, Squireship and Leadership mentioned above.


Seanergy Maritime Holdings Corp.
Unaudited Condensed Consolidated Balance Sheets
(In thousands of U.S. Dollars)

    June 30,
2021
    December 31, 2020*  
ASSETS            
Cash and cash equivalents, restricted cash and term deposits   56,394     23,651  
Vessels, vessel held for sale and advances for vessels’ acquisitions, net   367,897     256,737  
Other assets   16,483     14,857  
TOTAL ASSETS   440,774     295,245  
             
LIABILITIES AND STOCKHOLDERS’ EQUITY            
      Long-term debt and other financial liabilities   203,829     169,762  
Convertible notes   16,196     14,516  
Other liabilities   21,335     15,273  
Stockholders’ equity   199,414     95,694  
TOTAL LIABILITIES AND STOCKHOLDERS’ EQUITY   440,774     295,245  

* Derived from the audited consolidated financial statements as of the period as of that date

Seanergy Maritime Holdings Corp.
Unaudited Condensed Consolidated Statements of Operations
(In thousands of U.S. Dollars, except for share and per share data, unless otherwise stated)


  Three months ended
June 30,
  Six months ended
June 30,
   
    2021   2020   2021     2020    
Revenues:                      
Vessel revenues   28,867   9,341   50,023     23,148    
Commissions   (1,035 ) (299 ) (1,793 )   (767 )  
Vessel revenue, net   27,832   9,042   48,230     22,381    
Expenses:                      
Voyage expenses   (5,285 ) (4,361 ) (10,567 )   (10,060 )  
Vessel operating expenses   (8,879 ) (4,677 ) (14,428 )   (9,742 )  
Management fees   (348 ) (251 ) (629 )   (503 )  
General and administrative expenses   (2,566 ) (1,786 ) (5,296 )   (3,145 )  
Depreciation and amortization   (4,520 ) (3,674 ) (8,337 )   (7,308 )  
Operating income/(loss)   6,234   (5,707 ) 8,973     (8,377 )  
Other income / (expenses):                      
Interest and finance costs, net   (4,277 ) (5,556 ) (8,307 )   (11,244 )  
Other, net   4   (23 ) (26 )   (8 )  
Total other expenses, net:   (4,273 ) (5,579 ) (8,333 )   (11,252 )  
Net income/(loss)   1,961   (11,286 ) 640     (19,629 )  
                       
Net income/(loss) per common share, basic and diluted   0.01   (0.65 ) 0.01     (2.05 )  
Weighted average number of common shares outstanding, basic   160,171,874   17,478,283   137,590,311     9,588,854    
Weighted average number of common shares outstanding, diluted   174,592,644   17,478,283   152,052,538     9,588,854    
                       

About Seanergy Maritime Holdings Corp.

Seanergy Maritime Holdings Corp. is the only pure-play Capesize ship-owner publicly listed in the US. Seanergy provides marine dry bulk transportation services through a modern fleet of Capesize vessels. On a ‘fully-delivered’ basis, the Company’s fleet will consist of 16 Capesize vessels with an average age of 11.4 years and aggregate cargo carrying capacity of 2,829,631 dwt.

The Company is incorporated in the Marshall Islands and has executive offices in Glyfada, Greece. The Company’s common shares trade on the Nasdaq Capital Market under the symbol “SHIP”, its Class A warrants under “SHIPW” and its Class B warrants under “SHIPZ”.

Please visit our company website at: www.seanergymaritime.com.

Forward-Looking Statements

This press release contains forward-looking statements (as defined in Section 27A of the Securities Act of 1933, as amended, and Section 21E of the Securities Exchange Act of 1934, as amended) concerning future events. Words such as “may”, “should”, “expects”, “intends”, “plans”, “believes”, “anticipates”, “hopes”, “estimates” and variations of such words and similar expressions are intended to identify forward-looking statements. These statements involve known and unknown risks and are based upon a number of assumptions and estimates, which are inherently subject to significant uncertainties and contingencies, many of which are beyond the control of the Company. Actual results may differ materially from those expressed or implied by such forward-looking statements. Factors that could cause actual results to differ materially include, but are not limited to, the Company’s operating or financial results; the Company’s liquidity, including its ability to service its indebtedness; competitive factors in the market in which the Company operates; shipping industry trends, including charter rates, vessel values and factors affecting vessel supply and demand; future, pending or recent acquisitions and dispositions, business strategy, areas of possible expansion or contraction, and expected capital spending or operating expenses; risks associated with operations outside the United States; risks associated with the length and severity of the ongoing novel coronavirus (COVID-19) outbreak, including its effects on demand for dry bulk products and the transportation thereof; and other factors listed from time to time in the Company’s filings with the SEC, including its most recent annual report on Form 20-F. The Company’s filings can be obtained free of charge on the SEC’s website at www.sec.gov. Except to the extent required by law, the Company expressly disclaims any obligations or undertaking to release publicly any updates or revisions to any forward-looking statements contained herein to reflect any change in the Company’s expectations with respect thereto or any change in events, conditions or circumstances on which any statement is based.

For further information please contact:

Seanergy Investor Relations
Tel: +30 213 0181 522
E-mail: ir@seanergy.gr

Capital Link, Inc.
Daniela Guerrero
230 Park Avenue Suite 1536
New York, NY 10169
Tel: (212) 661-7566
E-mail: seanergy@capitallink.com


1 EBITDA and Time Charter Equivalent (“TCE”) rate are non-GAAP measures. Please see the reconciliation below of EBITDA to net loss and TCE rate to net revenues from vessels, in each case the most directly comparable U.S. GAAP measure.

2 This guidance is based on certain assumptions and there can be no assurance that these TCE estimates or projected utilization will be realized. TCE estimates include certain floating (index) to fixed rate conversions concluded in previous periods. For vessels on index-linked T/Cs, the TCE realized will vary with the underlying index, and for the purposes of this guidance, the TCE assumed for the remaining operating days of an index-linked T/C is equal to the last invoiced average of the BCI for the respective T/C, which is approximately equal to $30,000 as compared to an average FFA rate of $36,000 per day for August and September 2021 as of July 26, 2021. Spot estimates are provided using the load-to-discharge method of accounting. Load-to-discharge accounting recognizes revenues over fewer days as opposed to the discharge-to-discharge method of accounting used prior to 2018, resulting in higher rates for these days and only voyage expenses being recorded in the ballast days. Over the duration of the voyage (discharge-to-discharge) there is no difference in the total revenues and costs to be recognized. The rates quoted are for days currently contracted. Increased ballast days at the end of the quarter will reduce the additional revenues that can be booked based on the accounting cut-offs and therefore the resulting TCE will be reduced accordingly.
Orion Group Holdings (ORN) – 2Q2021 Results Lower than Expected Due to Wet Weather

Thursday, July 29, 2021

Orion Group Holdings (ORN)
2Q2021 Results Lower than Expected Due to Wet Weather

Orion Group Holdings, based in Houston, Texas, is a specialty construction company within the Marine and Industrial Construction sectors, with operations focused in the continental United States and Caribbean. Revenue is split roughly 50/50 between a Marine Construction segment that provides marine facility, pipeline and structural construction services and a Commercial Concrete segment that provides turnkey concrete services in the light commercial and structural construction markets.

Poe Fratt, Senior Research Analyst, Noble Capital Markets, Inc.

Refer to the full report for the price target, fundamental analysis, and rating.

    Weather challenges prevailed. 2Q2021 Adjusted EBITDA of $7.4 million was ~$2.1 million below our estimate of $9.5 million and EBITDA margin of 5.1% was also 70 bps light. While we had recently lowered our estimate based on wet weather in Texas, the main market for the Concrete business, we underestimated the impact on the Marine business. Total revenue of $145.9 million and gross margin of $12.3 million (8.4%) were down sequentially and well below 2Q2020 levels. Excluding the $6.8 million gain on the Tampa yard sale, Marine EBITDA was $7.8 million, but Concrete EBITDA turned negative again at -$0.4 million due to lower fixed cost absorption.

    Call today at 10am EST — Number is 201-493-6739 and code is Orion Group Holdings.  On the call, we will look for details on: 1) Impact of weather in 2Q2021 and any lingering impact due to a wet July; 2) 2H2021 bidding activity for both Marine and Concrete; 3) Prospects for a rebound in Concrete profitability; 4) Timing of closing of the Port Lavaca sale; 5) Interest in the East West Jones property …


This Company Sponsored Research is provided by Noble Capital Markets, Inc., a FINRA and S.E.C. registered broker-dealer (B/D).

*Analyst certification and important disclosures included in the full report. NOTE: investment decisions should not be based upon the content of this research summary.  Proper due diligence is required before making any investment decision. 

Cumulus Media Inc. (CMLS) – A Wynn Win

Thursday, July 29, 2021

Cumulus Media Inc. (CMLS)
A Wynn Win

CUMULUS MEDIA, Inc. (NASDAQ: CMLS) is a leading audio-first media and entertainment company delivering premium content to over a quarter billion people every month — wherever and whenever they want it. CUMULUS MEDIA engages listeners with high-quality local programming through 428 owned-and-operated stations across 87 markets; delivers nationally-syndicated sports, news, talk, and entertainment programming from iconic brands including the NFL, the NCAA, the Masters, the Olympics, the GRAMMYS, the American Country Music Awards, and many other world-class partners across nearly 8,000 affiliated stations through Westwood One, the largest audio network in America; and inspires listeners through its rapidly growing network of original podcasts that are smart, entertaining and thought-provoking. CUMULUS MEDIA provides advertisers with local impact and national reach through on-air, digital, mobile, and voice-activated media solutions, as well as access to integrated digital marketing services, powerful influencers, and live event experiences. CUMULUS MEDIA is the only audio media company to provide marketers with local and national advertising performance guarantees.

Michael Kupinski, Director of Research, Noble Capital Markets, Inc.

Refer to the full report for the price target, fundamental analysis, and rating.

    Wins significant advertising support. Cumulus Media struck a partnership with WynnBET, a mobile sports betting app from Wynn Resorts, becoming one of the company’s largest advertisers. The value of the agreement was undisclosed, but is expected to include both cash, (the majority of the deal), and stock in WynnBET. The partnership is expected to support multiple platforms at the company including the Westwood One Networks and its Digital and Local Radio brands.

    Inside the partnership’s details.  The deal is a significant win for Cumulus given that Wynn was not a significant advertiser at the company. Furthermore, this is a non-exclusive agreement and management indicated that there is significant advertising inventory for additional relationships, including other sports betting companies. In addition, the partnership is expected to be a multi-year …


This research is provided by Noble Capital Markets, Inc., a FINRA and S.E.C. registered broker-dealer (B/D).

*Analyst certification and important disclosures included in the full report. NOTE: investment decisions should not be based upon the content of this research summary.  Proper due diligence is required before making any investment decision. 

Orion Group Holdings, Inc. Reports Second Quarter 2021 Results


Orion Group Holdings, Inc. Reports Second Quarter 2021 Results


HOUSTON–(BUSINESS WIRE)–Jul. 28, 2021– 
Orion Group Holdings, Inc. (NYSE: ORN) (the “Company”), a leading specialty construction company, today reported net income of 
$3.5 million (
$0.11 diluted earnings per share) for the second quarter ended 
June 30, 2021.

Second Quarter 2021 Highlights

  • Operating income was 
    $5.6 million for the second quarter of 2021 compared to operating income of 
    $4.1 million for the second quarter of 2020.
  • Net income was 
    $3.5 million (
    $0.11 diluted earnings per share) for the second quarter of 2021 compared to net income of 
    $2.0 million (
    $0.07 diluted earnings per share) for the second quarter of 2020.
  • The second quarter 2021 net income included 
    $3.0 million (
    $0.10 earnings per diluted share) of non-recurring items and 
    $1.1 million (
    $0.04 loss per diluted share) of tax expense associated with the movement of certain valuation allowances. Second quarter 2021 adjusted net income was 
    $1.7 million (
    $0.05 diluted earnings per share). (Please see page 9 of this release for a reconciliation of adjusted net income).
  • EBITDA, adjusted to exclude the impact of the aforementioned non-recurring items, was 
    $7.4 million in the second quarter of 2021, which compares to adjusted EBITDA of 
    $12.6 million for the second quarter of 2020. (Please see page 10 of this release for an explanation of EBITDA, adjusted EBITDA and a reconciliation to the nearest GAAP measure).
  • Backlog at the end of the second quarter was 
    $394.4 million on a second quarter book-to-bill of 1.20x.

“During the second quarter we closed on the sale of our 
Tampa property further strengthening our balance sheet and enhancing our liquidity,” stated  Mark Stauffer, Orion’s Chief Executive Officer. “The gain on the sale is included in our results for the second quarter, which were also impacted by inordinately wet weather in our key operating geographies, which affected both business segments, but predominantly our concrete business.”

“Our concrete segment’s production was hampered during the quarter by wet weather conditions across 
Texas, and as a result, our labor capacity was underutilized. Our concrete segment’s ability to catch up on work and execute effectively in normal weather conditions will allow us to efficiently complete any delayed projects in subsequent quarters. The wet weather unfortunately resulted in under recovery of indirect costs, including labor and equipment utilization, during the quarter.”

“We remain optimistic about our end markets and future project opportunities. During the second quarter we bid on a significant volume of bids, including several large projects, and we ended the quarter with a substantial amount of quoted work outstanding. We are confident that bidding opportunities will continue to materialize, especially in end-markets that have been adversely impacted by COVID, including the cruise and energy industries, which have begun generating project opportunities again. We also are continuing to track progress on the Federal infrastructure bill, which would provide an additional catalyst for our end markets and drive absorption of industry capacity. The diversity of our end markets and our unique capabilities across both of our business segments make us confident in our ability to capitalize on a wide range of attractive projects as they continue to materialize across our operating footprint.”

“We also continue to enhance our financial flexibility with the strengthening of our balance sheet. On a basis of net debt, this is the strongest balance sheet the Company has had in many years, which not only offers us flexibility to continue to execute on projects in backlog and pursue new awards, but also position us to consider accretive acquisition opportunities, as well as exploring other opportunities to achieve the best return for our shareholders.”

Mr. Stauffer concluded, “Given the reopening of the US economy, the project opportunities we see on the horizon as a result, and our extremely strong balance sheet and financial position, we are confident in our ability to continue to generate growth in our profitability and maximizing shareholder value over the long-term.”

Consolidated Results for Second Quarter 2021 Compared to Second Quarter 2020

  • Contract revenues were 
    $145.9 million, down 20.6% as compared to 
    $183.7 million. The decrease was primarily driven by a reduction in project activity compared to the prior year in the marine segment and decreased production volumes in the concrete segment due to weather related impacts.
  • Gross profit was 
    $12.3 million, as compared to 
    $20.7 million. Gross profit margin was 8.4%, as compared to 11.3%. The decrease in gross profit dollars and percentage was primarily driven by the decreased activity and volumes, which negatively impacted revenue and contributed to an under recovery of indirect costs primarily related to decreased equipment utilization.
  • Selling, General, and Administrative expenses were 
    $13.7 million, as compared to 
    $16.5 million. As a percentage of total contract revenues, SG&A expenses increased 0.4%. The decrease in SG&A dollars was driven primarily by a decrease in bonus expense as compared to the prior year period.
  • Operating income was 
    $5.6 million as compared to 
    $4.1 million. The increase in operating income in the second quarter of 2021 reflects the 
    $6.8 million net gain on the 
    Tampa property sale.
  • EBITDA was 
    $12.1 million, representing an 8.3% EBITDA margin, as compared to EBITDA of 
    $11.1 million, or a 6.1% EBITDA margin. When adjusted for non-recurring items, adjusted EBITDA for the second quarter of 2021 was 
    $7.4 million, representing a 5.1% EBITDA margin. (Please see page 10 of this release for an explanation of EBITDA, Adjusted EBITDA and a reconciliation to the nearest GAAP measure).

Backlog

Backlog of work under contract as of 
June 30, 2021, was 
$394.4 million, which compares with backlog under contract as of 
June 30, 2020, of 
$528.4 million. The second quarter 2021 ending backlog was comprised of 
$170.2 million for the marine segment, and 
$224.2 million for the concrete segment. At the end of the second quarter 2021, the Company had approximately 
$2.0 billion worth of bids outstanding, including approximately 
$30 million on which it is the apparent low bidder or has been awarded contracts subsequent to the end of the second quarter of 2021, of which approximately 
$12 million pertains to the marine segment and approximately 
$18 million to the concrete segment.

“During the second quarter, we bid on approximately 
$2.0 billion of work and were successful on approximately 
$175 million of these bids,” stated  Robert Tabb
Orion Group Holding’s Executive Vice President and Chief Financial Officer. “This resulted in a 1.20 times book-to-bill ratio and a win rate of 8.8%. In the marine segment, we bid on approximately 
$1.0 billion during the second quarter 2021 and were successful on approximately 
$79 million, representing a win rate of 7.6% and a book-to-bill ratio of 1.24 times. In the concrete segment we bid on approximately 
$1.0 billion of work and were awarded approximately 
$96 million, representing a win rate of 10.1% and a book-to-bill ratio of 1.17 times.”

Backlog consists of projects under contract that have either (a) not been started, or (b) are in progress and not yet complete. The Company cannot guarantee that the revenue implied by its backlog will be realized, or, if realized, will result in earnings. Backlog can fluctuate from period to period due to the timing and execution of contracts. Given the typical duration of the Company’s projects, which generally range from three to nine months, the Company’s backlog at any point in time usually represents only a portion of the revenue it expects to realize during a twelve-month period.

Conference Call Details

Orion Group Holdings will host a conference call to discuss results for the second quarter 2021 at 
10:00 a.m. Eastern Time/
9:00 a.m. Central Time on 
Thursday, July 29, 2021. To listen to a live webcast of the conference call, or access the replay, visit the Calendar of Events page of the Investor Relations section of the website at www.oriongroupholdingsinc.com. To participate in the call, please dial (201) 493-6739 and ask for the Orion Group Holdings Conference Call.

About Orion Group Holdings

Orion Group Holdings, Inc., a leading specialty construction company serving the infrastructure, industrial and building sectors, provides services both on and off the water in the continental 
United States
Alaska
Canada and the 
Caribbean Basin through its marine segment and its concrete segment. The Company’s marine segment provides construction and dredging services relating to marine transportation facility construction, marine pipeline construction, marine environmental structures, dredging of waterways, channels and ports, environmental dredging, design, and specialty services. Its concrete segment provides turnkey concrete construction services including pour and finish, dirt work, layout, forming, rebar, and mesh across the light commercial, structural and other associated business areas. The Company is headquartered in 
Houston, Texas with regional offices throughout its operating areas.

Non-GAAP Financial Measures

This press release includes the financial measures “adjusted net income,” “adjusted earnings per share,” “EBITDA,” “Adjusted EBITDA” and “Adjusted EBITDA margin.” These measurements are “non-GAAP financial measures” under rules of the 
Securities and Exchange Commission, including Regulation G. The non-GAAP financial information may be determined or calculated differently by other companies. By reporting such non-GAAP financial information, the Company does not intend to give such information greater prominence than comparable GAAP financial information. Investors are urged to consider these non-GAAP measures in addition to and not in substitute for measures prepared in accordance with GAAP.

Adjusted net income and adjusted earnings per share are not an alternative to net income or earnings per share. Adjusted net income and adjusted earnings per share exclude certain items that management believes impairs a meaningful comparison of operating results. The company believes these adjusted financial measures are a useful adjunct to earnings calculated in accordance with GAAP because management uses adjusted net income available to common stockholders to evaluate the company’s operational trends and performance relative to other companies. Generally, items excluded, are one-time items or items whose timing or amount cannot be reasonably estimated. Accordingly, any guidance provided by the company generally excludes information regarding these types of items.

Orion Group Holdings defines EBITDA as net income before net interest expense, income taxes, depreciation and amortization. Adjusted EBITDA is calculated by adjusting EBITDA for certain items that management believes impairs a meaningful comparison of operating results. Adjusted EBITDA margin is calculated by dividing Adjusted EBITDA for the period by contract revenues for the period. The GAAP financial measure that is most directly comparable to EBITDA and Adjusted EBITDA is net income, while the GAAP financial measure that is most directly comparable to Adjusted EBITDA margin is operating margin, which represents operating income divided by contract revenues. EBITDA, Adjusted EBITDA and Adjusted EBITDA margin are used internally to evaluate current operating expense, operating efficiency, and operating profitability on a variable cost basis, by excluding the depreciation and amortization expenses, primarily related to capital expenditures and acquisitions, and net interest and tax expenses. Additionally, EBITDA, Adjusted EBITDA and Adjusted EBITDA margin provide useful information regarding the Company’s ability to meet future debt service and working capital requirements while providing an overall evaluation of the Company’s financial condition. In addition, EBITDA is used internally for incentive compensation purposes. The Company includes EBITDA, Adjusted EBITDA and Adjusted EBITDA margin to provide transparency to investors as they are commonly used by investors and others in assessing performance. EBITDA, Adjusted EBITDA and Adjusted EBITDA margin have certain limitations as analytical tools and should not be used as a substitute for operating margin, net income, cash flows, or other data prepared in accordance with generally accepted accounting principles in 
the United States, or as a measure of the Company’s profitability or liquidity.

The matters discussed in this press release may constitute or include projections or other forward-looking statements within the meaning of the Private Securities Litigation Reform Act of 1995, the provisions of which the Company is availing itself. Certain forward-looking statements can be identified by the use of forward-looking terminology, such as ‘believes’, ‘expects’, ‘may’, ‘will’, ‘could’, ‘should’, ‘seeks’, ‘approximately’, ‘intends’, ‘plans’, ‘estimates’, or ‘anticipates’, or the negative thereof or other comparable terminology, or by discussions of strategy, plans, objectives, intentions, estimates, forecasts, outlook, assumptions, or goals. In particular, statements regarding future operations or results, including those set forth in this press release, and any other statement, express or implied, concerning future operating results or the future generation of or ability to generate revenues, income, net income, gross profit, EBITDA, Adjusted EBITDA, Adjusted EBITDA margin, or cash flow, including to service debt, and including any estimates, forecasts or assumptions regarding future revenues or revenue growth, are forward-looking statements. Forward looking statements also include estimated project start date, anticipated revenues, and contract options which may or may not be awarded in the future. Forward looking statements involve risks, including those associated with the Company’s fixed price contracts that impacts profits, unforeseen productivity delays that may alter the final profitability of the contract, cancellation of the contract by the customer for unforeseen reasons, delays or decreases in funding by the customer, levels and predictability of government funding or other governmental budgetary constraints, the effects of the ongoing COVID-19 pandemic, and any potential contract options which may or may not be awarded in the future, and are at the sole discretion of award by the customer. Past performance is not necessarily an indicator of future results. In light of these and other uncertainties, the inclusion of forward-looking statements in this press release should not be regarded as a representation by the Company that the Company’s plans, estimates, forecasts, goals, intentions, or objectives will be achieved or realized. Readers are cautioned not to place undue reliance on these forward-looking statements, which speak only as of the date hereof. The Company assumes no obligation to update information contained in this press release whether as a result of new developments or otherwise.

Please refer to the Company’s Annual Report on Form 10-K, filed on 
March 2, 2021, which is available on its website at www.oriongroupholdingsinc.com or at the 
SEC’s website at www.sec.gov, for additional and more detailed discussion of risk factors that could cause actual results to differ materially from our current expectations, estimates or forecasts.

Orion Group Holdings, Inc. and Subsidiaries

Condensed Statements of Operations

(In Thousands, Except Share and Per Share Information)

(Unaudited)


Three months ended


Six months ended


June 30,


June 30,


2021


2020


2021


2020

Contract revenues


145,875


183,713


299,184


350,333

Costs of contract revenues


133,574


162,969


271,428


309,831

Gross profit


12,301


20,744


27,756


40,502

Selling, general and administrative expenses


13,715


16,512


28,345


32,381

Amortization of intangible assets


381


517


761


1,033

Gain on disposal of assets, net


(7,361)


(369)


(8,971)


(1,361)

Operating income


5,566


4,084


7,621


8,449

Other (expense) income:


Other income


72


39


109


136

Interest income


25


54


51


94

Interest expense


(2,943)


(1,169)


(3,983)


(2,571)

Other expense, net


(2,846)


(1,076)


(3,823)


(2,341)

Income before income taxes


2,720


3,008


3,798


6,108

Income tax (benefit) expense


(810)


980


(660)


1,357

Net income


$

3,530


$

2,028


$

4,458


$

4,751


Basic earnings per share


$

0.12


$

0.07


$

0.15


$

0.16

Diluted earnings per share


$

0.11


$

0.07


$

0.15


$

0.16

Shares used to compute income per share:


Basic


30,671,952


30,031,188


30,569,284


29,842,298

Diluted


30,702,151


30,031,188


30,601,669


29,842,298

Orion Group Holdings, Inc. and Subsidiaries

Selected Results of Operations

(In Thousands, Except Share and Per Share Information)

(Unaudited)


Three months ended June 30,


2021


2020


Amount


Percent


Amount


Percent


(dollar amounts in thousands)


Contract revenues


Marine segment


Public sector


$

44,667


69.9

%

$

59,820


65.2

%

Private sector


19,275


30.1

%


31,899


34.8

%

Marine segment total


$

63,942


100.0

%

$

91,719


100.0

%

Concrete segment


Public sector


$

6,500


7.9

%

$

12,022


13.1

%

Private sector


75,433


92.1

%


79,972


86.9

%

Concrete segment total


$

81,933


100.0

%

$

91,994


100.0

%

Total


$

145,875


$

183,713


Operating income (loss)


Marine segment


$

8,606


13.5

%

$

3,810


4.2

%

Concrete segment


(3,040)


(3.7)

%


274


0.3

%

Total


$

5,566


$

4,084


Six months ended June 30,


2021


2020


Amount


Percent


Amount


Percent


(dollar amounts in thousands)


Contract revenues


Marine segment


Public sector


$

86,336


63.4

%

$

113,331


63.8

%

Private sector


49,752


36.6

%


64,337


36.2

%

Marine segment total


$

136,088


100.0

%

$

177,668


100.0

%

Concrete segment


Public sector


$

11,279


6.9

%

$

28,074


16.3

%

Private sector


151,817


93.1

%


144,591


83.7

%

Concrete segment total


$

163,096


100.0

%

$

172,665


100.0

%

Total


$

299,184


$

350,333


Operating income


Marine segment


$

11,454


8.4

%

$

9,559


5.4

%

Concrete segment


(3,833)


(2.4)

%


(1,110)


(0.6)

%

Total


$

7,621


$

8,449


Orion Group Holdings, Inc. and Subsidiaries

Reconciliation of Adjusted Net Income (Loss)

(In thousands except per share information)

(Unaudited)


Three months ended


Six months ended


June 30,


June 30,


2021


2020


2021


2020

Net income


$

3,530


$

2,028


$

4,458


$

4,751

One-time charges and the tax effects:


ERP implementation


853


310


1,439


310

ISG initiative


369

Severance


38


72

Costs related to debt extinguishment


2,062


2,062


Net gain on 
Tampa property sale


(6,767)


(6,767)


Tax rate of 23% applied to one-time charges (1)


886


(80)


751


(173)

Total one-time charges and the tax effects


(2,966)


268


(2,515)


578

Federal and state tax valuation allowances


1,121


(968)


970


(1,631)

Adjusted net income


$

1,685


$

1,328


$

2,913


$

3,698

Adjusted EPS


$

0.05


$

0.04


$

0.10


$

0.12

______________________________

(1)


Items are taxed discretely using the Company’s blended tax rate.

Orion Group Holdings, Inc. and Subsidiaries

Adjusted EBITDA and Adjusted EBITDA Margin Reconciliations

(In Thousands, Except Margin Data)

(Unaudited)


Three months ended


Six months ended


June 30,


June 30,


2021


2020


2021


2020


Net income


$

3,530


$

2,028


$

4,458


$

4,751


Income tax (benefit) expense


(810)


980


(660)


1,357


Interest expense, net


2,918


1,115


3,932


2,477


Depreciation and amortization


6,429


7,004


12,915


13,896


EBITDA (1)


12,067


11,127


20,645


22,481


Stock-based compensation


1,245


1,167


1,628


1,629


ERP implementation


853


310


1,439


310


ISG initiative


369


Severance


38


72


Net gain on 
Tampa property sale


(6,767)


(6,767)


Adjusted EBITDA(2)


$

7,398


$

12,642


$

16,945


$

24,861


Operating income margin


3.8

%


2.2

%


2.5

%


2.4

%

Impact of other income (expense), net


%


%


%


%

Impact of depreciation and amortization


4.4

%


3.9

%


4.5

%


4.0

%

Impact of stock-based compensation


0.9

%


0.6

%


0.5

%


0.5

%

Impact of ERP implementation


0.6

%


0.2

%


0.5

%


0.1

%

Impact of ISG initiative


%


%


%


0.1

%

Impact of severance


%


%


%


%

Impact of net gain on 
Tampa property sale


(4.6)

%


%


(2.3)

%


%

Adjusted EBITDA margin(2)


5.1

%


6.9

%


5.7

%


7.1

%

_____________________________

(1)


EBITDA is a non-GAAP measure that represents earnings before interest, taxes, depreciation and amortization.

(2)


Adjusted EBITDA is a non-GAAP measure that represents EBITDA adjusted for stock-based compensation, ERP implementation, the ISG initiative, severance and the net gain on the 
Tampa property sale. Adjusted EBITDA margin is a non-GAAP measure calculated by dividing Adjusted EBITDA by contract revenues.

Orion Group Holdings, Inc. and Subsidiaries

Adjusted EBITDA and Adjusted EBITDA Margin Reconciliations by Segment

(In Thousands, Except Margin Data)

(Unaudited)


Marine


Concrete


Three months ended


Three months ended


June 30,


June 30,


2021


2020


2021


2020


Operating income (loss) (1)


8,606


3,810


(3,040)


274


Other income (expense), net


72


39


Depreciation and amortization


4,322


4,744


2,107


2,260


EBITDA (2)


13,000


8,593


(933)


2,534


Stock-based compensation


1,219


1,128


26


39


ERP implementation


379


155


474


155


ISG initiative


Severance


14


24


Net gain on 
Tampa property sale


(6,767)


Adjusted EBITDA(3)


$

7,831


$

9,890


$

(433)


$

2,752


Operating income margin


13.4

%


4.2

%


(3.7)

%


0.3

%

Impact of other income (expense), net


0.1

%


%


%


%

Impact of depreciation and amortization


6.8

%


5.2

%


2.6

%


2.5

%

Impact of stock-based compensation


1.9

%


1.2

%


%


%

Impact of ERP implementation


0.6

%


0.2

%


0.6

%


0.2

%

Impact of ISG initiative


%


%


%


%

Impact of severance


%


%


%


%

Impact of net gain on 
Tampa property sale


(10.6)

%


%


%


%

Adjusted EBITDA margin (3)


12.2

%


10.8

%


(0.5)

%


3.0

%


Marine


Concrete


Six months ended


Six months ended


June 30,


June 30,


2021


2020


2021


2020


Operating income (loss) (1)


11,454


9,559


(3,833)


(1,110)


Other income (expense), net


109


134


2


Depreciation and amortization


8,680


9,520


4,235


4,376


EBITDA (2)


20,243


19,213


402


3,268


Stock-based compensation


1,570


1,540


58


89


ERP implementation


655


155


784


155


ISG initiative


190


179


Severance


26


46


Net gain on 
Tampa property sale


(6,767)


Adjusted EBITDA(3)


$

15,701


$

21,124


$

1,244


$

3,737


Operating income margin


8.3

%


5.4

%


(2.3)

%


(0.5)

%

Impact of other income (expense), net


0.1

%


0.1

%


%


%

Impact of depreciation and amortization


6.4

%


5.4

%


2.6

%


2.5

%

Impact of stock-based compensation


1.2

%


0.9

%


%


0.1

%

Impact of ERP implementation


0.5

%


%


0.5

%


%

Impact of ISG initiative


%


0.1

%


%


0.1

%

Impact of severance


%


%


%


%

Impact of net gain on 
Tampa property sale


(5.0)

%


%


%


%

Adjusted EBITDA margin (3)


11.5

%


11.9

%


0.8

%


2.2

%

_____________________________

(1)


In connection with the preparation of the financial statements for the quarter ended 
June 30, 2021, the Company has identified and corrected certain immaterial errors in segment reporting for all periods presented. Specifically, certain corporate overhead costs previously recorded to the marine segment as part of operating income (loss) and allocated from the marine segment to the concrete segment below operating income in the other income (expense) line have been allocated from the marine segment to the concrete segment as part of the determination of operating income for each segment.

(2)


EBITDA is a non-GAAP measure that represents earnings before interest, taxes, depreciation and amortization.

(3)


Adjusted EBITDA is a non-GAAP measure that represents EBITDA adjusted for stock-based compensation, ERP implementation, the ISG initiative, severance and the net gain on the 
Tampa property sale. Adjusted EBITDA margin is a non-GAAP measure calculated by dividing Adjusted EBITDA by contract revenues.

Orion Group Holdings, Inc. and Subsidiaries

Condensed Statements of Cash Flows Summarized

(In Thousands)

(Unaudited)


Three months ended


Six months ended


June 30,


June 30,


2021


2020


2021


2020

Net income


$

3,530


$

2,028


$

4,458


$

4,751

Adjustments to remove non-cash and non-operating items


2,609


9,246


9,504


17,828

Cash flow from net income after adjusting for non-cash and non-operating items


6,139


11,274


13,962


22,579

Change in operating assets and liabilities (working capital)


(3,982)


6,347


(2,687)


10,495

Cash flows provided by operating activities


$

2,157


$

17,621


$

11,275


$

33,074

Cash flows provided by (used in) investing activities


$

19,690


$

(1,719)


$

20,462


$

(2,044)

Cash flows used in financing activities


$

(24,079)


$

(19,081)


$

(30,916)


$

(21,773)


Capital expenditures (included in investing activities above)


$

(3,097)


$

(2,283)


$

(4,715)


$

(5,036)

Orion Group Holdings, Inc. and Subsidiaries

Condensed Statements of Cash Flows

(In Thousands)

(Unaudited)


Six months ended June 30,


2021


2020

Cash flows from operating activities


Net income


$

4,458


$

4,751

Adjustments to reconcile net income to net cash used in operating activities:


Depreciation and amortization


11,313


12,311

Amortization of ROU operating leases


2,794


3,066

Amortization of ROU finance leases


1,602


1,585

Write-off of debt issuance costs upon debt extinguishment


790


Amortization of deferred debt issuance costs


429


286

Deferred income taxes


(81)


(99)

Stock-based compensation


1,628


1,629

Gain on disposal of assets, net


(8,971)


(1,361)

Allowance for credit losses


411

Change in operating assets and liabilities, net of effects of acquisitions:


Accounts receivable


5,147


23,645

Income tax receivable


(682)


(97)

Inventory


277


(172)

Prepaid expenses and other


337


900

Contract assets


9,159


5,050

Accounts payable


(3,754)


(23,680)

Accrued liabilities


(5,290)


2,818

Operating lease liabilities


(2,571)


(2,721)

Income tax payable


(538)


(296)

Contract liabilities


(4,772)


5,048

Net cash provided by operating activities


11,275


33,074

Cash flows from investing activities:


Proceeds from sale of property and equipment


24,737


1,749

Purchase of property and equipment


(4,715)


(5,036)

Contributions to CSV life insurance


(99)

Insurance claim proceeds related to property and equipment


440


1,342

Net cash provided by (used in) investing activities


20,462


(2,044)

Cash flows from financing activities:


Borrowings from Credit Facility


20,000


5,000

Payments made on borrowings from Credit Facility


(49,086)


(24,500)

Payments of finance lease liabilities


(1,675)


(1,858)

Payments related to tax withholding for stock-based compensation


(241)


(24)

Exercise of stock options


86


Net cash used in financing activities


(30,916)


(21,773)

Net change in cash, cash equivalents and restricted cash


821


9,257

Cash, cash equivalents and restricted cash at beginning of period


1,589


1,086

Cash, cash equivalents and restricted cash at end of period


$

2,410


$

10,343

Orion Group Holdings, Inc. and Subsidiaries

Condensed Balance Sheets

(In Thousands, Except Share and Per Share Information)


June 30,


December 31,


2021


2020


(Unaudited)


ASSETS


Current assets:


Cash and cash equivalents


$

2,410


1,589

Accounts receivable:


Trade, net of allowance for credit losses of 
$323 and 
$411, respectively


89,671


96,369

Retainage


38,388


36,485

Income taxes receivable


1,101


419

Other current


66,967


59,492

Inventory


2,102


1,548

Contract assets


23,112


32,271

Prepaid expenses and other


6,973


7,229

Total current assets


230,724


235,402

Property and equipment, net of depreciation


104,917


125,497

Operating lease right-of-use assets, net of amortization


16,204


18,874

Financing lease right-of-use assets, net of amortization


12,289


12,858

Inventory, non-current


4,839


6,455

Intangible assets, net of amortization


9,316


10,077

Deferred income tax asset


41


70

Other non-current


4,875


4,956

Total assets


$

383,205


$

414,189

LIABILITIES AND STOCKHOLDERS’ EQUITY


Current liabilities:


Current debt, net of issuance costs


$

6,139


$

4,344

Accounts payable:


Trade


44,189


48,252

Retainage


984


716

Accrued liabilities


83,638


84,637

Income taxes payable


101


639

Contract liabilities


28,363


33,135

Current portion of operating lease liabilities


4,395


4,989

Current portion of financing lease liabilities


2,085


3,901

Total current liabilities


169,894


180,613

Long-term debt, net of debt issuance costs


294


29,523

Operating lease liabilities


12,687


14,537

Financing lease liabilities


9,890


8,376

Other long-term liabilities


23,316


19,837

Deferred income tax liability


97


207

Interest rate swap liability


1,602

Total liabilities


216,178


254,695

Stockholders’ equity:


Preferred stock — 
$0.01 par value, 10,000,000 authorized, none issued


Common stock — 
$0.01 par value, 50,000,000 authorized, 31,617,998 and 31,171,804 issued;
30,906,767 and 30,460,573 outstanding at 
June 30, 2021 and 
December 31, 2020, respectively


316


312

Treasury stock, 711,231 shares, at cost, as of 
June 30, 2021 and 
December 31, 2020, respectively


(6,540)


(6,540)

Accumulated other comprehensive loss


(1,602)

Additional paid-in capital


185,793


184,324

Retained loss


(12,542)


(17,000)

Total stockholders’ equity


167,027


159,494

Total liabilities and stockholders’ equity


$

383,205


$

414,189


Orion Group Holdings Inc.
Francis Okoniewski, VP Investor Relations
(346) 616-4138
www.oriongroupholdingsinc.com

-OR-

INVESTOR RELATIONS COUNSEL:

The Equity Group Inc.
Fred Buonocore, CFA (212) 836-9607
Mike Gaudreau (212) 836-9620

Source: 
Orion Group Holdings, Inc.

ACCO Brands Corporation (ACCO) – PowerA, Economic Recovery Deliver Strong 2Q Results

Thursday, July 29, 2021

ACCO Brands Corporation (ACCO)
PowerA, Economic Recovery Deliver Strong 2Q Results

ACCO Brands Corporation designs, manufactures, sources, markets, and sells office products, academic supplies, and calendar products primarily in the United States, Canada, Northern Europe, Brazil, Australia, and Mexico. It operates through three segments: ACCO Brands North America, ACCO Brands EMEA, and ACCO Brands International. The company offers office products, such as stapling, binding and laminating equipment, and related consumable supplies, as well as shredders and whiteboards; and academic products, including notebooks, folders, decorative calendars, and stationery products. It also provides private label products, as well as business machine maintenance and repair services. The company offers its business, academic, and calendar product lines under the Artline, AT-A-GLANCE, Derwent, Esselte, Five Star, GBC, Hilroy, Leitz, Marbig, Mead, NOBO, Quartet, Rapid, Rexel, Swingline, Tilibra, Wilson Jones, and other brand names. In addition, it designs, sources, distributes, markets, and sells accessories for laptop and desktop computers, and tablets comprising security products; input devices, such as presenters, mice, and trackballs; ergonomic aids, including foot and wrist rests; docking stations; and other personal computers and tablet accessories under the Kensington, Microsaver, and ClickSafe brand names. The company sells its products to consumers and commercial end-users primarily through resellers, including traditional office supply resellers, wholesalers, mass merchandisers, and retailers, as well as directly to consumers through on-line and direct mail. ACCO Brands Corporation is headquartered in Lake Zurich, Illinois.

Joe Gomes, Senior Research Analyst, Noble Capital Markets, Inc.

Refer to the full report for the price target, fundamental analysis, and rating.

    2Q21 Operating Results. Revenue increased 41.1% to $517.8 million. Consensus was $474 million and we had forecast $465 million. Adjusted EPS was $0.43, compared to $0.18 last year. We had forecast adjusted EPS of $0.29 and consensus was $0.26.

    North America.  Revenue of $295 million rose 27% with PowerA adding $41 million. Comparable sales rose 8% y-o-y to $251 million. Commercial product sales were up significantly as offices reopened while back-to-school sales came in as expected. Adjusted op. inc. was up 32% to $60 million. Higher volume and lower reserves were partially offset by higher logistics and commodity costs and a more normal …


This Company Sponsored Research is provided by Noble Capital Markets, Inc., a FINRA and S.E.C. registered broker-dealer (B/D).

*Analyst certification and important disclosures included in the full report. NOTE: investment decisions should not be based upon the content of this research summary.  Proper due diligence is required before making any investment decision. 

Great Bear Resources Ltd. (GTBAF)(GBR:CA) – Phase 2 Drilling Expected to Commence in August

Thursday, July 29, 2021

Great Bear Resources Ltd. (GTBAF)(GBR:CA)
Phase 2 Drilling Expected to Commence in August

Noble Capital Markets research on Great Bear Resources is published under ticker symbols GTBAF and GBR:CA. The price target is in USD and based on ticker symbol GTBAF. Great Bear Resources Ltd is a gold exploration company. It explores for mineral properties in the Red Lake District in Ontario, Canada. Its property portfolio includes Great Bear’s Red Lake Properties with the flagship Dixie project, Pakwash property, and Sobel property.

Mark Reichman, Senior Research Analyst of Natural Resources, Noble Capital Markets, Inc.

Refer to the full report for the price target, fundamental analysis, and rating.

    Completion of Phase 1 drilling. Since May 2019, Great Bear has completed 440 drill holes, representing 222,500 meters of drilling, at the LP Fault. The company’s Phase 1 drill program is largely complete to an average of 450 meters depth over ~4 kilometers of strike length. Of the 440 drill holes, results for 109 remaining are expected to be released during the next several months. The company expects to publish a maiden mineral resource estimate by the end of the first quarter of 2022. In total, Great Bear has completed 630 drill holes into all four gold zones since drilling commenced in the summer of 2017.

    Phase 2 expected to commence in August.  Great Bear expects to begin Phase 2 drilling in the second week of August. The program will include expansion drilling of the LP Fault below 450 meters depth and along strike, additional infill drilling of the upper 450 meters of the LP Fault, expansion and infill drilling of the Hinge, Limb, and Arrow zones, and testing of new regional targets …


This Company Sponsored Research is provided by Noble Capital Markets, Inc., a FINRA and S.E.C. registered broker-dealer (B/D).

*Analyst certification and important disclosures included in the full report. NOTE: investment decisions should not be based upon the content of this research summary.  Proper due diligence is required before making any investment decision. 

Release – Comstock Forms Joint Venture with Lakeview Energy


Comstock Forms Joint Venture with Lakeview Energy


Acquires 50% Stake in 200,000 Pound Per Day Hemp Extraction, Remediation, and Refinement Facility

VIRGINIA CITY, NEVADA, July 29, 2021 – Comstock Mining Inc. (NYSE: LODE) (“Comstock” and the “Company”) today announced the execution of a series of agreements with Lakeview Energy LLC (“Lakeview”) and its subsidiaries, pursuant to which the Company acquired 50% of the equity of Lakeview’s subsidiary, LP Biosciences LLC (“LPB”), and agreed to provide the financing needed to retrofit LPB’s pre-existing industrial scale solvent extraction and valorization facility in Merrill, Iowa (“LPB Facility”), for the production of an array of wholesale products from up to 200,000 pounds per day of industrial hemp. Comstock issued 3,500,000 restricted shares of its common stock to LPB in connection with its acquisition and financing commitments, and simultaneously acquired 100% of MANA Corporation (“MANA”), an industrial hemp technology development, marketing, and management company, for 4,200,000 restricted shares of Comstock common stock.

Industrial Scale Infrastructure

Industrial hemp is an extraordinary natural resource with tens of thousands of known applications, including food, feed, fuel, and fiber, and an array of emerging applications in batteries, bioplastics, and other renewable alternatives to fossil fuel derived products. However, hemp’s ability to produce over 400 natural phytochemicals, such as cannabidiol (“CBD”) and cannabigerol (“CBG”), has recently garnered significant attention as some of those chemicals are seen to have compelling potential in health and wellness applications. The corresponding green rush propelled global demand and sales of industrial hemp products to an estimated $1.9 billion as of 2020, and the industry is expected to grow to $6.9 billion worldwide by 2025, according to Hemp Industry Daily.

“The processing infrastructure needed to achieve those aspirations does not exist today at the scales and sophistication expected of mature supply chains for comparable commodities,” said MANA’s Chief Executive Officer, William McCarthy. “The absence of large scale capacity represents the hemp industry’s most significant bottleneck today. MANA is addressing that deficiency by acquiring and partnering with experienced agriproducts management teams and pre-existing industrial scale facilities in adjacent agricultural markets. We are excited to do so today with Comstock, Lakeview, and the LPB Facility, and we’re looking forward to making a market leading contribution to the debottlenecking and evolution of the industry.”

Mature Agriproducts Management

Lakeview is an experienced agriproducts management company that owns and operates three renewable fuels facilities, including two 55 million gallon dry mill corn ethanol facilities located in Ohio and Iowa, and a 10 million gallon per year biodiesel production facility located in Missouri. Importantly, LPB’s LPB Facility is ideally co-located with Lakeview’s ethanol facility in Iowa, where the two facilities can exploit operational and other synergies to maximize throughput, profitability, and cash flow. Comstock’s and MANA’s agreements with Lakeview call for Lakeview to provide construction, operating, administrative, logistics, commodities, risk management and other services to LPB as the parties work together to build, operate and grow the LPB Facility. MANA additionally agreed to provide a suite of complimentary technology, marketing and other management services, with a focus on acquiring and using pre-existing and new feedstock and offtake arrangements to fill the LPB Facility.

“Industrial hemp has remarkable potential in several important respects, including its potential for new jobs and stimulating economic, environmental and social value creation in our community,” said Jim Galvin, Lakeview’s Chief Executive Officer. “We’re pleased to partner with Comstock and MANA as we upgrade and use the LPB Facility to provide comprehensive hemp extraction, remediation, and refinement services at scales that are currently unheard of in the hemp industry.”

Industry Leading Scale, Quality, Compliance, and Flexibility

Comstock’s Executive Chairman and Chief Executive Officer, Corrado DeGasperis, added: “We are proud to have assembled a world class asset with a team of industry veterans, process engineers, and partners to rapidly retrofit and commence operations with the LPB Facility, thereby setting a global standard for quality, compliance, consistency, flexibility and speed at an extraordinary scale. Once retrofits are complete in mid-2022, the LPB Facility will generate significant free cash flow by servicing the most astute, demanding, and rapidly growing buyers of wholesale hemp products with custom tailored solutions.”

The LPB Facility is conservatively expected to scale up to its initial nameplate capacity exceeding 200,000 pounds per day and 36,500 tons per year of industrial hemp over its first three years of operations, as it extracts, remediates, and refines oil from industrial hemp to generate annualized revenues exceeding $53,000,000, $154,000,000, and $409,000,000 per year during LPB’s first, second, and third full years of operations, respectively, as shown in the following excerpt from LPB’s internal projections:

Ecosystem of Strategic Feedstocks, Processes and Products

DeGasperis concluded: “Comstock is focused on the rapid and simultaneous maximization of financial, natural, and social impact, in large part by building an ecosystem of strategic extraction and valorization facilities with complimentary feedstocks and products. In this example, the LPB Facility’s revenue estimates are based only on the oil fraction of industrial hemp, which corresponds to a small portion of total feedstock biomass. The rest of that biomass is mostly comprised of cellulose with many known co-product applications, as well as some very exciting new applications that we are actively evaluating for use in our existing and planned new decarbonization efforts.”

About Comstock Mining Inc.

Comstock Mining Inc. (NYSE: LODE) (the “Company”) is an emerging innovator and leader in the sustainable extraction, valorization, and production of scarce natural resources, with a focus on high value strategic materials that are essential to meeting the rapidly increasing global demand for clean energy, carbon-neutrality, and natural products. To learn more, please visit www.comstockmining.com.

Forward-Looking Statements

This press release and any related calls or discussions may include forward-looking statements within the meaning of Section 27A of the Securities Act of 1933, as amended, and Section 21E of the Securities Exchange Act of 1934, as amended. All statements, other than statements of historical facts, are forward-looking statements. The words “believe,” “expect,” “anticipate,” “estimate,” “project,” “plan,” “should,” “intend,” “may,” “will,” “would,” “potential” and similar expressions identify forward-looking statements, but are not the exclusive means of doing so. Forward-looking statements include statements about matters such as: consummation of all pending transactions; project, asset or Company valuations; future industry market conditions; future explorations, acquisitions, investments and asset sales; future performance of and closings under various agreements; future changes in our exploration activities; future estimated mineral resources; future prices and sales of, and demand for, our products; future operating margins; available resources; environmental conservation outcomes; future impacts of land entitlements and uses; future permitting activities and needs therefor; future production capacity and operations; future operating and overhead costs; future capital expenditures and their impact on us; future impacts of operational and management changes (including changes in the board of directors); future changes in business strategies, planning and tactics and impacts of recent or future changes; future employment and contributions of personnel, including consultants; future land sales, investments, acquisitions, joint ventures, strategic alliances, business combinations, operational, tax, financial and restructuring initiatives; the nature and timing of and accounting for restructuring charges and derivative liabilities and the impact thereof; contingencies; future environmental compliance and changes in the regulatory environment; future offerings of equity or debt securities; asset sales and associated costs; future working capital, costs, revenues, business opportunities, debt levels, cash flows, margins, earnings and growth. These statements are based on assumptions and assessments made by our management in light of their experience and their perception of historical and current trends, current conditions, possible future developments and other factors they believe to be appropriate. Forward-looking statements are not guarantees, representations or warranties and are subject to risks and uncertainties, many of which are unforeseeable and beyond our control and could cause actual results, developments and business decisions to differ materially from those contemplated by such forward-looking statements. Some of those risks and uncertainties include the risk factors set forth in our filings with the SEC and the following: counterparty risks; capital markets’ valuation and pricing risks; adverse effects of climate changes or natural disasters; global economic and capital market uncertainties; the speculative nature of gold or mineral exploration, including risks of diminishing quantities or grades of qualified resources; operational or technical difficulties in connection with exploration or mining activities; contests over title to properties; potential dilution to our stockholders from our stock issuances and recapitalization and balance sheet restructuring activities; potential inability to comply with applicable government regulations or law; adoption of or changes in legislation or regulations adversely affecting businesses; permitting constraints or delays; decisions regarding business opportunities that may be presented to, or pursued by, us or others; the impact of, or the non-performance by parties under agreements relating to, acquisitions, joint ventures, strategic alliances, business combinations, asset sales, leases, options and investments to which we may be party; changes in the United States or other monetary or fiscal policies or regulations; interruptions in production capabilities due to capital constraints; equipment failures; fluctuation of prices for gold or certain other commodities (such as silver, zinc, cyanide, water, diesel fuel and electricity); changes in generally accepted accounting principles; adverse effects of terrorism and geopolitical events; potential inability to implement business strategies; potential inability to grow revenues; potential inability to attract and retain key personnel; interruptions in delivery of critical supplies, equipment and raw materials due to credit or other limitations imposed by vendors or others; assertion of claims, lawsuits and proceedings; potential inability to satisfy debt and lease obligations; potential inability to maintain an effective system of internal controls over financial reporting; potential inability or failure to timely file periodic reports with the SEC; potential inability to list our securities on any securities exchange or market; inability to maintain the listing of our securities; and work stoppages or other labor difficulties. Occurrence of such events or circumstances could have a material adverse effect on our business, financial condition, results of operations or cash flows or the market price of our securities. All subsequent written and oral forward-looking statements by or attributable to us or persons acting on our behalf are expressly qualified in their entirety by these factors. Except as may be required by securities or other law, we undertake no obligation to publicly update or revise any forward-looking statements, whether as a result of new information, future events, or otherwise.

Neither this press release nor any related calls or discussions constitutes an offer to sell, the solicitation of an offer to buy or a recommendation with respect to any securities of the Company, the fund or any other issuer.

Contact Information    
Comstock Mining Inc.

P.O. Box 1118

Virginia City, NV 89440

www.comstockmining.com

Corrado De Gasperis

Executive Chairman & CEO

Tel (775) 847-4755

degasperis@comstockmining.com

Zach Spencer

Director of External Relations

Tel (775) 847-5272 Ext.151

questions@comstockmining.com