Comtech Telecommunications Corp. Awarded Multi-Million Dollar Contract for WAN Optimization Equipment


Comtech Telecommunications Corp. Awarded Multi-Million Dollar Contract for WAN Optimization Equipment


Providing simplified operation, easy deployment, and mitigation of satellite delay

MELVILLE, N.Y.–(BUSINESS WIRE)–Jul. 21, 2021– 
July 21, 2021— 
Comtech Telecommunications Corp. (NASDAQ: CMTL), a world leader in next-generation 911 emergency systems and secure wireless communications technologies, announced today, that during its fourth quarter of fiscal 2021, its subsidiary 
Comtech EF Data Corp., a leading provider of satellite communications equipment (together “Comtech”), was awarded a multi-million dollar order for WAN optimization equipment from a leading system integrator in 
South Asia. The equipment will be utilized by a 
Ministry of Defense (“MoD”) in the region.

The order is for the supply of FX-6020c and FX-5020c advanced network accelerators, using patented Turbostreaming© technology. The products will support a satellite infrastructure that complements a fiber network and provides backup communications. The Layer 2 transparent forwarding (“virtual wire”) traffic processing design, combined with a terrestrial-like communication user experience and throughput over satellite, enables the FX Series products to provide simplified operation, easy deployments and mitigation of satellite delay.

“We are honored to contribute to the modernization of this MoD’s communication network with cutting edge technology,” said  Fred Kornberg, Chairman of the Board and Chief Executive Officer of 
Comtech Telecommunications Corp. “Our WAN optimization products will replace an incumbent’s technology, which is a testament to our ability to deliver high performance, innovative and competitive solutions.”

Comtech Telecommunications Corp. is a leader in the global communications market headquartered in 
Melville, New York and its subsidiary 
Comtech EF Data Corp. is based in 
Chandler, Arizona. With a passion for customer success, 
Comtech designs, produces and markets advanced secure wireless solutions to more than 1,000 customers in more than 100 countries. For more information, please visit www.comtechtel.com and www.comtechefdata.com.

Certain information in this press release contains statements that are forward-looking in nature and involve certain significant risks and uncertainties. Actual results could differ materially from such forward-looking information. The Company’s 
Securities and Exchange Commission filings identify many such risks and uncertainties. Any forward-looking information in this press release is qualified in its entirety by the risks and uncertainties described in such 
Securities and Exchange Commission filings.

Product Media Contact:
Toni Lee Rudnicki, Senior Vice President, Marketing

Comtech EF Data Corp.
240-686-2127
tlrudnicki@comtechefdata.com

Corporate Contact:
Michael D. Porcelain, President and Chief Operating Officer

Comtech Telecommunications Corp.
631-962-7000
info@comtechtel.com

Source: 
Comtech Telecommunications Corp.

Today’s Drug Policies are Part of a Long History


Image Credit: Ignacio Ferre Pérez (Flickr)


When Did Humans Start Experimenting With Alcohol and Drugs?


Humans constantly alter the world. We burn fields, turn forests into farms, and breed plants and animals. But humans don’t just reshape our external world – we engineer our internal worlds, and reshape our minds.

One way we do this is by upgrading our mental “software”, so to speak, with myths, religion, philosophy and psychology. The other is to change our mental hardware – our brains. And we do that with chemistry.

Today, humans use thousands of psychoactive compounds to alter our experience of the world. Many derive from plants and fungi, others we manufacture. Some, like coffee and tea, increase alertness; others, like alcohol and opiates, decrease it.Psychiatric drugs affect mood, while psychedelics alter reality.

We alter brain chemistry for all kinds of reasons, using substances recreationally, socially, medicinally, and ritually. Wild animals sometimes eat fermented fruit, but there’s little evidence that they eat psychoactive plants. We’re unusual animals in our enthusiasm for getting drunk and high. But when, where and why did it all start?


High on Life in the Pleistocene

Given humanity’s love of drugs and alcohol, you might assume getting high is an ancient, even prehistoric tradition. Some researchers have suggested prehistoric cave paintings were made by humans experiencing altered states of consciousness. Others, perhaps inspired more by hallucinogens than hard evidence, suggest that drugs triggered the evolution of human consciousness. Yet there’s surprisingly little archaeological evidence for prehistoric drug use.

African hunter-gathers – Bushmen, Pygmies and the Hadzabe people – likely live their lives in ways similar to ancestral human cultures. The most compelling evidence for the use of drugs by such early humans is a potentially hallucinogenic plant, kaishe, used by Bushmen healers, which supposedly makes people “go mad for a while”. Yet how much Bushmen historically used drugs is debated, and otherwise, there’s little evidence for drug use in hunter-gatherers.

The implication is that, despite Africa’s diverse plants and fungi, early humans used drugs rarely, maybe to induce trances during rituals, if at all. Perhaps their lifestyle meant they rarely felt the need for escape. Exercise, sunlight, nature, time with friends and family – they’re powerful antidepressants. Drugs are also dangerous; just as you shouldn’t drive drunk, it’s risky to get high when lions lurk in the bush, or a hostile tribe waits one valley over.

Out of Africa

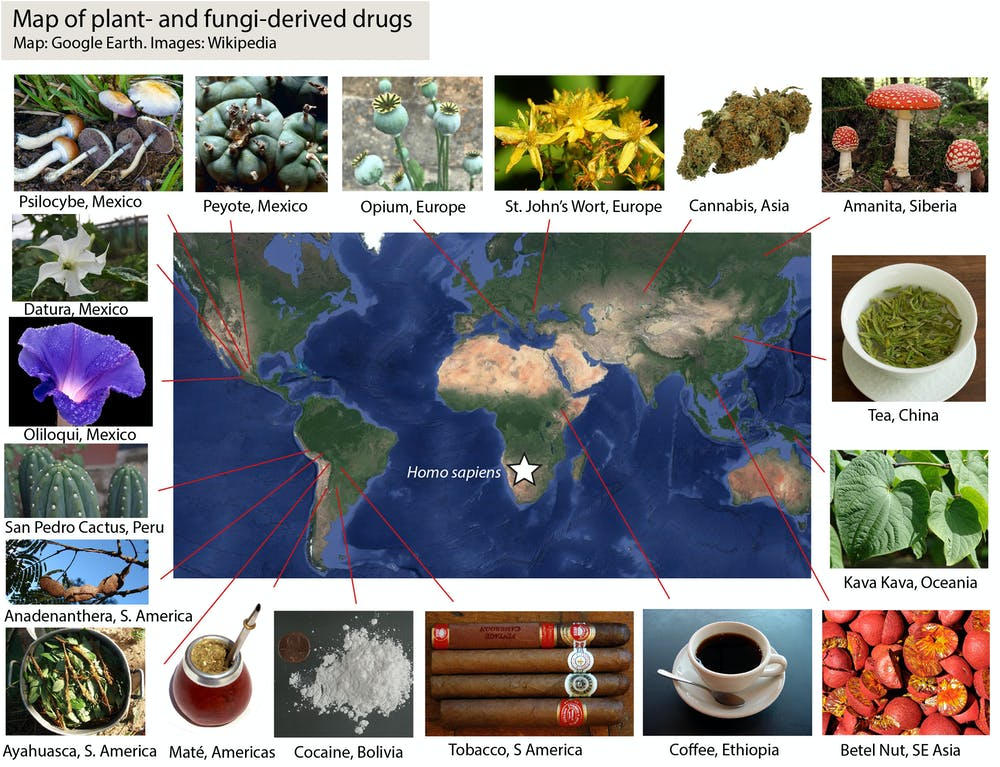
Migrating out of Africa 100,000 years ago, humans explored new lands and encountered new substances. People discovered opium poppies in the Mediterranean, and cannabis and tea in Asia.


Author Provided Map


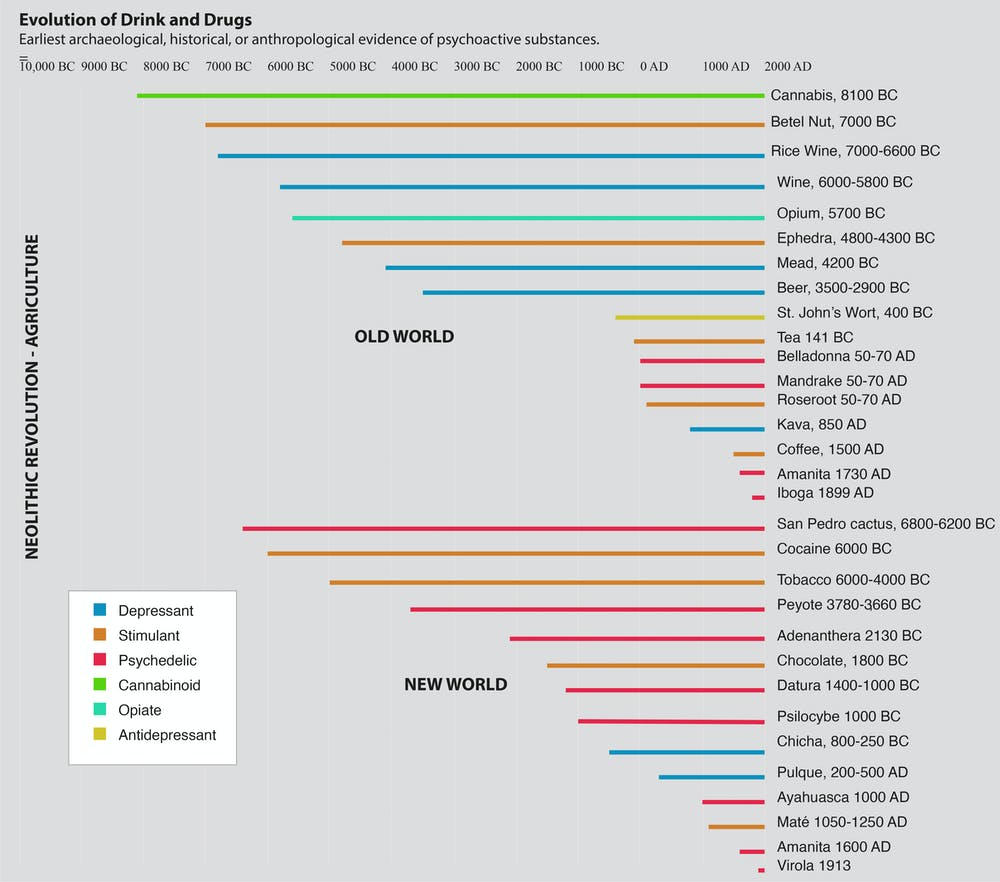
Archaeologists have found evidence of opium use in Europe by 5,700 BC. Cannabis seeds appear in archaeological digs at 8,100 BC in Asia, and the ancient Greek historian Herodotus reported Scythians getting high on weed in 450 BC. Tea was brewed in China by 100 BC.

It’s possible our ancestors experimented with substances before the archaeological evidence suggests. Stones and pottery preserve well, but plants and chemicals decay quickly. For all we know, Neanderthals could have been the first to smoke pot. But archaeology suggests the discovery and intensive use of psychoactive substances mostly happened late, after the Neolithic Revolution in 10,000 BC, when we invented farming and civilization.


Evidence suggests human drug use came after the Neolithic Revolution, Author provided

The American Psychonauts

When hunters trekked across the Bering Land Bridge 30,000 years ago into Alaska and headed south, they found a chemical cornucopia. Here, the hunters discovered tobacco, coca and maté. But for some reason, indigenous Americans were especially fascinated with psychedelics.

American psychedelics included peyote cactus, San Pedro cactus, morning-glory, Datura, Salvia, Anadenanthera, Ayahuasca, and over 20 species of psychoactive mushrooms. It was a pre-Columbian Burning Man. Indigenous Americans also invented the nasal administration of tobacco and hallucinogens. They were the first to snort drugs – a practice Europeans later borrowed.


 A Mixtec Codex showing the ceremonial use of mushrooms. British Museum, CC BY-NC-SA

This American psychedelic culture is ancient. Peyote buttons have been carbon-dated to 4,000 BC, while Mexican mushroom statues hint at Psilocybe use in 500 BC. A 1,000 year-old stash found in Bolivia contained cocaine, Anadenanthera and ayahuasca – and must’ve been one hell of a trip.

Inventing Alcohol

A huge step in the evolution of debauchery was the invention of agriculture because farming made booze possible. It created a surplus of sugars and starches which, mashed and left to ferment, magically transformed into potent brews.

Humans invented alcohol many times independently. The oldest booze dates to 7,000 BC, in China. Wine was fermented in the Caucasus in 6,000 BC; Sumerians brewed beer in 3,000 BC. In the Americas, Aztecs made pulque from the same agaves used today for tequila; Incas brewed chicha, a corn beer.

While in America, psychedelics appear to have been particularly important, Eurasian and African civilizations seem to have preferred alcohol. Wine was central to ancient Greek and Roman cultures, was served at Plato’s Symposium and at the Last Supper, and remains incorporated in the Jewish Seder and Christian communion rituals.


Civilization and Intoxication

Archaeology suggests alcohol and drugs date back millennia to early agricultural societies. But there’s little evidence early hunter-gatherers used them. That implies something about agricultural societies and the civilizations they gave rise to promoted substance use. But why?

It’s possible large civilizations simply drive innovation of all kinds: in ceramics, textiles, metals – and psychoactive substances. Perhaps alcohol and drugs also promoted civilization – drinking can help people socialize, altered perspectives encourage creativity, and caffeine makes us productive. And it may just be safer to get drunk or high in a city than the savannah.

A darker possibility is that psychoactive substance use developed in response to civilization’s ills. Large societies create large problems – wars, plagues, inequalities in wealth and power – against which individuals are relatively powerless. Perhaps when people couldn’t change their circumstances, they decided to change their minds.


This article was republished with permission from The Conversation, a news site
dedicated to sharing ideas from academic experts. It represents the
research-based findings and opinions of 
Nicholas R. Longrich Senior
Lecturer in Evolutionary Biology and Paleontology, University of Bath.


Suggested
Reading:


Will Federal Law Surrounding Cannabis be Changed?


Cannabis Customers Served by Ice Cream Truck Delivery Model


The NFL and Big Companies are Changing their Thinking on Cannabis


Robotics and AI are being Tapped by Cannabis Growers


Stay up to date. Follow us:


Virtual Roadshow with TAAL Distributed Information Technologies (TAALF) President Chris Naprawa


TAAL Distributed Information Technologies President Chris Naprawa makes a formal corporate presentation. Afterwards, he is joined by Noble Capital Markets Senior Research Analyst Joe Gomes for a Q & A session featuring questions asked by the live audience throughout the event.

Research, News, and Advanced Market Data on TAALF (OTCQX)


Register for TAAL’s Bi-Weekly Newsletter


Information on upcoming live virtual roadshows

About TAAL Distributed Information Technologies Inc.

TAAL Distributed Information Technologies Inc. delivers value-added blockchain services, providing professional-grade, highly scalable blockchain infrastructure and transactional platforms to support businesses building solutions and applications upon the BitcoinSV platform, and developing, operating, and managing distributed computing systems for enterprise users.

Todays Drug Policies are Part of a Long History


Image Credit: Ignacio Ferre Pérez (Flickr)


When Did Humans Start Experimenting With Alcohol and Drugs?


Humans constantly alter the world. We burn fields, turn forests into farms, and breed plants and animals. But humans don’t just reshape our external world – we engineer our internal worlds, and reshape our minds.

One way we do this is by upgrading our mental “software”, so to speak, with myths, religion, philosophy and psychology. The other is to change our mental hardware – our brains. And we do that with chemistry.

Today, humans use thousands of psychoactive compounds to alter our experience of the world. Many derive from plants and fungi, others we manufacture. Some, like coffee and tea, increase alertness; others, like alcohol and opiates, decrease it.Psychiatric drugs affect mood, while psychedelics alter reality.

We alter brain chemistry for all kinds of reasons, using substances recreationally, socially, medicinally, and ritually. Wild animals sometimes eat fermented fruit, but there’s little evidence that they eat psychoactive plants. We’re unusual animals in our enthusiasm for getting drunk and high. But when, where and why did it all start?


High on Life in the Pleistocene

Given humanity’s love of drugs and alcohol, you might assume getting high is an ancient, even prehistoric tradition. Some researchers have suggested prehistoric cave paintings were made by humans experiencing altered states of consciousness. Others, perhaps inspired more by hallucinogens than hard evidence, suggest that drugs triggered the evolution of human consciousness. Yet there’s surprisingly little archaeological evidence for prehistoric drug use.

African hunter-gathers – Bushmen, Pygmies and the Hadzabe people – likely live their lives in ways similar to ancestral human cultures. The most compelling evidence for the use of drugs by such early humans is a potentially hallucinogenic plant, kaishe, used by Bushmen healers, which supposedly makes people “go mad for a while”. Yet how much Bushmen historically used drugs is debated, and otherwise, there’s little evidence for drug use in hunter-gatherers.

The implication is that, despite Africa’s diverse plants and fungi, early humans used drugs rarely, maybe to induce trances during rituals, if at all. Perhaps their lifestyle meant they rarely felt the need for escape. Exercise, sunlight, nature, time with friends and family – they’re powerful antidepressants. Drugs are also dangerous; just as you shouldn’t drive drunk, it’s risky to get high when lions lurk in the bush, or a hostile tribe waits one valley over.

Out of Africa

Migrating out of Africa 100,000 years ago, humans explored new lands and encountered new substances. People discovered opium poppies in the Mediterranean, and cannabis and tea in Asia.


Author Provided Map


Archaeologists have found evidence of opium use in Europe by 5,700 BC. Cannabis seeds appear in archaeological digs at 8,100 BC in Asia, and the ancient Greek historian Herodotus reported Scythians getting high on weed in 450 BC. Tea was brewed in China by 100 BC.

It’s possible our ancestors experimented with substances before the archaeological evidence suggests. Stones and pottery preserve well, but plants and chemicals decay quickly. For all we know, Neanderthals could have been the first to smoke pot. But archaeology suggests the discovery and intensive use of psychoactive substances mostly happened late, after the Neolithic Revolution in 10,000 BC, when we invented farming and civilization.


Evidence suggests human drug use came after the Neolithic Revolution, Author provided

The American Psychonauts

When hunters trekked across the Bering Land Bridge 30,000 years ago into Alaska and headed south, they found a chemical cornucopia. Here, the hunters discovered tobacco, coca and maté. But for some reason, indigenous Americans were especially fascinated with psychedelics.

American psychedelics included peyote cactus, San Pedro cactus, morning-glory, Datura, Salvia, Anadenanthera, Ayahuasca, and over 20 species of psychoactive mushrooms. It was a pre-Columbian Burning Man. Indigenous Americans also invented the nasal administration of tobacco and hallucinogens. They were the first to snort drugs – a practice Europeans later borrowed.


 A Mixtec Codex showing the ceremonial use of mushrooms. British Museum, CC BY-NC-SA

This American psychedelic culture is ancient. Peyote buttons have been carbon-dated to 4,000 BC, while Mexican mushroom statues hint at Psilocybe use in 500 BC. A 1,000 year-old stash found in Bolivia contained cocaine, Anadenanthera and ayahuasca – and must’ve been one hell of a trip.

Inventing Alcohol

A huge step in the evolution of debauchery was the invention of agriculture because farming made booze possible. It created a surplus of sugars and starches which, mashed and left to ferment, magically transformed into potent brews.

Humans invented alcohol many times independently. The oldest booze dates to 7,000 BC, in China. Wine was fermented in the Caucasus in 6,000 BC; Sumerians brewed beer in 3,000 BC. In the Americas, Aztecs made pulque from the same agaves used today for tequila; Incas brewed chicha, a corn beer.

While in America, psychedelics appear to have been particularly important, Eurasian and African civilizations seem to have preferred alcohol. Wine was central to ancient Greek and Roman cultures, was served at Plato’s Symposium and at the Last Supper, and remains incorporated in the Jewish Seder and Christian communion rituals.


Civilization and Intoxication

Archaeology suggests alcohol and drugs date back millennia to early agricultural societies. But there’s little evidence early hunter-gatherers used them. That implies something about agricultural societies and the civilizations they gave rise to promoted substance use. But why?

It’s possible large civilizations simply drive innovation of all kinds: in ceramics, textiles, metals – and psychoactive substances. Perhaps alcohol and drugs also promoted civilization – drinking can help people socialize, altered perspectives encourage creativity, and caffeine makes us productive. And it may just be safer to get drunk or high in a city than the savannah.

A darker possibility is that psychoactive substance use developed in response to civilization’s ills. Large societies create large problems – wars, plagues, inequalities in wealth and power – against which individuals are relatively powerless. Perhaps when people couldn’t change their circumstances, they decided to change their minds.


This article was republished with permission from The Conversation, a news site
dedicated to sharing ideas from academic experts. It represents the
research-based findings and opinions of 
Nicholas R. Longrich Senior
Lecturer in Evolutionary Biology and Paleontology, University of Bath.


Suggested
Reading:


Will Federal Law Surrounding Cannabis be Changed?


Cannabis Customers Served by Ice Cream Truck Delivery Model


The NFL and Big Companies are Changing their Thinking on Cannabis


Robotics and AI are being Tapped by Cannabis Growers


Stay up to date. Follow us:


Release – Aurania Reports that Drilling at Tsenken N1 Provides Evidence of a Link with the Tiria-Shimpia Target


Aurania Reports that Drilling at Tsenken N1 Provides Evidence of a Link with the Tiria-Shimpia Target


Toronto, Ontario, July 21, 2021 – Aurania Resources Ltd. (TSXV: ARU) (OTCQB: AUIAF) (Frankfurt: 20Q) (“Aurania” or the “Company”) reports that review of drill core shows that the fault system which links the Tsenken target with the Tiria-Shimpia target, moved periodically throughout the development of the sedimentary basin, providing a pumping mechanism for metal-bearing fluids that deposited sediment-hosted zinc-silver at Tiria-Shimpia and copper-silver at Tsenken.  Further scout drilling at Tsenken N1 is focusing on sediment-hosted copper-silver adjacent to this fault system that extends 45 kilometres from the copper area in the south to the zinc zone in the north in the central part of the Company’s Lost Cities – Cutucu Project (“Project”) in southeastern Ecuador.

Professor Gregor Borg, an expert on sediment-hosted copper systems, who has worked both in the Central African Copperbelt and the European Kupferschiefer, recently visited site to review the exploration programs and drill core from Tsenken and Tiria-Shimpia.

Professor Borg commented, “I have not seen many mineralized systems that extend 45 kilometres along a fault system as we see in the central part of Aurania’s Lost Cities Project.  The change from copper-centric in the Tsenken area to zinc-rich in the Tiria-Shimpia target is consistent metal zoning that is evident in the Kupferschiefer.  I came away from my second review of Aurania’s sedimentary copper exploration program as convinced as I was on my first visit that the red-bed basin is highly fertile and has very good potential for sediment-hosted copper. We optimized some of the concepts on the basis of the features that we saw in the drill core, and I have encouraged the exploration team to keep drilling.”

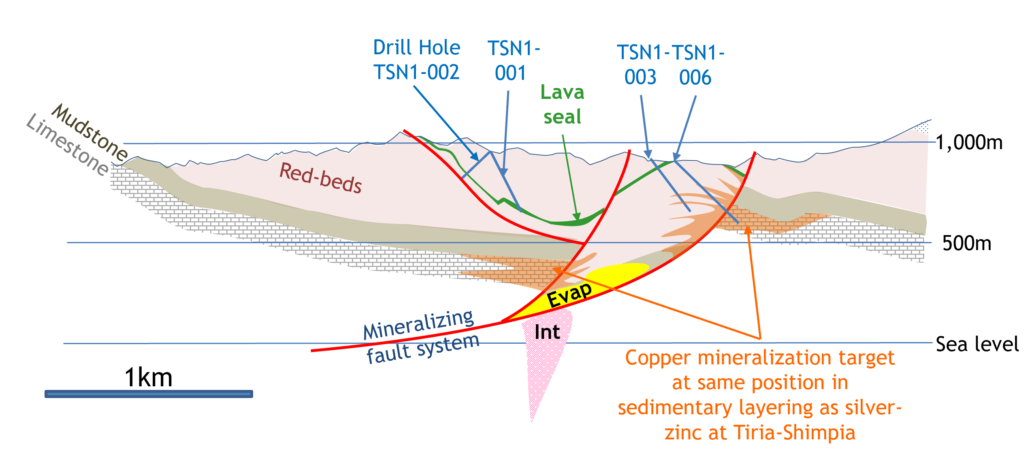
Five drill holes have been completed at Tsenken N1 and hole 6 is underway – the objective being to explore the same sedimentary layer in the Tsenken area that contains zinc-silver in the Tiria-Shimpia area as illustrated in Figure 1.

Figure 1.  Vertical profile illustrating the target concept for the current drill hole, TSN1-006.  The target is copper in the same sedimentary unit in the Tsenken area as contains zinc-silver in the Tiria-Shimpia area.  This target is brought to relatively shallow depth on a geological fault as illustrated in Figure 2.

Geological Detail of Tsenken N1 Drilling

Five drill holes, for a total of 2,184 metres (“m”), have been drilled in the Tsenken N1 target area and hole 6 is underway.  The sedimentary layers targeted in hole 6 have been elevated to within a few hundred metres of surface, as illustrated in Figure 2, by faults that are known to have provided pathways for the metal-bearing fluids.

Drill results received to date are not economically significant but do show a clear trend with contained copper increasing towards the east: drill hole TSN1-002 – the westernmost – having no copper, hole TSN1-001 having 0.23% over 1m and hole TSN1-003 – the easternmost – having two mineralized zones; the upper sedimentary layer with 1m at 0.47% copper and the lower with 0.15% copper over 2.6m.  Observations from the drill core show that the fault system was active at the time of accumulation of the red-beds in the Tsenken area and field mapping and satellite imagery show that this fault system extends into the Tiria-Shimpia area where it is linked with zinc-silver mineralization.

Holes TSN1-004 and TSN1-005 were collared further north, closer to Tiria-Shimpia and results will be reported when available.

Figure 2.  Vertical profile interpretation through the Tsenken N1 area showing the location of drill holes 1, 2 and 3 that tested for sediment-hosted copper-silver in red-beds beneath a lava seal.  Hole 6 is testing for expected sediment-hosted copper in a similar position in the sedimentary layering as the silver-zinc mineralization at Tiria-Shimpia is located.  The fault system shown in red is suspected to have fed copper into the sediments in a similar way that it did zinc-silver into the Tiria-Shimpia area.  (Evap. is evaporite (salt) and Int. is intrusive such as a porphyry).

Drilling at Tiria-Shimpia

A second drill rig has completed the first hole at Tiria-Shimpia and the second scout drilling hole is underway.

Sample Analysis & Quality Assurance / Quality Control (“QAQC”)

Laboratories: The samples were prepared for analysis at MS Analytical (“MSA”) in Cuenca, Ecuador, and the analyses were done in Vancouver, Canada.

Sample preparation: The rock samples were jaw-crushed to 10 mesh (crushed material passes through a mesh with apertures of 2 millimetres (“mm”)), from which a one-kilogram sub-sample was taken.  The sub-sample was crushed to a grain size of 0.075mm and a 200 gram (“g”) split was set aside for analysis.

Analytical procedure:  Approximately 0.25g of rock pulp underwent four-acid digestion and analysis for 48 elements by ICP-MS.  For the over-limit samples, those that had a grade of greater than 1% copper, zinc and lead, and 100g/t silver, 0.4 grams of pulp underwent digestion in four acids and the resulting liquid was diluted and analyzed by ICP-MS.

QAQC: Aurania personnel inserted a certified standard pulp sample, alternating with a field blank, at approximate 20 sample intervals in all sample batches. Aurania’s analysis of results from its independent QAQC samples showed the batches reported on above, lie within acceptable limits.  In addition, the labs reported that the analyses had passed their internal QAQC tests.

Qualified Person

The geological information contained in this news release has been verified and approved by Jean-Paul Pallier, MSc.  Mr. Pallier is a designated EurGeol by the European Federation of Geologists and a Qualified Person as defined by National Instrument 43-101, Standards of Disclosure for Mineral Projects of the Canadian Securities Administrators.

About Aurania

Aurania is a mineral exploration company engaged in the identification, evaluation, acquisition and exploration of mineral property interests, with a focus on precious metals and copper in South America.  Its flagship asset, The Lost Cities – Cutucu Project, is located in the Jurassic Metallogenic Belt in the eastern foothills of the Andes mountain range of southeastern Ecuador.

Information on Aurania and technical reports are available at www.aurania.com and www.sedar.com, as well as on Facebook at https://www.facebook.com/auranialtd/, Twitter at  https://twitter.com/auranialtd, and LinkedIn at https://www.linkedin.com/company/aurania-resources-ltd-.

For further information, please contact:

Carolyn Muir

VP Investor Relations

Aurania Resources Ltd.

(416) 367-3200

carolyn.muir@aurania.com

Dr. Richard Spencer

President

Aurania Resources Ltd.

(416) 367-3200

richard.spencer@aurania.com

Neither the TSX Venture Exchange nor its Regulation Services Provider (as that term is defined in the policies of the TSX Venture Exchange) accepts responsibility for the adequacy or accuracy of this release.

Forward-Looking Statements

This news release may contain forward-looking information that involves substantial known and unknown risks and uncertainties, most of which are beyond the control of Aurania. Forward-looking statements include estimates and statements that describe Aurania’s future plans, objectives or goals, including words to the effect that Aurania or its management expects a stated condition or result to occur. Forward-looking statements may be identified by such terms as “believes”, “anticipates”, “expects”, “estimates”, “may”, “could”, “would”, “will”, or “plan”. Since forward-looking statements are based on assumptions and address future events and conditions, by their very nature they involve inherent risks and uncertainties. Although these statements are based on information currently available to Aurania, Aurania provides no assurance that actual results will meet management’s expectations. Risks, uncertainties and other factors involved with forward-looking information could cause actual events, results, performance, prospects and opportunities to differ materially from those expressed or implied by such forward-looking information. Forward looking information in this news release includes, but is not limited to Aurania’s objectives, goals or future plans, statements, exploration results, potential mineralization, the corporation’s portfolio, treasury, management team and enhanced capital markets profile, the estimation of mineral resources, exploration, timing of the commencement of operations and estimates of market conditions. Factors that could cause actual results to differ materially from such forward-looking information include, but are not limited to, failure to identify mineral resources, failure to convert estimated mineral resources to reserves, the inability to complete a feasibility study which recommends a production decision, the preliminary nature of metallurgical test results, delays in obtaining or failures to obtain required governmental, regulatory, environmental or other project approvals, political risks, inability to fulfill the duty to accommodate indigenous peoples, uncertainties relating to the availability and costs of financing needed in the future, changes in equity markets, inflation, changes in exchange rates, fluctuations in commodity prices, delays in the development of projects, capital and operating costs varying significantly from estimates and the other risks involved in the mineral exploration and development industry, the effects of COVID-19 on the business of the Company including but not limited to the effects of COVID-19 on the price of commodities, capital market conditions, restrictions on labour and international travel and supply chains, and those risks set out in Aurania’s public documents filed on SEDAR. Although Aurania believes that the assumptions and factors used in preparing the forward-looking information in this news release are reasonable, undue reliance should not be placed on such information, which only applies as of the date of this news release, and no assurance can be given that such events will occur in the disclosed time frames or at all. Aurania disclaims any intention or obligation to update or revise any forward-looking information, whether as a result of new information, future events or otherwise, other than as required by law.

Release – Comstocks Linico To Recycle 100000 Tons Of Lithium-Ion Batteries Per Year


Comstock’s Linico To Recycle 100,000 Tons Of Lithium-Ion Batteries Per Year


Breakthrough Lithium-Ion Battery Recycling Technologies Enable Extraordinary Increase in Throughput

Virginia City, NV (July 21, 2021) – Comstock Mining Inc. (the “Company”) (NYSE American: LODE) today announced the filing of a Written Determination of Hazardous Waste Recycling (“Application”) by LINICO Corporation (“LiNiCo”), and its lithium-ion battery (“LIB”) recycling facility located in the Tahoe Reno Industrial (“TRI”) Center in Storey County, Nevada (“TRI Facility”).

The Application and LiNiCo’s final engineering plans are based on the first phase of LiNiCo’s proprietary LIB recycling technologies, which have been designed for extraordinary capacity and yield at a fraction of the capital and operating costs of all known methods. Those technologies are the direct result of Comstock’s recently announced and planned additional technology development, engineering, and materials science acquisitions and other transactions, including Renewable Process Solution (“RPS”) and its CEO and Comstock’s new Chief Process Engineer, Rahul Bobbili.

Construction of the first phase of LiNiCo’s new processes will commence at the TRI Facility upon approval of the Application, with an anticipated completion and start-up during the first half of 2022. Once complete, the TRI Facility is conservatively expected to scale up to its initial nameplate capacity exceeding 100,000 tons per year of LIBs over a period of three years, with annualized revenues exceeding $250,000,000, $410,000,000, and $505,000,000 per year during the TRI Facility’s first, second, and third full years of operations, respectively, as shown in the following excerpt from LiNiCo’s internal projections:Extraordinary Growth

Spent LIBs are widely expected to contain more than $12 billion in recoverable strategic metals by 2025 and $26 billion by 2040, as global mobile device use increases to about 18 billion by 2025, and electric vehicle (“EV”) sales increase to about 138 million units by 2030 from 7.6 million in 2020, according to the International Energy Agency. ARK Invest also recently concluded that EV sales will increase to about 40% of global auto sales within five to six years. Tesla (NASDAQ: TSLA) CEO Elon Musk provided a similar estimate, tweeting his view that the industry could produce 30 million EVs per year by 2027. Peter Rawlinson, CEO of Lucid (NYSE: CCIV), said in June 2021 that he believes that there is a growing recognition that EVs represent the future of the auto industry. And General Motors (NYSE: GM) recently announced that it will increase spending on electric and autonomous vehicles to $35 billion through 2025, with a target of selling 1,000,000 EVs annually by 2025.

Meeting the increased demand will require about 1.8 million tons per year of lithium carbonate equivalent (“LCE”), or about five times more than the entire lithium mining industry produces today, and more than fifteen times the total LCE used in producing new EVs in 2020. The mining and battery manufacturing industries can scale up to meet that demand, but there are only about 80 million tons of identified lithium resources worldwide, and EV batteries are typically landfilled after eight to ten years of use.

Selective Separation Technologies

“The first phase of our technologies was all about establishing and maximizing market leading throughput in a safe, compliant, and cost-effective manner, with room for modular capacity expansions as global electrification efforts accelerate and the LIB recycling industry inevitably grows,” said LiNiCo’s Chief Executive Officer and Founder, Michael Vogel. “However, in addition to our previously announced Green Li-ion 99.9% pure cathode production technologies, we are also perfecting a series of additional technologies involving remarkable and new approaches to selectively separating strategic commodities from LIBs, starting with high purity LCE products. We designed the TRI Facility layout with those future upgrades and technologies in mind.”

Comstock’s Executive Chairman and Chief Executive Officer, Corrado De Gasperis, added, “We see spent LIBs as a potent form of industrial ore, and – as with any ore, we need the right team, technology, and infrastructure to mine it. Comstock and LiNiCo are rapidly assembling all three, as demonstrated by the extraordinary five-fold leap in the initial throughput of LiNiCo’s first facility, representing the proverbial tip of our rapidly developing and expanding technology spear.”

Addressing Scarcity with Innovation

Comstock believes that the global clean energy transition, escalating population growth, and accelerating natural resource scarcity are converging into a “perfect storm” of global demand in a broad array of strategic materials, including anything involving carbon, metals, energy, and water – without the corresponding global capacity to sustainably meet even a fraction of the demand. Comstock’s strategic focus has consequently shifted to include the development of companies and technologies that facilitate the more efficient use of natural resources by extracting and valorizing critical and inevitably scarce feedstocks.

De Gasperis concluded, “The consumption of any product is powered by feedstock, and as vast as some feedstock supplies may seem, they are all finite. The world is watching that story unfold in electrification products, with a current focus on the scarcity of lithium and other cathode constituents, and a shared goal of reducing global carbon emissions. However, every cathode in every LIB needs an anode, and the vast majority of anodes are comprised of synthetic graphite, the global supplies of which are nearly all met with carbon intensive fossil fuel derivatives. We see that to be counterproductive, and its exactly the sort of inevitable need that we intend to address with innovation. We believe that we’re well positioned ahead of that curve with LiNiCo’s TRI Facility and our technology development efforts.”

About Comstock Mining Inc.

Comstock Mining Inc. (NYSE: LODE) is an emerging innovator and leader in the sustainable extraction, valorization, and production of scarce natural resources, with a focus on high value strategic materials that are essential to meeting the rapidly increasing global demand for clean energy, carbon-neutrality, and natural products. To learn more, please visit www.comstockmining.com.

Comstock was selected to join the Russell Microcap® Index at the conclusion of the 2021 Russell indexes annual reconstitution, effective after the US market opened on June 4, 2021. Membership in the Russell Microcap® Index, which remains in place for one year, means automatic inclusion in the appropriate growth and value style indexes. FTSE Russell determines membership for its Russell indexes primarily by objective, market-capitalization rankings and style attributes.

Forward-Looking Statements

This press release and any related calls or discussions may include forward-looking statements within the meaning of Section 27A of the Securities Act of 1933, as amended, and Section 21E of the Securities Exchange Act of 1934, as amended. All statements, other than statements of historical facts, are forward-looking statements. The words “believe,” “expect,” “anticipate,” “estimate,” “project,” “plan,” “should,” “intend,” “may,” “will,” “would,” “potential” and similar expressions identify forward-looking statements, but are not the exclusive means of doing so. Forward-looking statements include statements about matters such as: consummation of all pending transactions; project, asset or Company valuations; future industry market conditions; future explorations, acquisitions, investments and asset sales; future performance of and closings under various agreements; future changes in our exploration activities; future estimated mineral resources; future prices and sales of, and demand for, our products; future impacts of land entitlements and uses; future permitting activities and needs therefor; future production capacity and operations; future operating and overhead costs; future capital expenditures and their impact on us; future impacts of operational and management changes (including changes in the board of directors); future changes in business strategies, planning and tactics and impacts of recent or future changes; future employment and contributions of personnel, including consultants; future land sales, investments, acquisitions, joint ventures, strategic alliances, business combinations, operational, tax, financial and restructuring initiatives; the nature and timing of and accounting for restructuring charges and derivative liabilities and the impact thereof; contingencies; future environmental compliance and changes in the regulatory environment; future offerings of equity or debt securities; asset sales and associated costs; future working capital, costs, revenues, business opportunities, debt levels, cash flows, margins, earnings and growth. These statements are based on assumptions and assessments made by our management in light of their experience and their perception of historical and current trends, current conditions, possible future developments and other factors they believe to be appropriate. Forward-looking statements are not guarantees, representations or warranties and are subject to risks and uncertainties, many of which are unforeseeable and beyond our control and could cause actual results, developments and business decisions to differ materially from those contemplated by such forward-looking statements. Some of those risks and uncertainties include the risk factors set forth in our filings with the SEC and the following: counterparty risks; capital markets’ valuation and pricing risks; adverse effects of climate changes or natural disasters; global economic and capital market uncertainties; the speculative nature of gold or mineral exploration, including risks of diminishing quantities or grades of qualified resources; operational or technical difficulties in connection with exploration or mining activities; contests over title to properties; potential dilution to our stockholders from our stock issuances and recapitalization and balance sheet restructuring activities; potential inability to comply with applicable government regulations or law; adoption of or changes in legislation or regulations adversely affecting businesses; permitting constraints or delays; decisions regarding business opportunities that may be presented to, or pursued by, us or others; the impact of, or the non-performance by parties under agreements relating to, acquisitions, joint ventures, strategic alliances, business combinations, asset sales, leases, options and investments to which we may be party; changes in the United States or other monetary or fiscal policies or regulations; interruptions in production capabilities due to capital constraints; equipment failures; fluctuation of prices for gold or certain other commodities (such as silver, zinc, cyanide, water, diesel fuel and electricity); changes in generally accepted accounting principles; adverse effects of terrorism and geopolitical events; potential inability to implement business strategies; potential inability to grow revenues; potential inability to attract and retain key personnel; interruptions in delivery of critical supplies, equipment and raw materials due to credit or other limitations imposed by vendors or others; assertion of claims, lawsuits and proceedings; potential inability to satisfy debt and lease obligations; potential inability to maintain an effective system of internal controls over financial reporting; potential inability or failure to timely file periodic reports with the SEC; potential inability to list our securities on any securities exchange or market; inability to maintain the listing of our securities; and work stoppages or other labor difficulties. Occurrence of such events or circumstances could have a material adverse effect on our business, financial condition, results of operations or cash flows or the market price of our securities. All subsequent written and oral forward-looking statements by or attributable to us or persons acting on our behalf are expressly qualified in their entirety by these factors. Except as may be required by securities or other law, we undertake no obligation to publicly update or revise any forward-looking statements, whether as a result of new information, future events, or otherwise.

Neither this press release nor any related calls or discussions constitutes an offer to sell, the solicitation of an offer to buy or a recommendation with respect to any securities of the Company, the fund or any other issuer.


Contact Information:

Comstock Mining Inc.
P.O. Box 1118
Virginia City, NV 89440
ComstockMining.com
Corrado De Gasperis
Executive Chairman & CEO
Tel (775) 847-4755
degasperis@comstockmining.com
Zach Spencer
Director of External Relations
Tel (775) 847-5272 Ext.151
questions@comstockmining.com


Release – Travelzoo Reports Second Quarter 2021 Results


Travelzoo Reports Second Quarter 2021 Results


NEW YORK
July 21, 2021 (GLOBE NEWSWIRE) — 
Travelzoo® (NASDAQ: TZOO):

  • Consolidated revenue of 
    $19.1 million, up 172% year-over-year and up 34% quarter-over-quarter
  • Non-GAAP consolidated operating profit of 
    $4.9 million
  • Earnings per share (EPS) of 
    $0.22 attributable to 
    Travelzoo from continuing operations
  • Cash flow from operations of 
    $12.8 million

Travelzoo, a global Internet media company that publishes exclusive offers and experiences for members, today announced financial results for the second quarter ended 
June 30, 2021. Consolidated revenue was 
$19.1 million, up 172% from 
$7.0 million year-over-year and up 34% from 
$14.3 million in the prior quarter. Reported revenue excludes revenue from discontinued operations in 
Asia Pacific
Travelzoo’s reported revenue consists of advertising revenues and commissions, derived from and generated in connection with purchases made by 
Travelzoo members.

The reported net income attributable to 
Travelzoo from continuing operations was 
$3.0 million for Q2 2021. At the consolidated level, including minority interests, the reported net income from continuing operations was 
$3.0 million. EPS from continuing operations was 
$0.22, compared to a loss per share of (
$0.48) in the prior-year period.

Non-GAAP operating profit was 
$4.9 million. The calculation of non-GAAP operating profit excludes amortization of intangibles (
$0.3 million), stock option expenses (
$0.9 million), and severance-related expenses (
$0.2 million). See section “Non-GAAP Financial Measures” below.

“We see continued improvement in our business. We seize the exceptional industry opportunities for providing 30 million 
Travelzoo members exclusive and irresistible travel, entertainment, and local offers and experiences. 
Travelzoo members are affluent, active, and open for new experiences. 75% say 
Travelzoo influences their travel destinations because they trust 
Travelzoo“, said  Holger Bartel, Global CEO.

Cash Position
As of 
June 30, 2021, consolidated cash, cash equivalents and restricted cash were 
$82.1 million. Cash flow from operations was 
$12.8 million. There were no significant capital expenditures.

Reserve
Reported revenues include a reserve of 
$3.7 million related to commissions to be earned from refundable vouchers sold. The reserve is booked as contra revenue. For Q2 2021, an adjustment to the reserve increased reported revenue by 
$286,000.

Travelzoo North America

North America business segment revenue increased 233% year-over-year to 
$14.0 million. Operating profit for Q2 2021 was 
$3.5 million, or 25% of revenue, compared to an operating loss of 
$4.7 million in the prior-year period.

Travelzoo Europe

Europe business segment revenue increased 128% year-over-year to 
$4.2 million. Operating loss for Q2 2021 was 
$227,000, compared to an operating loss of 
$1.7 million in the prior-year period.

Jack’s Flight Club
On 
January 13, 2020
Travelzoo acquired 60% of Jack’s 
Flight Club, a membership subscription service. Jack’s 
Flight Club revenue decreased 9% year-over-year to 
$860,000. Operating income for Q2 2021 was 
$170,000, compared to an operating loss of 
$248,000 in the prior-year period. After consolidation with 
Travelzoo, Jack’s 
Flight Club’s net income was 
$98,000, with 
$59,000 attributable to 
Travelzoo as a result of recording 
$275,000 of amortization of intangible assets related to the acquisition.

Licensing
In 
June 2020
Travelzoo sold its subsidiary in 
Japan, Travelzoo Japan K.K., to Mr.  Hajime Suzuki. In connection with the sale, 
Travelzoo and Travelzoo Japan K.K. entered into a royalty-bearing licensing agreement for the exclusive use of 
Travelzoo members in 
Japan. In 
August 2020
Travelzoo sold its 
Singapore subsidiary to Mr.  Julian Rembrandt and entered into a royalty-bearing licensing agreement for, among other things, the exclusive use of 
Travelzoo’s members in 
Australia
New Zealand, and 
Singapore. Under the licensing agreements, 
Travelzoo’s existing members in 
Australia
Japan
New Zealand, and 
Singapore will continue to be owned by 
Travelzoo as the licensor. Licensing revenue is booked with a lag of one quarter. 
Travelzoo did not record any licensing revenue from either subsidiary in Q2 2021.

Members and Subscribers
As of 
June 30, 2021, we had 31.3 million members worldwide. In 
North America, the unduplicated number of 
Travelzoo members was 17.7 million as of 
June 30, 2021, up 6% from 
June 30, 2020. In 
Europe, the unduplicated number of 
Travelzoo members was 8.5 million as of 
June 30, 2021, down 6% from 
June 30, 2020. Jack’s 
Flight Club had 1.7 million subscribers as of 
June 30, 2021, consistent with 1.7 million subscribers as of 
June 30, 2020.

Discontinued Operations
As announced in a press release on 
March 10, 2020
Travelzoo decided to exit its 
Asia Pacific business which in 2019 reduced EPS by 
$0.60. The 
Asia Pacific business has been classified as discontinued operations since 
March 31, 2020. Prior periods have been reclassified to conform with the current presentation. Certain reclassifications have been made for current and prior periods between the continued operations and the discontinued operations in accordance with 
U.S. GAAP.

Income Taxes
Income tax expense was 
$1.1 million in Q2 2021, compared to an income tax benefit of 
$1.3 million in the prior-year period.

Non-GAAP Financial Measures
Management calculates non-GAAP operating income when evaluating the financial performance of the business. Travelzoo’s calculation of non-GAAP operating income, also called “non-GAAP operating profit” in this press release and today’s earnings conference call, excludes the following items: impairment of intangibles and goodwill, amortization of intangibles, stock option expenses, and severance- related expenses. This press release includes a table which reconciles GAAP operating income to the calculation of non-GAAP operating income. Non-GAAP operating income is not required by, or presented in accordance with, generally accepted accounting principles in 
the United States of America (“GAAP”). This information should be considered as supplemental in nature and should not be considered in isolation or as a substitute for the financial information prepared in accordance with GAAP. In addition, these non-GAAP financial measures may not be the same as similarly titled measures reported by other companies.

Looking Ahead
We currently expect for Q3 2021 to report higher revenue and profitability. We see a trend of recovery of our revenue. We have been able to reduce our operating expenses, and we believe we can continue the trend of lower fixed costs in the foreseeable future.

Conference Call

Travelzoo will host a conference call to discuss second quarter results today at 
11:00 a.m. ET. Please visit http://ir.travelzoo.com/events-presentations to download the management presentation (PDF format) to be discussed in the conference call; and access the webcast.

About Travelzoo
Travelzoo® provides our 30 million members insider deals and one-of-a-kind experiences personally reviewed by one of our deal experts around the globe. We have our finger on the pulse of outstanding travel, entertainment, and lifestyle experiences. For over 20 years we have worked in partnership with more than 5,000 top travel suppliers—our long-standing relationships give 
Travelzoo members access to irresistible deals.

Certain statements contained in this press release that are not historical facts may be forward-looking statements within the meaning of Section 27A of the Securities Act of 1933 and Section 21E of the Securities and Exchange Act of 1934. These forward-looking statements may include, but are not limited to, statements about our plans, objectives, expectations, prospects and intentions, markets in which we participate and other statements contained in this press release that are not historical facts. When used in this press release, the words “expect”, “predict”, “project”, “anticipate”, “believe”, “estimate”, “intend”, “plan”, “seek” and similar expressions are generally intended to identify forward-looking statements. Because these forward-looking statements involve risks and uncertainties, there are important factors that could cause actual results to differ materially from those expressed or implied by these forward-looking statements, including changes in our plans, objectives, expectations, prospects and intentions and other factors discussed in our filings with the 
SEC. We cannot guarantee any future levels of activity, performance or achievements. 
Travelzoo undertakes no obligation to update forward-looking statements to reflect events or circumstances occurring after the date of this press release.

Travelzoo, Top 20, and 
Jack’s Flight Club are registered trademarks of 
Travelzoo.

Travelzoo
Condensed Consolidated Statements of Operations
(Unaudited)
(In thousands, except per share amounts)

  Three months ended   Six months ended
  June 30,   June 30,
  2021   2020   2021   2020
Revenues $ 19,079     $ 7,004     $ 33,363     $ 27,331  
Cost of revenues 2,522     2,141     5,540     4,844  
Gross profit 16,557     4,863     27,823     22,487  
Operating expenses:              
Sales and marketing 7,340     4,288     14,130     17,382  
Product development 685     566     1,368     1,994  
General and administrative 5,056     6,642     9,616     12,164  
Impairment of intangible asset and goodwill             2,920  
Total operating expenses 13,081     11,496     25,114     34,460  
Operating income (loss) 3,476     (6,633 )   2,709     (11,973 )
Other income (loss), net 684     (179 )   518     (185 )
Income (loss) from continuing operations before income taxes 4,160     (6,812 )   3,227     (12,158 )
Income tax expense (benefit) 1,136     (1,309 )   1,878     (1,826 )
Income (loss) from continuing operations 3,024     (5,503 )   1,349     (10,332 )
Income (loss) from discontinued operations,
net of tax
29     (795 )   14     (3,714 )
Net income (loss) 3,053     (6,298 )   1,363     (14,046 )
Net income (loss) attributable to non-controlling interest 39     (108 )   (9 )   (1,247 )
Net income (loss) attributable to 
Travelzoo
$ 3,014     $ (6,190 )   $ 1,372     $ (12,799 )
               
Net income (loss) attributable to Travelzoo—continuing operations $ 2,985     $ (5,395 )   $ 1,358     $ (9,085 )
Net income (loss) attributable to Travelzoo—discontinued operations $ 29     $ (795 )   $ 14     $ (3,714 )
               
Income (Loss) per share—basic              
Continuing operations $ 0.26     $ (0.48 )   $ 0.12     $ (0.80 )
Discontinued operations $     $ (0.07 )   $     $ (0.33 )
Net income (loss) per share —basic $ 0.26     $ (0.55 )   $ 0.12     $ (1.13 )
               
Income (Loss) per share—diluted              
Continuing operations $ 0.22     $ (0.48 )   $ 0.10     $ (0.80 )
Discontinued operations $     $ (0.07 )   $     $ (0.33 )
Net income (loss) per share—diluted $ 0.22     $ (0.55 )   $ 0.10     $ (1.13 )
Shares used in per share calculation from continuing operations—basic 11,488     11,310     11,440     11,375  
Shares used in per share calculation from discontinued operations—basic 11,488     11,310     11,440     11,375  
Shares used in per share calculation from continuing operations—diluted 13,408     11,310     13,248     11,375  
Shares used in per share calculation from discontinued operations—diluted 13,408     11,310     13,248     11,375  
                       

Travelzoo
Condensed Consolidated Balance Sheets
(Unaudited)
(In thousands)

  June 30,
2021
  December 31,
2020
Assets      
Current assets:      
Cash and cash equivalents $ 80,962     $ 63,061  
Accounts receivable, net 9,905     4,519  
Prepaid income taxes 1,616     931  
Deposits 105     137  
Prepaid expenses and other 3,253     1,166  
Assets from discontinued operations 84     230  
Total current assets 95,925     70,044  
Deposits and other 1,552     745  
Deferred tax assets 3,647     5,067  
Restricted cash 1,164     1,178  
Operating lease right-of-use assets 8,559     8,541  
Property and equipment, net 1,034     1,347  
Intangible assets, net 3,975     4,534  
Goodwill 10,944     10,944  
Total assets $ 126,800     $ 102,400  
Liabilities and Stockholders’ Equity      
Current liabilities:      
Accounts payable $ 8,503     $ 6,996  
Merchant payables 82,236     57,104  
Accrued expenses and other 8,222     8,649  
Deferred revenue 2,213     2,688  
Operating lease liabilities 3,751     3,587  
PPP notes payable (current portion) 3,156     2,849  
Income tax payable 98     326  
Liabilities from discontinued operations 482     671  
Total current liabilities 108,661     82,870  
PPP notes payables     814  
Deferred tax liabilities 38     357  
Long-term operating lease liabilities 10,353     10,774  
Other long-term liabilities 2,146     1,085  
Total liabilities 121,198     95,900  
Non-controlling interest 4,600     4,609  
Common stock 115     114  
Treasury stock (at cost) (1,583 )    
Additional paid-in capital 4,988     6,239  
Retained earnings (accumulated deficit) 969     (403 )
Accumulated other comprehensive loss (3,487 )   (4,059 )
Total stockholders’ equity 1,002     1,891  
Total liabilities and stockholders’ equity $ 126,800     $ 102,400  
               

Travelzoo
Condensed Consolidated Statements of Cash Flows
(Unaudited)
(In thousands)

  Three months ended   Six months ended
  June 30,   June 30,
  2021   2020   2021   2020
Cash flows from operating activities:              
Net income (loss) $ 3,053     $ (6,298 )   $ 1,363     $ (14,046 )
Adjustments to reconcile net income (loss) to net cash provided by (used in) operating activities:              
Depreciation and amortization 476     667     960     1,218  
Stock-based compensation 934     4,031     1,816     4,054  
Deferred income tax 599     (1,152 )   1,140     (1,761 )
Impairment of intangible assets and goodwill             2,920  
Gain on notes payable settlement     (1,500 )       (1,500 )
Loss on long-lived assets             437  
Loss on equity investment in WeGo     141         336  
Gain on PPP notes payable forgiveness (429 )       (429 )    
Net foreign currency effects (103 )   225     (255 )   (456 )
Provision (reversal) of loss on accounts receivable and other reserves (417 )   986     (871 )   2,427  
Changes in operating assets and liabilities, net of acquisitions:              
Accounts receivable (2,552 )   3,674     (4,781 )   6,183  
Prepaid income taxes (168 )       (713 )   989  
Prepaid expenses and other (418 )   558     (2,775 )   1,420  
Accounts payable (312 )   1,602     1,415     2,149  
Merchant payables 11,973     15,100     25,185     8,160  
Accrued expenses and other 321     (2,084 )   (320 )   (1,380 )
Income tax payable (102 )   266     (228 )   (67 )
Other liabilities (80 )   263     332     2,340  
Net cash provided by operating activities 12,775     16,479     21,839     13,423  
Cash flows from investing activities:              
Acquisition of business, net of cash acquired             (679 )
Other investment     (430 )       (430 )
Purchases of property and equipment (77 )   (72 )   (84 )   (203 )
Net cash used in investing activities (77 )   (502 )   (84 )   (1,312 )
Cash flows from financing activities:              
Repurchase of common stock         (1,583 )   (1,205 )
Payment of promissory notes     (6,800 )       (7,800 )
Proceeds from notes payable     3,663         3,663  
Exercise of stock options and taxes paid for net share settlement (3,066 )       (3,066 )    
Net cash used in financing activities (3,066 )   (3,137 )   (4,649 )   (5,342 )
Effect of exchange rate on cash, cash equivalents and restricted cash 427     (239 )   697     (511 )
Net increase in cash, cash equivalents and restricted cash 10,059     12,601     17,803     6,258  
Cash, cash equivalents and restricted cash at beginning of period 72,129     14,367     64,385     20,710  
Cash, cash equivalents and restricted cash at end of period $ 82,188     $ 26,968     $ 82,188     $ 26,968  
                               

Travelzoo
Segment Information from Continuing Operations
(Unaudited)
(In thousands)

Three months ended June 30, 2021 Travelzoo
North

America
  Travelzoo
Europe
  Jack’s Flight
Club
  Elimination   Consolidated
Revenue from unaffiliated customers $ 13,650     $ 4,569     $ 860     $       $ 19,079  
Intersegment revenue 335     (335 )              
Total net revenues 13,985     4,234     860           19,079  
Operating income (loss) $ 3,533     $ (227 )   $ 170     $       $ 3,476  
                   
Three months ended June 30, 2020 Travelzoo
North

America
  Travelzoo
Europe
  Jack’s Flight
Club
  Elimination   Consolidated
Revenue from unaffiliated customers $ 4,254     $ 1,805     $ 945     $       $ 7,004  
Intersegment revenue (52 )   52                
Total net revenues 4,202     1,857     945           7,004  
Operating loss $ (4,702 )   $ (1,683 )   $ (248 )   $       $ (6,633 )


Six months ended
June 30, 2021
Travelzoo
North

America
  Travelzoo
Europe
  Jack’s Flight
Club
  Elimination   Consolidated
Revenue from unaffiliated customers $ 23,478     $ 8,138     $ 1,747     $     $ 33,363  
Intersegment revenue 326     (326 )            
Total net revenues 23,804     7,812     1,747         33,363  
Operating income (loss) $ 3,572     $ (923 )   $ 60     $     $ 2,709  
                   
Six months ended
June 30, 2020
Travelzoo
North

America
  Travelzoo
Europe
  Jack’s Flight
Club
  Elimination   Consolidated
Revenue from unaffiliated customers $ 16,803     $ 8,908     $ 1,628     $ (8 )   $ 27,331  
Intersegment revenue 96     (104 )       8      
Total net revenues 16,899     8,804     1,628         27,331  
Operating loss $ (5,678 )   $ (3,024 )   $ (3,263 )   $ (8 )   $ (11,973 )


Travelzoo
Reconciliation of GAAP to Non-GAAP Information
(Unaudited)
(In thousands, except per share amounts)

  Three months ended   Six months ended
  June 30,   June 30,
  2021   2020   2021   2020
GAAP operating expense $ 13,081     $ 11,496     $ 25,114     $ 34,460  
Non-GAAP adjustments:              
Impairment of intangible and goodwill (A)             2,920  
Amortization of intangibles (B) 275     396     559     611  
Stock option expenses (C) 934     4,031     1,816     4,054  
Severance-related expenses (D) 175     67     398     284  
Non-GAAP operating expense 11,697     7,002     22,341     26,591  
               
GAAP operating income (loss) 3,476     (6,633 )   2,709     (11,973 )
Non-GAAP adjustments (A through D) 1,384     4,494     2,773     7,869  
Non-GAAP operating income (loss) 4,861     (2,139 )   5,482     (4,104 )

Investor Relations:
Almira Pusch
ir@travelzoo.com

Source: Travelzoo

Release – Sierra Metals Reports Second Quarter 2021 Production Results Including Record Throughput at Its Yauricocha Mine in Peru


Sierra Metals Reports Second Quarter 2021 Production Results Including Record Throughput at Its Yauricocha Mine in Peru


TORONTO–(BUSINESS WIRE)– Sierra Metals Inc. (TSX:SMT) (BVL:SMT) (NYSE AMERICAN:SMTS) (“Sierra Metals” or “the Company”) is reporting second-quarter 2021 production results, as the Company continues to deal with the effect of the COVID-19 pandemic at its operations.

Results are from Sierra Metals’ three underground mines in Latin America: The Yauricocha polymetallic mine in Peru, and the Bolivar copper and Cusi silver Mines in Mexico.

Second Quarter 2021 Production Highlights

  • Copper production
    of 9.5 million pounds; a 2% decrease from Q2 2020
  • Silver production
    of 1.0 million ounces; a 67% increase from Q2 2020
  • Gold production of
    2,812 ounces; a 2% increase from Q2 2020
  • Zinc production of
    21.1 million pounds; a 54% increase from Q2 2020
  • Lead production of
    8.0 million pounds; a 24% increase from Q2 2020
  • Copper equivalent
    production of 24.8 million pounds; a 9% increase from Q2 2020

The Company achieved 62% and 25% increase in throughput as compared to Q2 2020, at its Yauricocha and Bolivar mines respectively. The Yauricocha mine achieved 328,909 tonnes during the quarter at an average rate of 3,759 tpd. Earlier during the quarter, the Company announced receipt of permit to build and operate an expansion of its capacity to 3,600 tpd plus an allowance for up to an additional 5%.

Consolidated copper production decreased 2% to 9.5 million pounds, silver increased 67% to 1.0 million ounces, zinc increased 54% to 21.1 million pounds, lead increased 24% to 8.0 million pounds, and gold increased 2% to 2,812 ounces compared to Q2 2020.

Luis Marchese, President, and CEO of Sierra Metals commented: “Despite the
challenges we have faced due to the Covid-19 Pandemic, I am pleased with the
relatively solid production performance in Q2 2021. The Company continues to
face operational difficulties related to COVID-19 at all mines but particularly
in Peru. We expect that we will continue to be impacted for the remainder of
the year and as such we are reviewing our production guidance and may revise it
as part of our Q2-2021 consolidated financial results.”

He continued
, “Looking ahead to the second half of 2021, we anticipate seeing
an improvement in production results over the first half of the year as we
continue to manage the implications of COVID-19 using best practices. Our goal continues
to be avoiding any mine closures while ensuring that strict protocols remain in
place to protect the wellbeing of our employees as well as the local
communities. Additionally, we have commenced implementation on a 500,000 tonne
per year magnetite concentrate plant at Bolivar which is expected to be
operational early next year. We also received the final permit required for the
construction and operation of the expansion of throughput at Yauricocha to
3,600 tonnes per day. We continue to work on the completion of Preliminary
Feasibility Studies for all three mines to support planned expansions at all
mines starting in 2024. Brownfield and greenfield exploration programs
continue, and we continue to strive to optimize and improve operations with an
aim of reducing costs where possible in this challenging environment.”

Consolidated Production Results

Consolidated Production

Three
Months Ended June 30

Six Months
Ended June 30

2021

2020

% Var.

2021

2020

% Var.


Tonnes processed

787,534

511,485

54%

1,561,955

1,252,183

25%

Daily throughput

9,000

5,846

54%

8,925

7,155

25%


Silver production (000 oz)

954

572

67%

1,915

1,520

26%

Copper production (000 lb)

9,535

9,708

-2%

17,430

21,484

-19%

Lead production (000 lb)

7,960

6,406

24%

16,964

15,485

10%

Zinc production (000 lb)

21,133

13,741

54%

45,256

35,387

28%

Gold Production (oz)

2,812

2,762

2%

5,448

6,419

-15%


Silver equivalent ounces
(000’s)(1)

4,043

3,297

23%

7,778

8,028

-3%

Copper equivalent pounds
(000’s)(1)

24,786

22,743

9%

50,157

54,016

-7%

Zinc equivalent pounds (000’s)(1)

81,114

61,353

32%

160,750

146,032

10%


(1) Silver equivalent ounces and copper and zinc equivalent pounds
for Q2 2021 were calculated using the following realized prices: $26.80/oz Ag,
$4.37/lb Cu, $1.34/lb Zn, $0.97/lb Pb, $1,818/oz Au. Silver equivalent ounces
and copper and zinc equivalent pounds for Q2 2020 were calculated using the
following realized prices: $16.59/oz Ag, $2.40/lb Cu, $0.89/lb Zn, $0.76/lb Pb,
$1,722/oz Au. Silver equivalent ounces and copper and zinc equivalent pounds
for 6M 2021 were calculated using the following realized prices: $26.62/oz Ag,
$4.13/lb Cu, $1.29/lb Zn, $0.94/lb Pb, $1,798/oz Au. Silver equivalent ounces
and copper and zinc equivalent pounds for 6M 2020 were calculated using the
following realized prices: $16.58/oz Ag, $2.46/lb Cu, $0.91/lb Zn, $0.78/lb Pb,
$1,654/oz Au.

Yauricocha Mine, Peru

The Yauricocha Mine demonstrated its operational flexibility by processing a record 328,909 tonnes during Q2 2021, which is a 62% increase from Q2 2020. On June 16, 2021, the Company announced receipt of a permit from the Peruvian Ministry of Energy and Mines, which allows for the construction and operation at a capacity of 3,600 tpd.

The higher throughput was partially offset by lower head grades for all metals, resulting in a 7% higher copper equivalent production as compared to Q2 2020. In terms of zinc equivalents, this was a 29% increase over the same quarter of 2020. Copper production for the quarter was 11% lower, while silver, lead, zinc and gold production increased by 35%, 22%, 54% and 23% respectively as compared to Q2 2020. Due to COVID-19 operating restrictions the focus has been on larger but lowered grade ore bodies to meet tonnages with a reduced work force.

A summary of production from the Yauricocha Mine for Q2 2021 is provided below:

Yauricocha Production

Three
Months Ended June 30

Six Months
Ended June 30

2021

2020

% Var.

2021

2020

% Var.


Tonnes processed

328,909

202,534

62%

655,120

487,759

34%

Daily throughput

3,759

2,315

62%

3,744

2,787

34%


Silver grade (g/t)

56.94

66.37

-14%

55.65

66.07

-16%

Copper grade

0.70%

1.21%

-42%

0.63%

1.17%

-46%

Lead grade

1.20%

1.63%

-26%

1.27%

1.59%

-20%

Zinc grade

3.27%

3.48%

-6%

3.49%

3.74%

-7%

Gold Grade (g/t)

0.45

0.62

-27%

0.44

0.66

-33%


Silver recovery

80.14%

82.82%

-3%

79.70%

82.82%

-4%

Copper recovery

72.67%

77.19%

-6%

69.84%

77.19%

-10%

Lead recovery

90.14%

88.08%

2%

90.15%

88.08%

2%

Zinc recovery

89.23%

88.32%

1%

89.82%

88.32%

2%

Gold Recovery

21.99%

21.18%

4%

20.91%

21.18%

-1%


Silver production (000 oz)

483

358

35%

934

853

9%

Copper production (000 lb)

3,697

4,164

-11%

6,379

9,548

-33%

Lead production (000 lb)

7,831

6,406

22%

16,537

15,014

10%

Zinc production (000 lb)

21,133

13,741

54%

45,256

35,387

28%

Gold Production (oz)

1,043

850

23%

1,933

2,104

-8%


Copper equivalent pounds
(000’s)(1)

15,308

14,354

7%

31,142

34,549

-10%

Zinc equivalent pounds (000’s)(1)

49,923

38,723

29%

99,701

93,404

7%


(1) Silver equivalent ounces and copper and zinc equivalent pounds
for Q2 2021 were calculated using the following realized prices: $26.80/oz Ag,
$4.37/lb Cu, $1.34/lb Zn, $0.97/lb Pb, $1,818/oz Au. Silver equivalent ounces
and copper and zinc equivalent pounds for Q2 2020 were calculated using the
following realized prices: $16.59/oz Ag, $2.40/lb Cu, $0.89/lb Zn, $0.76/lb Pb,
$1,722/oz Au. Silver equivalent ounces and copper and zinc equivalent pounds
for 6M 2021 were calculated using the following realized prices: $26.62/oz Ag,
$4.13/lb Cu, $1.29/lb Zn, $0.94/lb Pb, $1,798/oz Au. Silver equivalent ounces
and copper and zinc equivalent pounds for 6M 2020 were calculated using the
following realized prices: $16.58/oz Ag, $2.46/lb Cu, $0.91/lb Zn, $0.78/lb Pb,
$1,654/oz Au.

Bolivar Mine, Mexico

The Bolivar Mine processed 385,331 tonnes in Q2 2021, which is a 25% increase from the Q2 2020 throughput. The average daily throughput realized during the quarter was 4,404 tpd. Head grades for copper, silver, and gold were 8%, 27%, and 30% lower, respectively, as compared to Q2 2020. Copper equivalent production for Q2 2021 decreased 8% as compared to Q2 2020, because of lower silver (6%) and gold (15%) production offset by 5% higher copper production. Production continues to be focused more on the Mina de Fierro zone in Q2 2021 as part of our COVID-19 management plan. Mina de Fierro is a larger ore body with greater tonnages; however, the head grades and recoveries are lower than the Bolivar West zone. It is expected that as the Bolivar Mine returns to more normal operations and more ore is taken from the Bolivar West zone that we will see and improvement in head grades and recoveries in the future.

A summary of production for the Bolivar Mine for Q2 2021 is provided below:

Bolivar Production

Three
Months Ended June 30

Six Months
Ended June 30

2021

2020

% Var.

2021

2020

% Var.


Tonnes processed (t)

385,331

308,951

25%

756,939

686,513

10%

Daily throughput

4,404

3,531

25%

4,325

3,923

10%


Copper grade

0.86%

0.93%

-8%

0.82%

0.91%

-10%

Silver grade (g/t)

19.06

26.00

-27%

19.31

23.30

-17%

Gold grade (g/t)

0.21

0.30

-30%

0.20

0.29

-31%


Copper recovery

79.89%

87.09%

-8%

82.25%

86.45%

-5%

Silver recovery

85.74%

82.80%

4%

85.13%

82.41%

3%

Gold recovery

63.19%

63.79%

-1%

66.95%

63.84%

5%


Copper production (000 lb)

5,838

5,544

5%

11,051

11,935

-7%

Silver production (000 oz)

202

214

-6%

399

424

-6%

Gold production (oz)

1,627

1,912

-15%

3,218

4,103

-22%


Copper equivalent pounds
(000’s)(1)

7,754

8,389

-8%

15,024

17,541

-14%


(1) Silver equivalent ounces and copper and zinc equivalent pounds
for Q2 2021 were calculated using the following realized prices: $26.80/oz Ag,
$4.37/lb Cu, $1.34/lb Zn, $0.97/lb Pb, $1,818/oz Au. Silver equivalent ounces
and copper and zinc equivalent pounds for Q2 2020 were calculated using the
following realized prices: $16.59/oz Ag, $2.40/lb Cu, $0.89/lb Zn, $0.76/lb Pb,
$1,722/oz Au. Silver equivalent ounces and copper and zinc equivalent pounds
for 6M 2021 were calculated using the following realized prices: $26.62/oz Ag,
$4.13/lb Cu, $1.29/lb Zn, $0.94/lb Pb, $1,798/oz Au. Silver equivalent ounces
and copper and zinc equivalent pounds for 6M 2020 were calculated using the
following realized prices: $16.58/oz Ag, $2.46/lb Cu, $0.91/lb Zn, $0.78/lb Pb,
$1,654/oz Au.

Cusi Mine, Mexico

The Cusi Mine throughput for Q2 2021 was 73,294 tonnes or 838 tpd. There was no production during the same quarter of 2020, as Cusi remained in care and maintenance throughout that quarter, due to the government-mandated shutdown to contain the advancement of COVID-19. Silver head grade for Q2 2021 was 138.94 g/t resulting in silver production of 269,000 ounces. Additionally, gold production was 142 ounces and lead production was 129,000 pounds respectively during the quarter.

A summary of production for the Cusi Mine for Q2 2021 is provided below:

Cusi Production

Three
Months Ended June 30

Six Months
Ended June 30

2021

2020

% Var.

2021

2020

% Var.


Tonnes processed (t)

73,294

N.A.

149,896

77,911

92%

Daily throughput

838

N.A.

857

890

-4%


Silver grade (g/t)

138.94

N.A.

148.28

120.88

23%

Gold grade (g/t)

0.16

N.A.

0.16

0.18

-11%

Lead grade

0.10%

N.A.

0.16%

0.33%

-52%


Silver recovery (flotation)

81.96%

N.A.

81.39%

80.21%

1%

Gold recovery (lixiviation)

37.41%

N.A.

38.51%

46.53%

-17%

Lead recovery

82.95%

N.A.

81.90%

84.17%

-3%


Silver production (000 oz)

269

N.A.

582

243

140%

Gold production (oz)

142

N.A.

297

212

40%

Lead production (000 lb)

129

N.A.

427

471

-9%


Silver equivalent ounces
(000’s)(1)

283

N.A.

617

286

116%


(1) Silver equivalent ounces and copper and zinc equivalent pounds
for Q2 2021 were calculated using the following realized prices: $26.80/oz Ag,
$4.37/lb Cu, $1.34/lb Zn, $0.97/lb Pb, $1,818/oz Au. Silver equivalent ounces
and copper and zinc equivalent pounds for Q2 2020 were calculated using the
following realized prices: $16.59/oz Ag, $2.40/lb Cu, $0.89/lb Zn, $0.76/lb Pb,
$1,722/oz Au. Silver equivalent ounces and copper and zinc equivalent pounds
for 6M 2021 were calculated using the following realized prices: $26.62/oz Ag,
$4.13/lb Cu, $1.29/lb Zn, $0.94/lb Pb, $1,798/oz Au. Silver equivalent ounces
and copper and zinc equivalent pounds for 6M 2020 were calculated using the
following realized prices: $16.58/oz Ag, $2.46/lb Cu, $0.91/lb Zn, $0.78/lb Pb,
$1,654/oz Au.

Quality Control

All technical data contained in this news release has been reviewed and approved by Americo Zuzunaga, FAusIMM CP (Mining Engineer) and Vice President of Corporate Planning is a Qualified Person and chartered professional qualifying as a Competent Person under the Joint Ore Reserves Committee (JORC) Australasian Code for Reporting of Exploration Results, Mineral Resources, and Ore Reserves.

About Sierra Metals

Sierra Metals Inc. is a diversified Canadian mining company focused on the production and development of precious and base metals from its polymetallic Yauricocha Mine in Peru, and Bolivar and Cusi Mines in Mexico. The Company is focused on increasing production volume and growing mineral resources. Sierra Metals has recently had several new key discoveries and still has many more exciting brownfield exploration opportunities at all three Mines in Peru and Mexico that are within close proximity to the existing mines. Additionally, the Company also has large land packages at all three mines with several prospective regional targets providing longer-term exploration upside and mineral resource growth potential.

The Company’s Common Shares trade on the Bolsa de Valores de Lima and on the Toronto Stock Exchange under the symbol “SMT” and on the NYSE American Exchange under the symbol “SMTS”.

For further information regarding Sierra Metals, please visit www.sierrametals.com.

Continue
to Follow, Like and Watch our progress:

Web: www.sierrametals.com | Twitter: sierrametals | Facebook: SierraMetalsInc | LinkedIn: Sierra Metals Inc | Instagram: sierrametals

Forward-Looking Statements

This press release contains “forward-looking information” and “forward-looking statements” within the meaning of Canadian and U.S. securities laws (collectively, “forward-looking information“). Forward-looking information includes, but is not limited to, statements with respect to the date of the 2020 Shareholders’ Meeting and the anticipated filing of the Compensation Disclosure. Any statements that express or involve discussions with respect to predictions, expectations, beliefs, plans, projections, objectives, assumptions or future events or performance (often, but not always, using words or phrases such as “expects”, “anticipates”, “plans”, “projects”, “estimates”, “assumes”, “intends”, “strategy”, “goals”, “objectives”, “potential” or variations thereof, or stating that certain actions, events or results “may”, “could”, “would”, “might” or “will” be taken, occur or be achieved, or the negative of any of these terms and similar expressions) are not statements of historical fact and may be forward-looking information.

Forward-looking information is subject to a variety of risks and uncertainties, which could cause actual events or results to differ from those reflected in the forward-looking information, including, without limitation, the risks described under the heading “Risk Factors” in the Company’s annual information form dated March 30, 2020 for its fiscal year ended December 31, 2020 and other risks identified in the Company’s filings with Canadian securities regulators and the United States Securities and Exchange Commission, which filings are available at www.sedar.com and www.sec.gov, respectively.

The risk factors referred to above are not an exhaustive list of the factors that may affect any of the Company’s forward-looking information. Forward-looking information includes statements about the future and is inherently uncertain, and the Company’s actual achievements or other future events or conditions may differ materially from those reflected in the forward-looking information due to a variety of risks, uncertainties and other factors. The Company’s statements containing forward-looking information are based on the beliefs, expectations and opinions of management on the date the statements are made, and the Company does not assume any obligation to update such forward-looking information if circumstances or management’s beliefs, expectations or opinions should change, other than as required by applicable law. For the reasons set forth above, one should not place undue reliance on forward-looking information.

Mike McAllister
V.P., Investor Relations
Sierra Metals Inc.
+1 (416) 366-7777
info@sierrametals.com

Luis
Marchese

CEO
Sierra Metals Inc.
+1 (416) 366-7777

Source: Sierra Metals Inc.

Release – enCore Energy Provides South Texas Uranium Operations Update


enCore Energy Provides South Texas Uranium Operations Update


July 20, 2021 – Corpus Christi, Texas – enCore Energy Corp.
(TSXV: EU; OTCQB:ENCUF) (the “Company”) is pleased to provide an update on its South Texas Uranium Operations. Since acquiring the uranium assets from Westwater Resources, Inc. on December 30, 2020, enCore Energy has aggressively executed its strategy to become the newest in-situ recovery (“ISR”) uranium producer in the U.S. with operational highlights including:

  • Acquisition of mineral and surface properties in known uranium historic resource areas, including several that are partially permitted and previously licensed Texas projects, located within 75 miles of the Rosita Central Processing Plant. These properties provide a pipeline of future production projects to feed the Rosita plant as satellite operations;
  • Commencement of the refurbishment and upgrade work for the Rosita Processing Facility projected for completion by Q2 2022;
  • Preparation of applications to the State of Texas for the commencement of confirmation drilling;
  • Completion of surface reclamation and decommissioning work at the former Vasquez ISR project. The Company is now working with the State of Texas to finalize and release the bonding as sites are returned to their prior use;
  • Relocation of the Corporate Office to Corpus Christi, Texas.

Paul Goranson, enCore Energy Chief Executive Officer said, “Our team at enCore has been executing our South Texas strategy which prioritizes restoring the Rosita processing facility to production capability along with securing additional resources to feed the plant over the coming years We will continue to move forward on our initiatives, meeting our key milestones while nuclear energy continues to establish itself as the low carbon emission, affordable and sustainable energy source.”

About enCore Energy Corp.

enCore Energy Corp. is a U.S. domestic uranium developer focused on becoming a leading in-situ recovery (ISR) uranium producer. The Company is led by a team of industry experts with extensive knowledge and experience in the development and operations of in situ recovery uranium operations. enCore Energy’s opportunities are created from the Company’s transformational acquisition of its two South Texas production facilities, the changing global uranium supply/demand outlook and opportunities for industry consolidation. These short-term opportunities are augmented by our strong long term commitment to working with local indigenous communities in New Mexico where the company holds significant uranium resources.

For additional information:

William M. Sheriff

Executive Chairman

972-333-2214

info@encoreenergycorp.com

www.encoreenergycorp.com

Neither
TSX Venture Exchange nor its Regulation Services Provider (as that term is
defined in policies of the TSX Venture Exchange) accepts responsibility for
the adequacy or accuracy of this release.

No stock exchange, securities
commission or other regulatory authority has approved or disapproved the
information contained herein. This press release contains projections and
forward-looking information that involve various risks and uncertainties
regarding future events. Such forward-looking information can include without
limitation statements based on current expectations involving a number of
risks and uncertainties and are not guarantees of future performance. There
are numerous risks and uncertainties that could cause actual results and the
Company’s plans and objectives to differ materially from those expressed in
the forward-looking information. Actual results and future events could
differ materially from those anticipated in such information. These and all
subsequent written and oral forward-looking information are based on
estimates and opinions of management on the dates they are made and are
expressly qualified in their entirety by this notice. Except as required by
law, the Company assumes no obligation to update forward-looking information
should circumstances or management’s estimates or opinions change.

Is Interest Paid on Crypto Holdings an SEC Violation?


New Jersey Issues Cease and Desist Order on Crypto Interest Payments


The cryptocurrency platform BlockFi Inc. was ordered by the state of New Jersey to stop providing customers with interest-bearing accounts (July 20).  The cease and desist order from New Jersey’s Bureau of Securities said BlockFi’s accounts were not registered with that office and are not exempt from registration; therefore, their sale violated New Jersey securities laws.

The crypto service provider has been offering their BlockFi Interest Account (BIA) to add value by advertising above average (U.S. Dollar) yields to crypto investors who store their crypto assets at BlockFi. Customers can deposit crypto and earn monthly compounding interest.

Cease and Desist:

The company had been offering interest rates between 0.25% and 8.5% depending on the crypto asset and deposit size, in addition to a trading platform and bitcoin rewards credit cards. In comparison, according to the FDIC the national average for interest in savings accounts is 0.06%, while 10-year treasury notes yield 1.19%. They (BIAs) behave similarly to a money market sweep account at traditional brokers. The interest-bearing accounts do not have oversight by regulators such as a bank would with the FDIC and a registered money fund would with the SEC.

New Jersey’s acting Attorney General, said the enforcement against the Jersey City, NJ headquartered BlockFi comes amid concern about the growth of decentralized finance platforms for investors in digital assets. According to the order, investors can “buy” BlockFi Interest Accounts by depositing cryptocurrencies such as Bitcoin and Ethereum with the company, these assets are used to fund lending operations and proprietary trading. “Our rules are simple: if you sell securities in New Jersey, you need to comply with New Jersey’s securities laws,” Bruck said in a statement. “No one gets a free pass simply because they’re operating in the fast-evolving cryptocurrency market.”

The order takes effect on July 22 and does not affect existing BlockFi Interest Accounts. Bruck said BlockFi does not offer the accounts in New York and some other jurisdictions.

The Company Position

BlockFi said in a statement it disagreed with the order because the accounts are not securities. It also said it remained fully operational for existing New Jersey clients, and believed its products are “lawful and appropriate for crypto market participants.”

Suggested Reading:


Decentralized Finance, is it the Future


DAPPS, Decentralized Apps


When was the Shortest Recession in your Lifetime?


Investing in the Businesses in and Around Crypto


Sources:

https://www.forbes.com/sites/stevenehrlich/2021/07/19/new-jersey-attorney-general-prepares-cease-and-desist-order-against-multi-billion-dollar-bitcoin-financial-services-platform/?sh=4a8ebda321a5

Release – Indonesia Energy Discovers Oil in the First New Well at Kruh Block


Indonesia Energy Discovers Oil in the First New Well at Kruh Block


Drilling Rig Has Moved to New Location to Drill Second New Well

JAKARTA, INDONESIA and DANVILLE, CA / ACCESSWIRE / July 20, 2021 / IndonesiaEnergy Corporation (NYSE American:INDO) (“IEC”), an oil and gas exploration and production company focused on Indonesia, today announced that it has discovered oil in its “Kruh 25” well and the drilling rig has now moved to the second well location and will commence the drilling of its second new well (called “Kruh 26”) in the next few weeks. This activity is a continuation of IEC’s previously announced plan to drill three new wells at Kruh Block this year, with more wells anticipated to follow over the next several years.

The Kruh 25 well is still in the stage of a “cleaning up” process where the well is flowing crude oil with decreasing amount of drilling fluids daily. IEC also plans to conduct its planned stimulation operations on all three new wells and will announce production rates after such stimulation is completed on all three wells.

IEC also announced that the oil-bearing interval (meaning the top of the oil zone to the bottom of the oil zone) in the Kruh 25 well was thicker and therefore larger than anticipated.

The Kruh 25 well was drilled to a depth of 3,368 feet. Completion of the well took longer than anticipated because of new restrictions that were initiated by the Government of Indonesia because of the significant increase in cases of Covid-19 which delayed operations.

Mr. Frank Ingriselli, IEC’s President, commented “This is a significant milestone for IEC as we begin to deliver on the potential for new production at Kruh Block per our announced plans. We are very excited that our first of our three anticipated back-to-back wells at the Kruh Block has discovered oil and the producing zone was bigger than anticipated. We accomplished this notwithstanding delays we had to overcome, first because of permitting and then because of new government Covid restrictions that affected logistical operations. We look forward to drilling the final two wells in this three well campaign for 2021 and then maximizing new production with a planned stimulation program that we expect will significantly grow our cash flow and will maximize returns on our investments and grow shareholder value.”

About Indonesia Energy Corporation Limited
Indonesia Energy Corporation Limited (NYSE American:INDO) is a publicly traded energy company engaged in the acquisition and development of strategic, high growth energy projects in Indonesia. IEC’s principal assets are its Kruh Block (63,000 acres) located onshore on the Island of Sumatra in Indonesia and its Citarum Block (1,000,000 acres) located onshore on the Island of Java in Indonesia. IEC is headquartered in Jakarta, Indonesia and has a representative office in Danville, California. For more information on IEC, please visit www.indo-energy.com.

Cautionary Statement Regarding Forward-Looking Statements
All statements in this press release of Indonesia Energy Corporation Limited (“IEC”) and its representatives and partners that are not based on historical fact are “forward-looking statements” within the meaning of the Private Securities Litigation Reform Act of 1995 and the provisions of Section 27A of the Securities Act of 1933, as amended, and Section 21E of the Securities Exchange Act of 1934, as amended (the “Acts”). In particular, when used in the preceding discussion, the words “estimates,” “believes,” “hopes,” “expects,” “intends,” “on-track”, “plans,” “anticipates,” or “may,” and similar conditional expressions are intended to identify forward-looking statements within the meaning of the Acts and are subject to the safe harbor created by the Acts. Any statements made in this news release other than those of historical fact, about an action, event or development, are forward-looking statements. While management has based any forward-looking statements contained herein on its current expectations, the information on which such expectations were based may change. These forward-looking statements rely on a number of assumptions concerning future events and are subject to a number of risks, uncertainties, and other factors, many of which are outside of the IEC’s control, that could cause actual results (including the results of IEC’s drilling activities at Kruh Block as described herein) to materially and adversely differ from such statements. Such risks, uncertainties, and other factors include, but are not necessarily limited to, those set forth in the Risk Factors section of the Company’s annual report on Form 20-F for the fiscal year ended December 31, 2020 filed on May 17, 2021 with the Securities and Exchange Commission (SEC). Copies are of such documents are available on the SEC’s website, www.sec.gov. IEC undertakes no obligation to update these statements for revisions or changes after the date of this release, except as required by law.

Company Contact:
Frank C. Ingriselli
President, Indonesia Energy Corporation Limited
Frank.Ingriselli@Indo-Energy.com

SOURCE: Indonesia Energy Corporation Limited

Release – Capstone Green Energy CEO Darren Jamison To Participate In Water Tower Research Fireside Chat Series


Capstone Green Energy CEO, Darren Jamison, To Participate In Water Tower Research Fireside Chat Series


Webcast to Be Held on Thursday, July 22, 2021 at 12:00 PM PT / 3:00 PM ET

VAN NUYS, CA / ACCESSWIRE / July 20, 2021 / Capstone Green Energy Corporation (www.CapstoneGreenEnergy.com) (NASDAQ:CGRN) formerly Capstone Turbine Corporation (www.capstoneturbine.com) (NASDAQ:CPST) (“Capstone” or the “Company”), a global partner in carbon reduction and on-site resilient green energy solutions, will be participating in the Water Tower Research Virtual Fireside Chat Series on Thursday, July 22, 2021, at 12:00 PM PT / 3:00 PM ET. The topic will be “An Update on Strategic Initiatives.” Registration for the live event is limited, but the presentation may be accessed at any time after the event for replay.

Darren Jamison, Capstone Green Energy’s President and Chief Executive Officer, will participate in the Fireside Chat Series hosted by Shawn Severson, Head of ClimateTech and Sustainable Investing at Water Tower Research.

The topic of the Fireside Chat is a review and update on the Company’s strategic initiatives surrounding its recent transformation and expansion to provide more comprehensive microgrid solutions for customers.

Capstone Green Energy’s four business lines are:

  • Energy as a Service (EaaS) through its industry-leading Factory Protection Plan (FPP) service program, microturbine rental fleet, and Distributor Support System (DSS).
  • Energy Conversion Products via its existing microturbine products and additional energy conversion and storage products, including Baker Hughes industrial gas turbines.
  • Energy Storage Products, which will begin to manufacture modular hybrid energy stations and lithium-ion battery energy storage systems (BESS) to be sold individually or combined as part of a custom microturbine battery storage solution.
  • Hydrogen Solutions, which will focus on expanding the Company’s capability to use hydrogen as a fuel in its gas microturbines with a development roadmap to 100% hydrogen.

The presentation is open to all investors and will be webcast live and available for replay by visiting the Investor Relations section of the Company’s website at www.CapstoneGreenEnergy.com and on the Water Tower Research website at www.watertowerresearch.com.

Investors interested in participating in this event must register using the link below. As a reminder, registration for the live event is limited, but the presentation may be accessed at any time after the event for replay.

REGISTER HERE

About Capstone Green Energy

Capstone Green Energy (www.CapstoneGreenEnergy.com) (NASDAQ:CGRN) is a leading provider of customized microgrid solutions and on-site energy technology systems focused on helping customers around the globe meet their environmental, energy savings, and resiliency goals. Capstone Green Energy focuses on four key business lines. Through its Energy as a Service (EaaS) business, it offers rental solutions utilizing its microturbine energy systems and battery storage systems, comprehensive Factory Protection Plan (FPP) service contracts that guarantee life-cycle costs, as well as aftermarket parts. Energy Conversion Products are driven by the Company’s industry-leading, highly efficient, low-emission, resilient microturbine energy systems offering scalable solutions in addition to a broad range of customer-tailored solutions, including hybrid energy systems and larger frame industrial turbines. The Energy Storage Products business line designs and installs microgrid storage systems creating customized solutions using a combination of battery technologies and monitoring software. Through Hydrogen Energy Solutions, Capstone Green Energy offers customers a variety of hydrogen products, including the Company’s microturbine energy systems.

For customers with limited capital or short-term needs, Capstone offers rental systems; for more information, contact: rentals@CGRNenergy.com. To date, Capstone has shipped over 10,000 units to 83 countries and estimates that, in FY21, it saved customers over $217 million in annual energy costs and approximately 397,000 tons of carbon. Total savings over the last three years are estimated at 1,115,100 tons of carbon and $698 million in annual energy savings.

For more information about the Company, please visit www.CapstoneGreenEnergy.com. Follow Capstone Green Energy on TwitterLinkedInInstagramFacebook, and YouTube.

Cautionary Note Regarding Forward-Looking Statements

This release contains forward-looking statements as defined in the Private Securities Litigation Reform Act of 1995, including statements regarding expectations for green initiatives and execution on the Company’s growth strategy and other statements regarding the Company’s expectations, beliefs, plans, intentions, and strategies. The Company has tried to identify these forward-looking statements by using words such as “expect,” “anticipate,” “believe,” “could,” “should,” “estimate,” “intend,” “may,” “will,” “plan,” “goal” and similar terms and phrases, but such words, terms and phrases are not the exclusive means of identifying such statements. Actual results, performance and achievements could differ materially from those expressed in, or implied by, these forward-looking statements due to a variety of risks, uncertainties and other factors, including, but not limited to, the following: the ongoing effects of the COVID-19 pandemic; the availability of credit and compliance with the agreements governing the Company’s indebtedness; the Company’s ability to develop new products and enhance existing products; product quality issues, including the adequacy of reserves therefor and warranty cost exposure; intense competition; financial performance of the oil and natural gas industry and other general business, industry and economic conditions; the Company’s ability to adequately protect its intellectual property rights; and the impact of pending or threatened litigation. For a detailed discussion of factors that could affect the Company’s future operating results, please see the Company’s filings with the Securities and Exchange Commission, including the disclosures under “Risk Factors” in those filings. Except as expressly required by the federal securities laws, the Company undertakes no obligation to update or revise any forward-looking statements, whether as a result of new information, changed circumstances or future events or for any other reason.

CONTACT:
Capstone Green Energy
Investor and investment media inquiries:
818-407-3628
ir@CGRNenergy.com

SOURCE: Capstone Green Energy Corporation

Release – Endeavour Silver Signs Agreement To Acquire Bruner Gold Project In Nye County Nevada


Endeavour Silver Signs Agreement To Acquire Bruner Gold Project In Nye County, Nevada


VANCOUVER, British Columbia, July 19, 2021 (GLOBE NEWSWIRE) — Endeavour Silver Corp. (TSX: EDR, NYSE: EXK) announces it has entered into a definitive agreement (the “Agreement”) with Canamex Gold Corp. to acquire a 100% interest in Canamex’ Bruner Property, a gold exploration, located in Nye County, Nevada approximately 180 kilometres (km) southeast of Reno for US$10 million in cash.

Gold was originally discovered at Bruner in 1906 and the district saw intermittent historic small-scale mining between 1906 and 1998. Recent exploration activities by previous operators included mapping, sampling, geophysical surveys and drilling, culminating in a mineral resource estimate in 2015 and a preliminary economic assessment in 2017 outlining a low capital cost, open pit, heap leach mine operation.

Highlights of the Properties:

  • Acquiring a 100% interest totalling 1,457 hectares on patented and unpatented claims, subject to pre-existing NSR royalties, some of which can be repurchased.

  • Ideally located within Nevada’s Walker Lane northwest trending mineral belt currently hosting several producing mines and recent discoveries.

  • Readily accessible by paved highway and gravel roads only 25 km from the town of Gabbs, Nevada. High voltage power is available approximately 30 km from the project and water rights have been secured.

  • Favourable geology with gold and silver occurring in low-sulphidation epithermal veins and in disseminations within sheeted and stockwork zones. Three gold areas have been outlined within a broad 3 km zone of anomalous gold values.

  • Historic resources of 342,000 ounces of gold contained in 17.5 million tonnes grading 0.61 grams per tonne in three zones, Paymaster, HRA and Penelas, as estimated by Canamex Gold. Endeavour has not verified this historic resource estimate and is not relying on it. See below for historic resource estimate qualifications.

  • Strong potential to discover additional gold and silver mineralization amenable to open pit mining, as shown by surface sampling between Paymaster, HRA and Penelas zones.

  • Excellent metallurgy – cyanide leach test results show that each mineralized zone has gold recoveries > 85% for 0.75” to 3.0” crush size with potential for run-of-mine leaching.

  • Provides diversification with an advanced stage exploration project in Nevada, USA, a world class, stable mining jurisdiction.

Endeavour CEO, Dan Dickson, commented “We are pleased to add an advanced stage precious metals exploration property to our project pipeline. Bruner represents a good start on building an attractive gold-silver portfolio in Nevada and should be an accretive acquisition for our five-year strategic plan to become a premier senior silver producer, with potential for exploration discoveries, district acquisitions, near-term production, and organic growth.

“Our exploration team will focus initially on verifying the historic resources, then turn its attention to the many exploration targets on the Bruner Property. We look forward to unlocking the full potential of the Bruner Property with the goal of building a new mining operation in another historic mining district in Nevada.”

Transaction Summary

Pursuant to the Agreement, Endeavour will pay US$10 million in cash for 100% of the Bruner Gold Project which includes mineral claims, mining rights, property assets, water rights, and government authorizations and permits. Completion of the transactions under the Agreement is subject to customary closing conditions and is subject to Canamex shareholder approval.

The Bruner Gold Project resource estimate was prepared for Canamex Gold in a technical report dated January 22, 2018 titled “NI 43-101 Technical Report on the Bruner Gold Project, Updated Preliminary Economic Assessment, Nye County, Nevada, USA” by Welsh Hagen Associates. The resource estimate was established through surface drilling. A Qualified Person has not done sufficient work to classify the historical estimate as a current mineral resource or mineral reserve.

Endeavour is not treating the historical estimate as a current mineral resource or mineral reserve, has not verified the historical resource estimate and is not relying on it. Endeavour plans to “twin” certain drill holes and conduct a drilling program to upgrade the historical estimate as a current mineral resource.

Dale Mah, B.Sc., P.Geo., Endeavour’s Vice President Corporate Development, is the Qualified Person who reviewed and approved this news release.

About Endeavour Silver – Endeavour Silver Corp. is a mid-tier precious metals mining company that owns and operates three high-grade, underground, silver-gold mines in Mexico. Endeavour is currently advancing the Terronera mine project towards a development decision and exploring its portfolio of exploration and development projects in Mexico and Chile to facilitate its goal to become a premier senior silver producer.  Our philosophy of corporate social integrity creates value for all stakeholders.

SOURCE Endeavour Silver Corp.

SOURCE Endeavour Silver Corp.

Contact Information:
Galina Meleger, Director, Investor Relations
Toll free: (877) 685-9775
Tel: (604) 640-4804
Email: gmeleger@edrsilver.com
Website: www.edrsilver.com

Follow Endeavour Silver on Facebook, Twitter, Instagram and LinkedIn

Cautionary Note Regarding Forward-Looking Statements

This news release contains “forward-looking statements” within the meaning of the United States private securities litigation reform act of 1995 and “forward-looking information” within the meaning of applicable Canadian securities legislation. Such forward-looking statements concern the Company’s strategic plans, completion of the Bruner Gold Project acquisition, timing and expectations for the Company’s exploration and drilling programs, estimates of mineralization from drilling, geological information projected from sampling results and the potential quantities and grades of the target zones. Such forward-looking statements or information are based on a number of assumptions, which may prove to be incorrect. Assumptions have been made regarding, among other things: the completion of the Bruner Gold Project acquisition, receipt of shareholder approval by Canamex; conditions in general economic and financial markets; accuracy of assay results; geological interpretations from drilling results, timing and amount of capital expenditures; performance of available laboratory and other related services; future operating costs; and the historical basis for current estimates of potential quantities and grades of target zones. The actual results could differ materially from those anticipated in these forward-looking statements as a result of the risk factors including: satisfaction of closing conditions for the Bruner Gold Project acquisition, receipt of shareholder approval by Canamex; the timing and content of work programs; results of exploration activities and development of mineral properties; the interpretation and uncertainties of drilling results and other geological data; receipt of title opinion on the Bruner Property, maintenance and security of permits and mineral property titles; environmental and other regulatory risks; project costs overruns or unanticipated costs and expenses; availability of funds; failure to delineate potential quantities and grades of the target zones based on historical data, and general market and industry conditions. Forward-looking statements are based on the expectations and opinions of the Company’s management on the date the statements are made. The assumptions used in the preparation of such statements, although considered reasonable at the time of preparation, may prove to be imprecise and, as such, readers are cautioned not to place undue reliance on these forward-looking statements, which speak only as of the date the statements were made. The Company undertakes no obligation to update or revise any forward-looking statements included in this news release if these beliefs, estimates and opinions or other circumstances should change, except as otherwise required by applicable law.

Source: Endeavour Silver Corporation