Palladium One Drills Haukiaho Trend, Intercepts 72 Meters @ 1.8 g/t Palladium-Equivalent, Finland


Palladium One Drills Haukiaho Trend, Intercepts 72 Meters @ 1.8 g/t Palladium-Equivalent, Finland


May 26, 2021 – Toronto, Ontario – First drill results from the Company’s 2,000 meter drill program at Haukiaho, a zone approximately 20 kilometers south of the Company’s primary target area Kaukua South, have returned  significant widths and grades, including 72 meters at 1.8 g/t Palladium-equivalent “Pd_Eq”) (Hole LK21-071), on the Läntinen Koillismaa “LK”) PGE-Ni-Cu project in Finland, said Palladium One Mining Inc. “Palladium One” or the “Company”) (TSXV: PDM, FRA: 7N11, OTC: NKORF) today.

A total of 12 holes (1,943 metres) were drilled on the Haukiaho trend. This release contains the results from the first 7 holes of this program. The drilling was designed establish sufficient drill density to prepare a National Instrument 43-101 resource estimate at Haukiaho, which the Company anticipates completing in Q3 2021.

“Establishing a NI43-101 resource estimate at Haukiaho has been a priority for the Company given the robust historical data set available to the Company. Haukiaho was the original focus of the Phase I drill program in 2020, however, the discovery of Kaukua South led us towards first defining the potential of this new discovery and exploring the greater Kaukua area.  Despite this, Haukiaho was not forgotten and has remained an important part of our strategy to grow a multi-million ounce resource base. At 17 kilometers in length, the Haukiaho trend, currently represents the largest continuous patch of blue-sky potential on the LK property.” said Derrick Weyrauch, President and CEO.

Highlights

  • Drilling has returned significant widths and grades
  • Expanded higher grade areas within the known historic Haukiaho resource area
  • Expanded mineralization 100m to east of the historic resource
  • 72.2 meters grading 1.79 g/t Pd_Eq in hole LK21-071 starting 56m down hole, including 17.0 meters grading 2.23 g/t Pd_Eq
  • 15.7 meters grading 2.26 g/t Pd_Eq in hole LK21-069 including 3.6 meters grading 3.11 g/t Pd_Eq
  • 51.2 meters grading 1.07 g/t Pd_Eq in hole LK21-073 including 9.1 meters grading 2.10 g/t Pd_Eq
  • The historic Haukiaho resource is shallowly drilled, mostly above 200m in depth and therefore amendable to open pit mining

Haukiaho Historic Resource Estimate

In the 1980’s, Outokumpu  (a Finnish State-run mining company) prepared a resource estimate using very widely spaced holes along a portion of the Haukiaho trend, which estimated 7 million tonnes grading 0.38% Cu and 0.24% Ni, however importantly, no PGE assays were undertaken. The cut-off grade used was a 0.7% Copper_equivalent (defined as Cu% + 2 x Ni%).

Subsequently in 2013, Finore Mining Inc. completed a non-pit constrained NI43-101 historic resource estimate, over a much smaller strike length.  Using  a 0.1 g/t Pd cut-off, they estimated a resource of 1.13 million Pd_Eq ounces within 23.2 million tonnes grading 1.51 g/t Pd_Eq (0.31 g/t Pd, 0.12g/t Pt, 0.10 g/t Au, 0.21% Cu, and 0.14% Ni) (See news release August 12, 2019 and May 7, 2020).  This resource estimate encompassed widely spaced drilling with a focus on maximizing tonnage, not grade.

The Haukiaho trend is 17 kilometers long and the historic 2013 Haukiaho resource prepared by Finore covers less than 2 kilometers of this trend.  This knowledge coupled with the historic work by Outokumpu point to the enormous potential to significantly add resources at Haukiaho with disciplined execution of exploration activities.

While similar to the Kaukua deposit (See new release, September 30, 2019), the Haukiahio trend is more copper-nickel rich.  At Kaukua, approximately ~1/3 of the in-situ value per tonne is copper-nickel, while at Haukiaho copper-nickel represent approximately ~2/3s of the in-situ value.

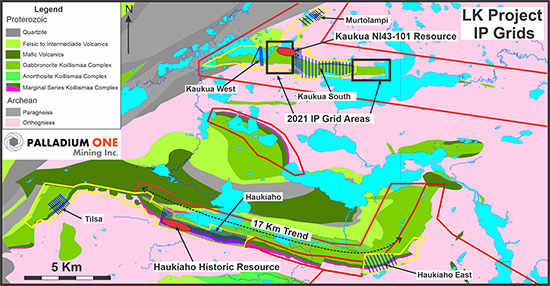
Figure 1. LK Project location map showing 43-101 compliant Kaukua deposit and historic Haukiaho resource along with 2020 IP grids (blue lines) and current 2021 IP grid areas (black boxes). Yellow lines represent Exploration Permits, red lines represent Exploration Reservations held by the Company.

Figure 2. Plan map of Haukiaho 2020 IP chargeability anomalies and Palladium One drill holes locations.

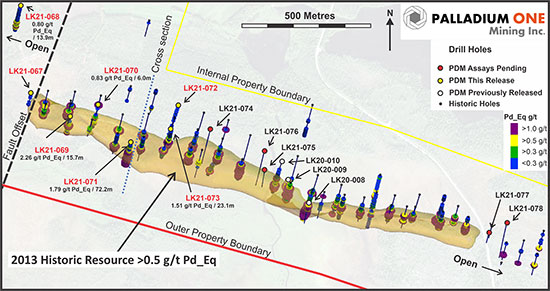
Figure 3. Plan map of the Haukiaho historic 2013 Finore resource estimate represented by the > 0.5g/t Pd_Eq resource shape with Palladium One drill holes.

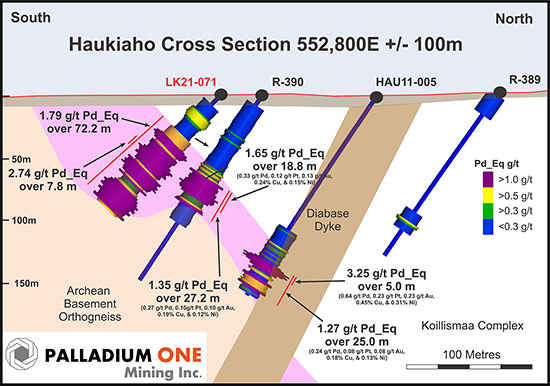
Figure 4. Haukiaho Cross section showing holes LK21-071, Finore hole HAU11-005, and geological survey of Finland (GTK) holes R-390 and R-389.

Table 1: Palladium One Haukiaho drill results

Hole

From
(m)

To
(m)

Width
(m)

Pd_Eq
g/t*

Pd
g/t

Pt
g/t

Au
g/t

Cu
%

Ni
%

LK20-008

17.3

33.5

16.2

1.99

0.38

0.15

0.14

0.26

0.20

Inc.

20.3

23.3

3.0

2.55

0.48

0.19

0.22

0.33

0.25

LK20-009

161.5

168.1

6.6

2.34

0.47

0.20

0.13

0.26

0.25

LK20-010

118.7

202.0

83.3

1.27

0.24

0.09

0.05

0.12

0.16

Inc.

166.8

201.0

34.3

2.09

0.47

0.20

0.10

0.20

0.22

Inc.

167.8

173.0

5.3

3.08

0.66

0.25

0.20

0.38

0.30

Inc.

20.3

23.3

3.0

2.55

0.48

0.19

0.22

0.33

0.25

LK21-067

No Significant values (collared in footwall rocks)

LK21-068

81.5

122.0

40.6

0.65

0.05

0.02

0.02

0.04

0.11

Inc.

106.2

120.0

13.9

0.80

0.12

0.05

0.02

0.06

0.12

Inc.

106.2

112.7

6.6

0.91

0.13

0.05

0.03

0.09

0.13

LK21-069

48.5

64.1

15.7

2.26

0.47

0.18

0.18

0.27

0.22

Inc.

48.5

60.0

11.6

2.53

0.52

0.19

0.18

0.30

0.25

Inc.

48.5

52.0

3.6

3.11

0.60

0.22

0.23

0.37

0.32

LK21-070

103.5

131.0

27.5

0.65

0.01

0.00

0.02

0.04

0.12

Inc.

113.0

119.0

6.0

0.83

0.02

0.00

0.04

0.09

0.14

LK21-071

55.8

128.0

72.2

1.79

0.37

0.15

0.14

0.22

0.17

Inc.

72.0

77.0

5.0

2.33

0.53

0.21

0.18

0.27

0.22

Inc.

74.0

75.5

1.5

3.20

0.75

0.29

0.23

0.39

0.29

And

86.2

94.0

7.8

2.74

0.53

0.21

0.23

0.32

0.27

And

111.0

128.0

17.0

2.23

0.53

0.21

0.18

0.28

0.18

Inc.

112.5

118.0

5.5

2.84

0.64

0.25

0.23

0.36

0.25

LK21-072

No Significant values (ended before zone)

LK21-073

75.8

127.0

51.2

1.07

0.15

0.06

0.06

0.13

0.13

Inc.

90.0

113.1

23.1

1.51

0.25

0.10

0.10

0.21

0.16

Inc.

90.8

99.9

9.1

2.10

0.37

0.15

0.16

0.27

0.21

Inc.

98.0

99.0

1.0

3.21

0.61

0.27

0.29

0.47

0.28

LK21-074

Pending

LK21-075

Pending

LK21-076

Pending

LK21-077

Pending

LK21-078

Pending

* Reported widths are “drilled widths” not true widths.
**Italicised orange highlighted results are previously released results see news release September 15, 2020

*Palladium Equivalent
Palladium equivalent is calculated using US$1,100 per ounce for palladium, US$950 per ounce for platinum, US$1,300 per ounce for gold, US$6,614 per tonne for copper, and US$15,4332 per tonne for nickel. This calculation is consistent with the calculation in the Company’s September 2019 NI 43-101 Kaukua resource estimate. Additionally, US$1,100 per ounce for palladium is consistent with the UBS January 2021 long-term consensus price forecast even though the current price of palladium is approximately US$2,800 per ounce.

QA/QC
The Phase I drilling program was carried out under the supervision of Neil Pettigrew, M.Sc., P. Geo., Vice President of Exploration and a director of the Company.

Drill core samples were split using a rock saw by Company staff, with half retained in the core box and stored indoors in a secure facility, in Taivalkoski, Finland. The drill core samples were transported by courier from the Company’s core handling facility in Taivalkoski, Finland, to ALS Global “ALS”) laboratory in Outokumpu, Finland. ALS, is an accredited lab and are ISO compliant (ISO 9001:2008, ISO/IEC 17025:2005). PGE analysis was performed using a 30 grams fire assay with an ICP-MS or ICP-AES finish. Multi-element analyses, including copper and nickel were analysed by four acid digestion using 0.25 grams with an ICP-AES finish.

Certified standards, blanks and crushed duplicates are placed in the sample stream at a rate of one QA/QC sample per 10 core samples. Results are analyzed for acceptance at the time of import. All standards associated with the results in this press release were determined to be acceptable within the defined limits of the standard used.

Qualified Person
The technical information in this release has been reviewed and verified by Neil Pettigrew, M.Sc., P. Geo., Vice President of Exploration and a director of the Company and the Qualified Person as defined by National Instrument 43-101.

About Palladium One
Palladium One Mining Inc. is an exploration company targeting district scale, platinum-group-element (PGE)-copper nickel deposits in Finland and Canada. Its flagship project is the Läntinen Koillismaa or LK Project, a palladium dominant platinum group element-copper-nickel project in north-central Finland, ranked by the Fraser Institute as one of the world’s top countries for mineral exploration and development. Exploration at LK is focused on targeting disseminated sulfides along 38 kilometers of favorable basal contact and building on an established NI 43-101 open pit resource.

ON BEHALF OF THE BOARD
“Derrick Weyrauch”
President & CEO, Director

For further information contact: Derrick Weyrauch, President & CEO
Email: info@palladiumoneinc.com

Neither the TSX Venture Exchange nor its Market Regulator (as that term is defined in the policies of the TSX Venture Exchange) accepts responsibility for the adequacy or accuracy of this release.

This press release includes “forward-looking information” that is subject to a few assumptions, risks and uncertainties, many of which are beyond the control of the Company. Statements regarding listing of the Company’s common shares on the TSXV are subject to all of the risks and uncertainties normally incident to such events. Investors are cautioned that any such statements are not guarantees of future events and that actual events or developments may differ materially from those projected in the forward-looking statements. Such forward-looking statements represent management’s best judgment based on information currently available. Factors that could cause the actual results to differ materially from those in forward-looking statements include regulatory actions and general business conditions. Such forward-looking information reflects the Company’s views with respect to future events and is subject to risks, uncertainties and assumptions, including those set out in the Company’s annual information form dated April 29, 2020 and filed under the Company’s profile on SEDAR at www.sedar.com. The Company does not undertake to update forward?looking statements or forward?looking information, except as required by law. Investors are cautioned that any such statements are not guarantees of future performance and actual results or developments may differ materially from those projected in the forward-looking statements.

Release – PLBY Group Announces Successful Completion of Debt Refinancing


PLBY Group Announces Successful Completion of Debt Refinancing


LOS ANGELES, May 25, 2021 (GLOBE NEWSWIRE) — PLBY Group, Inc. (NASDAQ: PLBY) (“PLBY Group” or the “Company”), a leading pleasure and leisure lifestyle company and owner of Playboy, one of the most recognizable and iconic brands in the world, today announced the successful completion of the refinancing of their existing credit facility through a $160 million senior secured term loan maturing in May 2027.

The new term loan will accrue interest at LIBOR plus 5.75%, with a single step-down to LIBOR plus 5.25% upon achieving gross leverage of 3.0x, subject to a LIBOR floor of 0.5%. The debt refinancing is expected to result in an estimated $3 million in annual interest expense savings, reduce amortization by over $3 million annually, and eliminate over $7 million in annual excess cash flow sweep payments. The refinancing also allows the Company to request to borrow at least $30 million of additional incremental term loans, and the Company may borrow unlimited additional amounts of pari passu debt as long as its senior secured leverage ratio is below 4.75x.

“We are pleased to further strengthen our financial flexibility by refinancing our existing facility with a new term loan that should reduce our annual debt service by over $13 million and which provides a defined path for additional borrowing to fund M&A,” said Lance Barton, Chief Financial Officer of PLBY Group. “Following the strength of our first quarter results, we are well-positioned to execute on both our organic and M&A growth initiatives and build upon our incredible global brand.”

About PLBY Group, Inc.
PLBY Group connects consumers around the world with products, services, and experiences to help them look good, feel good, and have fun. PLBY Group serves consumers in four major categories: Sexual Wellness, Style & Apparel, Gaming & Lifestyle, and Beauty & Grooming. PLBY Group’s flagship consumer brand, Playboy, is one of the most recognizable, iconic brands in the world, driving billions of dollars in consumer spending annually across 180 countries. Learn more at http://www.plbygroup.com.

Forward-Looking Statements
This press release includes “forward-looking statements” within the meaning of the “safe harbor” provisions of the United States Private Securities Litigation Reform Act of 1995. The Company’s actual results may differ from their expectations, estimates, and projections and, consequently, you should not rely on these forward-looking statements as predictions of future events. Words such as “expect,” “estimate,” “project,” “budget,” “forecast,” “anticipate,” “intend,” “plan,” “may,” “will,” “could,” “should,” “believes,” “predicts,” “potential,” “continue,” and similar expressions (or the negative versions of such words or expressions) are intended to identify such forward-looking statements. These forward-looking statements include, without limitation, the Company’s expectations with respect to future performance, growth plans and anticipated financial impacts of the Company’s recent business combination and its acquisitions.

These forward-looking statements involve significant risks and uncertainties that could cause the actual results to differ materially from those discussed in the forward-looking statements. Factors that may cause such differences include, but are not limited to: (1) the impact of COVID-19 pandemic on the Company’s business; (2) the inability to maintain the listing of the Company’s shares of common stock on Nasdaq; (3) the risk that the business combination, recent acquisitions or any proposed transactions disrupt the Company’s current plans and operations, including the risk that the Company does not complete any such proposed transactions or achieve the expected benefits from them; (4) the ability to recognize the anticipated benefits of the business combination, which may be affected by, among other things, competition, the ability of the Company to grow and manage growth profitably, and retain its key employees; (5) costs related to the business combination, acquisitions and proposed transactions; (6) changes in applicable laws or regulations; (7) the possibility that the Company may be adversely affected by other economic, business, and/or competitive factors; (8) risks relating to the uncertainty of the projected financial information of the Company; (9) risks related to the organic and inorganic growth of the Company’s business and the timing of expected business milestones; and (10) other risks and uncertainties indicated from time to time in the Company’s annual report on Form 10-K, including those under “Risk Factors” therein, and in the Company’s other filings with the Securities and Exchange Commission. The Company cautions that the foregoing list of factors is not exclusive, and readers should not place undue reliance upon any forward-looking statements, which speak only as of the date which they were made. The Company does not undertake any obligation to update or revise any forward-looking statements to reflect any change in its expectations or any change in events, conditions, or circumstances on which any such statement is based.

Contact:

Investors: investors@plbygroup.com
Media: press@plbygroup.com

Release – Ceapro Inc. Announces Completion of Patient Enrollment in Clinical Study Evaluating Beta Glucan as a Cholesterol-Lowering Agent


Ceapro Inc. Announces Completion of Patient Enrollment in Clinical Study Evaluating Beta Glucan as a Cholesterol-Lowering Agent


– Clinical study evaluating the well-known health claims of beta glucan and its potentially beneficial approach for patients to lower plasma cholesterol –

– Study conducted in collaboration with the Montreal Heart Institute and led by MHI’s Montreal Health Innovations Coordinating Center (MHICC) –

– Topline data readout expected Q4 2021 –

EDMONTON, Alberta, May 26, 2021 (GLOBE NEWSWIRE) —  Ceapro Inc. (TSX-V: CZO) (“Ceapro” or the “Company”), a growth-stage biotechnology company focused on the development and commercialization of active ingredients for healthcare and cosmetic industries, today announced the completion of patient enrollment in its comparison study evaluating high-medium molecular weight beta glucan as a stand-alone or add-on therapy to statins (the “BetAvena study”) in subjects with hyperlipidemia.

The study is being conducted with the Montreal Heart Institute (MHI), led by Dr. Jean-Claude Tardif, Director of the Montreal Heart Institute Research Center and Principal Investigator for this clinical trial as part of a long-term collaboration.

“We are incredibly pleased with the flawless execution of this important clinical study, despite challenges posed by the COVID-19 pandemic. We are extremely grateful to Dr. Jean-Claude Tardif and his expert team at the Montreal Heart Institute and their dedication to getting this study across the finish line and providing the opportunity to assess and validate the well-known health benefits of beta glucan per the highest clinical practice standards. The amended protocol that we were granted for the study expanded our target addressable patient population, which provided both scientific and clinical value and aided in successfully completing patient enrollment. This is a major milestone for our Company as we expand as a biopharmaceutical company and we look forward to reporting topline data in the fourth quarter of this year,” stated Gilles Gagnon, M.Sc., MBA, President and CEO.

“With patient enrollment now complete, our team is focused on advancing this potential alternative treatment forward and bring the study to successful completion. Pending statistical review, the BetAvena study may represent a significant shift for the patient community hoping to achieve hyperlipidemia control with nutraceuticals such as Ceapro’s CP105F. We are impressed by the engagement of our clinical sites and our patients who had to compose with very difficult COVID circumstances,” added Dr. Tardif.

This multicenter, randomized, double-blind, parallel group, placebo-controlled study is conducted to determine the efficacy and safety of high-medium molecular weight beta glucan in subjects with hyperlipidemia (LDL-C level >130 mg/d L (3.37 mmol/L). The 18 to 24-month study enrolled approximately 264 subjects who cannot tolerate high doses of current treatments. The Company received approval from Health Canada in February 2020 to expand the inclusion criteria of the study to allow evaluation of enrolled subjects with confirmed pathophysiological condition of hyperlipidemia who voluntarily request to be treated with beta glucan only, without regular dosing of statins. Enrolled patients were randomized to receive either placebo, low, medium or high doses of beta glucan (500 mg tablet) as add-on therapy, or not, to atorvastatin 10 mg – 20 mg or an equivalent statin for a 12-week treatment period. The primary efficacy endpoint of the study is the change over 12 weeks in LDL-cholesterol.

The Company anticipates the statistical analysis to be completed this fall and subsequently submitted to Heath Canada. The Company expects to report topline data from the study in the fourth quarter of 2021.

About Ceapro Inc.

Ceapro Inc. is a Canadian biotechnology company involved in the development of proprietary extraction technology and the application of this technology to the production of extracts and “active ingredients” from oats and other renewable plant resources. Ceapro adds further value to its extracts by supporting their use in cosmeceutical, nutraceutical, and therapeutics products for humans and animals. The Company has a broad range of expertise in natural product chemistry, microbiology, biochemistry, immunology and process engineering. These skills merge in the fields of active ingredients, biopharmaceuticals and drug-delivery solutions. For more information on Ceapro, please visit the Company’s website at www.ceapro.com.

For more information contact:

Jenene Thomas
JTC Team, LLC
Investor Relations and Corporate Communications Advisor
T (US): +1 (833) 475-8247
E: czo@jtcir.com

Issuer:
Gilles R. Gagnon, M.Sc., MBA
President & CEO
T: 780-421-4555

Neither TSX Venture Exchange nor its Regulation Services Provider (as that term is defined in the policies of the TSX Venture Exchange) accepts responsibility for the adequacy or accuracy of this release


Source: Ceapro Inc.

Garibaldi Resources Corp (GGIFF)(GGI:CA) – More Than Meets the Eye

Wednesday, May 26, 2021

Garibaldi Resources Corp (GGIFF)(GGI:CA)
More Than Meets the Eye

Garibaldi Resources Corp is a Canadian-based junior exploration company. It is engaged in the acquisition, exploration, and evaluation of mineral properties located in Canada and Mexico. The company’s projects in Mexico include the La Patilla, the Rodadero, the Tonichi and the Iris project. Its projects in Canada include the PSP and King projects, The Cariboo Copper and Gold project, the Red Lion project, the Grizzly project, the Tora Tora project and the Black Gold project.

Mark Reichman, Senior Research Analyst of Natural Resources, Noble Capital Markets, Inc.

Refer to the full report for the price target, fundamental analysis, and rating.

    Initiating coverage. Garibaldi Resources offers exposure to a base and precious metals exploration company with over 180 square kilometers of mining claims in the mineral rich Eskay Camp in northwest British Columbia. The company’s flagship E&L Nickel Mountain project represents the first magmatic nickel-copper-cobalt-PGE-rich massive sulphide system identified in the Eskay Camp. The company is advancing the Casper discovery, a gold vein that is 12 kilometers northwest of Nickel Mountain. Garibaldi also has a promising portfolio of base and precious metal focused projects in Mexico. Because the drilling season in British Columbia is short due to weather constraints, the properties in Mexico enable the company to remain engaged year-round.

    Potential value creation opportunities.  While the properties in Mexico enhance the diversity of Garibaldi’s asset portfolio in terms of geography and metals mix, they may offer a source of value creation through sale, joint venture, or option agreements. We think management may consider streamlining its holdings and restructure its base and precious metals claims in British Columbia into two …


    Get The Full Report

This Company Sponsored Research is provided by Noble Capital Markets, Inc., a FINRA and S.E.C. registered broker-dealer (B/D).

*Analyst certification and important disclosures included in the full report. NOTE: investment decisions should not be based upon the content of this research summary.  Proper due diligence is required before making any investment decision. 

Release – Palladium One Drills Haukiaho Trend Intercepts 72 Meters


Palladium One Drills Haukiaho Trend, Intercepts 72 Meters @ 1.8 g/t Palladium-Equivalent, Finland


May 26, 2021 – Toronto, Ontario – First drill results from the Company’s 2,000 meter drill program at Haukiaho, a zone approximately 20 kilometers south of the Company’s primary target area Kaukua South, have returned  significant widths and grades, including 72 meters at 1.8 g/t Palladium-equivalent “Pd_Eq”) (Hole LK21-071), on the Läntinen Koillismaa “LK”) PGE-Ni-Cu project in Finland, said Palladium One Mining Inc. “Palladium One” or the “Company”) (TSXV: PDM, FRA: 7N11, OTC: NKORF) today.

A total of 12 holes (1,943 metres) were drilled on the Haukiaho trend. This release contains the results from the first 7 holes of this program. The drilling was designed establish sufficient drill density to prepare a National Instrument 43-101 resource estimate at Haukiaho, which the Company anticipates completing in Q3 2021.

“Establishing a NI43-101 resource estimate at Haukiaho has been a priority for the Company given the robust historical data set available to the Company. Haukiaho was the original focus of the Phase I drill program in 2020, however, the discovery of Kaukua South led us towards first defining the potential of this new discovery and exploring the greater Kaukua area.  Despite this, Haukiaho was not forgotten and has remained an important part of our strategy to grow a multi-million ounce resource base. At 17 kilometers in length, the Haukiaho trend, currently represents the largest continuous patch of blue-sky potential on the LK property.” said Derrick Weyrauch, President and CEO.

Highlights

  • Drilling has returned significant widths and grades
  • Expanded higher grade areas within the known historic Haukiaho resource area
  • Expanded mineralization 100m to east of the historic resource
  • 72.2 meters grading 1.79 g/t Pd_Eq in hole LK21-071 starting 56m down hole, including 17.0 meters grading 2.23 g/t Pd_Eq
  • 15.7 meters grading 2.26 g/t Pd_Eq in hole LK21-069 including 3.6 meters grading 3.11 g/t Pd_Eq
  • 51.2 meters grading 1.07 g/t Pd_Eq in hole LK21-073 including 9.1 meters grading 2.10 g/t Pd_Eq
  • The historic Haukiaho resource is shallowly drilled, mostly above 200m in depth and therefore amendable to open pit mining

Haukiaho Historic Resource Estimate

In the 1980’s, Outokumpu  (a Finnish State-run mining company) prepared a resource estimate using very widely spaced holes along a portion of the Haukiaho trend, which estimated 7 million tonnes grading 0.38% Cu and 0.24% Ni, however importantly, no PGE assays were undertaken. The cut-off grade used was a 0.7% Copper_equivalent (defined as Cu% + 2 x Ni%).

Subsequently in 2013, Finore Mining Inc. completed a non-pit constrained NI43-101 historic resource estimate, over a much smaller strike length.  Using  a 0.1 g/t Pd cut-off, they estimated a resource of 1.13 million Pd_Eq ounces within 23.2 million tonnes grading 1.51 g/t Pd_Eq (0.31 g/t Pd, 0.12g/t Pt, 0.10 g/t Au, 0.21% Cu, and 0.14% Ni) (See news release August 12, 2019 and May 7, 2020).  This resource estimate encompassed widely spaced drilling with a focus on maximizing tonnage, not grade.

The Haukiaho trend is 17 kilometers long and the historic 2013 Haukiaho resource prepared by Finore covers less than 2 kilometers of this trend.  This knowledge coupled with the historic work by Outokumpu point to the enormous potential to significantly add resources at Haukiaho with disciplined execution of exploration activities.

While similar to the Kaukua deposit (See new release, September 30, 2019), the Haukiahio trend is more copper-nickel rich.  At Kaukua, approximately ~1/3 of the in-situ value per tonne is copper-nickel, while at Haukiaho copper-nickel represent approximately ~2/3s of the in-situ value.

Figure 1. LK Project location map showing 43-101 compliant Kaukua deposit and historic Haukiaho resource along with 2020 IP grids (blue lines) and current 2021 IP grid areas (black boxes). Yellow lines represent Exploration Permits, red lines represent Exploration Reservations held by the Company.

Figure 2. Plan map of Haukiaho 2020 IP chargeability anomalies and Palladium One drill holes locations.

Figure 3. Plan map of the Haukiaho historic 2013 Finore resource estimate represented by the > 0.5g/t Pd_Eq resource shape with Palladium One drill holes.

Figure 4. Haukiaho Cross section showing holes LK21-071, Finore hole HAU11-005, and geological survey of Finland (GTK) holes R-390 and R-389.

Table 1: Palladium One Haukiaho drill results

Hole

From
(m)

To
(m)

Width
(m)

Pd_Eq
g/t*

Pd
g/t

Pt
g/t

Au
g/t

Cu
%

Ni
%

LK20-008

17.3

33.5

16.2

1.99

0.38

0.15

0.14

0.26

0.20

Inc.

20.3

23.3

3.0

2.55

0.48

0.19

0.22

0.33

0.25

LK20-009

161.5

168.1

6.6

2.34

0.47

0.20

0.13

0.26

0.25

LK20-010

118.7

202.0

83.3

1.27

0.24

0.09

0.05

0.12

0.16

Inc.

166.8

201.0

34.3

2.09

0.47

0.20

0.10

0.20

0.22

Inc.

167.8

173.0

5.3

3.08

0.66

0.25

0.20

0.38

0.30

Inc.

20.3

23.3

3.0

2.55

0.48

0.19

0.22

0.33

0.25

LK21-067

No Significant values (collared in footwall rocks)

LK21-068

81.5

122.0

40.6

0.65

0.05

0.02

0.02

0.04

0.11

Inc.

106.2

120.0

13.9

0.80

0.12

0.05

0.02

0.06

0.12

Inc.

106.2

112.7

6.6

0.91

0.13

0.05

0.03

0.09

0.13

LK21-069

48.5

64.1

15.7

2.26

0.47

0.18

0.18

0.27

0.22

Inc.

48.5

60.0

11.6

2.53

0.52

0.19

0.18

0.30

0.25

Inc.

48.5

52.0

3.6

3.11

0.60

0.22

0.23

0.37

0.32

LK21-070

103.5

131.0

27.5

0.65

0.01

0.00

0.02

0.04

0.12

Inc.

113.0

119.0

6.0

0.83

0.02

0.00

0.04

0.09

0.14

LK21-071

55.8

128.0

72.2

1.79

0.37

0.15

0.14

0.22

0.17

Inc.

72.0

77.0

5.0

2.33

0.53

0.21

0.18

0.27

0.22

Inc.

74.0

75.5

1.5

3.20

0.75

0.29

0.23

0.39

0.29

And

86.2

94.0

7.8

2.74

0.53

0.21

0.23

0.32

0.27

And

111.0

128.0

17.0

2.23

0.53

0.21

0.18

0.28

0.18

Inc.

112.5

118.0

5.5

2.84

0.64

0.25

0.23

0.36

0.25

LK21-072

No Significant values (ended before zone)

LK21-073

75.8

127.0

51.2

1.07

0.15

0.06

0.06

0.13

0.13

Inc.

90.0

113.1

23.1

1.51

0.25

0.10

0.10

0.21

0.16

Inc.

90.8

99.9

9.1

2.10

0.37

0.15

0.16

0.27

0.21

Inc.

98.0

99.0

1.0

3.21

0.61

0.27

0.29

0.47

0.28

LK21-074

Pending

LK21-075

Pending

LK21-076

Pending

LK21-077

Pending

LK21-078

Pending

* Reported widths are “drilled widths” not true widths.
**Italicised orange highlighted results are previously released results see news release September 15, 2020

*Palladium Equivalent
Palladium equivalent is calculated using US$1,100 per ounce for palladium, US$950 per ounce for platinum, US$1,300 per ounce for gold, US$6,614 per tonne for copper, and US$15,4332 per tonne for nickel. This calculation is consistent with the calculation in the Company’s September 2019 NI 43-101 Kaukua resource estimate. Additionally, US$1,100 per ounce for palladium is consistent with the UBS January 2021 long-term consensus price forecast even though the current price of palladium is approximately US$2,800 per ounce.

QA/QC
The Phase I drilling program was carried out under the supervision of Neil Pettigrew, M.Sc., P. Geo., Vice President of Exploration and a director of the Company.

Drill core samples were split using a rock saw by Company staff, with half retained in the core box and stored indoors in a secure facility, in Taivalkoski, Finland. The drill core samples were transported by courier from the Company’s core handling facility in Taivalkoski, Finland, to ALS Global “ALS”) laboratory in Outokumpu, Finland. ALS, is an accredited lab and are ISO compliant (ISO 9001:2008, ISO/IEC 17025:2005). PGE analysis was performed using a 30 grams fire assay with an ICP-MS or ICP-AES finish. Multi-element analyses, including copper and nickel were analysed by four acid digestion using 0.25 grams with an ICP-AES finish.

Certified standards, blanks and crushed duplicates are placed in the sample stream at a rate of one QA/QC sample per 10 core samples. Results are analyzed for acceptance at the time of import. All standards associated with the results in this press release were determined to be acceptable within the defined limits of the standard used.

Qualified Person
The technical information in this release has been reviewed and verified by Neil Pettigrew, M.Sc., P. Geo., Vice President of Exploration and a director of the Company and the Qualified Person as defined by National Instrument 43-101.

About Palladium One
Palladium One Mining Inc. is an exploration company targeting district scale, platinum-group-element (PGE)-copper nickel deposits in Finland and Canada. Its flagship project is the Läntinen Koillismaa or LK Project, a palladium dominant platinum group element-copper-nickel project in north-central Finland, ranked by the Fraser Institute as one of the world’s top countries for mineral exploration and development. Exploration at LK is focused on targeting disseminated sulfides along 38 kilometers of favorable basal contact and building on an established NI 43-101 open pit resource.

ON BEHALF OF THE BOARD
“Derrick Weyrauch”
President & CEO, Director

For further information contact: Derrick Weyrauch, President & CEO
Email: info@palladiumoneinc.com

Neither the TSX Venture Exchange nor its Market Regulator (as that term is defined in the policies of the TSX Venture Exchange) accepts responsibility for the adequacy or accuracy of this release.

This press release includes “forward-looking information” that is subject to a few assumptions, risks and uncertainties, many of which are beyond the control of the Company. Statements regarding listing of the Company’s common shares on the TSXV are subject to all of the risks and uncertainties normally incident to such events. Investors are cautioned that any such statements are not guarantees of future events and that actual events or developments may differ materially from those projected in the forward-looking statements. Such forward-looking statements represent management’s best judgment based on information currently available. Factors that could cause the actual results to differ materially from those in forward-looking statements include regulatory actions and general business conditions. Such forward-looking information reflects the Company’s views with respect to future events and is subject to risks, uncertainties and assumptions, including those set out in the Company’s annual information form dated April 29, 2020 and filed under the Company’s profile on SEDAR at www.sedar.com. The Company does not undertake to update forward?looking statements or forward?looking information, except as required by law. Investors are cautioned that any such statements are not guarantees of future performance and actual results or developments may differ materially from those projected in the forward-looking statements.

Comtech Telecommunications Corp. Awarded $1.6 Million Contract for High-Power Solid-State Amplifiers


Comtech Telecommunications Corp. Awarded $1.6 Million Contract for High-Power Solid-State Amplifiers


MELVILLE, N.Y.–(BUSINESS WIRE)–May 26, 2021– 
May 26, 2021— 
Comtech Telecommunications Corp. (NASDAQ: CMTL), a world leader in secure wireless communications technologies, announced today that during its third quarter of fiscal 2021, its 
New York-based subsidiary, 
Comtech PST Corp., which is part of Comtech’s Government Solutions segment, was awarded an additional 
$1.6 million contract for RF microwave solid-state amplifiers from a major domestic prime contractor, adding to an initial 
$1.7 million contract awarded earlier this fiscal year.

These very high-power solid-state amplifiers, which utilize the latest in solid-state GaN transistor technology, were developed in close cooperation with the prime contractor and are part of a complex RF microwave transmission system used by the 
U.S. Military.

“This additional order is another example of Comtech’s technical strength in delivering high-power solid-state transmitter solutions for military applications and the ongoing demand for our high-power solid-state amplifier products,” said  Fred Kornberg, Chairman of the Board and Chief Executive Officer of 
Comtech Telecommunications Corp.

Comtech PST Corp. (www.comtechpst.com) is a leading independent supplier of broadband, high-power, high performance RF microwave amplifiers and control components for use in a broad spectrum of applications including defense, medical, satellite communications systems and instrumentation.

Comtech Telecommunications Corp. is a leader in the global communications market headquartered in 
Melville, New York. With a passion for customer success, 
Comtech designs, produces and markets advanced secure wireless solutions to more than 1,000 customers in more than 100 countries. For more information, please visit www.comtechtel.com.

Certain information in this press release contains statements that are forward-looking in nature and involve certain significant risks and uncertainties. Actual results could differ materially from such forward-looking information. The Company’s 
Securities and Exchange Commission filings identify many such risks and uncertainties. Any forward-looking information in this press release is qualified in its entirety by the risks and uncertainties described in such 
Securities and Exchange Commission filings.

Media Contact:
Michael D. Porcelain, President and Chief Operating Officer

Comtech Telecommunications Corp.
631-962-7000
info@comtechtel.com

Source: 
Comtech Telecommunications Corp.

Euroseas Ltd. Reports Results for the Quarter Ended March 31, 2021


Euroseas Ltd. Reports Results for the Quarter Ended March 31, 2021


ATHENS, Greece, May 25, 2021 (GLOBE NEWSWIRE) — Euroseas Ltd. (NASDAQ: ESEA, the “Company” or “Euroseas”), an owner and operator of container carrier vessels and provider of seaborne transportation for containerized cargoes, announced today its results for the three-month period ended March 31, 2021.

First Quarter 2021 Financial Highlights:

  • Total net revenues of $14.3 million. Net income of $3.8 million; net income attributable to common shareholders (after a $0.1 million of dividend on Series B Preferred Shares and a $0.1 million of preferred deemed dividend arising out of the redemption of approximately $2 million of Series B Preferred Shares in the first quarter of 2021) of $3.6 million or $0.53 per share basic and diluted. Adjusted net income attributable to common shareholders1 for the period was $3.0 million or $0.45 per share basic and diluted.

  • Adjusted EBITDA1 was $5.6 million.

  • An average of 14.0 vessels were owned and operated during the first quarter of 2021 earning an average time charter equivalent rate of $12,134 per day. 

  • The Company declared a dividend of $0.1 million on its Series B Preferred Shares. The dividend will be paid in cash.

Additional announcement:

The Company has completed its first Environment, Social & Governance (“ESG”) report which will be available on its web site on May 26, 2021.

Aristides Pittas, Chairman and CEO of Euroseas commented: “Over the last three months, the containership markets have continued their upward path exceeding their previous peak of 2008 and coming within reach to challenge their all-time highs last observed in 2005. Recovering demand and inefficiencies in container transport logistics, like port congestion, crew replacement and COVID related protocols, have been combined with modest supply growth to support the present market levels. The higher rates, naturally, have had a very positive effect on our profitability which is to further increase as the remaining of our vessels will renew their legacy charters during the following 4-5 months. In addition to chartering our vessels at higher rates, the strong market has allowed us to pursue charters of longer periods, of two or more years, thus, establishing visibility of our earnings well into next year and even 2023.

“We believe that the favorable market fundamentals will continue over the remainder of this and the next year as world economies are projected to continue recovering from their pandemic induced slowdowns and to register strong growth rates while, in parallel, vessel deliveries are expected to be modest over the same period.

“Our strategy is focused on ensuring that Euroseas remains a significant participant in the feeder/intermediate containership segment, expanding in a risk measured and accretive manner and using our public listing as a potential platform to consolidate privately owned vessels or fleets. Furthermore, as our liquidity increases, we are evaluating possible uses of any accumulated funds in terms of further deleveraging our balance sheet, exploiting investment opportunities or rewarding our shareholders by re-instituting common stock dividends.

“Finally, we are pleased to have completed our first Environment, Social & Governance report. Our ESG responsibilities is an integral part of our strategy and our overall success and we look forward to regularly communicating our progress on this front to our shareholders and investors.”

Tasos Aslidis, Chief Financial Officer of Euroseas commented: “The results of the first quarter of 2021 reflect the increased charter rates our vessels earned due to the major recovery of the market compared to the same period of last year. Our net revenues decreased to $14.3 million in the first quarter of 2021 compared to $15.4 million during the same period of last year due to the lower number of vessels we operated in the first quarter of 2021. During the first quarter of 2021 we operated 14.0 vessels versus 19.0 vessels during the same period of last year.

“On a per-vessel-per-day basis, our vessels earned a 26.2% higher average charter rate in the first quarter of 2021 as compared to the same period of 2020. Again, on a per-vessel-per-day basis, the sum of vessel operating expenses, management fees and general and administrative expenses increased by 17.6% during the first quarter of 2021 as compared to the same period in 2020 which was attributable to increased supply of stores, increase in hull and machinery insurance premiums and the increased crewing costs for our vessels compared to the same period of 2020, resulting from difficulties in crew rotation due to COVID-19 related restrictions. We believe that we continue to maintain one of the lowest operating cost structures amongst the public shipping companies which is one of our competitive advantages.

“Adjusted EBITDA during the first quarter of 2021 was $5.6 million compared to $4.1 million achieved for the first quarter of 2020.”

“Finally, as of March 31, 2021, our outstanding debt (excluding the unamortized loan fees) is about $65.1 million versus restricted and unrestricted cash of about $6.4 million.”
        
First Quarter 2021 Results:
For the first quarter of 2021, the Company reported total net revenues of $14.3 million representing a 7.3% decrease over total net revenues of $15.4 million during the first quarter of 2020. On average, 14.0 vessels were owned and operated during the first quarter of 2021 earning an average time charter equivalent rate of $12,134 per day compared to 19.0 vessels in the same period of 2020 earning on average $9,615 per day. The Company reported a net income for the period of $3.8 million and a net income attributable to common shareholders of $3.6 million, as compared to a net income of $2.0 million and a net income attributable to common shareholders of $1.8 million for the first quarter of 2020.

Vessel operating expenses for the first quarter of 2021 amounted to $6.9 million as compared to $8.0 million for the same period of 2020. The decreased amount is due to the lower number of vessels owned and operated in the first quarter of 2021 compared to the corresponding period of 2020, partly offset by the increased crewing costs for our vessels compared to the same period of 2020, resulting from difficulties in crew rotation due to COVID-19 related restrictions, the increased supply of stores and the increase in hull and machinery insurance premiums. Depreciation expense for the first quarter of 2021 amounted to $1.6 million compared to $1.7 million for the same period of 2020 due to the decreased number of vessels in the Company’s fleet. Related party management fees for the first quarter of 2021 decreased to $1.1 million from $1.3 million for the same period of 2020 for the same reason. In the first quarter of 2021 and 2020, none of our vessels underwent drydocking and certain expenses were incurred in connection with upcoming drydockings; finally, during the first quarter of 2021, we had other operating income of $0.2 million relating to settlement of accounts with charterers of sold vessels.

Interest and other financing costs for the first quarter of 2021 amounted to $0.7 million compared to $1.3 million for the same period of 2020. This decrease is due to the decreased amount of debt and the decrease in weighted average LIBOR rate in the current period compared to the same period of 2020. For the three months ended March 31, 2021 the Company recognized a $0.48 million loss on its interest rate swap contract, comprising a $0.52 million unrealized loss and a $0.04 million realized gain.

Adjusted EBITDA1 for the first quarter of 2021 was $5.6 million, compared to $4.1 million achieved for the first quarter of 2020. Please see below for Adjusted EBITDA reconciliation to net income.

Basic and diluted earnings per share for the first quarter of 2021 was $0.53, calculated on 6,711,408 basic and 6,749,393 diluted weighted average number of shares outstanding compared to basic and diluted earnings per share of $0.32 for the first quarter of 2020, calculated on 5,576,960 basic and diluted weighted average number of shares outstanding.

Excluding the effect on the income attributable to common shareholders for the quarter of the unrealized gain on derivatives and the loss on sale of vessel, the adjusted earnings per share for the quarter ended March 31, 2021 would have been $0.45 per share basic and diluted, respectively, compared to adjusted earnings of $0.17 per share basic and diluted for the first quarter of 2020, after excluding amortization of below market time charters acquired. Usually, security analysts do not include the above items in their published estimates of earnings per share.

Fleet Profile:
The Euroseas Ltd. fleet profile is as follows:

Name Type Dwt TEU Year Built Employment(*) TCE Rate ($/day)

Container Carriers
           
AKINADA BRIDGE (*) Intermediate 71,366 5,610 2001 TC until Oct-21
TC until Oct-22
$17,250
$20,000
SYNERGY BUSAN (*) Intermediate 50,726 4,253 2009 TC until Aug-21
TC until Aug-24
$12,000
$25,000
SYNERGY ANTWERP (*) Intermediate 50,726 4,253 2008 TC until Sep-23 $18,000
SYNERGY OAKLAND (*) Intermediate 50,787 4,253 2009 TC until Jul-21 CONTEX(**) 4250 less 10%, i.e. $37,850 from 22/4/21 until 22/7/21
SYNERGY KEELUNG (+) Intermediate 50,969 4,253 2009 TC until Jun-22 plus 8- 12 months option $10,000 until Jun-21; $11,750 until Jun-22; option $14,500
EM KEA (*) Feeder 42,165 3,100 2007 TC until May-23 $22,000
EM ASTORIA (+) Feeder 35,600 2,788 2004 TC until Feb-22 $18,650
EVRIDIKI G (+) Feeder 34,677 2,556 2001 TC until Jan-22 $15,500
EM CORFU (+) Feeder 34,654 2,556 2001 TC until Sep-21 $10,200
DIAMANTIS P (+) Feeder 30,360 2,008 1998 TC until Aug-21 $6,500
EM SPETSES (+) Feeder 23,224 1,740 2007 TC until Jul-21 $8,100
EM HYDRA (*) Feeder 23,351 1,740 2005 TC until May-21
TC until April-23
$7,200
$20,000
JOANNA (*) Feeder 22,301 1,732 1999 TC until Oct-22 $16,800
AEGEAN EXPRESS (*) Feeder 18,581 1,439 1997 TC until Mar-22 $11,500
Total Container Carriers 14 539,487 42,281      

Note: (*) TC denotes time charter. Charter duration indicates the earliest redelivery date; All dates listed are the earliest redelivery dates under each TC unless the contract rate is lower than the current market rate in which cases the latest redelivery date is assumed; vessels with the latest redelivery date shown are marked by (+).

(**) The CONTEX (Container Ship Time Charter Assessment Index) has been published by the Hamburg and Bremen Shipbrokers’ Association (VHBS) since October 2007. The CONTEX is a company-independent index of time charter rates for containerships. It is based on assessments of the current day charter rates of six selected containership types, which are representative of their size categories: Type 1,100 TEU and Type 1,700 TEU with a charter period of one year, and the Types 2,500, 2,700, 3,500 and 4,250 TEU all with a charter period of two years.

Summary Fleet Data:

  Three Months, Ended March 31, 2020 Three Months, Ended March 31, 2021
FLEET DATA    
Average number of vessels (1) 19.00   14.00  
Calendar days for fleet (2) 1,729.0   1,260.0  
Scheduled off-hire days incl. laid-up (3)    
Available days for fleet (4) = (2) – (3) 1,729.0   1,260.0  
Commercial off-hire days (5) 18.2    
Operational off-hire days (6) 65.8   41.2  
Voyage days for fleet (7) = (4) – (5) – (6) 1,645.0   1,218.8  
Fleet utilization (8) = (7) / (4) 95.1 % 96.7 %
Fleet utilization, commercial (9) = ((4) – (5)) / (4) 98.9 % 100.0 %
Fleet utilization, operational (10) = ((4) – (6)) / (4) 96.2 % 96.7 %
     
AVERAGE DAILY RESULTS    
Time charter equivalent rate (11) 9,615   12,134  
Vessel operating expenses excl. drydocking expenses (12) 5,417   6,310  
General and administrative expenses (13) 464   604  
Total vessel operating expenses (14) 5,881   6,914  
Drydocking expenses (15) 13   65  

(1) Average number of vessels is the number of vessels that constituted the Company’s fleet for the relevant period, as measured by the sum of the number of calendar days each vessel was a part of the Company’s fleet during the period divided by the number of calendar days in that period.

(2) Calendar days. We define calendar days as the total number of days in a period during which each vessel in our fleet was in our possession including off-hire days associated with major repairs, drydockings or special or intermediate surveys or days of vessels in lay-up. Calendar days are an indicator of the size of our fleet over a period and affect both the amount of revenues and the amount of expenses that we record during that period.

(3) The scheduled off-hire days including vessels laid-up are days associated with scheduled repairs, drydockings or special or intermediate surveys or days of vessels in lay-up.

(4) Available days. We define available days as the Calendar days in a period net of scheduled off-hire days incl. laid up. We use available days to measure the number of days in a period during which vessels were available to generate revenues. 

(5) Commercial off-hire days. We define commercial off-hire days as days a vessel is idle without employment.

(6) Operational off-hire days. We define operational off-hire days as days associated with unscheduled repairs or other off-hire time related to the operation of the vessels.

(7) Voyage days. We define voyage days as the total number of days in a period during which each vessel in our fleet was in our possession net of commercial and operational off-hire days. We use voyage days to measure the number of days in a period during which vessels actually generate revenues or are sailing for repositioning purposes.

(8) Fleet utilization. We calculate fleet utilization by dividing the number of our voyage days during a period by the number of our available days during that period. We use fleet utilization to measure a company’s efficiency in finding suitable employment for its vessels and minimizing the amount of days that its vessels are off-hire for reasons such as unscheduled repairs or days waiting to find employment. 

(9) Fleet utilization, commercial. We calculate commercial fleet utilization by dividing our available days net of commercial off-hire days during a period by our available days during that period. 

(10) Fleet utilization, operational. We calculate operational fleet utilization by dividing our available days net of operational off-hire days during a period by our available days during that period. 

(11) Time charter equivalent rate, or TCE rate, is a measure of the average daily net revenue performance of our vessels. Our method of calculating TCE is determined by dividing time charter revenue and voyage charter revenue net of voyage expenses by voyage days for the relevant time period. Voyage expenses primarily consist of port, canal and fuel costs that are unique to a particular voyage, which would otherwise be paid by the charterer under a time charter contract, or are related to repositioning the vessel for the next charter. TCE is a standard shipping industry performance measure used primarily to compare period-to-period changes in a shipping company’s performance despite changes in the mix of charter types (i.e., spot voyage charters, time charters, pool agreements and bareboat charters) under which the vessels may be employed between the periods. Our definition of TCE may not be comparable to that used by other companies in the shipping industry.

(12) Daily vessel operating expenses, which include crew costs, provisions, deck and engine stores, lubricating oil, insurance, maintenance and repairs and management fees are calculated by dividing vessel operating expenses and management fees by fleet calendar days for the relevant time period. Drydocking expenses are reported separately. 

(13) Daily general and administrative expense is calculated by dividing general and administrative expense by fleet calendar days for the relevant time period. 

(14) Total vessel operating expenses, or TVOE, is a measure of our total expenses associated with operating our vessels. TVOE is the sum of vessel operating expenses, management fees and general and administrative expenses; drydocking expenses are not included. Daily TVOE is calculated by dividing TVOE by fleet calendar days for the relevant time period.

(15) Drydocking expenses include expenses during drydockings that would have been capitalized and amortized under the deferral method divided by the fleet calendar days for the relevant period. Drydocking expenses could vary substantially from period to period depending on how many vessels underwent drydocking during the period. The Company expenses drydocking expenses as incurred.

Conference Call and Webcast:
Tomorrow, Wednesday, May 26, 2021 at 10:00 a.m. Eastern Time, the Company’s management will host a conference call and webcast to discuss the results.

Conference Call details:
Participants should dial into the call 10 minutes before the scheduled time using the following numbers: 1 (877) 553-9962 (US Toll Free Dial In), 0(808) 238-0669 (UK Toll Free Dial In) or +44 (0) 2071 928592 (Standard International Dial In). Please quote “Euroseas” to the operator.

A telephonic replay of the conference call will be available until Tuesday, June 1, 2021, by dialing 1(866) 331-1332 (US Toll Free Dial In), 0(808) 238-0667 (UK Toll Free Dial In) or +44 (0) 3333 009785 (Standard International Dial In) and the access code required for the replay is: 6973591#.
 
Audio Webcast – Slides Presentation: 
There will be a live and then archived audio webcast of the conference call, via the internet through the Euroseas website (www.euroseas.gr). Participants to the live webcast should register on the website approximately 10 minutes prior to the start of the webcast.

The slide presentation on the first quarter ended March 31, 2021 will also be available in PDF format 10 minutes prior to the conference call and webcast, accessible on the company’s website (www.euroseas.gr) on the webcast page. Participants to the webcast can download the PDF presentation. 


Euroseas Ltd.
Unaudited Consolidated Condensed Statements of Operations
(All amounts expressed in U.S. Dollars except number of shares)

  Three Months Ended March 31, Three Months Ended March 31,
  2020 2021
     
Revenues    
Time charter revenue 16,131,322   14,916,567  
Commissions (698,515 ) (607,249 )
Net revenues 15,432,807   14,309,318  
       
Operating expenses / (income)    
Voyage expenses 314,554   127,409  
Vessel operating expenses 8,037,863   6,864,353  
Drydocking expenses 23,823   82,209  
Vessel depreciation 1,727,085   1,596,543  
Related party management fees 1,328,822   1,086,405  
Loss on sale of vessel   9,417  
General and administrative expenses

802,376
 

760,977
 
Other operating income   (216,496 )
Total operating expenses, net 12,234,523   10,310,817  
     
Operating income 3,198,284   3,998,501  
     
Other income / (expenses)    
Interest and other financing costs (1,251,412 ) (694,307 )
Gain on derivative, net   484,910  
Foreign exchange gain/ (loss) 1,628   (241 )
Interest income 8,595   1,214  
Other expenses, net (1,241,189 ) (208,424 )
     
Net income 1,957,095   3,790,077  
Dividend Series B Preferred shares

(159,562


)


(138,269


)
Preferred deemed dividend   (86,356 )
Net income attributable to common shareholders

1,797,533
 

3,565,452
 
Earnings per share, basic and diluted 0.32   0.53  
Weighted average number of shares, basic 5,576,960   6,711,408  
Weighted average number of shares, diluted 5,576,960   6,749,393  


Euroseas Ltd.
Unaudited Consolidated Condensed Balance Sheets
(All amounts expressed in U.S. Dollars – except number of shares)

  December 31,  2020
  March 31, 2021
           
ASSETS          
Current Assets:          
Cash and cash equivalents 3,559,399     3,629,150  
Trade accounts receivable 2,013,023     1,399,710  
Other receivables 1,866,624     2,093,941  
Inventories 1,662,422     1,638,868  
Restricted cash 345,010     341,432  
Prepaid expenses 244,315     420,454  
     Total current assets

9,690,793     9,523,555  
Fixed assets:          
Vessels, net 98,458,447     97,107,065  
Long-term assets:          
Restricted cash 2,433,768     2,434,267  
Derivative     191,825  
Total assets 110,583,008     109,256,712  
           
LIABILITIES, MEZZANINE EQUITY AND SHAREHOLDERS’ EQUITY          
Current liabilities:          
Long-term bank loans, current portion 20,645,320     21,145,320  
Related party loan, current 2,500,000        
Trade accounts payable 2,854,377     2,376,280  
Accrued expenses 1,300,420     1,536,931  
Accrued preferred dividends 168,676     215,338  
Deferred revenue 949,364     629,969  
Due to related company 24,072     1,769,238  
Derivative 203,553     229,798  
Total current liabilities 28,645,782     27,902,874  
           
Long-term liabilities:          
Long-term bank loans, net of current portion 46,220,028     43,583,848  
Derivative 362,195      
Total long-term liabilities 46,582,223     43,583,848  
Total liabilities 75,228,005     71,486,722  
            
Mezzanine equity:          
Series B Preferred shares (par value $0.01, 20,000,000 shares authorized, 8,365 and 6,365 issued and outstanding, respectively)       8,019,636     6,105,992  
Shareholders’ equity:          
Common stock (par value $0.03, 200,000,000 shares authorized, 6,708,946 and 6,791,847, issued and outstanding) 201,268     203,755  
Additional paid-in capital 257,467,980     258,228,672  
Accumulated deficit (230,333,881 )   (226,768,429 )
Total shareholders’ equity 27,335,367     31,663,998  
Total liabilities, mezzanine equity and shareholders’ equity 110,583,008     109,256,712  


Euroseas Ltd.
Unaudited Consolidated Condensed Statements of Cash Flows
(All amounts expressed in U.S. Dollars)

  Three Months Ended March 31,
  Three Months Ended March 31,
  2020   2021
     
Cash flows from operating activities:    
Net income 1,957,095     3,790,077  
Adjustments to reconcile net income to net cash provided by operating activities:    
Vessel depreciation 1,727,085     1,596,543  
Amortization of deferred charges 61,156     49,280  
Share-based compensation 30,404     28,765  
Loss on sale of vessel     9,417  
Unrealized gain on derivatives     (527,775 )
Amortization of fair value of below market time charters acquired

(846,405


)


Changes in operating assets and liabilities (903,784 )   1,422,694  
Net cash provided by operating activities 2,025,551     6,369,001  
     
Cash flows from investing activities:    
Cash paid for vessels capitalized expenses and sale expenses (149,420 )   (208,457 )
Advance received for vessel held for sale 1,133,817      
Net cash provided by / (used in) investing activities 984,397

    (208,457

)


Cash flows from financing activities:
   
Redemption of Series B preferred shares     (2,000,000 )
Proceeds from issuance of common stock, net of commissions paid     743,552  
Preferred dividends paid (161,315 )   (91,607 )
Repayment of long-term bank loans (3,285,460 )   (2,185,460 )
Repayment of related party loan     (2,500,000 )
Offering expenses paid (40,486 )   (60,357 )
Net cash used in financing activities (3,487,261 )   (6,093,872 )
     
Net (decrease)/ increase in cash, cash equivalents, and restricted cash (477,313 )   66,672  
Cash, cash equivalents, and restricted cash at beginning of period 5,930,061     6,338,177  
Cash, cash equivalents, and restricted cash at end of period 5,452,748     6,404,849  
Cash breakdown    
Cash and cash equivalents 508,105     3,629,150  
Restricted cash, current 810,376     341,432  
Restricted cash, long term 4,134,267     2,434,267  
Total cash, cash equivalents, and restricted cash shown in the statement of cash flows 5,452,748     6,404,849  


Euroseas Ltd.
Reconciliation of Adjusted EBITDA to
Net Income
(All amounts expressed in U.S. Dollars)

  Three Months Ended
March 31, 2020
Three Months Ended
March 31, 2021

Net income 1,957,095   3,790,077  
Interest and finance costs, net (incl. interest income) 1,242,817   693,093  
Vessel depreciation 1,727,085   1,596,543  
Loss on vessel sale   9,417  
Gain on interest rate swap derivative, net   (484,910 )
Amortization of below market time charters acquired (846,405 )  
Adjusted EBITDA 4,080,592   5,604,220  

Adjusted EBITDA Reconciliation:
Euroseas Ltd. considers Adjusted EBITDA to represent net income before interest, income taxes, depreciation, gain on interest rate swap, loss on sale of vessel and amortization of below market time charters acquired. Adjusted EBITDA does not represent and should not be considered as an alternative to net income, as determined by United States generally accepted accounting principles, or GAAP. Adjusted EBITDA is included herein because it is a basis upon which the Company assesses its financial performance and liquidity position and because the Company believes that this non-GAAP financial measure assists our management and investors by increasing the comparability of our performance from period to period by excluding the potentially disparate effects between periods of, financial costs, gain on interest rate swap, loss on sale of vessel, depreciation and amortization of below market time charters acquired. The Company’s definition of Adjusted EBITDA may not be the same as that used by other companies in the shipping or other industries.

Euroseas Ltd.
Reconciliation of Net Income to Adjusted Net Income
(All amounts expressed in U.S. Dollars except share data and per share amounts)

  Three Months Ended
March 31, 2020
Three Months Ended
March 31, 2021

Net income 1,957,095   3,790,077  
Unrealized gain on derivative   (527,775 )
Amortization of below market time charters acquired (846,405 )  
Loss on sale of vessel   9,417  
Adjusted net income 1,110,690   3,271,719  
Preferred dividends (159,562 ) (138,269 )
Preferred deemed dividend   (86,356 )
Adjusted net income attributable to common shareholders 951,128   3,047,094  
Adjusted earnings per share, basic and diluted 0.17   0.45  
Weighted average number of shares, basic 5,576,975   6,711,408  
Weighted average number of shares, diluted 5,576,975   6,749,393  

Adjusted net income and Adjusted earnings per share Reconciliation:
Euroseas Ltd. considers Adjusted net income to represent net income before unrealized gain on derivative, loss on sale of vessel and amortization of below market time charters acquired. Adjusted net income and Adjusted earnings per share is included herein because we believe it assists our management and investors by increasing the comparability of the Company’s fundamental performance from period to period by excluding the potentially disparate effects between periods of unrealized gain on derivative, loss on sale of vessel and amortization of below market time charters acquired, which items may significantly affect results of operations between periods.

Adjusted net income and Adjusted earnings per share do not represent and should not be considered as an alternative to net income or earnings per share, as determined by GAAP. The Company’s definition of Adjusted net income and Adjusted earnings per share may not be the same as that used by other companies in the shipping or other industries.

About Euroseas Ltd.
Euroseas Ltd. was formed on May 5, 2005 under the laws of the Republic of the Marshall Islands to consolidate the ship owning interests of the Pittas family of Athens, Greece, which has been in the shipping business over the past 140 years. Euroseas trades on the NASDAQ Capital Market under the ticker ESEA.

Euroseas operates in the container shipping market. Euroseas’ operations are managed by Eurobulk Ltd., an ISO 9001:2008 and ISO 14001:2004 certified affiliated ship management company, which is responsible for the day-to-day commercial and technical management and operations of the vessels. Euroseas employs its vessels on spot and period charters and through pool arrangements.

The Company has a fleet of 14 vessels, including 9 Feeder containerships and 5 Intermediate containerships. Euroseas 14 containerships have a cargo capacity of 42,281 teu.

Forward Looking Statement
This press release contains forward-looking statements (as defined in Section 27A of the Securities Act of 1933, as amended, and Section 21E of the Securities Exchange Act of 1934, as amended) concerning future events and the Company’s growth strategy and measures to implement such strategy; including expected vessel acquisitions and entering into further time charters. Words such as “expects,” “intends,” “plans,” “believes,” “anticipates,” “hopes,” “estimates,” and variations of such words and similar expressions are intended to identify forward-looking statements. Although the Company believes that the expectations reflected in such forward-looking statements are reasonable, no assurance can be given that such expectations will prove to have been correct. These statements involve known and unknown risks and are based upon a number of assumptions and estimates that are inherently subject to significant uncertainties and contingencies, many of which are beyond the control of the Company. Actual results may differ materially from those expressed or implied by such forward-looking statements. Factors that could cause actual results to differ materially include, but are not limited to changes in the demand for containerships, competitive factors in the market in which the Company operates; risks associated with operations outside the United States; and other factors listed from time to time in the Company’s filings with the Securities and Exchange Commission. The Company expressly disclaims any obligations or undertaking to release publicly any updates or revisions to any forward-looking statements contained herein to reflect any change in the Company’s expectations with respect thereto or any change in events, conditions or circumstances on which any statement is based.

Visit the Company’s website www.euroseas.gr

Company Contact Investor Relations / Financial Media
Tasos Aslidis
Chief Financial Officer
Euroseas Ltd.
11 Canterbury Lane,
Watchung, NJ 07069
Tel. (908) 301-9091
E-mail: aha@euroseas.gr
Nicolas Bornozis
President
Capital Link, Inc.
230 Park Avenue, Suite 1536
New York, NY 10169
Tel. (212) 661-7566
E-mail: euroseas@capitallink.com


1 Adjusted EBITDA, Adjusted net income and Adjusted earnings per share are not recognized measurements under US GAAP (GAAP) and should not be used in isolation or as a substitute for Euroseas financial results presented in accordance with GAAP. Refer to a subsequent section of the Press Release for the definitions and reconciliation of these measurements to the most directly comparable financial measures calculated and presented in accordance with GAAP.

Chakana Copper Corp (CHKKF)(PERU:CA) – Another Positive Step Toward a Maiden Resource Estimate

Wednesday, May 26, 2021

Chakana Copper Corp (CHKKF)(PERU:CA)
Another Positive Step Toward a Maiden Resource Estimate

Noble Capital Markets research on Chakana Copper Corp is published under ticker symbols CHKKF and PERU:CA. The price target is in USD and based on ticker symbol CHKKF. Chakana Copper Corp is a Canadian-based minerals exploration company that is currently advancing the high-grade gold-copper-silver Soledad Project located in the Ancash region of Peru, a highly favorable mining jurisdiction with supportive communities. The Soledad Project consists of high-grade gold-copper-silver mineralization hosted in tourmaline breccia pipes. A total of 33,353 metres of drilling has been completed to-date, testing nine (9) of twenty-three (23) confirmed breccia pipes with more than 92 total targets. Chakana’s investors are uniquely positioned as the Soledad Project provides exposure to several metals including copper, gold, and silver.

Mark Reichman, Senior Research Analyst of Natural Resources, Noble Capital Markets, Inc.

Refer to the full report for the price target, fundamental analysis, and rating.

    Latest drilling results. Chakana Copper released results from 11 in-fill drill holes representing 2,873.7 meters of drilling at the Huancarama, Paloma East, and Paloma West tourmaline breccia pipe discoveries. Mineralization was encountered in all holes drilled. To date, only 15 out of 110 targets on the Soledad property have been drill-tested.

    Making exceptional progress.  Including drilling activities that commenced in August 2020, a total of 32,000 meters of drilling is anticipated through 2021. This includes 67 drill holes, representing 13,946.2 meters of drilling in the Paloma and Huancarama areas, for which results have been released. For the 26,000 meters of drilling planned in 2021, the company expects to complete 16,000 meters of …


    Get The Full Report

This Company Sponsored Research is provided by Noble Capital Markets, Inc., a FINRA and S.E.C. registered broker-dealer (B/D).

*Analyst certification and important disclosures included in the full report. NOTE: investment decisions should not be based upon the content of this research summary.  Proper due diligence is required before making any investment decision. 

What is the Feds position on Crypto Stablecoin and CBDCs?


image credit: U.S. Federal Reserve


The Federal Reserve’s Discussion Paper on Digital Currency to be Released this Summer


Last week, Fed Chair Jerome Powell spoke in a video address about CBDCs (Central Bank Digital Currencies) and other cryptocurrencies. He announced the Federal Reserve plans to publish a discussion paper on the potential benefits and risks of issuing a U.S. digital currency during this summer.  He also shared more insight on current thinking.

“The paper represents the beginning of what will be a thoughtful and deliberative process,” said Chairman Powell in his address. He also spoke of regulation making it clear there were no decisions made to date when expressing the eye in which the Fed will look at the matter, “ the Federal Reserve is charged with promoting monetary and financial stability and the safety and efficiency of the payment system. In pursuit of these core functions, we have been carefully monitoring and adapting to the technological innovations now transforming the world of payments, finance, and banking.” Powell also made clear that one decision that has been made is that cash currency is not going away, “We think it is important that any potential CBDC could serve as a complement to, and not a replacement of, cash and current private-sector digital forms of the dollar, such as deposits at commercial banks,” said Powell.

A link for the video is provided below as a “Source,” but, as with most Fed releases, every word is deliberate and therefore worth reading. Here is the complete transcript.


Transcript of Chair Powell’s Message on Developments in the U.S. Payments System

May 20, 2021

Today we are in the midst of a technological revolution that is fundamentally changing our world: reshaping how we communicate, access information, and purchase goods and services. As the central bank of the United States, the Federal Reserve is charged with promoting monetary and financial stability and the safety and efficiency of the payment system. In pursuit of these core functions, we have been carefully monitoring and adapting to the technological innovations now transforming the world of payments, finance, and banking.

The effective functioning of our economy requires that people have faith and confidence not only in the dollar, but also in the payment networks, banks, and other payment service providers that allow money to flow on a daily basis. Our focus is on ensuring a safe and efficient payment system that provides broad benefits to American households and businesses while also embracing innovation. In the Fed’s early days, the development of dedicated telegraph wires facilitated the transfer of funds between banks. In the 1980s, automated clearinghouse services made it possible for electronic bill payments to be an alternative to paper checks. In 2019, the Federal Reserve committed to building the FedNow Service, which will enable banks to provide real-time, or instant, payments to their customers around the clock, 365 days a year, benefiting communities across America.

Recently, the rise of distributed ledger technology, which offers a new approach to recording ownership of assets, has allowed for the creation of a range of new financial products and services—including cryptocurrencies. To date, cryptocurrencies have not served as a convenient way to make payments, given, among other factors, their swings in value. Nonetheless, coins tied to the value of the dollar or another currency—known as “stablecoins”— have emerged as a new way to make payments. These stablecoins aim to use new technologies in a way that has the potential to enhance payments efficiency, speed up settlement flows, and reduce end-user costs—but they may also carry potential risks to those users and to the broader financial system. For example, although the value of a stablecoin may be tied to the value of a dollar, these coins may not come with the same protections as traditional means of payment, such as physical currency or the deposits in your bank account. Therefore, as stablecoins’ use increases, so must our attention to the appropriate regulatory and oversight framework. This includes paying attention to private-sector payments innovators who are currently not within the traditional regulatory arrangements applied to banks, investment firms, and other financial intermediaries.

Technological advances also offer new possibilities to central banks—including the Fed. In particular, technology now enables the development and issuance of central bank digital currencies, or CBDCs. A CBDC is a new type of central bank liability issued in digital form. While various structures and technologies might be used, a CBDC could be designed for use by the general public.

For the past several years, the Federal Reserve has been exploring the potential benefits and risks of CBDCs from a variety of angles, including through technological research and experimentation. Our key focus is on whether and how a CBDC could improve on an already safe, effective, dynamic, and efficient U.S. domestic payments system. We think it is important that any potential CBDC could serve as a complement to, and not a replacement of, cash and current private-sector digital forms of the dollar, such as deposits at commercial banks. The design of a CBDC would raise important monetary policy, financial stability, consumer protection, legal, and privacy considerations and will require careful thought and analysis— including input from the public and elected officials.

To help stimulate broad conversation, the Federal Reserve Board will issue a discussion paper this summer outlining our current thinking on digital payments, with a particular focus on the benefits and risks associated with CBDC in the U.S. context. As part of this process, we will ask for public comment on issues related to payments, financial inclusion, data privacy, and information security.

We are committed at the Federal Reserve to hearing a wide range of voices on this important issue before making any decision on whether and how to move forward with a U.S. CBDC, taking account of the broader risks and opportunities it could offer. The paper represents the beginning of what will be a thoughtful and deliberative process. Irrespective of the conclusion we ultimately reach, we expect to play a leading role in developing international standards for CBDCs, engaging actively with central banks in other jurisdictions as well as regulators and supervisors here in the United States throughout that process.

The Federal Reserve remains committed to ensuring that the public has access to a safe, reliable, and secure payments system. Our forthcoming paper on the evolution of digital payments is intended—along with our other work as a supervisor, regulator, and payment system operator—to advance the objective of ensuring that the payments system and the economy work for all Americans. We look forward to hearing your thoughts on this important topic.


Take-Away

In his announcement, Chairman Powell showed he understood how technology in the past has led to better communication, faster payment systems, and more efficient bank clearing operations. He also was clear that, to date, the experience with cryptocurrencies is that they do not serve as a convenient way to make payments, “given, among other factors, their swings in value.” Adopting new technologies such as distributed ledger systems and a stable payment system is the balance the Fed will likely try to create going forward.

We will know more when the discussion paper is released later this year; in the interim, cryptocurrency exchange rates are likely to move up and down on, among other things, speculation of the tone of the upcoming paper.


Suggested Reading:

Small-Cap Names in a Big Crypto Market

Backed by the Full Faith and Credit of Blockchain


Cryptocurrency and the Howey Test

NFTs are Becoming More Popular with Sports Fans


Sources:

Chairman Powell’s Video Message May 20, 2020


Stay up to date. Follow us:


Stay up to date. Follow us:

Release – CanAlaska Promotes Cory Belyk to CEO and Executive Vice President


CanAlaska Promotes Cory Belyk to CEO & Executive Vice President


Vancouver, Canada, May 25, 2021 – CanAlaska Uranium Ltd. (TSX-V: CVV; OTCQB: CVVUF; Frankfurt: DH7N) (“CanAlaska” or the “Company”) is pleased to announce the promotion of Cory Belyk to Chief Executive Officer and Executive Vice President of the Company effective June 1, 2021. Peter Dasler will continue as President of CanAlaska, working closely with Cory Belyk to grow the Company. The rapid resurgence of interest in the uranium market has accelerated the Company’s activities including the addition of new exploration geologists. Cory Belyk now heads CanAlaska’s exploration and management teams, based from the Company’s office in Saskatoon, Saskatchewan.

Cory Belyk is a professional geologist with nearly 30 years of experience working for major and junior mining companies in the Athabasca Basin and worldwide. Prior to joining CanAlaska in 2019 as Chief Operating Officer, he was Director of Exploration for Cameco’s international operations including Mongolia and Australia. Mr. Belyk was also a member of Cameco’s exploration management team during the Fox Lake and West McArthur uranium discoveries in Saskatchewan. Mr. Belyk holds a Bachelor’s (1994) degree in Geology from the University of Saskatchewan and a Certificate in Negotiation from Harvard Law School (2014). He is a registered member of the Association of Professional Engineers and Geoscientists of Saskatchewan.

Cory Belyk, Chief Executive Officer, comments: “It is a privilege and honor to be asked to lead CanAlaska into the future. CanAlaska is a very well-structured Company with a portfolio of uranium and nickel projects that are truly world-class and ripe for additional major discoveries.  This is at a time when the world is waking up to nuclear power generation as a carbon-free source of baseload energy. Through deliberate and diligent leadership and management, CanAlaska has preserved its vast portfolio of under-explored Athabasca Basin assets and made a significant new uranium discovery next door to the world’s richest uranium mine.  In addition, new uranium and sulphide nickel projects have been added to build value for shareholders. CanAlaska’s project pipeline offers our shareholders multiple opportunities for discovery and I believe whole-heartedly further discovery is just around the corner. I commend Peter, the Board of Directors, and the CanAlaska team for their effort to build this Company to what it is today, ready for the energy needs of the present and future. I am humbled to be entrusted with the reins.”

CanAlaska President, Peter Dasler, comments; “Cory and I have worked shoulder to shoulder with our team for the past 3 years and it is a pleasure to see the significant increase in the Company’s value for our shareholders. I am very excited about CanAlaska’s opportunities for discovery at a time when we see recognition from the market of the value of uranium for carbon-free energy supply. Recent family events are now affecting the amount of time that I can spend on Company affairs and my best role will be in management support of Cory and our expanding exploration team at a time when we expect to see rapid further growth. Our new Saskatoon office is allowing us to grow to suit the market and position us for new discoveries. Cory and I look forward to new discoveries and continuing our Prospect Generator/Joint Venture strategy.”

About CanAlaska Uranium

CanAlaska Uranium Ltd. (TSX-V: CVV; OTCQB: CVVUF; Frankfurt: DH7N) holds interests in approximately 214,000 hectares (530,000 acres), in Canada’s Athabasca Basin – the “Saudi Arabia of Uranium.”  CanAlaska’s strategic holdings have attracted major international mining companies. CanAlaska is currently working with Cameco and Denison at two of the Company’s properties in the Eastern Athabasca Basin. CanAlaska is a project generator positioned for discovery success in the world’s richest uranium district. The Company also holds properties prospective for nickel, copper, gold and diamonds.

For further information visit www.canalaska.com.

On behalf of the Board of Directors

“Peter Dasler”
Peter Dasler, M.Sc., P.Geo.
President & CEO
CanAlaska Uranium Ltd.

Contacts:

Peter Dasler, President
Tel: +1.604.688.3211 x 138
Email: info@canalaska.com

Cory Belyk, CEO and Executive Vice President
Tel: +1.604.688.3211 x 138
Email: cbelyk@canalaska.com

Neither TSX Venture Exchange nor its Regulation Services Provider (as that term is defined in the policies of the TSX Venture Exchange) accepts responsibility for the adequacy or accuracy of this release.

Forward-looking information

All statements included in this press release that address activities, events or developments that the Company expects, believes or anticipates will or may occur in the future are forward-looking statements. These forward-looking statements involve numerous assumptions made by the Company based on its experience, perception of historical trends, current conditions, expected future developments and other factors it believes are appropriate in the circumstances. In addition, these statements involve substantial known and unknown risks and uncertainties that contribute to the possibility that the predictions, forecasts, projections and other forward-looking statements will prove inaccurate, certain of which are beyond the Company’s control. Readers should not place undue reliance on forward-looking statements. Except as required by law, the Company does not intend to revise or update these forward-looking statements after the date hereof or revise them to reflect the occurrence of future unanticipated events.

Esports Entertainment Group, Inc. (GMBL) – Jersey Shores Up Its Gambling Strategy

Tuesday, May 25, 2021

Esports Entertainment Group, Inc. (GMBL)
Jersey Shores Up Its Gambling Strategy

Esports Entertainment Group Inc is a development-stage online gambling company focused purely on esports. The company’s principal business operations include design, develop and test wagering systems.

Michael Kupinski, Director of Research, Noble Capital Markets, Inc.

Refer to the full report for the price target, fundamental analysis, and rating.

    New Jersey accepts gaming license. The company received the long-awaited, approval from New Jersey Division of Gaming Enforcement of its gaming license. While the approval does not distinguish between sports and esports betting, the company entered its application with one of the largest states for gambling in an effort to become the preeminent platform for esports betting.

    Next steps.  The company’s Vie gambling software platform will go through regulatory testing labs to determine if the software is compliant and meets regulatory standards. The testing could take approximately 3 to 10 weeks. Once the software is audited, the company could then be granted a transactional waiver. This will allow it to be in business and for customers to begin placing bets as soon as …


This Company Sponsored Research is provided by Noble Capital Markets, Inc., a FINRA and S.E.C. registered broker-dealer (B/D).

*Analyst certification and important disclosures included in the full report. NOTE: investment decisions should not be based upon the content of this research summary.  Proper due diligence is required before making any investment decision. 

Release – TherapeuticsMD Announces Submission of Low Dose BIJUVA Supplemental New Drug Application to FDA


TherapeuticsMD Announces Submission of Low Dose BIJUVA® 0.5 mg/100 mg Supplemental New Drug Application to FDA


BOCA RATON, Fla.–(BUSINESS WIRE)–May 25, 2021– 
TherapeuticsMD, Inc. (NASDAQ: TXMD), an innovative, leading women’s healthcare company, announced today that the Company submitted a supplemental New Drug Application (“sNDA”) for BIJUVA (estradiol and progesterone) capsules, 0.5 mg/100 mg, to the 
U.S. Food and Drug Administration (“FDA”).

The Company expects to learn of the acceptance of the sNDA upon receipt of the Filing Review Notification from the FDA, approximately 74 days after submission. If accepted, the Company expects that the review time under the Prescription Drug User Fee Act (PDUFA) will be within ten months of receipt by the FDA, approximately 
March 21, 2022.

“We are pleased to have identified a path forward for submission to the FDA of our sNDA for low-dose BIJUVA. We believe low-dose BIJUVA will be an important additional therapeutic option for women, if approved, and we look forward to bringing it to market,” said  Robert G. Finizio, Chief Executive Officer of 
TherapeuticsMD.

BIJUVA is the only FDA-approved bio-identical hormone therapy combination of estradiol and progesterone in a single, oral capsule. It is taken once-daily for the treatment of moderate to severe vasomotor symptoms (commonly known as hot flashes or flushes) due to menopause in women with a uterus.

About BIJUVA

BIJUVA is a novel combination of bio-identical estradiol and bio-identical progesterone in a once-daily oral softgel capsule. BIJUVA is approved in the 
U.S. in a 1mg/100mg strength for the treatment of moderate to severe vasomotor symptoms due to menopause in women with a uterus.

INDICATION

BIJUVA (estradiol and progesterone) is a combination of an estrogen and progesterone indicated in a woman with a uterus for the treatment of moderate to severe vasomotor symptoms due to menopause.

IMPORTANT SAFETY INFORMATION

WARNING: CARDIOVASCULAR DISORDERS, BREAST CANCER, ENDOMETRIAL CANCER, and PROBABLE DEMENTIA

See full prescribing information for complete boxed warning.

Estrogen Plus Progestin Therapy

  • Estrogen plus progestin therapy should not be used for the prevention of cardiovascular disease or dementia
  • The Women’s Health Initiative (WHI) estrogen plus progestin substudy reported increased risks of stroke, deep vein thrombosis (DVT), pulmonary embolism (PE), and myocardial infarction (MI)
  • The WHI estrogen plus progestin substudy reported increased risks of invasive breast cancer
  • The WHI Memory Study (WHIMS) estrogen plus progestin ancillary study of WHI reported an increased risk of probable dementia in postmenopausal women 65 years of age and older

Estrogen-Alone Therapy

  • There is an increased risk of endometrial cancer in a woman with a uterus who uses unopposed estrogens
  • Estrogen-alone therapy should not be used for the prevention of cardiovascular disease or dementia
  • The WHI estrogen-alone substudy reported increased risks of stroke and DVT
  • The WHIMS estrogen-alone ancillary study of WHI reported an increased risk of probable dementia in postmenopausal women 65 years of age and older

CONTRAINDICATIONS

BIJUVA is contraindicated in women with any of the following conditions: undiagnosed abnormal genital bleeding; known, suspected, or history of cancer of the breast; known or suspected estrogen-dependent neoplasia; active DVT, PE, or history of these conditions; active arterial thromboembolic disease (for example, stroke, MI), or a history of these conditions; known anaphylactic reaction, angioedema, or hypersensitivity to BIJUVA or any of its ingredients; known liver impairment or disease; known protein C, protein S, or antithrombin deficiency, or other known thrombophilic disorders.

WARNINGS AND PRECAUTIONS

  • An increased risk of PE, DVT, stroke, and MI has been reported with estrogen plus progestin therapy. Should these occur or be suspected, therapy should be discontinued immediately. Risk factors for arterial vascular disease and/or venous thromboembolism (VTE) should be managed appropriately.
  • The WHI substudy of daily estrogen plus progestin after a mean follow-up of 5.6 years reported an increased risk of invasive breast cancer. Observational studies have also reported an increased risk of breast cancer for estrogen plus progestin therapy after several years of use. The risk increased with duration of use and appeared to return to baseline over about 5 years after stopping treatment (only the observational studies have substantial data on risk after stopping). The use of estrogen plus progestin therapy has been reported to result in an increase in abnormal mammograms requiring further evaluation.
  • Endometrial hyperplasia (a possible precursor to endometrial cancer) has been reported to occur at a rate of approximately less than one percent with BIJUVA. Clinical surveillance of all women using estrogen plus progestin therapy is important. Adequate diagnostic measures should be undertaken to rule out malignancy in postmenopausal women with undiagnosed persistent or recurring abnormal genital bleeding.
  • The WHI estrogen plus progestin substudy reported a statistically non-significant increased risk of ovarian cancer. A meta-analysis of 17 prospective and 35 retrospective epidemiology studies found that women who used hormonal therapy for menopausal symptoms had an increased risk for ovarian cancer. The exact duration of hormone therapy use associated with an increased risk of ovarian cancer, however, is unknown.
  • In the WHIMS ancillary studies of postmenopausal women 65 to 79 years of age, there was an increased risk of developing probable dementia in women receiving estrogen plus progestin when compared to placebo. It is unknown whether these findings apply to younger postmenopausal women.
  • Estrogens increase the risk of gallbladder disease.
  • Discontinue estrogen if severe hypercalcemia, loss of vision, severe hypertriglyceridemia, or cholestatic jaundice occurs.
  • Monitor thyroid function in women on thyroid replacement hormone therapy.

The most common adverse reactions (?3%) for BIJUVA are breast tenderness (10.4%), headache (3.4%), vaginal bleeding (3.4%), vaginal discharge (3.4%) and pelvic pain (3.1%).

Please note that this information is not comprehensive. Please see the Full Prescribing Information including BOXED WARNING at BIJUVA.com.

About TherapeuticsMD, Inc.

TherapeuticsMD, Inc. is an innovative, leading healthcare company, focused on developing and commercializing novel products exclusively for women. Our products are designed to address the unique changes and challenges women experience through the various stages of their lives with a therapeutic focus in family planning, reproductive health, and menopause management. The company is committed to advancing the health of women and championing awareness of their healthcare issues. To learn more about 
TherapeuticsMD, please visit therapeuticsmd.com or follow us on Twitter: @TherapeuticsMD and on Facebook: 
TherapeuticsMD.

Forward-Looking Statements

This press release by 
TherapeuticsMD, Inc. may contain forward-looking statements. Forward-looking statements may include, but are not limited to, statements relating to TherapeuticsMD’s objectives, plans and strategies as well as statements, other than historical facts, that address activities, events or developments that the company intends, expects, projects, believes or anticipates will or may occur in the future. These statements are often characterized by terminology such as “believes,” “hopes,” “may,” “anticipates,” “should,” “intends,” “plans,” “will,” “expects,” “estimates,” “projects,” “positioned,” “strategy” and similar expressions and are based on assumptions and assessments made in light of management’s experience and perception of historical trends, current conditions, expected future developments and other factors believed to be appropriate. Forward-looking statements in this press release are made as of the date of this press release, and the company undertakes no duty to update or revise any such statements, whether as a result of new information, future events or otherwise. Forward-looking statements are not guarantees of future performance and are subject to risks and uncertainties, many of which are outside of the company’s control. Important factors that could cause actual results, developments and business decisions to differ materially from forward-looking statements are described in the sections titled “Risk Factors” in the company’s filings with the 
Securities and Exchange Commission, including its most recent Annual Report on Form 10-K and Quarterly Reports on Form 10-Q, as well as reports on Form 8-K, and include the following: whether the FDA will accept and approve the NDA efficacy supplement for the lower dose of BIJUVA; the effects of the COVID-19 pandemic; the company’s ability to maintain or increase sales of its products; the company’s ability to develop and commercialize IMVEXXY®, ANNOVERA®, and BIJUVA® and obtain additional financing necessary therefor; whether the company will be able to comply with the covenants and conditions under its term loan facility; whether the company will be able to successfully divest its vitaCare business and how the proceeds that may be generated by any such divestiture will be utilized; the potential of adverse side effects or other safety risks that could adversely affect the commercialization of the company’s current or future approved products or preclude the approval of the company’s future drug candidates; the company’s ability to protect its intellectual property, including with respect to the Paragraph IV notice letters the company received regarding IMVEXXY and BIJUVA; the length, cost and uncertain results of future clinical trials; the company’s reliance on third parties to conduct its manufacturing, research and development and clinical trials; the ability of the company’s licensees to commercialize and distribute the company’s products; the ability of the company’s marketing contractors to market ANNOVERA; the availability of reimbursement from government authorities and health insurance companies for the company’s products; the impact of product liability lawsuits; the influence of extensive and costly government regulation; the volatility of the trading price of the company’s common stock and the concentration of power in its stock ownership.

Investor Contacts
Nichol Ochsner
Vice President, Investor Relations
561-961-1900, ext. 2088
Nochsner@TherapeuticsMD.com

In-Site Communications, Inc.
Lisa M. Wilson
212-452-2793
lwilson@insitecony.com

Media Contact
Kristen Landon
Vice President, 
Marketing and Corporate Communications
561-961-1900
Klandon@therapeuticsmd.com

Source: 
TherapeuticsMD, Inc.

Release – Aurania Confirms Significant Amounts Of High-Tech Metals In Tiria-Shimpia Samples


Aurania Confirms Significant Amounts Of High-Tech Metals In Tiria-Shimpia Samples


Toronto, Ontario, May 25, 2021 – Aurania Resources Ltd. (TSXV: ARU) (OTCQB: AUIAF) (Frankfurt: 20Q) (“Aurania” or the “Company”) reports that laboratory assays have confirmed the presence of the high-tech metals, gallium (“Ga”) and indium (“In”) in significant amounts in rock-chip samples from the Tiria-Shimpia target in the Company’s Lost Cities – Cutucu Project (“Project”) in southeastern Ecuador.

Gallium and indium are known to substitute for zinc in the structure of sphalerite (zinc sulphide mineral), and sulphidic zinc ores are a major source of these by-product metals.  Because of the growing usage in certain high-tech applications such as smartphones and solar cells, they are rapidly becoming economically important, and supply security-related concerns are reflected in their identification as critical raw materials.  Gallium is used in gallium arsenide (“GaAs”) semiconductor chips, and its unique properties enable electrons to pass through faster than in conventional silicon chips.  It is used to support 5G technologies.

Next generation GaAs semiconductors promise to bring a huge market, not totally replacing the existing semiconductor market, but ultimately making a huge dent in it. The ability to replace silicon semiconductors, a market that is $500 billion dollars in 2020 makes one sit up and take notice. The existing silicon semiconductor market is a pretty good size for a market that barely existed in 1975. Next generation GaAs support the signal speed that is needed to implement 5G. (Business Wire, March 4, 2020).

It has been well-publicized that there is currently a worldwide shortage of GaAs semiconductor chips.  Partly this is due to shutdown of bauxite mining operations in Shanxi province in China in 2019, due to environmental concerns, where gallium is produced as a by-product of alumina.  Bauxite from outside of China typically does not contain recoverable levels of gallium: https://roskill.com/news/gallium-price-floor-set-to-rise-in-2021. Whatever the situation, it would appear that gallium supply is inelastic.

So far, sampling at Tiria-Shimpia has produced maximum values of 163 parts per million (“ppm”) for gallium and 39 ppm for indium.  These high values are associated with high silver and zinc grades in rock-chip samples (Table 1).  According to Kitco Metals (https://www.kitco.com/strategic-metals/), the gallium price has ranged between approximately US$200 to US$534 per kilogram (“kg”) over the past five years.  The Indium price is reported by Kitco Metals to US$290 to US$490 per kg over the past five years.

It should be made clear that the Company has not performed any metallurgical testing to date to determine the extent to which these metals are recoverable in any quantity, if at all.

About the Area

Gallium and indium values are concentrated in the central part of the Tiria-Shimpia target in an area approximately 500 metres long, that remains open to the south. Elevated gallium and indium are found in crackle-brecciated limestone that contains veins of sphalerite and barite, associated with high values in silver and zinc reported in prior press releases dated May 21, 2021.

Table 1. Summary of rock-chip samples from the Shimpia central area.

Sample Number Gallium Indium Silver Zinc
(g/t) (g/t) (g/t) (%)
Y993462 163 9.6 43.8 37.0
E797971 160 38.6 6.3 25.9
Y992200 154 14.9 56.8 49.1
Y993461 132 33.7 73.4 40.3
Y992199 109 0.9 31.1 40.2
Y993454 31 5.9 4.9 15.2

Sample Analysis & Quality Assurance / Quality Control (“QAQC”)

Laboratories: The rock samples were prepared for analysis at MS Analytical (“MSA”) in Cuenca, Ecuador, and the analyses were done in Vancouver, Canada.

Sample preparation: The rock samples were jaw-crushed to 10 mesh (crushed material passes through a mesh with apertures of 2 millimetres (“mm”)), from which a one-kilogram sub-sample was taken.  The sub-sample was crushed to a grain size of 0.075mm and a 200 gram (“g”) split was set aside for analysis.

Analytical procedure:  Approximately 0.25g of rock pulp underwent four-acid digestion and analysis for 48 elements by ICP-MS.  For the over-limit samples, those that had a grade of greater than 1% copper and 100g/t silver, 0.4 grams of pulp underwent digestion in four acids and the resulting liquid was diluted and analyzed by ICP-MS.

QAQC: Aurania personnel inserted a certified standard pulp sample, alternating with a field blank, at approximate 20 sample intervals in all sample batches. Aurania’s analysis of results from its independent QAQC samples showed the batches reported on above, lie within acceptable limits.  In addition, the labs reported that the analyses had passed their internal QAQC tests.

Qualified Person

The geological information contained in this news release has been verified and approved by Jean-Paul Pallier, MSc.  Mr. Pallier is a designated EurGeol by the European Federation of Geologists and a Qualified Person as defined by National Instrument 43-101, Standards of Disclosure for Mineral Projects of the Canadian Securities Administrators.

About Aurania

Aurania is a mineral exploration company engaged in the identification, evaluation, acquisition and exploration of mineral property interests, with a focus on precious metals and copper in South America.  Its flagship asset, The Lost Cities – Cutucu Project, is located in the Jurassic Metallogenic Belt in the eastern foothills of the Andes mountain range of southeastern Ecuador.

Information on Aurania and technical reports are available at www.aurania.com and www.sedar.com, as well as on Facebook at https://www.facebook.com/auranialtd/, Twitter at  https://twitter.com/auranialtd, and LinkedIn at https://www.linkedin.com/company/aurania-resources-ltd-.

For further information, please contact:

Carolyn Muir

VP Investor Relations

Aurania Resources Ltd.

(416) 367-3200

carolyn.muir@aurania.com

Dr. Richard Spencer

President

Aurania Resources Ltd.

(416) 367-3200

richard.spencer@aurania.com

Neither the TSX Venture Exchange nor its Regulation Services Provider (as that term is defined in the policies of the TSX Venture Exchange) accepts responsibility for the adequacy or accuracy of this release.

Forward-Looking Statements

This news release may contain forward-looking information that involves substantial known and unknown risks and uncertainties, most of which are beyond the control of Aurania. Forward-looking statements include estimates and statements that describe Aurania’s future plans, objectives or goals, including words to the effect that Aurania or its management expects a stated condition or result to occur. Forward-looking statements may be identified by such terms as “believes”, “anticipates”, “expects”, “estimates”, “may”, “could”, “would”, “will”, or “plan”. Since forward-looking statements are based on assumptions and address future events and conditions, by their very nature they involve inherent risks and uncertainties. Although these statements are based on information currently available to Aurania, Aurania provides no assurance that actual results will meet management’s expectations. Risks, uncertainties and other factors involved with forward-looking information could cause actual events, results, performance, prospects and opportunities to differ materially from those expressed or implied by such forward-looking information. Forward looking information in this news release includes, but is not limited to Aurania’s objectives, goals or future plans, statements, exploration results, potential mineralization, the corporation’s portfolio, treasury, management team and enhanced capital markets profile, the estimation of mineral resources, exploration, timing of the commencement of operations and estimates of market conditions. Factors that could cause actual results to differ materially from such forward-looking information include, but are not limited to, failure to identify mineral resources, failure to convert estimated mineral resources to reserves, the inability to complete a feasibility study which recommends a production decision, the preliminary nature of metallurgical test results, delays in obtaining or failures to obtain required governmental, regulatory, environmental or other project approvals, political risks, inability to fulfill the duty to accommodate indigenous peoples, uncertainties relating to the availability and costs of financing needed in the future, changes in equity markets, inflation, changes in exchange rates, fluctuations in commodity prices, delays in the development of projects, capital and operating costs varying significantly from estimates and the other risks involved in the mineral exploration and development industry, the effects of COVID-19 on the business of the Company including but not limited to the effects of COVID-19 on the price of commodities, capital market conditions, restrictions on labour and international travel and supply chains, and those risks set out in Aurania’s public documents filed on SEDAR. Although Aurania believes that the assumptions and factors used in preparing the forward-looking information in this news release are reasonable, undue reliance should not be placed on such information, which only applies as of the date of this news release, and no assurance can be given that such events will occur in the disclosed time frames or at all. Aurania disclaims any intention or obligation to update or revise any forward-looking information, whether as a result of new information, future events or otherwise, other than as required by law.