Sierra Metals Reports Consolidated Financial Results For The First Quarter Of 2021
CONFERENCE CALL MAY 7, 2021 AT 10:30 AM (EDT)
(All $ figures reported in USD)
- Revenue from metals payable of $69.6 million in Q1 2021, a 25% increase from $55.6 million in Q1 2020
- Operating cash flows before movements in working capital of $25.6 million in Q1 2021, a 63% increase from $15.7 million in Q1 2020
- Adjusted EBITDA of $25.3 million in Q1 2021, a 57% increase from $16.1 million in Q1 2021
- Q1 2021 consolidated production includes 7.9 million pounds of copper, a 33% decrease; 1.0 million ounces of silver, a 1% increase; 24.1 million pounds of zinc, an 11% increase; 9.0 million pounds of lead, a 1% decrease; and 2,636 ounces of gold, a 28% decrease respectively, compared to Q1 2020 due to reduced mining of higher grade areas primarily due to restrictions resulting from COVID-19
- Cash costs and AISC per copper equivalent payable pound compared to Q1 2020 increased at Yauricocha 26% and 18% respectively; at Bolivar cash costs and AISC per copper equivalent payable pound increased by 37% and 57%, respectively; and at Cusi cash costs per silver equivalent payable pound decreased by 17% while the AISC was flat
- Record quarterly throughput of 3,728 tonnes per day (“tpd”) at the Yauricocha Mine in Peru
- $74.3 million of cash and cash equivalents as at March 31, 2021
- A shareholder conference call to be held Friday, May 7, 2021, at 10:30 AM (EDT)
TORONTO–(BUSINESS WIRE)– Sierra Metals Inc. (TSX: SMT) (BVL: SMT) (NYSE AMERICAN: SMTS) (“Sierra Metals” or “the Company”) today reported revenue of $69.6 million and an adjusted EBITDA of $25.6 million on the throughput of 774,421 tonnes and metal production of 25.5 million copper equivalent pounds or 3.7 million silver equivalent ounces, or 79.8 million zinc equivalent pounds for the three-month period ended March 31, 2021.
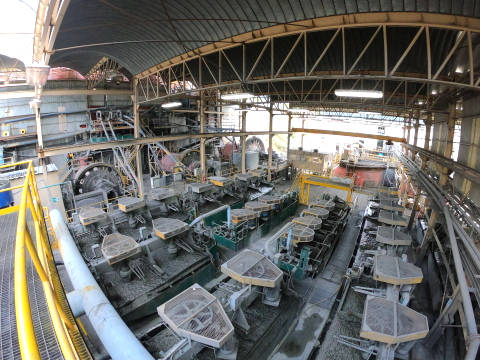
Image 1: Piedras Verdes Mill at Bolivar (Photo: Business Wire)
Despite the decline in quantities of payable metals due to ongoing COVID-19 related operational challenges and external factors, the Company generated higher revenues, adjusted EBITDA and operating cash flows during Q1 2021.
The Yauricocha Mine achieved 14% higher throughput in Q1 2021 compared to Q1 2020, despite the various operational challenges posed by the COVID-19 pandemic. Zinc equivalent production dropped 9% as compared to Q1 2020. In terms of copper equivalent pound, the decline was 21% due to a higher increase in copper prices than the zinc prices compared to Q1 2020. Metal production declined (except zinc and silver) as ore grades fell due to a decline of tonnage contributions from the high-grade cuerpos chicos zones. The copper-rich Esperanza zone also had some operational issues that have since been resolved. Cash costs per copper equivalent payable pound increased 26%, whereas cash costs per zinc equivalent payable pound increased by 9% as compared to Q1 2020. AISC per copper equivalent payable pound increased by 14%, as the increase in cash cost was partially offset by lower treatment and refining charges and lower sustaining capital. AISC per zinc equivalent payable pound increased by 4% as compared to Q1 2020.
The Bolivar Mine processed 371,608 tonnes in Q1 2021, representing a mere 2% decrease from tonnes processed in Q1 2020, despite the ongoing challenges due to COVID-19 and bad weather at the beginning of the quarter. The decrease in throughput combined with lower grades resulted in a 20% decrease in copper equivalent pounds produced during Q1 2021 as compared to Q1 2020. Cash costs and AISC per copper equivalent payable pound increased by 37% and 57%, respectively, as compared to Q1 2020.
The Cusi Mine achieved 2% lower throughput at 30% higher silver grades during Q1 2021, resulting in 17% higher silver equivalent production as compared to Q1 2020. Cash costs per silver equivalent ounce decreased by 17%, but AISC per silver equivalent payable ounce was in line with Q1 2020, as higher sustaining capital offset the impact of the increase in silver equivalent payable ounces in Q1 2021.
Consolidated production of silver increased 1% to 1.0 million ounces, copper decreased 33% to 7.9 million pounds, lead decreased 1% to 9.0 million pounds, zinc increased 11% to 24.1 million pounds, and gold decreased 28% to 2,636 ounces compared to Q1 2020.
Luis Marchese, CEO of Sierra Metals, commented, “The safety of our workforce and the communities in which we operate is paramount. The COVID-19 pandemic has enacted various direct and indirect challenges which have affected our ability to operate as effectively as expected. Additionally, an extended power outage at Cusi affected our operations during the quarter. Despite these challenges, we still had solid revenue and adjusted EBITDA tempered by higher costs due to lower metal production and a decline in ore grades. We continue to work through the challenges and issues, and we expect to see improvement as we progress throughout the year.”
He continued, “Looking ahead, the year continues to be busy with many exciting developments such as the anticipated receipt of the Informe Tecnico Minero (“ITM”) permit at Yauricocha, which will allow us to increase throughput by 20%. We also continue advancing the completion of Preliminary Feasibility Studies for all mines, examining increases in throughput starting in 2024. We also expect to begin construction of an iron ore processing plant at Bolivar, expected to produce 500,000 tonnes per year of 62% iron ore fines. This is expected to enhance Bolivar’s profitability while also lowering our transportation and tailing development costs. Furthermore, we continue with our brownfield and greenfield exploration programs. We have had recent success in the area between the Esperanza and Cachi Cachi zones with the discovery of high-grade copper silver and zinc oxide material as reported in a press release dated April 13, 2020.”
He concluded, “The Company continues to have a strong balance sheet to support the Company’s capital expenditures and growth initiatives. While we are facing challenges from COVID-19 currently, the mid-term plans remain in place.”
The following table displays selected financial and operational information for the three months ended March 31, 2021:
|
|
Three Months Ended |
| (In thousands of dollars, except per share and cash cost amounts, consolidated figures unless noted otherwise) |
March 31, 2021
|
March 31, 2020
|
| Operating |
|
|
|
| Ore Processed / Tonnes Milled |
|
|
774,421
|
|
740,698
|
|
| Silver Ounces Produced (000’s) |
|
|
961
|
|
948
|
|
| Copper Pounds Produced (000’s) |
|
|
7,895
|
|
11,775
|
|
| Lead Pounds Produced (000’s) |
|
|
9,004
|
|
9,079
|
|
| Zinc Pounds Produced (000’s) |
|
|
24,123
|
|
21,646
|
|
| Gold Ounces Produced |
|
|
2,636
|
|
3,657
|
|
| Copper Equivalent Pounds Produced (000’s)1 |
|
|
25,496
|
|
31,170
|
|
| Zinc Equivalent Pounds Produced (000’s)1 |
|
|
79,778
|
|
84,466
|
|
| Silver Equivalent Ounces Produced (000’s)1 |
|
|
3,741
|
|
4,751
|
|
|
|
|
|
| Cash Cost per Tonne Processed |
|
$
|
47.54
|
$
|
46.73
|
|
| Cost of sales per AgEqOz |
|
$
|
11.48
|
$
|
8.96
|
|
| Cash Cost per AgEqOz2 |
|
$
|
11.02
|
$
|
8.43
|
|
| AISC per AgEqOz2 |
|
$
|
19.62
|
$
|
14.71
|
|
| Cost of sales per CuEqLb2 |
|
$
|
1.69
|
$
|
1.37
|
|
| Cash Cost per CuEqLb2 |
|
$
|
1.62
|
$
|
1.29
|
|
| AISC per CuEqLb2 |
|
$
|
2.88
|
$
|
2.25
|
|
| Cost of sales per ZnEqLb2 |
|
$
|
0.54
|
$
|
0.50
|
|
| Cash Cost per ZnEqLb2 |
|
$
|
0.52
|
$
|
0.47
|
|
| AISC per ZnEqLb2 |
|
$
|
0.92
|
$
|
0.83
|
|
|
|
|
|
| Cash Cost per ZnEqLb (Yauricocha)2 |
|
$
|
0.47
|
$
|
0.43
|
|
| AISC per ZnEqLb (Yauricocha)2 |
|
$
|
0.85
|
$
|
0.82
|
|
| Cash Cost per CuEqLb (Yauricocha)2 |
|
$
|
1.48
|
$
|
1.17
|
|
| AISC per CuEqLb (Yauricocha)2 |
|
$
|
2.65
|
$
|
2.24
|
|
| Cash Cost per CuEqLb (Bolivar)2 |
|
$
|
1.58
|
$
|
1.15
|
|
| AISC per CuEqLb (Bolivar)2 |
|
$
|
2.91
|
$
|
1.85
|
|
| Cash Cost per AgEqOz (Cusi)2 |
|
$
|
18.72
|
$
|
22.62
|
|
| AISC per AgEqOz (Cusi)2 |
|
$
|
30.28
|
$
|
30.00
|
|
| Financial |
|
|
|
| Revenues |
|
$
|
69,624
|
$
|
55,558
|
|
| Adjusted EBITDA2 |
|
$
|
25,269
|
$
|
16,074
|
|
| Operating cash flows before movements in working capital |
|
$
|
25,626
|
$
|
15,710
|
|
| Adjusted net income (loss) attributable to shareholders2 |
|
$
|
4,383
|
$
|
1,210
|
|
| Net income (loss) attributable to shareholders |
|
$
|
3,084
|
$
|
(1,869
|
)
|
| Cash and cash equivalents |
|
$
|
74,329
|
$
|
36,915
|
|
| Working capital |
|
$
|
64,704
|
$
|
49,193
|
|
|
|
|
|
| (1) Silver equivalent ounces and copper and zinc equivalent pounds for Q1 2021 were calculated using the following realized prices: $26.44/oz Ag, $3.88/lb Cu, $1.24/lb Zn, $0.92/lb Pb, $1,778/oz Au. Silver equivalent ounces and copper and zinc equivalent pounds for Q1 2020 were calculated using the following realized prices: $16.57/oz Ag, $2.53/lb Cu, $0.93/lb Zn, $0.80/lb Pb, $1,585/oz Au. |
| (2) This is a non-IFRS performance measure, see Non-IFRS Performance Measures section of the MD&A. |
The following table displays average realized metal prices information for the three months ended March 31, 2021, vs March 31, 2020:
| Average Realized Metal Prices |
|
|
% |
| (In US dollars) |
Q1 2021 |
Q1 2020 |
Increase |
|
|
|
|
| Silver ($/oz) |
$
|
26.44
|
$
|
16.57
|
60
|
%
|
| Copper ($/lb) |
$
|
3.88
|
$
|
2.53
|
53
|
%
|
| Lead ($/lb) |
$
|
0.92
|
$
|
0.80
|
15
|
%
|
| Zinc ($/lb) |
$
|
1.24
|
$
|
0.93
|
33
|
%
|
| Gold ($/oz) |
$
|
1,778
|
$
|
1,585
|
12
|
%
|
Q1 2021 Financial Highlights
Revenue from metals payable of $69.6 million in Q1 2021 increased by 25% from $55.6 million in Q1 2020. The increase in revenues was largely driven by the increase in realized metal prices, which more than compensated for the decrease in metal payable, except zinc and lead.
Yauricocha’s cost of sales per zinc equivalent payable pound was $0.50 (Q1 2020 – $0.45), cash cost per zinc equivalent payable pound was $0.47 (Q1 2020 – $0.43), and AISC per zinc equivalent payable pound of $0.85 (Q1 2020 – $0.82). AISC per zinc equivalent payable pound for Q1 2021 increased as compared to Q1 2020 due to an 11% decline in zinc equivalent payable pounds during the quarter.
Yauricocha’s cost of sales per copper equivalent payable pound was $1.56 (Q1 2020 – $1.22), cash cost per copper equivalent payable pound was $1.48 (Q1 2020 – $1.17), and AISC per copper equivalent payable pound of $2.65 (Q1 2020 – $2.24). AISC per copper equivalent payable pound for Q1 2021 increased as compared to Q1 2020 due to a 22% decline in copper equivalent payable pounds during the quarter.
Bolivar’s cost of sales per copper equivalent payable pound was $1.64 (Q1 2020 – $1.19), cash cost per copper equivalent payable pound was $1.58 (Q1 2020 – $1.15), and AISC per copper equivalent payable pound was $2.91 (Q1 2020 – $1.85) for Q1 2021. Unit costs at Bolivar increased due to the 24% decline in the copper equivalent payable pound resulting from lower grades as compared to Q1 2020.
Cusi’s cost of sales per silver equivalent payable ounce was $18.92 (Q1 2020 – $27.48), cash cost per silver equivalent payable ounce was $18.72 (Q1 2020 – $22.62), and AISC per silver equivalent payable ounce was $30.28 (Q1 2020 – $30.00) for Q1 2021 as compared to Q1 2020. Cost of sales and cash costs per unit declined at Cusi due to the 23% increase in the silver equivalent payable ounces sold as compare to Q1 2020. AISC per silver equivalent payable pound at Cusi was in line with Q1 2020 as a 188% increase in sustaining capital, driven by higher development costs, offset the impact of higher silver equivalent ounces sold.
Adjusted EBITDA(1) of $25.3 million for Q1 2021 increased compared to $16.1 million in Q1 2020. The increase in adjusted EBITDA in Q1 2021 resulted from higher revenues and higher gross margins at all sites.
Net income attributable to shareholders for Q1 2021 was $3.1 million (Q1 2020: $(1.9) million) or $0.02 per share (basic and diluted) (Q1 2020: $(0.01).
Adjusted net income attributable to shareholders (1) of $4.4, or $0.03 per share, for Q1 2021 as compared to the adjusted net income of $1.2 million, or $0.01 per share for Q1 2020.
Cash flow generated from operations before movements in working capital of $25.6 million for Q1 2021 increased compared to $15.7 million in Q1 2020. The increase in operating cash flow is mainly the result of higher consolidated revenues generated, and higher gross margins realized.
Cash and cash equivalents of $74.3 million and working capital of $64.7 million as at March 31, 2021, compared to $71.5 million and $70.1 million, respectively, at the end of 2020. Cash and cash equivalents increased during Q1 2021 due to $18.2 million of operating cash flows after working capital adjustments and taxes offset by $14.6 of cash used in investing activities and interest payments of $0.8 million.
(1) This is a non-IFRS performance measure. See the Non-IFRS Performance Measures section of the MD&A.
Exploration Update
Peru:
During the first quarter, surface exploration continued in the Triada copper porphyry (446 meters) and Kilkasca zones (224 meters);
- Underground exploration continued during Q1 2021 with the aim to replace and increase mineral resources that were depleted during 2020. Approximately 5,028 meters of drilling was completed in Esperanza North, Central Mine, Cachi-cachi and the high-grade cuerpos chicos.
Mexico:
Bolivar
- At Bolivar during Q1 2021, 11,185 meters were drilled from the surface as well as diamond drilling within the mine. Surface exploration drilling included 2,071 meters drilled in the Bolivar West – Bolivar West extension and 3,697 meters in the “Gallo Inferior” (“La Montura” Area) encountering skarn intersections with mineralization. Additionally, infill drilling of 2,846 meters was completed in the Bolivar West zone and 2,571 meters in the Gallo Inferior (Fierro Mine).
Cusi
- During Q1 2021, the Company completed 2,775 meters of infill drilling to support the development of the Santa Rosa de Lima vein and NE Trend. In addition, 2,383 meters of surface drilling was completed to support the “San Juan Vein” exploration and the “Gallo vein.”
Covid-19 Update and Guidance
The COVID-19 pandemic has impacted the Company’s operations, and this is reflected in delays in mine development and preparation of areas for mining and consequent lower head grades. A lower volume of sales is a result of a decrease in concentrate production attributable to lower grades. Costs are also negatively impacted mainly due to indirect fixed costs which have to be incurred, despite lower production. The Company continues to take proactive and reactive mitigation measures to minimize any potential impacts COVID-19 may have on its employees, communities, operations, supply chain, and finances. These measures, including COVID testing and quarantining employees and contractors. Further, some exploration and capital expenditure projects have been deferred due to ongoing and residual difficulties.
On January 27, 2021, the Peruvian Government, in response to the “second wave” of COVID-19, declared a quarantine period in certain cities for two weeks ending on February 14, 2021. This period was extended on February 10, 2021, for an additional two weeks until February 28, 2021. The second wave in Perú is still ongoing, with the number of cases remaining at all-time highs.
In Mexico, the contagion was at its peak at the end of 2020. Hospitalization rates were higher than 80% of the capacity in the state of Chihuahua, where the Company operates. Although the number of new cases declined until mid-March 2021, these cases have gradually been increasing since then, possibly due to new strains of the virus. The Mexican Government announced a precautionary closure of non-essential businesses in the last weekend of April 2021, and greater restrictions have been imposed on businesses and the mobility of people.
Currently, although the operations have not been directly affected by these recent additional measures taken by the local governments, they are affected by the overall pandemic operational restrictions and inefficiencies. Management continues to assess the situation but is maintaining its production guidance of between 155 million to 170 million Cu Eq pounds issued on January 18, 2021.
Conference Call and Webcast
Sierra Metals’ senior management will host a conference call on Friday, May 7, 2021, at 10:30 AM (EDT) to discuss the Company’s financial and operating results for the three months ended March 31, 2021.
Via Webcast:
A live audio webcast of the meeting will be available on the Company’s website:
https://event.on24.com/wcc/r/3081089/8CC784C584EEDC0F4B1375A13E2CE27A
The webcast, along with presentation slides, will be archived for 180 days on www.sierrametals.com.
Via phone:
To register for this conference call, please use the link provided below. After registering, a confirmation will be sent through email, including dial-in details and unique conference call codes for entry. As well, reminders will be sent to registered participants in advance of the call.
If you experience difficulty registering, please dial: (888) 869-1189 or (706) 643-5902 for extra assistance.
Registration is open throughout the live call. However, to ensure you are connected for the entire call, we suggest registering a day in advance or at minimum 10 minutes before the start of the call.
Conference Call Registration Link for Phone:
http://www.directeventreg.com/registration/event/4189713
Qualified Persons
Américo Zuzunaga, FAusIMM CP (Mining Engineer) and Vice President of Corporate Planning, is a Qualified Person under National Instrument 43-101 – Standards of Disclosure for Mineral Projects.
Augusto Chung, FAusIMM CP (Metallurgist) and Vice President of Metallurgy and Projects, is a Qualified Person under National Instrument 43-101 – Standards of Disclosure for Mineral Projects.
About Sierra Metals
Sierra Metals Inc. is a diversified Canadian mining company focused on the production and development of precious and base metals from its polymetallic Yauricocha Mine in Peru, and Bolivar and Cusi Mines in Mexico. The Company is focused on increasing production volume and growing mineral resources. Sierra Metals has recently had several new key discoveries and still has many more exciting brownfield exploration opportunities at all three Mines in Peru and Mexico that are within close proximity to the existing mines. Additionally, the Company also has large land packages at all three mines with several prospective regional targets providing longer-term exploration upside and mineral resource growth potential.
The Company’s Common Shares trade on the Toronto Stock Exchange and the Bolsa de Valores de Lima under the symbol “SMT” and on the NYSE American Exchange under the symbol “SMTS”.
For further information regarding Sierra Metals, please visit www.sierrametals.com.
Continue to Follow, Like and Watch our progress:
Web: www.sierrametals.com | Twitter: sierrametals | Facebook: SierraMetalsInc | LinkedIn: Sierra Metals Inc | Instagram: sierrametals
Forward-Looking Statements
This press release contains “forward-looking information” and “forward-looking statements” within the meaning of Canadian and U.S. securities laws related to the Company (collectively, “forward-looking information”). Forward-looking information includes, but is not limited to, statements with respect to the Company’s operations, including anticipated developments in the Company’s operations in future periods, the Company’s planned exploration activities, the adequacy of the Company’s financial resources, and other events or conditions that may occur in the future. Statements concerning mineral reserve and resource estimates may also be considered to constitute forward-looking statements to the extent that they involve estimates of the mineralization that will be encountered if and when the properties are developed or further developed. These statements relate to analyses and other information that are based on forecasts of future results, estimates of amounts not yet determinable and assumptions of management. Any statements that express or involve discussions with respect to predictions, expectations, beliefs, plans, projections, objectives, assumptions or future events or performance (often, but not always, using words or phrases such as “expects”, “anticipates”, “plans”, “projects”, “estimates”, “assumes”, “intends”, “strategy”, “goals”, “objectives”, “potential” or variations thereof, or stating that certain actions, events or results “may”, “could”, “would”, “might” or “will” be taken, occur or be achieved, or the negative of any of these terms and similar expressions) are not statements of historical fact and may be forward-looking information.
Forward-looking information is subject to a variety of risks and uncertainties, which could cause actual events or results to differ from those reflected in the forward-looking information, including, without limitation, the risks described under the heading “Risk Factors” in our Annual Information Form dated March 30, 2021 in respect of the year ended December 31, 2020 and other risks identified in the Company’s filings with Canadian securities regulators and the U.S. Securities and Exchange Commission, which filings are available at www.sedar.com and www.sec.gov, respectively.
The risk factors referred to above is not exhaustive of the factors that may affect any of the Company’s forward-looking information. Forward looking information includes statements about the future and are inherently uncertain, and the Company’s actual achievements or other future events or conditions may differ materially from those reflected in the forward-looking information due to a variety of risks, uncertainties and other factors. The Company’s statements containing forward-looking information are based on the beliefs, expectations and opinions of management on the date the statements are made, and the Company does not assume any obligation to update forward-looking information if circumstances or management’s beliefs, expectations or opinions should change, other than as required by applicable law. For the reasons set forth above, one should not place undue reliance on forward-looking information.
Mike McAllister
V.P., Investor Relations
Sierra Metals Inc.
+1 (416) 366-7777
Email: info@sierrametals.com
Ed Guimaraes
CFO
Sierra Metals Inc.
+1(416) 366-7777
Luis Marchese
CEO
Sierra Metals Inc.
+1(416) 366-7777
Source: Sierra Metals Inc.