Rare Earth Elements Demand is Still Growing


image credit: William Stewart (flickr.com)


Prices are Rising on Rare Earth Elements – Companies Scrambling to Take Advantage


What are Rare Earth Elements (REEs)?

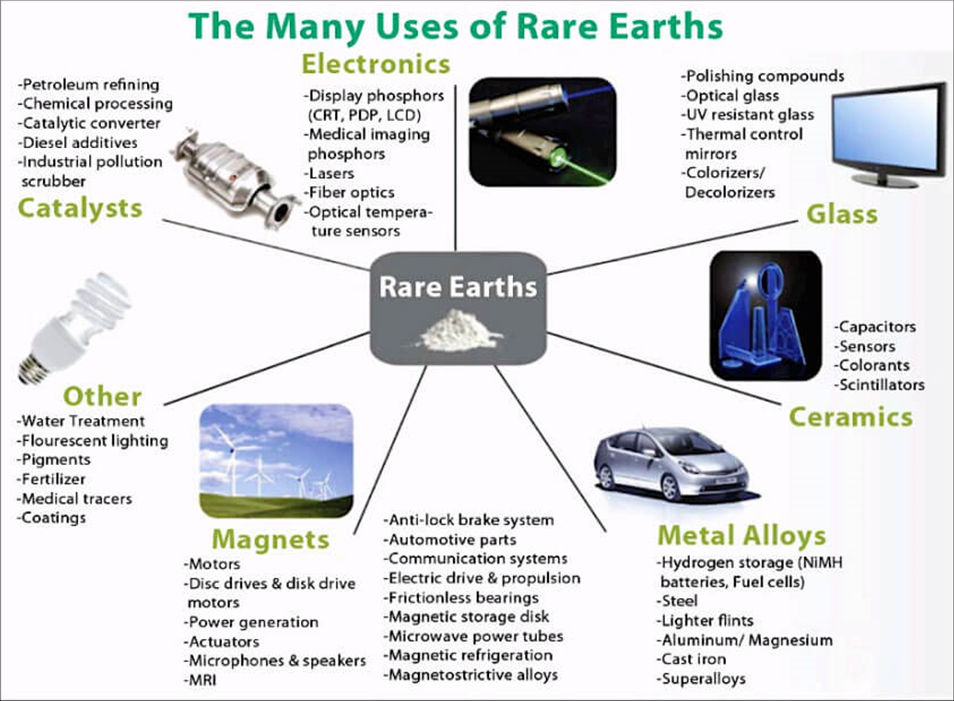
Rare Earth Elements are 17 silvery-white heavy metals with special magnetic capabilities. REEs have diverse applications and are commonly used in lasers, glass, superconductors, hard drives, wind turbine generators, and magnetic materials. Despite the name, REEs are abundant in the world, often found underground alongside uranium in sand structures called monazite. REEs concentrate must first be separated from the sand. Neodymium and praseodymium (NdPr) represent about 80% of the value of REE concentrate. Demand for these elements is growing because of their use in electric vehicles, wind turbines, and appliances. Adams Intelligence expects the demand for NdPr to double in the next five years. Removing REEs from monazite and then separating REEs into individual components is a complicated process.


Who is Processing REE Concentrate?

Monazite represents 60% of the world’s REE supply and is readily available. A handful of companies are currently involved in the removal of REE concentrate from monazite. The Mountain Pass Mine, an open-pit mine located southwest of Las Vegas and owned by MP Materials, supplied 16% of the world’s RRE concentration production. It ships 50,000 tonnes of concentrate per year to China. Energy Fuel’s White Mesa Mill in Utah began processing REE concentrate last November and is in the process of ramping up operations. The company has signed an intake agreement to acquire 2,500 tonnes of monazite sands from Chemours Company and another intake agreement with Hyperion to purchase an undetermined amount of sand. The company has stated a goal of processing 15,000 tonnes annually.  Energy Fuels has also signed an outtake agreement to provide REE concentrate to NEO Performance Materials and expects to supply 840 tonnes of REE oxides per year (80% of Energy Fuel’s contract with Chemours) which implies that REE concentrate represents approximately 40% of the monazite sand.


Who is separating REEs?

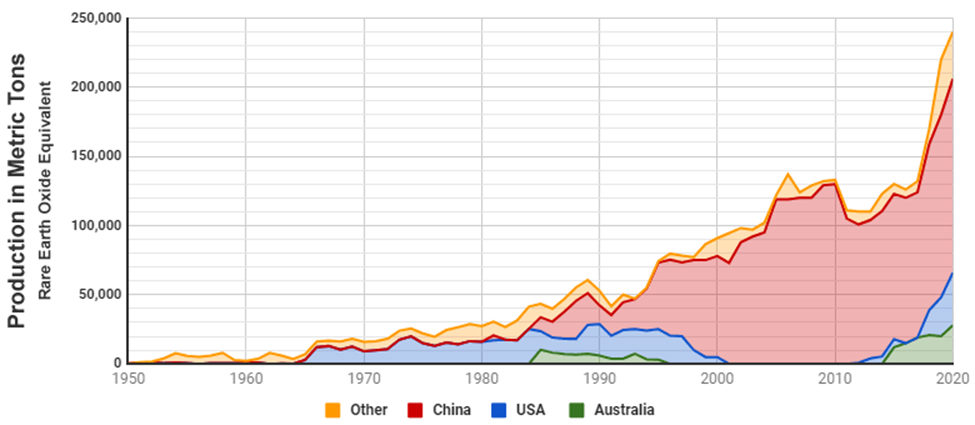
China is responsible for 80% of the REE produced in the world. Most of the world’s separation is done by a single plant in China owned by Shenghe Resources. The United States dominated the REE market as recently as the eighties but has fallen back in recent years. China has advantages over other REE producers because of lesser environmental restrictions. Lynas Corporation, an Australian mining company, owns a separation facility in Malaysia and is planning to build plants in Australia near its Mt. Weld mine and the United States. NEO Performance Materials owns an REE separations facility in Estonia (Silmet), which also supplies uranium and enriched uranium to Russia. Several other participants have recently announced plans to begin separating REE. MP Materials plans to produce 5,000 tonnes of the two most common rare earth metals at its mill near Las Vegas. Medallion Resources has announced plans to build a plant that would produce approximately 3,500 tonnes of rare-earth products. Australian Strategic Metals has announced plans for a plant in Dubbo, Australia.  Energy Fuels has stated its intent to separate REE and recently engaged Carester SAS, a leading expert in REE separation, to develop extraction operations at its White Mesa Mill in Utah. In March 2021, the Department of Energy announced a $30 million initiative to research and secure the U.S. supply chain for REE and recently awarded a $1.75 million grant to Energy Fuels for a rare earth feasibility study.


Financial Impacts of Mining, Milling, and Separating REEs?

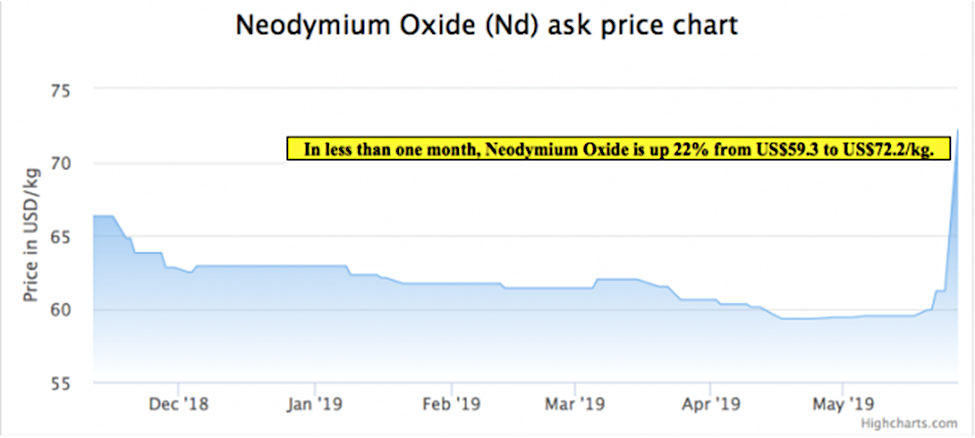
Putting financial numbers into operations is difficult. Many companies report REE operations as a subsidiary and do not provide full financial results. Other companies are private or government entities. Finally, both REE pricing and input costs can be very volatile and subject to trader influence. Still, some very vague generalizations can be made. Lynas financial reports show that REE prices have risen in recent quarters to a level near US$50/kg, or US$50,000/tonnes. With demand growing for REE with the growth of electric vehicles, wind power, and other products that use REE, it is reasonable to believe prices could continue to rise. Estimating the input and operating costs to separate REEs is more difficult because the concentration of REE in monazite is not consistent. Lynas reports Cost of Sales that are close to 75% of revenues implying concentrate costs of US$37,500/tonnes at current REE concentrate prices near $50,000.  If one extends the reported financial results of Lynas to REE separating, in general, that will imply that a separator could generate $12,750 per tonnes of REE separated.


Suggested Content:

Supply and Demand Fundamentals for Platinum and Palladium

How do Gold Royalty Companies Work?


Natural Resources Panel – NobleCon Video (January 2021)

US Rare Earth Mining Gets Boost From Government (August 2020)


Sources

https://www.mining.com/a-new-magnetic-way-to-separate-rare-earths/, Valentina Ruiz Leotaud, Mining.com, November 3, 2019

https://en.wikipedia.org/wiki/Mountain_Pass_mine

https://en.wikipedia.org/wiki/Rare-earth_element

https://www.cnbc.com/2021/04/17/the-new-us-plan-to-rival-chinas-dominance-in-rare-earth-metals.html, Samantha Subin, CNBC, April 17, 2021

https://www.reuters.com/article/us-usa-rareearths-insight/american-quandary-how-to-secure-weapons-grade-minerals-without-china-idUSKCN2241KF, Ernest Scheyder, Reuters, April 22, 2020

https://en.wikipedia.org/wiki/Silmet

https://www.caesarsreport.com/reports/report-medallion-resources-ree-prices-showing-substantial-price-increases/,

https://medallionresources.com/wp-content/uploads/2019/03/MDL-FactSheet-March-2019.pdf

Stay up to date. Follow us:


Stay up to date. Follow us:

Vectrus (VEC) – Strong First Quarter Results

Wednesday, May 12, 2021

Vectrus (VEC)
Strong First Quarter Results

Vectrus Inc is a U.S.-based company that provides services to the U.S. government. It operates as one segment and offer facility and logistics services and information technology and network communications services. The information technology and network communications capabilities consist of communications systems operations and maintenance, management and service support, systems installation and activation, system-of-systems engineering and software development, and mission support for the department of defense. The facility and logistics service include airfield management, ammunition management, civil engineering, communications, emergency services, life support activities, public works, security, transportation operations and others.

Joe Gomes, Senior Research Analyst, Noble Capital Markets, Inc.

Refer to the full report for the price target, fundamental analysis, and rating.

    1Q21 Results. Vectrus’ 1Q21 revenue was $434 million, up 23% y-o-y, with organic growth of 4%. Adjusted EBITDA was $20.7 million, up from $14.7 million last year. Adjusted EBITDA margin increased 60 basis points to 4.8%. EPS was $1.02 compared to $0.74, while adjusted EPS was $1.20 in 1Q21 versus $0.82 last year. We had forecast revenue of $400 million, adjusted EBITDA of $19.3 million, and EPS of $0.89.

    Winning Never Gets Old.  Vectrus continued to be award significant contracts during the first quarter. Significantly, a number of the contracts play into the Company’s converged infrastructure market leadership position. The contract wins continue to diversify Vectrus’ client base and geographical locations …


This research is provided by Noble Capital Markets, Inc., a FINRA and S.E.C. registered broker-dealer (B/D).

*Analyst certification and important disclosures included in the full report. NOTE: investment decisions should not be based upon the content of this research summary.  Proper due diligence is required before making any investment decision. 

Release – Flotek Welcomes New Vice President of Professional Chemistries


Flotek Welcomes New Vice President of Professional Chemistries

30-Year Jan-San Veteran to Lead Business Development

HOUSTON, May 10, 2020 — Flotek Industries, Inc. (“Flotek” or the “Company”) (NYSE: FTK) is pleased to announce Matthew P. Sullivan has joined the Company as Vice President of Professional Chemistries. In this role, he will oversee the Company’s business development strategy and implementation for Flotek’s cleaning, disinfecting and sanitizing product line. He will report directly to Ryan Ezell, Ph.D, President of Flotek’s Chemistry Technologies segment.
 

Sullivan is an experienced leader in the Away from Home market, with a specialization in the janitorial and sanitizing segment, bringing more than 30 years’ experience to the role. He joins Flotek from Georgia-Pacific, a Koch Industries company, where he held a variety of leadership roles, and most recently, served as Director of Sales for the Northeast Market for GP Pro. He started his career at Scott Paper Company in 1989, later becoming senior market manager at Kimberly Clark, following the Scott and Kimberly Clark merger. Sullivan joined Clorox Professional for six years running 24 states in the Eastern region. In 2003, he served on the leadership team of Technical Concepts (TC), the world leader in restroom automation systems, which sold to Newell Rubbermaid in 2008.
 

“I’m incredibly excited to welcome Matt to our team here at Flotek. I am confident Matt will help accelerate the momentum we have built in our professional chemistries product line. For decades, Matt has built a reputation as a trusted leader and partner to customers, helping to solve their challenges through meaningful solutions,” said Ezell.
 

“I am thrilled to join Flotek at such an exciting time in the Company’s journey. With Flotek’s chemistry and manufacturing core competencies, I am eager to develop and promote our technologies and portfolio of product solutions to the marketplace. Flotek’s agility and ability to meet distribution and end user demands will create mutual value for all stakeholders – end users, distributors and shareholders,” said Sullivan. “I am humbled and honored that the Flotek leadership team and Board has entrusted me with this pursuit. I look forward to leveraging my relationships, experience and market knowledge in the janitorial and sanitizing industry – built over my professional lifetime – to grow the Company’s professional chemistries business.”
 

As an inducement to join the Company and to closely align interests with the Company’s shareholders, Sullivan has been granted 60,000 restricted stock awards (RSAs) that will vest over three years.
 

Sullivan graduated from Northeastern University in Boston with a Bachelor of Science in journalism. He resides in Freehold, New Jersey.
 

In March, the Company launched Flotek Protekol™, its full suite of high-performance surface cleaners, disinfectants, wipes and sanitizers. The product line is made with ingredients sourced, formulated, blended and bottled in the USA, and includes products registered with the U.S. Food and Drug Administration (FDA) and Environmental Protection Agency (EPA). More information can be found at www.flotekprotekol.com.

About Flotek
Industries

Flotek Industries, Inc. is a technology-driven, specialty chemistry and data company that helps customers across industrial, commercial and consumer markets improve their Environmental, Social and Governance performance. Flotek’s Chemistry Technologies segment develops, manufactures, packages, distributes, delivers, and markets high-quality cleaning, disinfecting and sanitizing products for commercial, governmental and personal consumer use. Additionally, Flotek empowers the energy industry to maximize the value of their hydrocarbon streams and improve return on invested capital through its real-time data platforms and green chemistry technologies. Flotek serves downstream, midstream and upstream customers, both domestic and international. Flotek is a publicly traded company headquartered in Houston, Texas, and its common shares are traded on the New York Stock Exchange under the ticker symbol “FTK.” For additional information, please visit Flotek’s web site at www.flotekind.com.

Forward-Looking
Statements

Certain statements set forth in this press release constitute forward-looking statements (within the meaning of Section 27A of the Securities Act of 1933 and Section 21E of the Securities Exchange Act of 1934) regarding Flotek Industries, Inc.’s business, financial condition, results of operations and prospects. Words such as will, continue, expects, anticipates, intends, plans, believes, seeks, estimates and similar expressions or variations of such words are intended to identify forward-looking statements, but are not the exclusive means of identifying forward-looking statements in this press release.  Although forward-looking statements in this press release reflect the good faith judgment of management, such statements can only be based on facts and factors currently known to management.  Consequently, forward-looking statements are inherently subject to risks and uncertainties, and actual results and outcomes may differ materially from the results and outcomes discussed in the forward-looking statements.  Further information about the risks and uncertainties that may impact the Company are set forth in the Company’s most recent filing with the Securities and Exchange Commission on Form 10-K (including, without limitation, in the “Risk Factors” section thereof), and in the Company’s other SEC filings and publicly available documents.  Readers are urged not to place undue reliance on these forward-looking statements, which speak only as of the date of this press release. The Company undertakes no obligation to revise or update any forward-looking statements in order to reflect any event or circumstance that may arise after the date of this press release.

Contact:
Danielle Allen
Senior Vice President, Chief of Staff
E: DAllen@flotekind.com
P: (713) 726-5322

Townsquare Media Inc (TSQ) – Strong Recovery With 2019 In Focus

Tuesday, May 11, 2021

Townsquare Media Inc (TSQ)
Leaning In With A Digital First Strategy

Townsquare Media Inc is an entertainment and media company offering digital marketing solutions in the United States and Canada. It owns and operates radio stations, social media properties focusing the small and mid-cap companies. Services offered to the clients include live events, local advertising, digital advertising, e-commerce offerings, few others. The segments through which the company operates its businesses are classified into Local marketing solutions and Entertainment segments. Revenues are generated from commercials through broadcasts and sale of internet based advertisements.

Michael Kupinski, Director of Research, Noble Capital Markets, Inc.

Refer to the full report for the price target, fundamental analysis, and rating.

    Q1 results appear in line. Q1 revenues were $88.7 million versus our $87.5 million estimate. Cash flow, as measured by adjusted EBITDA, was $20.1 million versus our $18.4 million estimate, enhanced by lower-than-expected corporate expenses and better gross profit margins.

    Q2 guidance well above expectations.  Q2 revenues are expected to be between $101 million and $104 million, for growth between 36% to 40% on a year-over-year basis. Importantly, Q2 revenue guidance is a modest 4% to 7% decline compared to the second quarter 2019. We have adjusted upward our Q2 revenue estimate from $83.5 million to $102.5 million and our adjusted EBITDA estimate from $10.0 million to…


This Company Sponsored Research is provided by Noble Capital Markets, Inc., a FINRA and S.E.C. registered broker-dealer (B/D).

*Analyst certification and important disclosures included in the full report. NOTE: investment decisions should not be based upon the content of this research summary.  Proper due diligence is required before making any investment decision. 

The GEO Group, Inc. (GEO) – Better-Than-Expected First Quarter Results

Tuesday, May 11, 2021

The GEO Group, Inc. (GEO)
Better-Than-Expected First Quarter Results

With over 94,000 beds owned, leased or managed across its business lines and serving over 260,000 people daily, GEO is a leading provider of mission critical real estate to its governmental partners. The Company is the first fully integrated equity REIT specializing in the design, financing, development, and operation of secure facilities, processing centers, and community reentry centers in the U.S., Australia, South Africa, and the U.K.

Joe Gomes, Senior Research Analyst, Noble Capital Markets, Inc.

Refer to the full report for the price target, fundamental analysis, and rating.

    1Q21 Results. The GEO Group reported first quarter 2021 net income of $50.5 million, or $0.41 per diluted share, compared to $25.2 million, or $0.21 per diluted share, for the first quarter 2020. Total revenue for the first quarter 2021 was $576.4 million compared to $605.0 million in the same period last year. GEO reported adjusted net income of $34.1 million, or $0.28 per diluted share, compared to $28.8 million, or $0.24 per diluted share, for the first quarter 2020. We had projected revenue of $579 million and EPS of $0.20.

    Favorable Cost Trends.  The quarter adjusted EPS beat was driven by favorable cost trends, especially in the Secure Services business, reflecting lower y-o-y populations. G&A as a percent of revenue fell to 8.41% from 8.89%, while operating costs as a percent of revenue dropped to…


This Company Sponsored Research is provided by Noble Capital Markets, Inc., a FINRA and S.E.C. registered broker-dealer (B/D).

*Analyst certification and important disclosures included in the full report. NOTE: investment decisions should not be based upon the content of this research summary.  Proper due diligence is required before making any investment decision. 

Information Services Group (III) – First Quarter Beat – Initiates Dividend

Tuesday, May 11, 2021

Information Services (III)
First Quarter Beat; Initiates Dividend

ISG (Information Services Group) (Nasdaq: III) is a leading global technology research and advisory firm. A trusted business partner to more than 700 clients, including more than 70 of the top 100 enterprises in the world, ISG is committed to helping corporations, public sector organizations, and service and technology providers achieve operational excellence and faster growth. The firm specializes in digital transformation services, including automation, cloud and data analytics; sourcing advisory; managed governance and risk services; network carrier services; strategy and operations design; change management; market intelligence and technology research and analysis. Founded in 2006, and based in Stamford, Conn., ISG employs more than 1,300 digital-ready professionals operating in more than 20 countries—a global team known for its innovative thinking, market influence, deep industry and technology expertise, and world-class research and analytical capabilities based on the industry’s most comprehensive marketplace data. For more information, visit www.isg-one.com

Joe Gomes, Senior Research Analyst, Noble Capital Markets, Inc.

Refer to the full report for the price target, fundamental analysis, and rating.

    1Q21 Results. Revenue totaled $66.8 million, up from $63.7 million a year ago. Net income was was a record $3.4 million, or $0.07 per share, compared to a net loss of $1.4 million, or $0.03 per share last year. Adjusted EPS was $0.10 versus $0.02 last year. First quarter adjusted EBITDA was $8.6 million, up from $3.5 million in the first quarter of 2020. We had projected revenue of $63 million, EPS of $0.02, and adjusted EBITDA of $7.2 million.

    Best Start Ever.   ISG is off to its best start ever, with rising demand for all things digital and the Company’s new operating model driving results. ISG signed its largest ever ISG Automation contract, valued at more than…


This Company Sponsored Research is provided by Noble Capital Markets, Inc., a FINRA and S.E.C. registered broker-dealer (B/D).

*Analyst certification and important disclosures included in the full report. NOTE: investment decisions should not be based upon the content of this research summary.  Proper due diligence is required before making any investment decision. 

Release – Flotek Announces First Quarter 2021 Results


Flotek Announces First Quarter 2021 Results

Q1’21 EBITDA Improves Sequentially

HOUSTON, May 10, 2021 – Flotek Industries, Inc. (“Flotek” or the “Company”) (NYSE: FTK) today announced results for the first three months ended March 31, 2021.
 

John W. Gibson, Jr., Chairman, President, and Chief Executive Officer stated: “While we experienced a slow start to the quarter due to the continued challenging macro-environment and impacts of Winter Storm Uri, we are pleased with our progress through the quarter as demand significantly increased across both segments towards the end of the quarter and continued into this quarter. We are excited about the momentum we have and are optimistic about our opportunities for growth across our business as the market continues its recovery in the latter half of the year.
 

“We are accelerating our ESG solutions, which we believe will be a key growth driver as the energy market increases its focus on ESG amid an evolving regulatory framework. Over the years, we have built a leading position as a developer of green chemistry solutions, and we are delivering our suite of greener chemistry and data solutions to meet our customers’ evolving needs today. Additionally, we continue to see significant opportunities in international markets and are optimistic about the momentum we are gaining in key growth markets. Lastly, we are strengthening our liquidity to improve our financial flexibility. As a result of these actions, we continue to be confident in our long-term strategy, and I look forward to working with our outstanding leadership team to further improve operational and financial performance.”


First Quarter
Financial Results
 

  • Consolidated Revenues:  Flotek generated first quarter 2021 consolidated revenue of $11.8 million, down 2.8% from $12.1 million in the fourth quarter, and below $19.4 million in the first quarter last year. The year-over-year decrease in revenue was driven by trends in the macro-environment for U.S. onshore drilling and completion activity and the COVID-19 pandemic continues to pressure productivity and global customer demand.
  • Consolidated Operating
    Expenses:
      Consolidated operating expenses (excluding depreciation and amortization) were $13.8 million in the first quarter 2021, a 39.6% decline from $22.8 million in the same period last year and a 43.3% decline from the prior quarter. The year-over-year decline was driven by a reduction in costs of sales due to lower sales, as well as lower operating expense driven by consolidation of corporate facilities, reduction of equipment rentals, lowered personnel costs and supply chain expenses.
  • Corporate General &
    Administrative Expenses (CG&A):
      Corporate general and administrative expenses for the first quarter of 2021 were $4.4 million, compared to $4.5 million for the first quarter of 2020 and $3.7 million for the fourth quarter of 2020. The year-over-year decline was primarily driven by lower personnel and severance costs that occurred in the first quarter 2020, as well as a reduction in occupancy costs as the Company moved out of its corporate headquarters and consolidated its Global Research & Innovation Center. The sequential increase was primarily driven by an increase in one-time legal, accounting and other professional fees, offset by a decrease in compensation.
  • Adjusted EBITDA:  Adjusted EBITDA for the first quarter 2021 was a loss of $6.6 million, slightly below the $6.8 million loss in the fourth quarter of 2020, driven by an increase in one-time professional fees, offset by lower compensation. 
  • Loss from Operations:  The Company reported a loss from operations for the first quarter 2021 of $8.3 million, or a loss of $0.12 per basic/diluted share, compared to a loss from operations in the first quarter 2020 of $64.0 million, or a loss of $1.07 per basic/diluted share which included a non-recurring charge of $57.5 million related to the impairment of property, plant, and equipment, right-of-use assets, and intangible assets.

Balance Sheet and Liquidity
As of March 31, 2021, the Company had cash and equivalents of $33.9 million, with significant year-over-year improvements in cash usage driven by operational efficiencies across the business. Flotek also had a combined $5.7 million of loans outstanding pursuant to the Paycheck Protection Program (“PPP”) related to the “Cares Act.” 
 

Chemistry Technologies
Segment: Energy Chemistries & Professional Chemistries

In the first quarter, sales in the Chemistry Technologies segment declined sequentially 5.0% to $10.3 million. The decrease was primarily a result of continued market volatility in the macro-environment impacting energy supply and major disruption in February from Winter Storm Uri, impacting the entire supply chain. The segment experienced notable pickup in March as demand significantly increased. Highlights from the quarter include:
 

  • Despite the winter storm in February, the Company saw a rebound in its domestic energy chemistries business, up 56%, on a sequential basis. Internationally, following headwinds in market activity and purchasing delays, the Company regained traction towards the end of the quarter.
  • The Company engaged with C-Suite leaders at E&Ps to reintroduce the Company’s Environmental, Social and Governance-focused (ESG) value proposition to deliver cost-effective, environmentally friendly, safer chemistry solutions.
  • In the quarter, the Company initiated key field trial applications for its green, reservoir-centric chemistry technologies.
  • The Company hired Nathan Snoke as Vice President of Energy Chemistries. A global leader in differentiated oilfield services, Snoke joins the Company from Halliburton, where he was most recently Senior Region Manager of Europe, Eurasia, and Sub-Sahara Africa, based in London.  Nathan brings more than 16 years of oil and gas experience to Flotek, ranging from field operations to senior-level management across multiple continents.
  • In the first quarter, Flotek launched its new professional chemistries brand, Flotek Protekol™, which includes a comprehensive line of surface cleaners, degreasers, wipes, disinfectants and sanitizers made in the USA.
  • Flotek formed a strategic agreement with a major global manufacturer of specialty and intermediate chemicals in the first quarter to produce and package EPA-registered disinfectant wipes.  
  • The Company hired Matthew Sullivan as Vice President of Professional Chemistries to lead business development. Sullivan has more 30 years of janitorial and sanitizing sales and marketing expertise, including Georgia-Pacific, Clorox, Kimberly Clark and Scott Worldwide.  

Data Analytics Segment
In the first quarter, Data Analytics’ sales improved 16.7% sequentially to $1.5 million, primarily driven by an increase in new equipment sales in North America. Flotek continued to enhance its offerings and increase its efficiency in delivering solutions, while targeting new customers and markets to transform their businesses through real-time data and analytics. Highlights include:
 

  • Added new customers and increased repeat purchases from existing customers, demonstrating the value JP3 delivers to its customers with the multi-applications of its technologies.
  • Made progress on its international market entry strategy by continuing meaningful engagement with potential customers in the Middle East, Africa and Asia.  During the first quarter, Flotek secured its second pilot in the Middle East and completed its site survey with its first international pilot. 
  • Implemented software development enhancements by accelerating Artificial Intelligence (“AI”) and machine learning capabilities, improving the precision of measurement between batches of refined hydrocarbon products – reducing time, waste and money spent. During the first quarter, the company launched its first application using AI in batch interface for pipelines and successfully installed the application in two locations. 
  • Accelerated discussions with customers on its “green benefits” portfolio of applications which helps companies reduce their carbon footprint, energy consumption and emissions. The Company will continue to help customers improve their ESG performance through its JP3 product offerings.


Termination of
Agreement with Florida Chemical Company

 As previously disclosed in an 8-K filing on March 29, 2021, Flotek Chemistry, LLC, a wholly-owned subsidiary of Flotek, delivered a notice of termination for the Supply Agreement between Flotek and Florida Chemical Company, LLC (FCC) dated February 28, 2019 following Florida Chemical’s refusal to allow Flotek to exercise its contractual rights to audit the books and records related to the cost of terpene purchased. Flotek believes it has sufficient terpene inventory and alternative terpene supply sources to meet its requirements and does not intend to purchase additional supplies of terpene from FCC.


Going forward, the Company’s supply management strategy will align terpene purchases with its demand and does not expect that the termination of the Supply Agreement will have a material effect on its operations or ability to meet customer needs.


Conference Call
Details


Flotek will host a conference call on Tuesday, May 11, 2021, at 9:00 am CDT (10:00 a.m. EDT) to discuss its first quarter results ended March 31, 2021. To participate in the call, participants should dial 844-835-9986 approximately five minutes prior to the start of the call. The call can also be accessed from Flotek’s website at www.flotekind.com.


About Flotek
Industries, Inc.


Flotek Industries, Inc. is a technology-driven, specialty chemistry and data company that helps customers across industrial, commercial and consumer markets improve their Environmental, Social and Governance performance. Flotek’s Chemistry Technologies segment develops, manufactures, packages, distributes, delivers, and markets high-quality cleaning, disinfecting and sanitizing products for commercial, governmental and personal consumer use. Additionally, Flotek empowers the energy industry to maximize the value of their hydrocarbon streams and improve return on invested capital through its real-time data platforms and green chemistry technologies. Flotek serves downstream, midstream and upstream customers, both domestic and international. Flotek is a publicly traded company headquartered in Houston, Texas, and its common shares are traded on the New York Stock Exchange under the ticker symbol “FTK.” For additional information, please visit Flotek’s web site at www.flotekind.com.


Forward-Looking
Statements

Certain statements set forth in this press release constitute forward-looking statements (within the meaning of Section 27A of the Securities Act of 1933 and Section 21E of the Securities Exchange Act of 1934) regarding Flotek Industries, Inc.’s business, financial condition, results of operations and prospects. Words such as will, continue, expects, anticipates, intends, plans, believes, seeks, estimates and similar expressions or variations of such words are intended to identify forward-looking statements, but are not the exclusive means of identifying forward-looking statements in this press release.  Although forward-looking statements in this press release reflect the good faith judgment of management, such statements can only be based on facts and factors currently known to management.  Consequently, forward-looking statements are inherently subject to risks and uncertainties, and actual results and outcomes may differ materially from the results and outcomes discussed in the forward-looking statements.  Further information about the risks and uncertainties that may impact the Company are set forth in the Company’s most recent filing with the Securities and Exchange Commission on Form 10-K (including, without limitation, in the “Risk Factors” section thereof), and in the Company’s other SEC filings and publicly available documents.  Readers are urged not to place undue reliance on these forward-looking statements, which speak only as of the date of this press release. The Company undertakes no obligation to revise or update any forward-looking statements in order to reflect any event or circumstance that may arise after the date of this press release.


Inquiries, contact:
Danielle Allen
Senior Vice President, Chief of Staff
E: DAllen@flotekind.com
P: (713) 726-5322

Release – Endeavour Silver Reports Financial Results for the First Quarter 2021


Endeavour Silver Reports Financial Results for the First Quarter 2021; Earnings Conference Call at 10am PDT (1pm EDT) Today

VANCOUVER,
British Columbia, May 11, 2021 (GLOBE NEWSWIRE) — Endeavour Silver Corp.
(NYSE: EXK; TSX: EDR)
released its financial results today for the three months ended March 31, 2021. The Company operates three silver-gold mines in Mexico: the Guanacevi mine in Durango state, the Bolanitos mine in Guanajuato state and the El Compas mine in Zacatecas state.

Bradford Cooke, CEO, commented, “We are off to a good start in 2021, with the mining operations meeting our production plans notwithstanding the severe weather events that caused a slow down of production during the 1st quarter. As a result, our operating costs were a bit higher than plan but we expect costs to be lower going forward.”

“Revenue, cash flow and earnings were all sharply higher in Q1, 2021 compared to Q1, 2020. The sale of El Cubo helped boost our earnings, offset by our decisions to hold back some metal inventory from sale near the end of the 1st quarter as well as elevated general and administrative expenses.”

“The Terronera feasibility study is on track for completion in the 3rd quarter and exploration is ongoing at each of our mines and projects to test highly prospective targets. We have a busy year ahead, as our attention turns to developing our next core asset at Terronera.”

2021 First
Quarter Highlights

  • Metal Production: Produced 1,039,710 ounces (oz) silver, up 22% and 10,894 oz gold, up 31%, in line with guidance of 1.9 million oz silver equivalent (AgEq), up 26%, at an 80:1 silver:gold ratio, compared to Q1, 2020.
  • Gross Sales: Total $35.1 million, up 58%, from the sale of 623,379 oz of silver and 10,663 oz gold at average realized prices of $27.17 per oz silver and $1,703 per oz gold.  Held 523,235 oz silver and 1,123 oz gold of bullion inventory and 6,582 oz silver and 566 oz gold in concentrate inventory. Management withheld metal from sale during the price correction over last two weeks of March.
  • Operating Costs: Cash cost(1) $7.86 per oz payable silver, flat year-on-year and all-in sustaining cost (AISC)
    (1) $19.94 per oz payable silver, up 8% year-on-year, both net of gold credits.
  • Cash Flow: $5.2 million in cash flow from operations before working capital changes, up 205% compared to Q1, 2020 as the Company accumulated finished goods, invested in exploration activities and advanced the Terronera Feasibility Study.
  • Net Earnings: Earnings of $12.2 million or $0.08 per share, up sharply compared to a loss of $15.9 million in Q1, 2020 due to the reversal of the historical impairment of the El Cubo asset sold in April, offset by increased exploration activities, evaluation activities, and higher tax expense. Excluding the impairment reversal, the adjusted earnings resulted in a loss of $4.5 million. At quarter end, the finished golds inventory was carried at a cost of $8.0 million compared to the fair market value of $15.9 million.
  • Agreement to Sell the El Cubo Assets: Advanced the sale of the El Cubo assets in Guanajuato, Mexico to Vangold Mining Corp for $15 million in cash and share payments with up to $3 million in contingent payments, with the transaction closing April 9, 2021.
  • Balance Sheet: Cash position $86.0 million, up 473% and working capital $113.1 million, up 316% compared to Q1, 2020. Raised $30.1 million in equity financing through an ATM facility. Only term liabilities are equipment loans of $8.7 million, entered into in previous years to upgrade the mobile fleet.

(1) Mine
operating cash flow, cash costs and all-in sustaining costs are non-IFRS
measures. Please refer to the definitions in the Company’s Management Discussion
& Analysis.

Financial
Overview

In Q1, 2021, net revenue increased 58% to $34.5 million as a result of higher metal prices and increased production. As a result, mine operating cash flows, operating cash flows and EBITDA all increased significantly compared to Q1, 2020. The Company recognized earnings of $12.2 million compared to a loss of $15.9 million in Q1, 2020. An impairment reversal of $16.8 million was recognized as a result of the classifying the El Cubo mine and related assets and liabilities, as held for sale in relation to the April 9th sale.

Cost of sales for Q1, 2021 was $28.8 million, an increase of 16% over the cost of sales of $24.8 million for the same period of 2020. The increase in cost of sales was primarily related to significantly higher royalty costs and labour costs partially offset by improved productivity at the Guanacevi and Bolanitos operations. Royalties increased 187% to $2.5 million due to higher realized prices and the increased mining of the high grade Porvenir Cuatro extensions at the Guanacevi operation which is subject to the significantly higher royalty rates.

The Company increased its finished goods silver and gold inventory to 529,817 oz and 1,689 oz, respectively at March 31, 2021 compared to 116,484 oz silver and 1,459 oz gold at December 31, 2020. The cost allocated to these finished goods was $8.0 million at March 31, 2021, compared to $3.6 million at December 31, 2020. At March 31, 2021, the finished goods inventory fair market value was $15.9 million, compared to $5.8 million at December 31, 2020.

Financial
Results (Consolidated Statement of Operations Appended Below)

For the period ended March 31, 2021, the Company generated net revenue of $34.5 million an increase of 58% compared to $21.9 million. Gross sales of $35.1 million in Q1, 2021 represented a 57% increase over the $22.8 million for the same period in 2020. There was a 6% decrease in silver ounces sold and a 77% increase in the realized silver price resulting in a 66% increase to silver sales. There was a 43% increase in gold ounces sold with a 4% increase in realized gold prices resulting in a 49% increase in gold sales. During the period, the Company sold 623,379 oz silver and 10,663 oz gold, for realized prices of $27.17 and $1,703 per oz respectively, compared to sales of 665,500 oz silver and 7,454 oz gold, for realized prices of $15.33 and $1,633 per oz, respectively, in the same period of 2020. For the three months ended March 31, 2021, silver and gold spot prices averaged $26.26 and $1,794, respectively.  

After cost of sales of $28.8 million (Q1, 2020 – $24.8 million), mine operating earnings amounted to a $5.7 million (Q1, 2020 – loss of $2.9 million) from mining and milling operations in Mexico.

Excluding depreciation and depletion of $7.5 million (Q1, 2020 – $6.0 million), stock-based compensation of $0.1 million (Q1, 2020- $0.1 million) mine operating cash flow before taxes was $13.3 million in Q1, 2021 (Q1, 2020 – $4.3 million). Operating earnings were $14.3 million (Q1, 2020 – loss of $8.6 million) after exploration and evaluation expenditures of $4.1 million (Q1, 2020 – $2.4 million), general and administrative expense of $3.5 million (Q1, 2020 – $2.0 million) and El Cubo care and maintenance costs of $0.5 million (Q1, 2020 – $1.3 million). An impairment reversal of $16.8 million was recognized as a result of the classifying the El Cubo mine and related assets and liabilities as held for sale in relation to the April 9th sale.

Net earnings amounted to $12.2 million ($0.08 per share) compared to a net loss of $15.9 million (loss of $0.11 per share) in Q1, 2020.

Current income tax expense increased to $0.7 million (Q1, 2020 – $0.3 million) related to an increase in special mining duty, while deferred income tax expense of $3.1 million was recognized due to the estimated use of loss carry forwards to reduce taxable income at Guanacevi and Bolanitos (Q1, 2020 – $1.9 million).

Direct operating costs per tonne in Q1, 2021 increased 16%, to $112.36 compared with Q1, 2020 due to higher operating costs at Guanacevi and Bolanitos, offset by lower costs at El Compas. Guanacevi and Bolanitos have seen increased labour costs and increased third party ore purchased at Guanacevi compared to prior year. Including royalties and special mining duty, direct costs per tonne increased 24% to $126.23. Royalties increase 187% to $2.5 million as increased production from the El Curso concession at Guanacevi and higher prices substantially increased the royalty expense. The higher prices and higher grades increased special mining duty expense to $0.4 million for Q1, 2021.

Consolidated cash costs per ounce, net of by-product credits (a non-IFRS measure and a standard of the Silver Institute) was flat at $7.86 as the higher grades and higher prices offset the higher direct costs per tonne. All-in sustaining costs (also a non-IFRS measure) increased 8% to $19.84 per ounce in Q1, 2021 as a result of higher corporate general and administrative costs and increased capital expenditures at Guanacevi to accelerate mine development within the El Curso ore body. In Q1, 2020 corporate general and administrative included a $1.1 million mark to market recovery of deferred share units expense whereas the mark to market recovery was $0.2 million in Q1, 2021.
  
The Condensed Consolidated Interim Financial Statements and Management’s Discussion & Analysis can be viewed on the Company’s website at www.edrsilver.com, on SEDAR at www.sedar.com and EDGAR at www.sec.gov. All amounts are reported in US$.

Conference
Call

A conference call to discuss these results will be held today, Tuesday, May 11 at 10am PDT (1pm EDT). To participate in the conference call, please dial the numbers below. No pass-code is necessary.

Toll-free in Canada and the US: 1-800-319-4610
Local Vancouver: 604-638-5340
Outside of Canada and the US: +-604-638-5340

A replay of the conference call will be available by dialing 1-800-319-6413 in Canada and the US (toll-free) or +604-638-9010 outside of Canada and the US. The required pass-code is 6594 #. The replay will also be available on the Company’s website at www.edrsilver.com.

About
Endeavour Silver –
Endeavour Silver Corp. is a mid-tier precious metals mining company that owns and operates three high-grade, underground, silver-gold mines in Mexico. Endeavour is currently advancing the Terronera mine project towards a development decision and exploring its portfolio of exploration and development projects in Mexico and Chile to facilitate its goal to become a premier senior silver producer.  Our philosophy of corporate social integrity creates value for all stakeholders.

SOURCE Endeavour Silver Corp.

Contact Information:

Galina Meleger, Director Investor Relations
Toll free: (877) 685-9775
Tel: (604) 640-4804
Email: gmeleger@edrsilver.com  
Website: www.edrsilver.com

Follow Endeavour Silver on Facebook, Twitter, Instagram and LinkedIn

Cautionary
Note Regarding Forward-Looking Statements

This news
release contains “forward-looking statements” within the meaning of the United
States private securities litigation reform act of 1995 and “forward-looking
information” within the meaning of applicable Canadian securities legislation.
Such forward-looking statements and information herein include but are not
limited to statements regarding Endeavour’s anticipated performance in 2021
including changes in mining operations and production levels, the timing and
results of various activities and the impact of the COVID 19 pandemic on
operations. The Company does not intend to and does not assume any obligation
to update such forward-looking statements or information, other than as
required by applicable law.

Forward-looking
statements or information involve known and unknown risks, uncertainties and
other factors that may cause the actual results, level of activity, production
levels, performance or achievements of Endeavour and its operations to be
materially different from those expressed or implied by such statements. Such
factors include but are not limited to the ultimate impact of the COVID 19
pandemic on operations and results, changes in production and costs guidance,
national and local governments, legislation, taxation, controls, regulations
and political or economic developments in Canada and Mexico; financial risks
due to precious metals prices, operating or technical difficulties in mineral
exploration, development and mining activities; risks and hazards of mineral
exploration, development and mining; the speculative nature of mineral
exploration and development, risks in obtaining necessary licenses and permits,
and challenges to the Company’s title to properties; as well as those factors
described in the section “risk factors” contained in the Company’s most recent
form 40F/Annual Information Form filed with the S.E.C. and Canadian securities
regulatory authorities.

Forward-looking
statements are based on assumptions management believes to be reasonable,
including but not limited to: the continued operation of the Company’s mining
operations, no material adverse change in the market price of commodities,
mining operations will operate and the mining products will be completed in
accordance with management’s expectations and achieve their stated production
outcomes, and such other assumptions and factors as set out herein. Although
the Company has attempted to identify important factors that could cause actual
results to differ materially from those contained in forward-looking statements
or information, there may be other factors that cause results to be materially
different from those anticipated, described, estimated, assessed or intended.
There can be no assurance that any forward-looking statements or information
will prove to be accurate as actual results and future events could differ
materially from those anticipated in such statements or information.
Accordingly, readers should not place undue reliance on forward-looking
statements or information.
 

QuickChek – May 11, 2021


Seanergy Maritime Holdings Corp. Announces Delivery of Capesize M/V Hellasship and Time Charter Agreement with NYK Line

Seanergy Maritime Holdings announced today that it has taken delivery of the 181,325 dwt Capesize bulk carrier, built in 2012 by Imabari Shipbuilding Co. in Japan, which was renamed M/V Hellasship.

Research, News & Market Data on Seanergy

Watch recent presentation from NobleCon17


Palladium One Intersects 2.1 g/t Pd_Eq over 38 Meters in the Lower Zone and Expands the Upper Zone at Kaukua South, Finland

Drilling continues to intersect impressive widths and grades of Platinum Group Elements (“PGE”) including 38 meters at 2.1 g/t Palladium equivalent (“Pd_Eq”) (Hole LK21-062) in the Lower Zone at Kaukua South, on the Läntinen Koillismaa (“LK”) PGE-Ni-Cu project in Finland, said Palladium One Mining today

Research, News & Market Data on Palladium One

Watch recent Virtual Roadshow Replay


Comtech Telecommunications Corp. Awarded $2.0 Million Contract for 500W Ka-band Gateway Amplifiers

Comtech announced today that during its third quarter of fiscal 2021, its Santa Clara, California-based subsidiary, Comtech Xicom Technology, Inc., a world leader in high-power amplifiers, was awarded a $2.0 million order for state-of-the-art 500W Ka-band high power amplifiers supporting a leading high throughput satellite (“HTS”) customer.

Research, News & Market Data on Comtech

Watch recent presentation from NobleCon17


Endeavour Silver Reports Financial Results for the First Quarter 2021; Earnings Conference Call at 10am PDT (1pm EDT) Today

Endeavour Silver released its financial results today for the three months ended March 31, 2021.

Research, News & Market Data on Endeavour Silver

Watch recent presentation from NobleCon17


Information Services Group Initiates Quarterly Cash Dividend

Information Services Group announced that its Board of Directors has approved the initiation of a quarterly cash dividend to holders of ISG common stock.

Read Analyst Joe Gomes May 11 Research on III

Research, News & Market Data on Information Services Group

Watch recent presentation from NobleCon17


Information Services Group Announces First-Quarter 2021 Results

Information Services Group reported record fee revenues, profitability and cash flow for the first quarter ended March 31, 2021.

Read Analyst Joe Gomes May 11 Research on III

Research, News & Market Data on Information Services Group

Watch recent presentation from NobleCon17


Flotek Announces First Quarter 2021 Results

Flotek announced results for the first three months ended March 31, 2021.

News & Market Data on Flotek

Watch recent presentation from NobleCon17


Flotek Welcomes New Vice President of Professional Chemistries

Flotek announced that Matthew P. Sullivan has joined the Company as Vice President of Professional Chemistries. In this role, he will oversee the Company’s business development strategy and implementation for Flotek’s cleaning, disinfecting and sanitizing product line.

News & Market Data on Flotek

Watch recent presentation from NobleCon17

Release – Comtech Telecommunications Corp. Awarded $2.0 Million Contract for 500W Ka-band Gateway Amplifiers


Comtech Telecommunications Corp. Awarded $2.0 Million Contract for 500W Ka-band Gateway Amplifiers

MELVILLE, N.Y.–(BUSINESS WIRE)–May 11, 2021– 
May 11, 2021— 
Comtech Telecommunications Corp. (NASDAQ: CMTL), a world leader in secure wireless communications technologies, announced today, that during its third quarter of fiscal 2021, its 
Santa Clara, California-based subsidiary, 
Comtech Xicom Technology, Inc., a world leader in high-power amplifiers, was awarded a 
$2.0 million order for state-of-the-art 500W Ka-band high power amplifiers supporting a leading high throughput satellite (“HTS”) customer.

The HTS market provides broadband internet service to geographic regions that are under-served by terrestrial networks. HTS systems are very high capacity, offering bandwidth and pricing competitive with more conventional terrestrial offerings, regardless of the customers’ location. These systems serve consumer, small business, enterprise and government customers.

“Reliable and affordable broadband internet service is essential in today’s world. People who live and work in rural areas have the same needs as urban users for a high-quality on-line experience. HTS networks are an ideal way for rural customers to stay connected,” said  Fred Kornberg , Chairman of the Board and Chief Executive Officer of 
Comtech Telecommunications Corp. “Comtech’s 500W amplifiers are at the heart of HTS gateway earth stations. We have been supplying the HTS community with 500W Ka-band amplifiers since 2009, and they feature high linear power, superior phase noise, and offer great reliability.”

Comtech Xicom Technology, Inc., a world leader in high-power amplifiers, manufactures a wide variety of tube-based and solid-state power amplifiers for military and commercial satellite uplink applications. The product range encompasses power levels from 8 W to 3 kW, with frequency coverage in sub-bands within the 2 GHz to 52 GHz spectrum. Amplifiers are available for fixed and ground-based, shipboard, and airborne mobile applications. Please visit www.xicomtech.com for more information.
Comtech Telecommunications Corp. is a leader in the global communications market headquartered in 
Melville, New York. With a passion for customer success, 
Comtech designs, produces and markets advanced secure wireless solutions to more than 1,000 customers in more than 100 countries. For more information, please visit www.comtechtel.com.

Certain information in this press release contains statements that are forward-looking in nature and involve certain significant risks and uncertainties. Actual results could differ materially from such forward-looking information. The Company’s 
Securities and Exchange Commission filings identify many such risks and uncertainties. Any forward-looking information in this press release is qualified in its entirety by the risks and uncertainties described in such 
Securities and Exchange Commission filings.

PCMTL

Product Media Contact: Eric Schmidt, Vice President, Sales

Comtech Xicom Technology, Inc.
408-391-6534
Eric.schmidt@xicomtech.com

Corporate Contact: Michael D. Porcelain, President and Chief Operating Officer
Comtech Telecommunications Corp.
631-962-7000
info@comtechtel.com

Source: 
Comtech Telecommunications Corp.

Artificial Intelligence Investment Opportunities


image credit: Deepak Pal (iqlect.com)


Preparing Investors for the Artificial Intelligence Revolution

Since the first use of the lever, the invention of the wheel, and the combustion engine that led to the industrial revolution, machines have been used to make work easier. As long as humans improved production, safety, or leisure time from machine use, there remained an increasing need. However, there has always been a need for an operator. Be it a driver behind the wheel, a technician, or a person behind the computer. This is changing, the next wave of machines are evolving, and they will again be adopted in every aspect of human life.

Getting
Ready for the AI Revolution

Artificial Intelligence systems (AI) will soon be improving lives at a level once found only in science fiction. These are autonomous machines/systems that do not need the help of an operator. This is ushering in a new age, the age of AI. With all the benefits that are gained from using them. Many long-range investors view investing in companies using Artificial Intelligence as a no-brainer.

Current
Uses of AI

Some uses of AI range from driverless cars, manufacturing machines, speech recognition, image recognition, and deep learning. Deep learning is a machine learning method for training computers to recognize objects and patterns just like humans. For example, it can be used to train computers to recognize images or sound to improve search engines or identify people and voices for security systems.

Autonomous/driverless cars are the next big thing in the automotive industry, with many car companies in the race to produce the first fully autonomous car. There are also companies using AI to predict when vehicles need repair; this would reduce downtime and unnecessary costs. The companies using AI or advancing the use of AI are more efficient and improve their bottom line as their costs are generally lower and their processes more precise, making them needed to stay competitive.

The
Future

With the huge potential of AI machines, many companies, large and small, are now involved in advancing machines to higher and higher levels of utility. There is so much potential in AI that new uses are being discovered every day. Below is an intelligent list of smaller companies that have caught the imagination of investors as their projects and products are shaping the adoption and development of AI.

One Stop
Systems, Inc. (
OSS) provides what they call “AI on the Fly.”  AI on the Fly delivers high-performance computing platforms and the building blocks that capture and store data securely and quickly and then transform the data into actionable intelligence. OSS products enable computation and deep learning outside the stable climate-controlled office or laboratory and out in the world and on-site. OSS is currently trading at around $4.87, a 21.75% increase from the beginning of the year.

Garrett
Motion, Inc. (
GTX) provides cutting-edge automotive solutions like turbocharging, automotive software solutions, and electric boosting. Through its software solutions, they provide an early warning system that predicts when the vehicle needs maintenance which reduces unplanned downtime and fleet breakdowns. With its share price trading at $5.97, up by 34.8%, it is a great Artificial Intelligence company to invest in.

Innodata,
Inc. (
INOD) helps companies solve their toughest data engineering challenges using AI. They help you annotate, transform, curate, and intelligently automate your data. INOD works with companies in information-intensive industries like defense, aerospace, manufacturing, and healthcare. Their share price currently at $6.34, a 19.9% increase from the beginning of the year, making it a great investment option.
Talend, SA
(
TLND) provides a tool for data integration, especially for big data in the cloud. Through its product, it helps organizations operationalize predictive models on a large scale for a variety of uses, such as fraud detection or improving customer experience. They are faring quite well with their share price currently at $64.78, up by 69% from the beginning of the year

MicroStrategy,
Inc. (
MSTR) is the world’s largest business intelligence company providing analytics for businesses using machine learning technology. It uses big data from a variety of sources to perform analytics to make predictive analytics. The share price currently at $569.46, up by 46.6 from the beginning of the year

Take-Away

With a growing list of innovative companies developing products to make current machines more autonomous, and the adoption by companies both in production and to make their products more efficient, the future belongs to AI-driven machines. Searching for tech companies involved in Artificial Intelligence as a potential allocation as longer-term portfolio holding, perhaps even finding the “next Apple” is worthwhile. The time is ripe for AI. Channelchek is a good place to start to look at smaller companies involved in AI and perhaps find one that changes the world.

Suggested Reading

One Stop Systems Virtual Road Show (Video – Nov. 2020)

AI and Skyborg Technology will Create Huge Tech Winners


The Hottest Stock Sectors and Segments

Edge Computing Importance to AI Applications

Release – Seanergy Maritime Holdings Corp. Announces Delivery of Capesize M-V Hellasship and Time Charter Agreement with NYK Line


Seanergy Maritime Holdings Corp. Announces Delivery of Capesize M/V Hellasship and Time Charter Agreement with NYK Line

May 6, 2021
– Glyfada, Greece
– Seanergy Maritime Holdings Corp. (the “Company” or “Seanergy”) (NASDAQ: SHIP) announced today that it has taken delivery of the 181,325 dwt Capesize bulk carrier, built in 2012 by Imabari Shipbuilding Co. in Japan, which was renamed M/V
Hellasship (the “Vessel”). The delivery of the M/V Hellasship is the first of the four Capesize acquisitions performed already in 2021.  

The Vessel has been fixed on a time charter (“T/C”) with NYK Line, a leading Japanese shipping company and operator. The T/C is expected to commence immediately, upon finalization of the customary transition process and will have a term of minimum 11 to maximum 15 months from the delivery. The gross daily rate of the T/C is based at a premium over the Baltic Capesize Index (“BCI”).  

Stamatis
Tsantanis, the Company’s Chairman & Chief Executive Officer, stated:
 

“We are pleased to announce the well-timed delivery of our twelfth cape vessel, during the strongest Capesize market of the last decade with spot rates standing currently above $42,000 per day. This delivery is the first of the four acquisitions we agreed so far in 2021, before the impressive surge in freight day rates and asset values. Needless to say, that our timing has been once again optimal.  

“At the same time, we are glad to initiate a long-term commercial partnership with another leading charterer through M/V Hellasship’ s period employment. The relationships we have established with first class charterers in the Capesize space attest to the operational quality of our fleet and management platforms. 

“Currently, 92% percent of our fleet is employed under index-linked time charters allowing Seanergy’ s earnings to be highly correlated with the performance of the Capesize index. We believe that Seanergy, as a pure-play Capesize owner, is best positioned to fully benefit from the strong earnings environment and increasing asset values.”   

Company
Fleet upon Vessels’ delivery: 

Vessel Name 

Vessel Class 

Capacity (DWT) 

Year Built 

Yard 

Employment 

Partnership  

Capesize 

179,213 

2012 

Hyundai 

T/C Index Linked  

Championship  

Capesize 

179,238 

2011 

Sungdong 

T/C Index Linked  

Lordship  

Capesize 

178,838 

2010 

Hyundai 

T/C Index Linked  

Premiership 

Capesize 

170,024 

2010 

Sungdong 

T/C Index Linked  

Squireship 

Capesize 

170,018 

2010 

Sungdong 

T/C Index Linked  

Knightship 

Capesize 

178,978 

2010 

Hyundai  

T/C Index Linked  

Gloriuship 

Capesize 

171,314 

2004 

Hyundai 

T/C Index Linked  

Fellowship 

Capesize 

179,701 

2010 

Daewoo 

T/C Index Linked 

Geniuship 

Capesize 

170,058 

2010 

Sungdong 

T/C Index Linked 

Hellasship 

Capesize 

181,325 

2012 

Imabari  

T/C Index Linked 

Goodship 

Capesize 

177,536 

2005 

Mitsui Engineering 

T/C Index Linked 

Leadership 

Capesize 

171,199 

2001 

Koyo – Imabari 

Voyage/Spot 

Tradership* 

Capesize 

176,925 

2006 

Japanese Shipyard 

N/A 

Flagship** 

Capesize 

176,387 

2013 

Japanese Shipyard 

N/A 

Patriotship* 

Capesize 

181,709 

2010 

Japanese Shipyard 

N/A 

Total / Average age 

2,642,463 

 11.9 


*delivery expected by mid-June 
**delivering promptly  

About
Seanergy Maritime Holdings Corp.
 

Seanergy Maritime Holdings Corp. is the only pure-play Capesize ship-owner publicly listed in the US. Seanergy provides marine dry bulk transportation services through a modern fleet of Capesize vessels. Upon delivery of vessels which the Company has recently agreed to acquire, the Company’s operating fleet will consist of 15 Capesize vessels with an average age of 11.9 years and aggregate cargo carrying capacity of approximately 2,642,463 dwt. 

The Company is incorporated in the Marshall Islands and has executive offices in Glyfada, Greece. The Company’s common shares trade on the Nasdaq Capital Market under the symbol “SHIP,” its Class A warrants under “SHIPW” and its Class B warrants under “SHIPZ.” 

Please visit our company website at: www.seanergymaritime.com

Forward-Looking Statements  

This press release contains forward-looking statements (as defined in Section 27A of the Securities Act of 1933, as amended, and Section 21E of the Securities Exchange Act of 1934, as amended) concerning future events. Words such as “may”, “should”, “expects”, “intends”, “plans”, “believes”, “anticipates”, “hopes”, “estimates” and variations of such words and similar expressions are intended to identify forward-looking statements. These statements involve known and unknown risks and are based upon a number of assumptions and estimates, which are inherently subject to significant uncertainties and contingencies, many of which are beyond the control of the Company. Actual results may differ materially from those expressed or implied by such forward-looking statements. Factors that could cause actual results to differ materially include, but are not limited to, the Company’s operating or financial results; the Company’s liquidity, including its ability to service its indebtedness; competitive factors in the market in which the Company operates; shipping industry trends, including charter rates, vessel values and factors affecting vessel supply and demand; future, pending or recent acquisitions and dispositions, business strategy, areas of possible expansion or contraction, and expected capital spending or operating expenses; risks associated with operations outside the United States; risks associated with the length and severity of the ongoing novel coronavirus (COVID-19) outbreak, including its effects on demand for dry bulk products and the transportation thereof; and other factors listed from time to time in the Company’s filings with the SEC, including its most recent annual report on Form 20-F. The Company’s filings can be obtained free of charge on the SEC’s website at www.sec.gov. Except to the extent required by law, the Company expressly disclaims any obligations or undertaking to release publicly any updates or revisions to any forward-looking statements contained herein to reflect any change in the Company’s expectations with respect thereto or any change in events, conditions or circumstances on which any statement is based. 

For further
information please contact:  

Seanergy Investor Relations 
Tel: +30 213 0181 522 

E-mail: ir@seanergy.gr   

Capital Link, Inc. 
Daniela Guerrero 
230 Park Avenue Suite 1536 

New York, NY 10169 
Tel: (212) 661-7566 
E-mail: seanergy@capitallink.com 

How Your Data is Used to Generate Big Returns


image credit: Yan Krukov (pexels.com/@yankrukov)


Your Personal Data is the Currency of the Digital Age

The commodification of the internet in the early 1990s brought western societies into the digital age and has changed the way consumers interact with commercial enterprises.

The companies within the digital industry have one thing in common: the use of the user’s personal data through technology to gain a competitive advantage.

Spotify, Amazon, eBay, Apple, Google Play: these corporations have reached a level of product and service customization never seen before. Spotify’s algorithm, for example, offers you artists and playlists based on your age, gender, location, and listening history.

Management researchers are interested in these new forms of commerce for two main reasons: they mark a break with conventional business models and tend to do better during crises.

New Business Models

Recent research from the Massachusetts Institute of Technology indicates that in June 2020, at the height of the first wave of the COVID-19 pandemic, digital firms had an average return on investment of 10%, while traditional firms were still negative 14% in August. The authors’ conclusion is unequivocal: 21st-century organizations must adopt these new business models at the risk of perishing.

However, this business model is not without risk for the consumer. I have been writing about this phenomenon for a little over five years. My research has led me to propose a new model for generic management of this new industry and to look at the consequences that users face.

The new business models propose a fundamental break with those typically taught in business schools. Whereas the industrial age placed capital (mainly money) at the center of all transactions, the digital age favors information as a source of liquidity.

This disruption of the medium of exchange in a commercial transaction is particularly salient in certain industries. Readers of a certain age will surely remember printed maps. To get updates such as street name changes, you had to buy a new map. Google, for example, offers its users GPS functionality updated in real-time for free.

A Personalized Experience

Some firms use dual monetization in their product or service. This is particularly true in the mobile gaming industry. For example, some games use a freemium approach based on  monetizing user data and then inserting paid elements. In short, the best of both worlds!

This type of model is not bad in itself and even has advantages for the consumer, including the personalization of their experience and access to free offers and trials.

For example, when you search for a restaurant on Google Maps, you hope to get results based on your location, and when you shop online, products are suggested based on your purchase history.


The Customer is the Product

These benefits to the consumer can also backfire. Several researchers note an increase in the complexity of the customer relationship. Studies have shown that the overload of information available in the Canadian telecommunications industry can be used as strategic leverage by the seller.

For example, a user may be required to create a Pinterest account — recording personal information such as name, email address, and birthday — in order to view the site’s content. Other sites will deny access to content if the user has blocked cookies or trackers for advertising.

Consumers also have the right to wonder if they are becoming the product. For example, Google uses AdSense to collect the personal data of their users in order to monetize them to third parties, generally for advertising purposes. Similarly, Google benefits from offering services at no cost, because the more consumers use its services, the more information it collects about them.

It is in Amazon’s best interest to encourage us to browse its site — even if we don’t buy anything. The history of items viewed, keywords used, or time spent on a page can all be monetized.

The market for targeted online advertising is very lucrative. According to the annual Interactive Advertising Bureau 2017 report, online advertising generated revenues of US$88 billion in the United States alone in that year.


Reducing Your Digital Footprint

It’s hard to be totally invisible in the digital age! Indeed, it is rare that an individual is not part of any social network, does not have a cell phone or does not use the web on a daily basis. What’s more, the erosion of privacy has been so gradual that most people are not aware of the amount of information they reveal every day. Nevertheless, solutions exist to reduce one’s digital footprint.

Before entering their data, consumers may ask themselves if they really need the product or service, even if it is free. Is it really essential, for example, to create an account to consult a document or view an image on a site to which you will never return?

Firms that collect consumers’ personal information must first obtain their consent. These consent forms are often very long and written in jargon. Most people simply click on “I agree” without worrying about the implications.

In extreme cases, this simple gesture authorizes the firm to install spyware on your device. Sites like Terms of Service; Didn’t Read provides an overview of user agreements and identifies the elements that could have a negative impact on the user.

All Requested Information?

When the consumer creates an account, they must also question the relevance of giving all the information requested. Although it is important to indicate an actual birth date on a credit application, is it really necessary to give this information on a discussion forum?

It is also important to avoid using the same username (often email) and password for different accounts. Some firms use modules to collect data that link several services. Even if information is missing from one of the accounts, the module can cross-reference that account with those registered with other providers. In addition, if there is a data leak, it becomes easy for fraudsters to test the email and password combination on different platforms.

The provider promises to secure the personal data of its user. Unfortunately, several cases of recent leaks show us that this is not always the case.

Websites like Have I Been Pwned list data leaks, including email addresses and other information that may have been leaked. If your address has been leaked, it is strongly recommended that you change your password and check your accounts using the same address.


This article was republished with permission from The Conversation, a news site dedicated to sharing ideas from
academic experts. It was originally written in French by: 
Guillaume Desjardins Associate
Professor of Industrial Relations,
Université du Québec en Outaouais

Suggested Reading

Winners and Losers With Low Interest Rates

TAXES – Do You Pay More Than Your Fair Share


Seeking Alpha Paywall Causes Frustration

Issues Driving ESG Investing