Gevo Inc. (GEVO) – Net-Zero Concept On Track and RNG Project Financed

Friday, May 14, 2021

Gevo, Inc. (GEVO)
Net-Zero Concept On Track and RNG Project Financed

Gevo Inc is a renewable chemicals and biofuels company engaged in the development and commercialization of alternatives to petroleum-based products based on isobutanol produced from renewable feedstocks. Its operating segments are the Gevo segment and the Gevo Development/Agri-Energy segment. By its segments, it is involved in research and development activities related to the future production of isobutanol, including the development of its biocatalysts, the production and sale of biojet fuel, its Retrofit process and the next generation of chemicals and biofuels that will be based on its isobutanol technology. Gevo Development/Agri-Energy is the key revenue generating segment which involves the operation of the Luverne Facility and production of ethanol, isobutanol and related products.

Poe Fratt, Senior Research Analyst, Noble Capital Markets, Inc.

Refer to the full report for the price target, fundamental analysis, and rating.

    1Q2021 EBITDA Loss Higher Than Expected. Adjusting 2021 EBITDA loss estimate. 1Q2021 EBITDA loss of $7.8 million was higher than than expected due to early stage project development expenses of $2.7 million. Our new 2021 EBITDA loss estimate increases to $39.8 million to include the ramping up of early stage project costs, including FEED and other development costs.

    Renewable Natural Gas (RNG) financing closed and project on track for startup next year.  A 21-year green bond financing of $67.2 million at an interest rate of 1.5% closed and will finance the RNG plant. The wholly-owner project is likely to be consolidated, and development and other costs of $9.3 million were reimbursed at closing. RNG plant starts up in 2H2022 and annual cash flow is estimated at …


This Company Sponsored Research is provided by Noble Capital Markets, Inc., a FINRA and S.E.C. registered broker-dealer (B/D).

*Analyst certification and important disclosures included in the full report. NOTE: investment decisions should not be based upon the content of this research summary.  Proper due diligence is required before making any investment decision. 

Energy Fuels (UUUU)(EFR:CA) – Financial Results Lower on Limited Sales Company Gearing Up For Rare Earth Push

Friday, May 14, 2021

Energy Fuels (UUUU)(EFR:CA)
Financial Results Lower on Limited Sales, Company Gearing Up For Rare Earth Push

As of April 24, 2020, Noble Capital Markets research on Energy Fuels is published under ticker symbols (UUUU and EFR:CA). The price target is in USD and based on ticker symbol UUUU. Research reports dated prior to April 24, 2020 may not follow these guidelines and could account for a variance in the price target.

Energy Fuels is the largest uranium producer in the U.S. and holds more production capacity and uranium resources than any other U.S. producer. The Company also produces vanadium. Headquartered in Colorado, Energy Fuels holds three of America’s key uranium production centers: the White Mesa Mill in Utah, the Nichols Ranch ISR Facility in Wyoming, and the Alta Mesa ISR Facility in Texas. The producing White Mesa Mill is the only conventional uranium mill in the U.S. and has a licensed capacity of 8 million pounds of U3O8 per year. Nichols Ranch is in production and has a licensed capacity of 2 million pounds of U3O8 per year. Alta Mesa is currently on standby. Energy Fuels also owns several licensed and developed uranium and vanadium mines on standby and other projects in development.

Michael Heim, Senior Research Analyst, Noble Capital Markets, Inc.

Refer to the full report for the price target, fundamental analysis, and rating.

    Energy Fuels reported a loss net to the company of $10.9 million ($0.08) versus a loss of $5.7 million ($0.05). With uranium and vanadium operations largely shut down until prices improve, the loss was not unexpected. Revenues were a modest $353,000, in line with previous quarters. The company has been recovering modest amounts of uranium from alternate feed materials and mixed rare earth elements processing and uranium inventories have grown to 690,800 pounds of uranium from 134,000 a year ago. The company has not entered into any long-term sales contracts and does not expect to do so in 2020.

    Company is gearing up for a rare earth elements (REE) push.  Energy Fuels took advantage of a higher stock price to raise $12.99 million growing its cash position to $44 million from $24 million at the end of the year. In a recent presentation to analyst at another firm, management indicated it would take $2 million to convert the White Mesa mill to produce REE carbonate. It would take another $4-5 …


This Company Sponsored Research is provided by Noble Capital Markets, Inc., a FINRA and S.E.C. registered broker-dealer (B/D).

*Analyst certification and important disclosures included in the full report. NOTE: investment decisions should not be based upon the content of this research summary.  Proper due diligence is required before making any investment decision. 

Cannabis Customers Served by the Ice Cream Truck Delivery Model


image credit: Pexels/Cottonbro


Delivery as a Service Business Model is Serving Marijuana Customers


The “stay at home” mindset that was adopted over the past year has forever altered the way in which we work, visit with others, and shop. It was necessary to embrace other options for a while. But, even when the temporary lifestyle changes we made became no longer necessary, many of the alternatives continue to be common methods of doing business, visiting others, and buying goods.


Delivery as a Service

Ecommerce was particularly relied upon by those that might otherwise have run to the store for clothes, home furnishings, electronic upgrades, etc. Curbside Pick-up saw a massive increase in new customers and adoption by many businesses that had never considered it.

As part of this larger shift in consumer buying methods, the delivery as a service (DaaS) business has grown dramatically. DaaS consumers are now getting on-demand delivery of everything from groceries to prepared meals, liquor, and anything else that a retailer can provide in this way. It’s a great add-on service for anyone who sells retail products, home goods, groceries, prepared food, even alcohol. Today, even traditional sellers such as Apple, Walmart, Publix Supermarkets, and 7-11 are offering delivery options to their customers. The convenience will keep customers using the services long after there are any pandemic-related restrictions. In fact, the practice is expected to grow.


DaaS and Cannabis

Over the past few years, cannabis has been quickly losing its stigma. CBD oil is legal in all 50 states, medical marijuana is legal in 36 states, and recreational use is permitted in 17 of the 50 U.S. states. This growth in usage and acceptance has been taking the once illicit product and taken it more mainstream and overt.

Companies involved in cannabis products know that the potential growth of the industry is huge, and also that competition to survive and thrive as the industry matures requires adopting successful methods proven by other industries. This has come to include local delivery with cars standing-by and stocked with product, and also pick-and-pack orders from retailers.

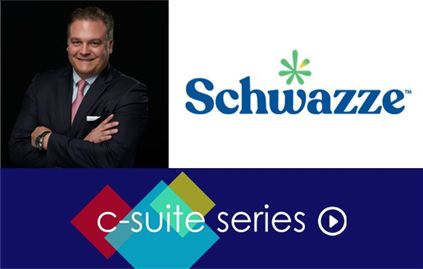
STEM Holdings (DBA, Driven by STEM, ticker STMH) is involved in the cultivation and retail sale of marijuana. As part of their multichannel approach to sales, they have built a “farm to home” model. The CEO of Driven by STEM, Adam Berk, met virtually with Noble Capital Markets Senior Analyst, Joe Gomes, for a C-Suite interview released this week. Adam discussed his company, the impact of Covid, a recent acquisition, and plans to expand the company’s AI informed “ice cream truck” model of delivery.

In the recorded interview, the STEM Holdings CEO was asked about their acquisition of a cannabis delivery service and what the plans are for their non-brick and mortar retail outlets. Adam explained that “Easy, convenient accessible ecommerce delivery makes sense whether your buying toothpaste, toilet paper, or cannabis.” Berk discussed this portion of their business model by saying,”…it’s important to be an omnichannel retailer, it’s important to make delivery to homes. Buy behavior has completely changed for every consumer, and we just don’t see that going back.”


Take-Away

The Stem Holding C-Suite interview offers insight into how technology is changing how consumers select and receive products and how individuals can be better served – DaaS is not going to disappear. The discussion, of course, also covers the cannabis industry and how Stem is finding new ways to better their product and the customer experience, it’s well worth watching.

You can view the entire video by clicking on the first link below.


Suggested Content:

Stem Holdings, Inc. CEO, Adam Berk – C-Suite

Medicine Man Technologies, Inc. CEO Justin Dye


Artificial Intelligence Investment Opportunities

Medical Cannabis Companies vs. Recreational Cannabis


Sources:

https://www.sciencedirect.com/science/article/pii/S2352146520303641#:~:text=Delivery%20as%20a%20Service%20(DaaS,in%20the%20on%2Ddemand%20economy.&text=It%20contributes%20to%20a%20future%20scenario%20of%20urban%20logistics%20business%20models.

https://www.channelchek.com/channelcast-detail/220


Schwazze (SHWZ) Virtual Road Show – Monday May 17 @ 1:00pm EDT

Join Schwazze CEO Justin Dye and CFO Nancy Huber for this exclusive corporate presentation, followed by a Q & A session moderated by Joe Gomes, Noble’s senior research analyst, featuring questions taken from the audience. Registration is free and open to all investors, at any level.

Register Now  |  View All Upcoming Road Shows
 

Stay up to date. Follow us:


Stay up to date. Follow us:

QuoteMedia (QMCI) – Will Margins Improve As Revenues Ramp?

Friday, May 14, 2021

QuoteMedia (QMCI)
Will Margins Improve As Revenues Ramp?

QuoteMedia, based in Fountain Hills, Arizona, provides cloud-based financial data, market news feeds, and financial software solutions.  Its customers include financial service companies, online brokerages, clearing firms, banks, media portals, public corporations and individual investors.  The company provides a single source solution providing products such as streaming quotes, charting, historical data, technical analysis, news and research.  Information can customized and provided to multiple platforms including terminals and mobile devices.

Michael Kupinski, Director of Research, Noble Capital Markets, Inc.

Refer to the full report for the price target, fundamental analysis, and rating.

    Q1 in-line with expectations. Q1 revenue growth accelerated to 22%, in line with our expectations. Q1 revenues of $3.606 million was in line with our $3.580 million estimate. Cost of Revenues, however, increased significantly faster than revenue growth at 37.6%. As such, gross margins were lower than expected, 42.8% versus our 45.5% estimate. This led to Adjusted EBITDA of $244,000, lower than our $311,000 estimate.

    Gross margins should improve.  Vendor price increases are typical at the beginning of the year. As such, gross margins should improve in subsequent quarters as revenues grow. We anticipate gross margins to improve to roughly 45% in subsequent quarters. In addition, we anticipate that gross margins should benefit from a slight acceleration in revenue growth in the company’s Interactive Content & Data …


This Company Sponsored Research is provided by Noble Capital Markets, Inc., a FINRA and S.E.C. registered broker-dealer (B/D).

*Analyst certification and important disclosures included in the full report. NOTE: investment decisions should not be based upon the content of this research summary.  Proper due diligence is required before making any investment decision. 

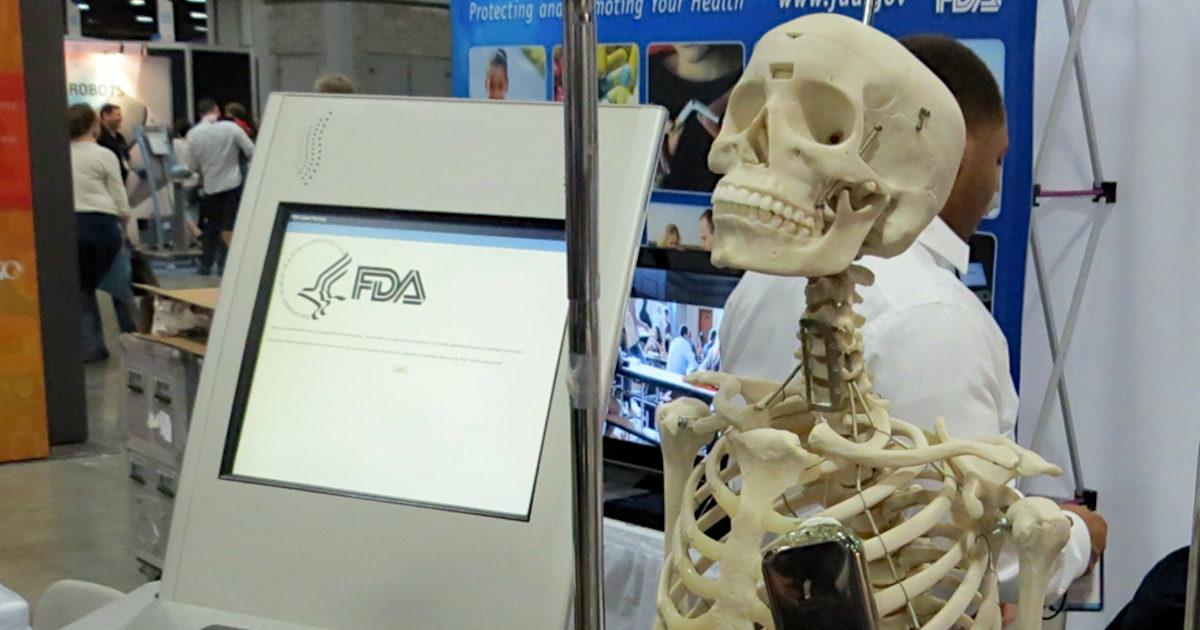
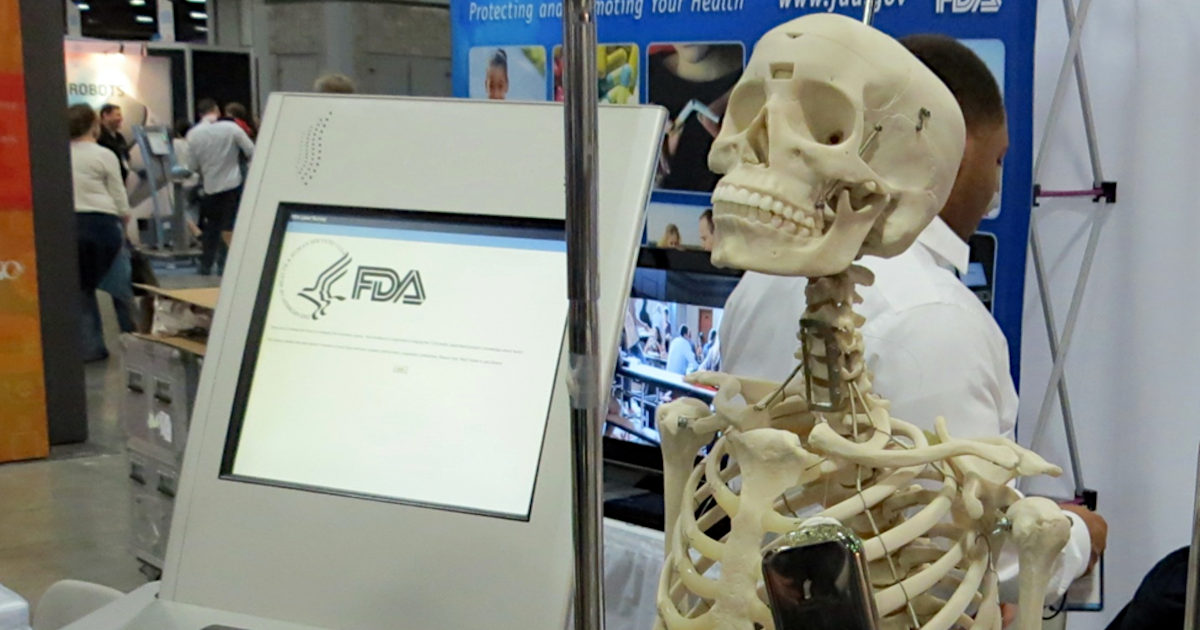
Pros and Cons of FDA Funded in Part by Companies


image credit: Alan Kotov (flickr.com)


Pros and Cons of FDA Partly Funded by the Companies it Oversees


The Food and Drug Administration has moved from an entirely taxpayer-funded entity to one increasingly funded by user fees paid by manufacturers that are being regulated. Today, close to 45% of its budget comes from these user fees that companies pay when they apply for approval of a medical device or drug.


Positive and Negative Impact

As a pharmacist and medication and dietary supplement safety researcher, I understand the vital role that the FDA plays in ensuring the safety of medications and medical devices.

But I, along with many others, now wonder: Was this move a clever win-win for the manufacturers and the public, or did it place patient safety second to corporate profitability? It is critical that the U.S. public understand the positive and negative ramifications so the nation can strike the right balance.

Americans in the early 20th century were outraged when they found out that manufacturers used poor-quality methods for producing food and medication, and used unsafe, ineffective, and undisclosed addictive ingredients in medications. The resulting Food, Drug, and Cosmetic Act of 1938 gave the taxpayer-funded Food and Drug Administration new authority to protect the U.S. consumer.

One of the FDA’s most shining successes occurred in the late 1950s when the agency refused to approve thalidomide. By 1960, 46 countries allowed pregnant women to use thalidomide to treat morning sickness, but the FDA refused on the grounds that the studies were insufficient to demonstrate safety. Debilitating birth defects resulting from thalidomide arose in Europe and elsewhere in 1961. President John F. Kennedy heralded the FDA in 1962 for its stance. An FDA driven by the data – and not corporate pressure – prevented a major tragedy.


How AIDS Changed How the FDA is Funded

The FDA continued its work fully funded by U.S. taxpayers for many years until this model was upended by a new infectious disease. The first U.S. case of HIV-induced AIDS occurred in 1981. It was rapidly spreading, with devastating complications like blindness, dementia, severe respiratory diseases, and rare cancers. Well-known sports stars and celebrities died of AIDS-related complications. AIDS activists were incensed about long delays in getting experimental HIV drugs studied and approved by the FDA.

In 1992, in response to intense pressure, Congress passed the Prescription Drug User Fee Act. It was signed into law by President George H.W. Bush.

With the act, the FDA moved from a fully taxpayer-funded entity to one funded through tax dollars and new prescription drug user fees. Manufacturers pay these fees when submitting applications to the FDA for drug review and annual user fees based on the number of approved drugs they have on the market. However, it is a complex formula with waivers, refunds and exemptions based on the category of drugs being approved and the total number of drugs in manufacturers’ portfolios.

Over time, other user fees for generic, over-the-counter, biosimilar, animal, and animal generic drugs, as well as for medical devices, were created. As time passed, the FDA’s funding has increasingly come from the industries that it regulates. Of the FDA’s total US$5.9 billion budget, 45% comes from user fees, but 65% of the funding for human drug regulatory activities are derived from user fees. These user fee programs must be reauthorized every five years by Congress, and the current agreement remains in effect through September 2022.


Have User Fees Worked?

The FDA and the drug or device manufacturers negotiate the user fees. They also negotiate performance measures that the FDA has to meet to collect them and proposed changes in FDA processes. Performance measures include things such as how quickly the FDA responds to meeting requests, how quickly it generates correspondence, and how long it takes from submission of a new drug application until the FDA approves or refuses to approve a drug or product.

Because of the additional funding generated by user fees and performance measures that the FDA has to meet, the FDA is quicker and more willing to discuss what it wants to see in an application with manufacturers. It also offers clearer guidance for manufacturers. In 1987, it took 29 months from the time a new drug application was filed by the manufacturer for the FDA to decide whether to approve a medication in the U.S. In 2014, it only took 13 months and by 2018, it was down to 10 months.

Changes in more recent years have also increased the number of standard new drug applications approved the first time around by the FDA from 38% in 2005 to 61% in 2018. In diseases where there are not many medication options for patients, the FDA has a priority review process, where 89% of new drug applications were approved the first time around and the approvals were completed in eight months in 2018. All this occurred while the number of new drug applications have been increasing over time.

Most recently, the COVID-19 pandemic has seen the FDA provide emergency use authorization for potential treatments in a matter of weeks, not months. The infrastructure and capacity to review the available information so rapidly is due in large part to the funding from user fees.


While the number and speed of drug approvals have been increasing over time, so have the number of drugs that end up having serious safety issues coming to light after FDA approval. In one assessment, investigators looked at the number of newly approved medications that were subsequently removed from the market or had to include a new black box warning over 16 years from the year of approval. These black box warnings are the highest level of safety alert that the FDA can employ, warning users that a very serious adverse event could occur.

Before the user fee act was approved, 21% of medications were removed or had new black box warnings as compared to 27% afterward.

Some potential reasons that more adverse effects are coming to light after drug approval include senior FDA officials overturning scientist recommendations, a lower burden of proof for medication approval, and more clinical data in new drug applications coming from foreign clinical trial sites that require additional time to assess in an environment where regulators are rushing to meet tight deadlines.


Lack of Money Limits FDA

User fees are a viable way to shift some of the financial burden to manufacturers who stand to make money from the approval and sale of drugs in the lucrative U.S. market. Successes have occurred and provided U.S. citizens with medication more quickly than before.

However, without careful consideration of what is being negotiated, the FDA can become weak and ineffective, unable to protect its citizens from the next thalidomide. There are some signs that the pendulum may be swinging too far in the direction of the manufacturers. Additionally, while drug approval functions at the FDA are well funded, the FDA is insufficiently funded to protect consumers from other issues such as counterfeit drugs and dietary supplements because they cannot collect user fees to do so. In my view, these functions need to be identified and require additional taxpayer funding.


This article was republished
with permission from 
The
Conversation
,
 a news site dedicated to sharing ideas from academic
experts.  Written by ,
C. Michael White  Distinguished Professor and Head of the
Department of Pharmacy Practice, University of Connecticut.


Suggested Content:

PDS Biotechnology Corporation – C-Suite Interview (Video)

Ayala Pharmaceuticals Virtual Roadshow Replay (Video)


STEM Holdings – C-Suite Interview (Video)

Medicine Man Technologies – C-Suite Interview (Video)


Stay up to date. Follow us:


Stay up to date. Follow us:

Release – Kelly Reports First-Quarter 2021 Earnings


Kelly Reports First-Quarter 2021 Earnings

Financial Highlights

  • Q1
    revenue down 4.4%, down 5.5% in constant currency, as pandemic disruption
    moderates
  • Q1
    operating earnings of $10.6 million, compared to a reported loss for the
    corresponding period last year
  • Q1
    earnings per share of $0.64, or $0.12 on an adjusted basis, compared to
    adjusted earnings per share of $0.20 for the corresponding period last year

TROY, Mich., May 13, 2021 (GLOBE NEWSWIRE) — Kelly (Nasdaq: KELYA) (Nasdaq: KELYB), a leading specialty talent solutions provider, today announced results for the first quarter of 2021.

Peter Quigley, president and chief executive officer, announced revenue for the first quarter of 2021 totaled $1.2 billion, a 4.4% decrease, or down 5.5% in constant currency, compared to the corresponding quarter of 2020. Revenue declined year-over-year in the quarter as the effects of the COVID-19 crisis moderated but continued to have an impact on customer demand and the supply of available talent.

Earnings from operations in the first quarter of 2021 totaled $10.6 million, compared to a loss of $111.8 million reported in the first quarter of 2020. The 2020 first-quarter results include a $147.7 million goodwill impairment charge and an $8.7 million restructuring charge, partially offset by a $32.1 million gain on sale of assets. On an adjusted basis, 2020 earnings from operations were $12.5 million.

Diluted earnings per share in the first quarter of 2021 were $0.64 compared to a loss of $3.91 per share in the first quarter of 2020. Included in the earnings per share in the first quarter of 2021 is a non-cash gain, net of tax, on Kelly’s investment in Persol Holdings common stock of $0.52. Included in the loss per share in the first quarter of 2020 is a $3.18 per share goodwill impairment charge, net of tax, a $1.38 per share loss from a non-cash loss on Kelly’s investment in Persol Holdings common stock, net of tax, and a $0.17 restructuring charge, net of tax, partially offset by a $0.61 gain on sale of assets, net of tax. On an adjusted basis, earnings per share were $0.12 in the first quarter of 2021 compared to $0.20 in the corresponding quarter of 2020.

“We’re seeing strong demand across all of our operating segments. This translated into sustained, sequential revenue improvements in our Education, OCG, International, and Science, Engineering & Technology business segments. We’re also seeing improving revenue growth rates in our Professional & Industrial segment and are taking steps to capture even more of the stronger demand, which now exceeds pre-pandemic levels,” said Quigley. “Every segment added numerous wins to their portfolio in the first quarter, and we’re pleased with the overall progress and healthy sales pipelines across our specialties. We’re moving forward in this recovery with optimism, well-positioned to capture organic specialty growth and committed to a bold M&A strategy that captures inorganic growth, as evidenced by our recent Softworld acquisition, which is the largest deal in Kelly’s history.”

In conjunction with its first quarter earnings release, Kelly has published a financial presentation on the Investor Relations page of its public website and will host a conference call at 9 a.m. ET on May 13 to review the results and answer questions. The call may be accessed in one of the following ways:

Via the Internet:
Kellyservices.com

Via the Telephone
(877) 692-8955 (toll free) or (234) 720-6979 (caller paid)
Enter access code 5728672
After the prompt, please enter “#”
A recording of the conference call will be available after 2:30 p.m. ET on May 13, 2021 at (866) 207-1041 (toll-free) and (402) 970-0847 (caller-paid). The access code is 2456495#. The recording will also be available at kellyservices.com during this period.

This release contains statements that are forward looking in nature and, accordingly, are subject to risks and uncertainties. These factors include, but are not limited to, changing market and economic conditions, the recent novel coronavirus (COVID-19) outbreak, competitive market pressures including pricing and technology introductions and disruptions, disruption in the labor market and weakened demand for human capital resulting from technological advances, competition law risks, the impact of changes in laws and regulations (including federal, state and international tax laws), unexpected changes in claim trends on workers’ compensation, unemployment, disability and medical benefit plans, or the risk of additional tax liabilities in excess of our estimates, our ability to achieve our business strategy, our ability to successfully develop new service offerings, material changes in demand from or loss of large corporate customers as well as changes in their buying practices, risks particular to doing business with government or government contractors, the risk of damage to our brand, our exposure to risks associated with services outside traditional staffing, including business process outsourcing, services of licensed professionals and services connecting talent to independent work, our increasing dependency on third parties for the execution of critical functions, our ability to effectively implement and manage our information technology strategy, the risks associated with past and future acquisitions, including risk of related impairment of goodwill and intangible assets, exposure to risks associated with investments in equity affiliates including PersolKelly Pte. Ltd., risks associated with conducting business in foreign countries, including foreign currency fluctuations, the exposure to potential market and currency exchange risks relating to our investment in Persol Holdings, risks associated with violations of anti-corruption, trade protection and other laws and regulations, availability of qualified full-time employees, availability of temporary workers with appropriate skills required by customers, liabilities for employment-related claims and losses, including class action lawsuits and collective actions, our ability to sustain critical business applications through our key data centers, risks arising from failure to preserve the privacy of information entrusted to us or to meet our obligations under global privacy laws, the risk of cyberattacks or other breaches of network or information technology security, our ability to realize value from our tax credit and net operating loss carryforwards, our ability to maintain specified financial covenants in our bank facilities to continue to access credit markets, and other risks, uncertainties and factors discussed in this release and in the Company’s filings with the Securities and Exchange Commission. Actual results may differ materially from any forward-looking statements contained herein, and we undertake no duty to update any forward-looking statement to conform the statement to actual results or changes in the Company’s expectations.

About Kelly®

Kelly Services, Inc. (Nasdaq: KELYA, KELYB) connects talented people to companies in need of their skills in areas including Science, Engineering, Education, Office, Contact Center, Light Industrial, and more. We’re always thinking about what’s next in the evolving world of work, and we help people ditch the script on old ways of thinking and embrace the value of all workstyles in the workplace. We directly employ nearly 370,000 people around the world, and we connect thousands more with work through our global network of talent suppliers and partners in our 
outsourcing and consulting practice. Revenue in 2020 was $4.5 billion. Visit kellyservices.com and let us help with what’s next for you.

MEDIA CONTACT:


ANALYST CONTACT:

Jane Stehney


James Polehna

(248) 574-9800


(248) 244-4586

stehnja@kellyservices.com 


james.polehna@kellyservices.com 

Release – QuoteMedia Announces 22% Revenue Growth for Q1 2021


QuoteMedia Announces 22% Revenue Growth for Q1 2021

PHOENIX, May 13, 2021 (GLOBE NEWSWIRE) — QuoteMedia, Inc. (OTCQB: QMCI), a leading provider of market data and financial applications, announced financial results for the fiscal year ended March 31, 2021.

QuoteMedia provides banks, brokerage firms, private equity firms, financial planners and sophisticated investors with a more economical, higher quality alternative source of stock market data and related research information. We compete with several larger legacy organizations and a modest community of other smaller companies. QuoteMedia provides streaming data feeds, on-demand request-based data (XML/JSON), web content solutions (financial content for website integration) and applications such as Quotestream Professional desktop and mobile.

Highlights for Q1 2021 include the following:

  • Revenue increased to $3,606,218 in Q1 2021 from $2,966,584 in Q1 2020, a year over year increase of 22%.
  • Quarter over quarter revenue increased 10% when comparing Q1 2021 to Q4 2020.
  • Net income for Q1 2021 was $23,087 compared to a loss of $117,325 in Q1 2020.
  • Cash on hand was $815,499 at March 31, 2021; an increase of $397,589 from the $417,910 cash balance reported at December 31, 2020.

“As discussed when releasing our 2020 annual results, we are coming off of a great year for QuoteMedia, and we are pleased to see the momentum carry over into 2021”, said Robert J. Thompson, Chairman of the Board. “Consistent with our previous forecasts, we experienced very strong revenue growth during the quarter. We fully expect to maintain this trajectory throughout the remainder of the year as we continue to increase our market share, develop important relationships with clients and partners, create new innovative product and service offerings, expand our coverage, and explore other opportunities to grow the company.”

QuoteMedia will host a conference call Thursday, May 13, 2021 at 2:00 PM Eastern Time to discuss the Q1 2021 financial results and provide a business update.

Conference Call Details:

Date: May 13, 2021

Time: 2:00 PM Eastern

Dial-in numbers: 877?876?9173, 785?424?1667

Conference ID: 
QUOTEMEDIA

An audio rebroadcast of the call will be available later at: www.quotemedia.com

About
QuoteMedia

QuoteMedia is a leading software developer and cloud-based syndicator of financial market information and streaming financial data solutions to media, corporations, online brokerages, and financial services companies. The Company licenses interactive stock research tools such as streaming real-time quotes, market research, news, charting, option chains, filings, corporate financials, insider reports, market indices, portfolio management systems, and data feeds. QuoteMedia provides industry leading market data solutions and financial services for companies such as the Nasdaq Stock Exchange, TMX Group (TSX Stock Exchange), Canadian Securities Exchange (CSE), London Stock Exchange Group, FIS, U.S. Bank, Broadridge Financial Systems, JPMorgan Chase, CI Financial, Canaccord Genuity Corp., Hilltop Securities, HD Vest, Stockhouse, Zacks Investment Research, General Electric, Boeing, Bombardier, Business Wire, PR Newswire, FolioFN, Regal Securities, ChoiceTrade, Cetera Financial Group, Dynamic Trend, Inc., Qtrade Financial, CNW Group, IA Private Wealth, Ally Invest, Inc., Suncor, Virtual Brokers, Equities.com, Leede Jones Gable, Firstrade Securities, Charles Schwab, First Financial, Cirano, Equisolve, Stock-Trak, Mergent, Cision, Warrior Trading and others. Quotestream®, QMod TM and Quotestream Connect TM are trademarks of QuoteMedia. For more information, please visit www.quotemedia.com.

Statements about QuoteMedia’s future expectations, including future revenue, earnings, and transactions, as well as all other statements in this press release other than historical facts are “forward-looking statements” within the meaning of the Private Securities Litigation Reform Act of 1995. QuoteMedia intends that such forward-looking statements be subject to the safe harbors created thereby. These statements involve risks and uncertainties that are identified from time to time in the Company’s SEC reports and filings and are subject to change at any time. QuoteMedia’s actual results and other corporate developments could differ materially from that which has been anticipated in such statements.

Below are the specific forward-looking statements included in this press release:

  • Consistent with our previous forecasts, we experienced very strong revenue growth during the quarter. We fully expect to maintain this trajectory throughout the remainder of the year as we continue to increase our market share, develop important relationships with clients and partners, create new innovative product and service offerings, expand our coverage, and explore other opportunities to grow the company.

QuoteMedia
Investor Relations

Brendan Hopkins
Email: 
investors@quotemedia.com
Call: (407) 645-5295

Note
1 on Non-GAAP Financial Measures

We believe that Adjusted EBITDA, as a non-GAAP pro forma financial measure, provides meaningful information to investors in terms of enhancing their understanding of our operating performance and results, as it allows investors to more easily compare our financial performance on a consistent basis compared to the prior year periods. This non-GAAP financial measure also corresponds with the way we expect investment analysts to evaluate and compare our results. Any non-GAAP pro forma financial measures should be considered only as supplements to, and not as substitutes for or in isolation from, or superior to, our other measures of financial information prepared in accordance with GAAP, such as net income attributable to QuoteMedia, Inc.

We define and calculate Adjusted EBITDA as net income attributable to QuoteMedia, Inc., plus: 1) depreciation and amortization, 2) stock compensation expense, 3) interest expense, 4) foreign exchange loss (or minus a foreign exchange gain), and 5) income tax expense. We disclose Adjusted EBITDA because we believe it is a useful metric by which to compare the performance of our business from period to period. We understand that measures similar to Adjusted EBITDA are broadly used by analysts, rating agencies, investors and financial institutions in assessing our performance. Accordingly, we believe that the presentation of Adjusted EBITDA provides useful information to investors. The table below provides a reconciliation of Adjusted EBITDA to net income attributable to QuoteMedia, Inc., the most directly comparable GAAP financial measure.

QuoteMedia,
Inc. Adjusted EBITDA Reconciliation to Net Income

Three months ended March 31,

2021

2020

Net income (loss)

$

23,087

$

(117,325

)

Depreciation and amortization

347,788

305,757

Stock-based compensation

6,939

11,991

Interest expense

1,008

1,527

Foreign exchange gain

(2,448

)

(11,206

)

Income tax expense

796

744

PPP loan forgiveness

(133,257

)

Adjusted EBITDA

$

243,913

$

191,488


Release – PDS Biotech Provides Business Update and Reports First Quarter 2021 Financial Results


PDS Biotech Provides Business Update and Reports First Quarter 2021 Financial Results

FLORHAM PARK, N.J., May 13, 2021 (GLOBE NEWSWIRE) — PDS Biotechnology Corporation (Nasdaq: PDSB), a clinical-stage immunotherapy company developing novel cancer therapies and infectious disease vaccines based on the Company’s proprietary Versamune® T-cell activating technology, will discuss its financial results for the quarter ended March 31, 2021 and provide a business update on its conference call today.

Recent Business Highlights:

  • National Cancer Institute to present interim efficacy and safety data of PDS0101 Phase 2 clinical trial in an oral presentation at the American Society of Clinical Oncology (ASCO) 2021 Annual Meeting on June 7, 2021. This trial is evaluating PDS0101 with two clinical stage immunotherapies from EMD Serono, a first in class bifunctional checkpoint inhibitor Bintrafusp Alfa (M7824) and an antibody conjugated cytokine M9241 (NHS-IL12), in patients with all types of advanced HPV-associated cancers, whose cancer has returned or spread after treatment.
  • COVID-19 consortium received a commitment from the Secretary for Research and Scientific Training of The Ministry of Science, Technology and Innovation of Brazil (MCTI) to fund up to approximately US$60 million to support the clinical development and commercialization of a Versamune®-based COVID-19 vaccine by Farmacore in Brazil. 

“We look forward to the presentation of preliminary efficacy and safety data from the National Cancer Institute (NCI)-led Phase 2 combination study of PDS0101 at the ASCO conference in early June.  ASCO provides an important opportunity to present the potential of PDS0101 and the Versamune® platform in oncology to the research and medical community,” commented Dr. Frank Bedu-Addo, President and Chief Executive Officer of PDS Biotech, “The presentation of the human clinical efficacy data at ASCO is an important milestone both for PDS0101 and our entire Versamune®-based oncology pipeline.”

First Quarter 2021 Financial Results
PDS Biotech reported a net loss of approximately $3.0 million, or $0.14 per basic share and diluted share, for the three months ended March 31, 2021 compared to a net loss of approximately $4.0 million, or $0.39 per basic share and diluted share, for the three months ended March 31, 2020.

Research and development (R&D) expenses decreased 28% to approximately $1.4 million for the three months ended March 31, 2021 from approximately $2.0 million for the three months ended March 31, 2020. The decrease of approximately $0.6 million in 2021 was primarily attributable to a decrease of $0.3 million in professional services and $0.3 million in clinical studies.

General and administrative expenses decreased 21% to approximately $1.6 million for the three months ended March 31, 2021 from approximately $2.1 million for the three months ended March 31, 2020. The decrease of approximately $0.5 million is primarily attributable to a decrease in professional services of approximately $0.7 million which includes legal fees of approximately $0.2 million, offset by an increase of approximately $0.2 million in personnel costs.

Total operating expenses decreased 24% to approximately $3.0 million for the three months ended March 31, 2021 from approximately $4.0 million for the three months ended March 31, 2020. 

PDS Biotech’s cash balance as of March 31, 2021 was approximately $25.0 million.

Conference Call and Webcast
The conference call is scheduled to begin at 8:00 am ET on Thursday, May 13, 2021. Participants should dial 877-407-3088 (United States) or 201-389-0927 (International) and mention PDS Biotech. Participants can also access the conference call via webcast on the investor relations page of the Company’s corporate website (link).

The event will be archived in the investor relations section of PDS Biotech’s website for 6 months. In addition, a telephonic replay of the call will be available for 6 months. The replay can be accessed by dialing 877-660-6853 (United States) or 201-612-7415 (International) with confirmation code 13716518.

About PDS Biotech

PDS Biotech is a clinical-stage immunotherapy company developing a growing pipeline of cancer immunotherapies and infectious disease vaccines based on the Company’s proprietary Versamune® T-cell activating technology platform. Our Versamune®-based products overcome the limitations of current immunotherapy by inducing in vivo, large quantities of high-quality, highly potent polyfunctional  tumor specific CD4+ helper and CD8+ killer T-cells. PDS Biotech has developed multiple therapies, based on combinations of Versamune
® and disease-specific antigens, designed to train the immune system to better recognize diseased cells and effectively attack and destroy them. Our immuno-oncology product candidates are initially being studied in combination therapy to potentially enhance efficacy without compounding toxicity across a range of cancer types. The Company’s lead investigational cancer immunotherapy product PDS0101 is currently in Phase 2 clinical studies in HPV-associated cancers. To learn more, please visit www.pdsbiotech.com or follow us on Twitter at @PDSBiotech.

Forward Looking Statements
This communication contains forward-looking statements (including within the meaning of Section 21E of the United States Securities Exchange Act of 1934, as amended, and Section 27A of the United States Securities Act of 1933, as amended) concerning PDS Biotechnology Corporation (the “Company”) and other matters. These statements may discuss goals, intentions and expectations as to future plans, trends, events, results of operations or financial condition, or otherwise, based on current beliefs of the Company’s management, as well as assumptions made by, and information currently available to, management. Forward-looking statements generally include statements that are predictive in nature and depend upon or refer to future events or conditions, and include words such as “may,” “will,” “should,” “would,” “expect,” “anticipate,” “plan,” “likely,” “believe,” “estimate,” “project,” “intend,” “forecast,” “guidance”, “outlook” and other similar expressions among others. Forward-looking statements are based on current beliefs and assumptions that are subject to risks and uncertainties and are not guarantees of future performance. Actual results could differ materially from those contained in any forward-looking statement as a result of various factors, including, without limitation: the Company’s ability to protect its intellectual property rights; the Company’s anticipated capital requirements, including the Company’s anticipated cash runway and the Company’s current expectations regarding its plans for future equity financings; the Company’s dependence on additional financing to fund its operations and complete the development and commercialization of its product candidates, and the risks that raising such additional capital may restrict the Company’s operations or require the Company to relinquish rights to the Company’s technologies or product candidates; the Company’s limited operating history in the Company’s current line of business, which makes it difficult to evaluate the Company’s prospects, the Company’s business plan or the likelihood of the Company’s successful implementation of such business plan; the timing for the Company or its partners to initiate the planned clinical trials for PDS0101, PDS0203 and other Versamune® based products; the future success of such trials; the successful implementation of the Company’s research and development programs and collaborations, including any collaboration studies concerning PDS0101, PDS0203 and other Versamune® based products and the Company’s interpretation of the results and findings of such programs and collaborations and whether such results are sufficient to support the future success of the Company’s product candidates; the success, timing and cost of the Company’s ongoing clinical trials and anticipated clinical trials for the Company’s current product candidates, including statements regarding the timing of initiation, pace of enrollment and completion of the trials (including our ability to fully fund our disclosed clinical trials, which assumes no material changes to our currently projected expenses), futility analyses, presentations at conferences and data reported in an abstract, and receipt of interim results, which are not necessarily indicative of the final results of the Company’s ongoing clinical trials; the acceptance by the market of the Company’s product candidates, if approved; the timing of and the Company’s ability to obtain and maintain U.S. Food and Drug Administration or other regulatory authority approval of, or other action with respect to, the Company’s product candidates; and other factors, including legislative, regulatory, political and economic developments not within the Company’s control, including unforeseen circumstances or other disruptions to normal business operations arising from or related to COVID-19. The foregoing review of important factors that could cause actual events to differ from expectations should not be construed as exhaustive and should be read in conjunction with statements that are included herein and elsewhere, including the risk factors included in the Company’s annual and periodic reports filed with the SEC. The forward-looking statements are made only as of the date of this press release and, except as required by applicable law, the Company undertakes no obligation to revise or update any forward-looking statement, or to make any other forward-looking statements, whether as a result of new information, future events or otherwise.

Media & Investor Relations Contact:
Deanne Randolph
PDS Biotechnology
Phone: +1 (908) 517-3613
Email: drandolph@pdsbiotech.com

Rich Cockrell
CG Capital
Phone: +1 (404) 736-3838 
Email: pdsb@cg.capital


PDS BIOTECHNOLOGY
CORPORATION AND SUBSIDIARIES

Condensed Consolidated Balance Sheets


March 31, 2021


December 31, 2020

ASSETS

(unaudited)


Current assets:


Cash and cash equivalents

$

25,037,374


$

28,839,565


Prepaid expenses and other


2,219,514


1,497,665


     Total current assets


27,256,888


30,337,230


Property and equipment, net


3,583


5,443


Operating lease right-to-use asset


501,194


547,706


Total assets

$

27,761,665


$

30,890,379


LIABILITIES AND STOCKHOLDERS’ EQUITY


LIABILITIES


Current liabilities:


Accounts payable

$

950,598


$

1,415,224


Accrued expenses


1,854,795


1,735,322


Operating lease obligation-short term


123,654


119,904


     Total current liabilities


2,929,047


3,270,450


Noncurrent liability:


     Operating lease obligation-long term


458,291


490,353


Total Liabilities:

$

3,387,338


$

3,760,803


STOCKHOLDERS’ EQUITY


Common stock, $0.00033 par value, 75,000,000 shares authorized at March 31, 2021 and December 31, 2020, 22,278,261 shares and 22,261,619 shares issued and outstanding at March 31, 2021 and December 31, 2020, respectively


7,346


7,346


Additional paid-in capital


71,200,684


70,907,315


Accumulated deficit


(46,833,703

)


(43,785,085

)

Total stockholders’ equity


24,374,327


27,129,576


Total liabilities and stockholders’ equity

$

27,761,665


$

30,890,379


PDS BIOTECHNOLOGY CORPORATION AND SUBSIDIARIES

Condensed Consolidated Statements of Operations and
Comprehensive Loss

(Unaudited)


Three Months Ended March 31,


2021


2020

Operating expenses:


Research and development expenses

$

1,413,057


$

1,971,679


General and administrative expenses


1,636,216


2,060,148


Total operating expenses


3,049,273


4,031,827


Loss from operations


(3,049,273

)


(4,031,827

)


Other income


Interest income


655


46,419


Net loss and comprehensive loss

$

(3,048,618

)


$

(3,985,408

)


Per share information:


Net loss per share, basic

$

(0.14

)


$

(0.39

)

Net loss per share, diluted

$

(0.14

)


$

(0.39

)


Weighted average common shares outstanding, basic


22,263,838


10,314,761


Weighted average common shares outstanding, diluted


22,263,838


10,314,761


Release – Endeavour Silver Announces 2021 Annual General Meeting Results


Endeavour Silver Announces 2021 Annual General Meeting Results

VANCOUVER, British Columbia,
May 12, 2021 (GLOBE NEWSWIRE) — Endeavour Silver Corp. (NYSE: EXK; TSX: EDR)
 announces that at the Company’s 2021 Annual General Meeting (“AGM”) held on May 12, 2021 in Vancouver, shareholders voted in favour of all items of business. A total of 67,521,897 votes were cast or represented by proxy at the AGM, representing 41.25% of the outstanding common shares as of the record date. The following is a tabulation of the votes submitted by proxy:

Director

Votes for

Votes withheld

Percent for

Percent withheld

Margaret M. Beck        

34,983,870

749,106

97.90%

2.10%

Ricardo M. Campoy

35,070,420

662,556

98.15%

1.85%

Bradford J. Cooke

33,801,339

1,931,637

94.59%

5.41%

Geoffrey A. Handley

33,025,727

2,707,250

92.42%

7.58%

Rex J. McLennan

34,891,330

841,646

97.64%

2.36%

Kenneth Pickering

35,004,529

728,448

97.96%

2.04%

Mario D. Szotlender

34,601,368

1,131,608

96.83%

3.17%

All director nominees were re-elected.

By a vote by show of hands, shareholders voted 98.09% in favour of re-appointing KPMG LLP as auditor of the Company and authorized the Board to fix the auditor’s remuneration for the ensuing year. In addition, shareholders also voted 97.51% in favour to reconfirm the Stock Option Plan, as amended by Amendment No. 5 and 97.75% in favour of the Share Unit Plan.

As previously announced, effective today, Bradford Cooke has been appointed Executive Chair of the Board and has stepped down as CEO. Dan Dickson has assumed the role of CEO and has been appointed to the Board, Christine West has assumed the role of CFO and Rex McLennan has been selected as Lead Director of Endeavour. Geoff Handley has stepped down as Chairman but plans to remain an active Director of the Company.

Bradford Cooke commented, “I want to thank all of the people who have supported me over the past 17 years in building up Endeavour Silver to the Company it is today, including our management team, board of directors and of course our shareholders. We have done some great things together but we are not half done yet.”

“The time has come to pass the management baton to our rising stars, Dan Dickson and Christine West. I plan to stay active with Endeavour, utilizing my knowledge of and contacts in the mining industry to continue building a bigger and better Company, and supporting Dan and Christine in their new roles. We appreciate the vote of confidence of our directors and shareholders.”

About Endeavour Silver – Endeavour Silver Corp. is a mid-tier precious metals mining company that owns and operates three high-grade, underground, silver-gold mines in Mexico. Endeavour is currently advancing the Terronera mine project towards a development decision and exploring its portfolio of exploration and development projects in Mexico and Chile to facilitate its goal to become a premier senior silver producer.  Our philosophy of corporate social integrity creates value for all stakeholders.

SOURCE Endeavour Silver Corp.

Contact Information:
Galina Meleger, Director Investor Relations
Toll free: (877) 685-9775
Tel: (604) 640-4804
Email: 
gmeleger@edrsilver.com  
Website: 
www.edrsilver.com

Release – Great Lakes Dredge & Dock Corporation Announces Pricing of Senior Notes


Great Lakes Dredge & Dock Corporation Announces Pricing of Senior Notes

HIGHER-INTEREST SENIOR NOTES TO BE REDEEMED WITH NET PROCEEDS

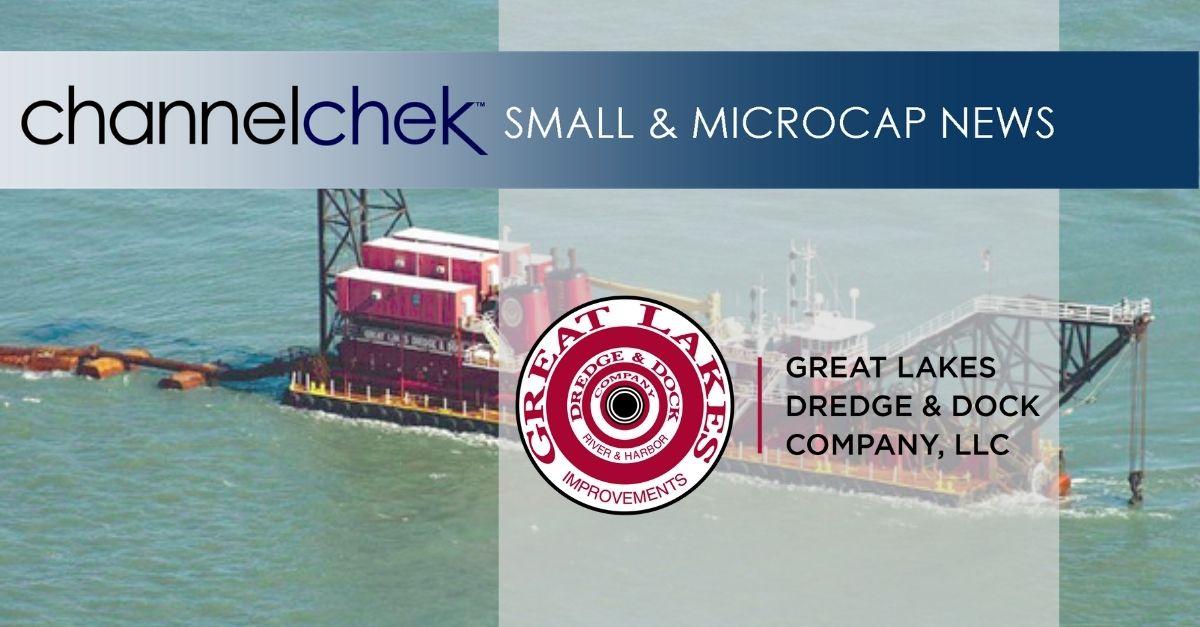
HOUSTON, May 12, 2021 (GLOBE NEWSWIRE) — Great Lakes Dredge & Dock Corporation (NASDAQ: GLDD) (“Great Lakes” or the “Company”) announced today that it has agreed to sell $325 million aggregate principal amount of its unsecured 5.25% Senior Notes due 2029 (the “2029 Notes”) pursuant to its previously-announced private offering.

The 2029 Notes were priced to investors at par and will mature on June 1, 2029. Each of the Company’s existing and future wholly-owned domestic subsidiaries that are co-borrowers or guarantors under its senior secured revolving credit agreement will guarantee the 2029 Notes.

Great Lakes intends to use the net proceeds from the offering, together with cash on hand, to redeem all $325 million aggregate principal amount of its outstanding 8.000% Senior Notes due 2022. The offering is expected to be completed on May 25, 2021, subject to the satisfaction or waiver of customary closing conditions.

The 2029 Notes will not be registered under the Securities Act of 1933, as amended (the “Securities Act”), or any state securities laws in the United States and may not be offered or sold in the United States absent registration or an exemption from the applicable registration requirements. Accordingly, the 2029 Notes are being offered and sold only to persons reasonably believed to be qualified institutional buyers in accordance with Rule 144A promulgated under the Securities Act and to non-U.S. persons outside the United States in accordance with Regulation S promulgated under the Securities Act. Holders of the 2029 Notes will not have registration rights.

This press release does not constitute an offer to sell, or a solicitation of an offer to buy, the 2029 Notes, nor will there be any sale of the 2029 Notes in any jurisdiction in which such offer, solicitation or sale would be unlawful. This press release does not constitute a notice of redemption with respect to any of the Company’s outstanding senior notes.

The
Company

Great Lakes is the largest provider of dredging services in the United States. In addition, the Company has a long history of performing significant international projects. The Company employs experienced civil, ocean and mechanical engineering staff in its estimating, production and project management functions. In its over 130-year history, the Company has never failed to complete a marine project. Great Lakes owns and operates the largest and most diverse fleet in the U.S. dredging industry, comprised of over 200 specialized vessels. Great Lakes has a disciplined training program for engineers that ensures experienced-based performance as they advance through Company operations. The Company’s Incident & Injury Free® (IIF®) safety management program is integrated into all aspects of the Company’s culture. The Company’s commitment to the IIF® culture promotes a work environment where employee safety is paramount.

Cautionary
Note Regarding Forward-Looking Statements

Except for historical and factual information, the matters set forth in this release and other of our oral or written statements identified by words such as “intends,” “plans,” “expects,” “anticipates,” “believes” and “will” and similar expressions are forward-looking statements within the meaning of the federal securities laws. Such forward-looking statements involve known and unknown risks, uncertainties and other important factors that could cause the actual results, performance or achievements of Great Lakes and its subsidiaries, or industry results, to differ materially from any future results, performance or achievements expressed or implied by such forward-looking statements. These cautionary statements are being made with the intention of obtaining the benefits of the “safe harbor” provisions of the federal securities laws. Great Lakes cautions investors that any forward-looking statements made by Great Lakes are not guarantees or indicative of future performance. Important assumptions and other important factors that could cause actual results to differ materially from those forward-looking statements with respect to Great Lakes, include, but are not limited to: our failure to satisfy the conditions to the initial purchasers’ obligation to consummate the offering; corporate developments that could preclude, impair or delay the above-described transactions due to restrictions under the federal securities laws; changes in the Company’s credit ratings; changes in the cash requirements, financial position, financing plans or investment plans of the Company or its affiliates; changes in general market, economic, tax, regulatory or industry conditions that impact the ability or willingness of the Company or its affiliates to consummate the above-described transactions on the terms described above or at all; and other risks referenced from time to time in the filings of the Company with the SEC.

Although Great Lakes believes that its plans, intentions and expectations reflected in or suggested by such forward-looking statements are reasonable, actual results could differ materially from a projection or assumption in any forward-looking statements. Great Lakes’ future financial condition and results of operations, as well as any forward-looking statements, are subject to change and inherent risks and uncertainties. The forward-looking statements contained in this press release are made only as of the date hereof and Great Lakes does not have or undertake any obligation to publicly update or revise any forward-looking statements whether as a result of new information, subsequent events or otherwise, unless otherwise required by law.

For
further information contact:

Tina
Baginskis

Director,
Investor Relations

630-574-3024


Release – PLBY Group Reports First Quarter 2021 Financial Results


PLBY Group Reports First Quarter 2021 Financial Results

First Quarter 2021 Revenue Up 34% Year-Over-Year to $42.7 Million

LOS ANGELES, May 12, 2021 (GLOBE NEWSWIRE) — PLBY Group, Inc. (NASDAQ: PLBY) (“PLBY Group” or the “Company”), a leading pleasure and leisure lifestyle company and owner of Playboy, one of the most recognizable and iconic brands in the world, today provided financial results for the first quarter ended March 31, 2021.

Ben Kohn, Chief Executive Officer of PLBY Group, stated, “Our strong first quarter financial performance reflects the exciting growth potential of our direct-to-consumer business, which experienced triple digit revenue growth year-over-year as we successfully increased merchandising, cross-selling, and influencer marketing programs. I’m especially pleased with our results considering we continue to experience short-term, industry-wide supply chain disruptions leading to out-of-stocks on select items.”

Mr. Kohn continued, “We’re also thrilled by the recent performance of our first NFT art drop, a symbol of the infinite product experiences we can build off the back of our iconic flagship brand and rich archive. We are in the early innings of unlocking the tremendous potential of our intellectual property and global fan base and remain focused on investing today in opportunities to drive superior long-term growth and deliver substantial long-term value for our shareholders.”

First
Quarter 2021 Financial Highlights

  • Revenue grew 34% year-over-year to $42.7 million, driven by 114% growth in direct-to-consumer revenue in the comparable period.
  • Net loss was $5.0 million, largely due to a $13.8 million year-over-year increase in selling and administrative expenses as the Company incurred $6.3 million of non-recurring items related to the closing of its recent business combination, including a $2.7 million increase in stock-based compensation expense. Additionally, the Company had increased costs related to M&A transaction expenses, ongoing costs attributable to acquired businesses, and expenses associated with being a newly public company.
  • Adjusted EBITDA was $6.7 million and was burdened by an additional $1.5 million of one-time expenses related to M&A transaction expenses, severance, and COVID testing at the Company’s fulfillment center, none of which were added back to arrive at adjusted EBITDA.

Webcast
Details

The Company will host a webcast at 5:00 p.m. Eastern Time on May 12, 2021 to discuss first quarter 2021 results. Participants may access the live webcast on the PLBY Group, Inc. Investor Relations website at https://www.plbygroup.com/investors.

About
PLBY Group, Inc.

PLBY Group connects consumers around the world with products, services, and experiences to help them look good, feel good, and have fun. PLBY Group serves consumers in four major categories: Sexual Wellness, Style & Apparel, Gaming & Lifestyle, and Beauty & Grooming. PLBY Group’s flagship consumer brand, Playboy, is one of the most recognizable, iconic brands in the world, driving billions of dollars in consumer spending annually across 180 countries. Learn more at http://www.plbygroup.com.

Forward-Looking
Statements

This press release includes “forward-looking statements” within the meaning of the “safe harbor” provisions of the United States Private Securities Litigation Reform Act of 1995. The Company’s actual results may differ from their expectations, estimates, and projections and, consequently, you should not rely on these forward-looking statements as predictions of future events. Words such as “expect,” “estimate,” “project,” “budget,” “forecast,” “anticipate,” “intend,” “plan,” “may,” “will,” “could,” “should,” “believes,” “predicts,” “potential,” “continue,” and similar expressions (or the negative versions of such words or expressions) are intended to identify such forward-looking statements. These forward-looking statements include, without limitation, the Company’s expectations with respect to future performance, growth plans and anticipated financial impacts of the business combination and the Lovers acquisition.

These forward-looking statements involve significant risks and uncertainties that could cause the actual results to differ materially from those discussed in the forward-looking statements. Factors that may cause such differences include, but are not limited to: (1) the impact of COVID-19 pandemic on the Company’s business; (2) the inability to maintain the listing of the Company’s shares of common stock on Nasdaq; (3) the risk that the business combination, recent acquisitions or any proposed transactions disrupt the Company’s current plans and operations, including the risk that the Company does not complete any such proposed transactions or achieve the expected benefit from them; (4) the ability to recognize the anticipated benefits of the business combination, which may be affected by, among other things, competition, the ability of the Company to grow and manage growth profitably, and retain its key employees; (5) costs related to the business combination; (6) changes in applicable laws or regulations; (7) the possibility that the Company may be adversely affected by other economic, business, and/or competitive factors; (8) risks relating to the uncertainty of the projected financial information of the Company; (9) risks related to the organic and inorganic growth of the Company’s business and the timing of expected business milestones; and (10) other risks and uncertainties indicated from time to time in the Company’s annual report on Form 10-K, including those under “Risk Factors” therein, and in the Company’s other filings with the Securities and Exchange Commission. The Company cautions that the foregoing list of factors is not exclusive, and readers should not place undue reliance upon any forward-looking statements, which speak only as of the date which they were made. The Company does not undertake any obligation to update or revise any forward-looking statements to reflect any change in its expectations or any change in events, conditions, or circumstances on which any such statement is based.

Contact:
Investors: 
investors@plbygroup.com
Media: 
press@plbygroup.com

Pangaea Logistics Solutions Ltd. (PANL) – Trifecta: Solid Results Expanding Fleet and Higher Float

Thursday, May 13, 2021

Pangaea Logistics Solutions Ltd. (PANL)
Trifecta: Solid Results, Expanding Fleet and Higher Float

Pangaea Logistics Solutions Ltd and its subsidiaries provide seaborne drybulk transportation services. It transports drybulk cargos including grains, coal, iron, ore, pig, iron, hot briquetted iron, bauxite, alumina, cement clinker, dolomite and limestone. The firm’s services include cargo loading, cargo discharge, vessel chartering, voyage planning and technical vessel management. The company derives all of its revenues from contracts of affreightment, voyage charters and time charters. Its strategy depends on focusing on increasing strategic contracts of affreightment, expanding capacity and flexibility by increasing its owned fleet and increasing backhaul focus and fleet efficiency.

Poe Fratt, Senior Research Analyst, Noble Capital Markets, Inc.

Refer to the full report for the price target, fundamental analysis, and rating.

    1Q2021 TCE Rates Above Expectations and 2Q2021 Off to Good Start. 1Q2020 EBITDA of $11.8 million was above expectations by $1.9 million mainly due to higher-than-expected TCE rates of $16.5k/day and higher shipping days of 4,668. Due to a rapidly rising rate market, the unique and consistent business model delivered modest TCE rate outperformance of $254, or well below more than $4.4k/day in 4Q2020.

    Revising 2021 EBITDA estimate to $63.4 million based on TCE rates of $21.0k/day from $53.5 million based on TCE rates of $15.8k/day and total shipping days of 19,260.  Looking at the rest of the year, we believe that the prospects look very good for the dry bulk market. The fleet renewal program should also have a positive impact and forward cover is 64% of estimated 2Q2021 shipping days booked at …


This Company Sponsored Research is provided by Noble Capital Markets, Inc., a FINRA and S.E.C. registered broker-dealer (B/D).

*Analyst certification and important disclosures included in the full report. NOTE: investment decisions should not be based upon the content of this research summary.  Proper due diligence is required before making any investment decision. 

FAT Brands Inc. (FAT) – Momentum Continues to Build

Thursday, May 13, 2021

FAT Brands Inc. (FAT)
Momentum Continues to Build

FAT Brands Inc is a multi-brand restaurant franchising company. It develops, markets, and acquires predominantly fast casual restaurant concepts. The company provides turkey burgers, chicken Sandwiches, chicken tenders, burgers, ribs, wrap sandwiches, and others. Its brand portfolio comprises Fatburger, Buffalo’s Cafe and Express, and Ponderosa and Bonanza. The company’s overall footprint covers nearly 32 countries. Fatburger generates maximum revenue for the company.

Joe Gomes, Senior Research Analyst, Noble Capital Markets, Inc.

Refer to the full report for the price target, fundamental analysis, and rating.

    1Q21 Results. Fat Brands reported 1Q21 revenue of $6.6 million, compared to $4.4 million in 1Q20. The increased revenue was driven by royalties, which rose to $4.9 million in the quarter from $3.3 million in 1Q20. Cost and expenses were impacted by increased compensation and legal expenses, which combined with higher interest expense, resulted in a reported loss for the quarter of $2.4 million, or $0.20 per share, compared to a loss of $2.4, or $0.20 per share last year. We had projected revenue of $6.75 million and a net loss of $675,000, or $0.06 per share.

    Sales Trends Improving.  The first quarter saw a continuation of improving sales trends off COVID lows. System-wide sales were $114.4 million in the quarter, up from $47.7 million in 2Q20, and $84.9 million in 1Q20. Average weekly sales hit nearly $19 million for the month of April, up from $18.1 million in March and $8.7 million in the year ago April. Third party delivery sales rose 70% in 1Q21 …


This Company Sponsored Research is provided by Noble Capital Markets, Inc., a FINRA and S.E.C. registered broker-dealer (B/D).

*Analyst certification and important disclosures included in the full report. NOTE: investment decisions should not be based upon the content of this research summary.  Proper due diligence is required before making any investment decision.