Energy Services of America (ESOA) – March Quarter Results Out and Virtual NDR Comments

Monday, May 17, 2021

Energy Services of America (ESOA)
March Quarter Results Out and Virtual NDR Comments

Energy Services of America Corporation is engaged in providing contracting services for energy-related companies. The company is primarily engaged in the construction, replacement, and repair of natural gas pipelines and storage facilities for utility companies and private natural gas companies. It services the gas, petroleum, power, chemical and automotive industries, and does incidental work such as water and sewer projects. Energy Service’s other services include liquid pipeline construction, pump station construction, production facility construction, water and sewer pipeline installations, various maintenance and repair services and other services related to pipeline construction.

Poe Fratt, Senior Research Analyst, Noble Capital Markets, Inc.

Refer to the full report for the price target, fundamental analysis, and rating.

    Compared to the March 2020 quarter, the March 2021 quarter improved, in part due to the December 2020 acquisition of West Virginia Pipeline (WVP). As typical during the winter, EBITDA was negative at $0.8 million, but it was an improvement over the 2Q2020 EBITDA loss of $1.2 million due to higher revenue and gross profit, which more than offset higher G&A expense. Compared to our estimate, revenue was lower by $0.9 million and costs were slightly lower by $0.5 million so gross profit was $0.4 million lower than expected and EBITDA was $0.7 million lower than expected.

    Moving FY2021 EBITDA to $8.0 million from $9.1 million to reflect quarterly results.  Our estimate is based on total revenue of $133.6 million and gross profit of $17.3 million. We estimate that gross margin will approximate 12.9% with EBITDA margin of 6.0%. Current backlog of $61.2 million supports our outlook …


This Company Sponsored Research is provided by Noble Capital Markets, Inc., a FINRA and S.E.C. registered broker-dealer (B/D).

*Analyst certification and important disclosures included in the full report. NOTE: investment decisions should not be based upon the content of this research summary.  Proper due diligence is required before making any investment decision. 

Is Inflation Going to Hurt Stocks?


image credit: Brett Rogers (Pexel)


Some Color on Prices and the Market’s Fixation on Inflation


Stock market investors as a whole tend to rotate their worries and fixations. At times they place heightened importance on economic releases such as unemployment, consumer confidence, exchange rates, or inflation, at other times the focus is on other factors that will impact the economy and stock prices. We’ve recently seen these other factors include Covid19 vaccine availability, natural resource scarcity, and interest rates.

The current fixation is inflation. Is this worry appropriate under the current circumstances? We’ll explore this with an eye toward where further price increases may come from.


Demand-Pull Inflation

The market’s current fixation is on inflation – more specifically it’s on something called demand-pull inflation. Equity investors have become nervous that the money that continues to be created in trillion-dollar increments will pull prices upward as the increased ability or desire to spend remains in place. Demand-pull, which in the most simple terms means increased availability of money (wage increases, stimulus checks, higher employment levels) can spark inflation causing demand. The primary concerns that many view are at work now are money supply expansion, the growing economy, inflation expectations, government spending, and asset price increases.

Outside of the demand-pull theory, there are also supply-driven shortages caused by shutdowns and uneven demand that have driven up prices on lumber, paint, electronics, cars, and more. These are viewed as more temporary.


Causes of Demand-Pull Inflation

Money Supply Expansion- If there is an excess of money created and in circulation, prices of goods and services are bid up as demand for those goods and services increases. The same effect is created if interest rates are low and credit is easy; in these cases, more people have the ability to purchase a limited amount of goods.

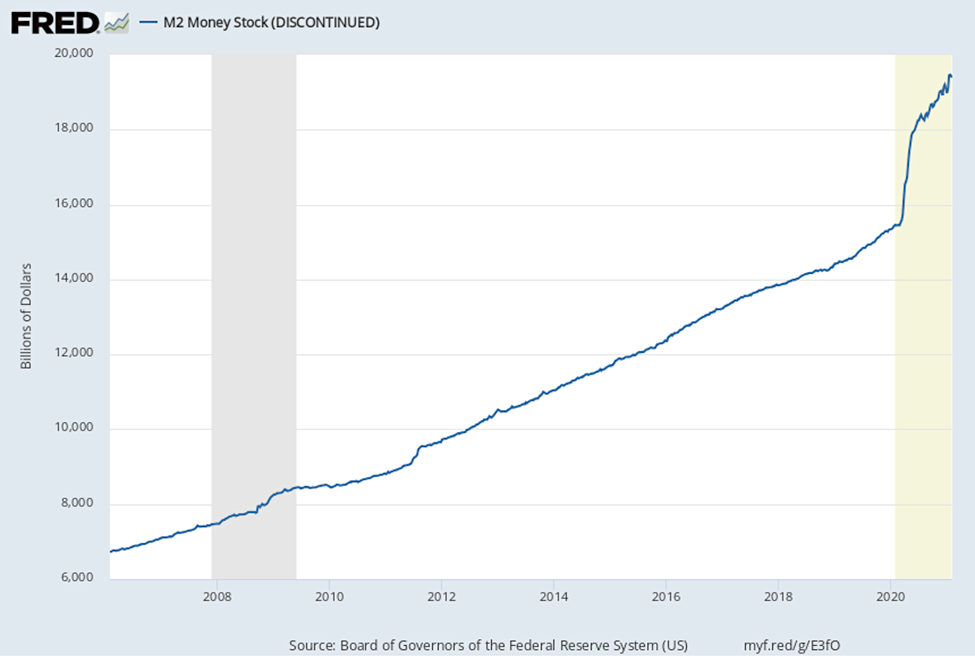
The chart below shows the growth of M2, a money supply measure that includes cash, bank deposits, and other “cash-like” instruments such as money market accounts. The chart covers the period from February 2006 through February 2021. There is a very steep spike in the supply of M2 beginning in March of last year. The chart is not current as the Federal Reserve discontinued reporting this popular data series.


Growing Economy-  An economy where jobs are being created and confidence is escalating feeds on itself as more people have a higher income to spend. This creates demand for products and services and the ability for businesses to increase prices. Workers may also review the price tag they put on their own labor as demand for employees grows. The employer then decides if the increased wage costs are passed along to the customers. In a growing economy, it’s much easier to pass along the increased cost of employees, which adds to consumer prices.

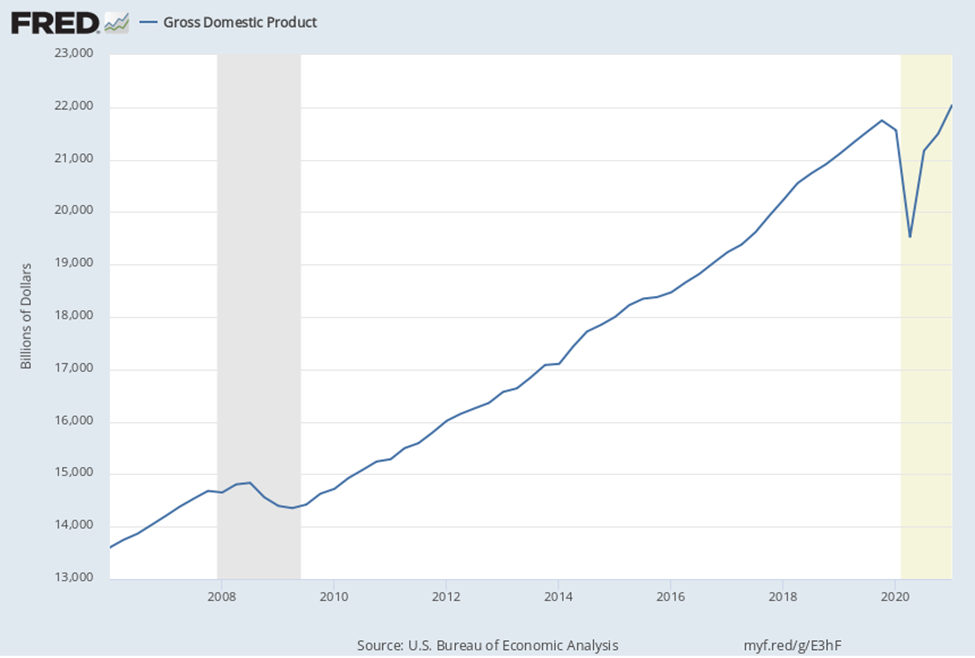
The chart below is of quarterly GDP and demonstrates just how remarkably strong the economic growth has been.


Inflation Expectations- Last month there was a dramatic increase in the price of used cars (10%), lumber prices have been climbing as well. Overall the consumer price index (CPI) has been surprised the markets by being even higher than expected. Seeing reported inflation tick up along with the increased money supply and economic growth causes consumers to buy sooner rather than later. This increases demand and of course, this demand pulls prices up.

The excerpt below is from the Bureau of Labor Statistics (BLS) released in mid-May. It highlights that the increase in used car prices for April 2021 is the highest ever recorded.


Government Spending- Increased spending increases demand for both raw materials and products. For example, if there are government-led infrastructure projects that require copper and steel, the cost for these may increase, this would then increase the cost of manufacturing homes, cars, and electronics that use the same raw materials. When those costs are passed along, it contributes to consumer inflation.

Similarly, a tax cut places more money in the hands of consumers; this also has a demand-pull impact on prices.

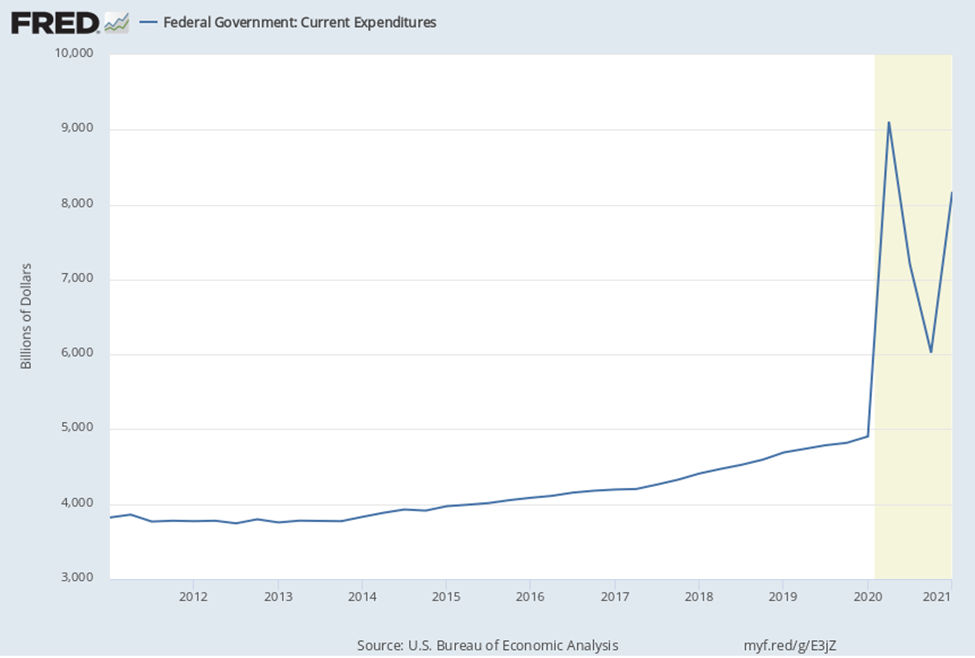
The chart below is of government expenditures. The peak period is Q2 2020, the dip and turnaround were Q4 2020. The trend appears to be continuing upward; recent announcements and proposals out of Washington suggest that it will accelerate sharply.


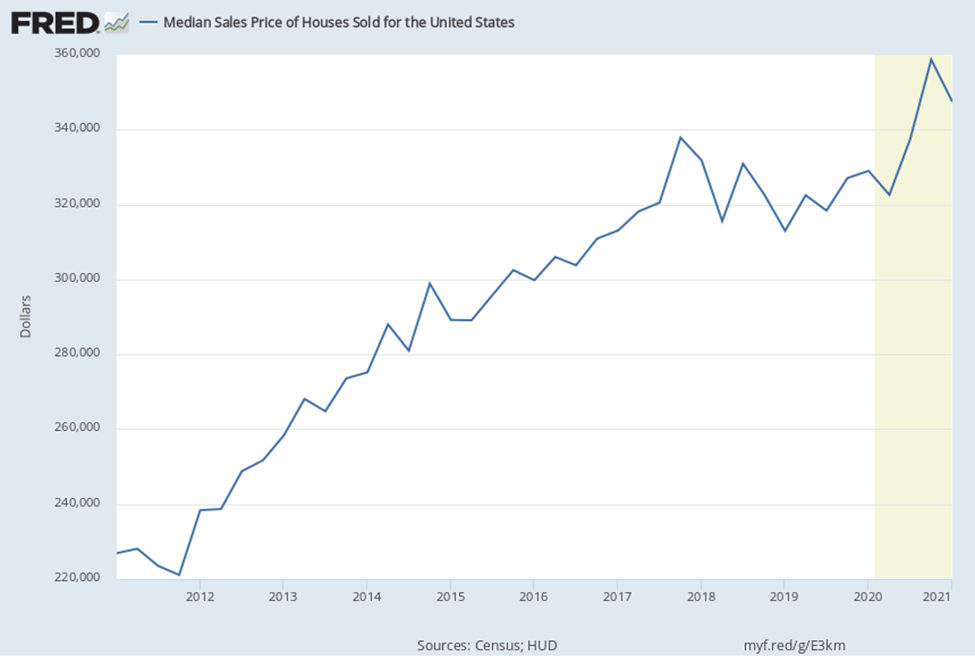
Asset Inflation- The changes that households are going through to make remote working easier and more productive is a good example of demand-pull inflation. With the new need for workspace at home, prices of larger homes have increased faster than smaller homes. In the case of furniture and electronics, they are also experiencing supply shortages which creates an almost frenzy-like behavior from consumers. 

Below is a chart of median home prices over the past 10 years. Prices began accelerating in March of 2020 and appear to have tapered recently.


Take-Away

The behavior of the stock market, despite the inflation worries, has been remarkably strong. Most of the concern is that inflation would cause interest rates to rise, higher rates on bonds would give investors an alternative, and at the same time, higher interest rates paid would cut into company earnings.  The bond market, which is impacted more directly by inflation, has not been panicking. Financial markets, although nervous and maybe even keeping one finger on the “sell” trigger may be taking the Fed at its word. Fed Chairman Powell has said, “An episode of one-time price increases as the economy reopens, is not likely to lead to persistently higher year-over-year inflation into the future.”

Whether this is true remains to be seen. The official stance is in line with what one would expect out of the nation’s central bank chair. If Powell in any way indicates concern over price increases, demand-pull would increase as inflation expectations would take firmer root in people’s minds, increased demand and higher prices would then become self-fulfilling.


Paul Hoffman

Managing Editor, Channelchek


Suggested Reading:

A Look at Real Estate Risks to the Stock Market

The Limits of Government Economic Tinkering (June 2020)


Long Term Retirement Money and Fledgling Companies

$1.9 Trillion in Terms We Can Better Relate To


Sources:

www.bls.gov

https://fred.stlouisfed.org/


Stay up to date. Follow us:


Stay up to date. Follow us:

Energy Fuels (UUUU)(EFR:CA) – Financial Results Lower on Limited Sales Company Gearing Up For Rare Earth Push

Friday, May 14, 2021

Energy Fuels (UUUU)(EFR:CA)
Financial Results Lower on Limited Sales, Company Gearing Up For Rare Earth Push

As of April 24, 2020, Noble Capital Markets research on Energy Fuels is published under ticker symbols (UUUU and EFR:CA). The price target is in USD and based on ticker symbol UUUU. Research reports dated prior to April 24, 2020 may not follow these guidelines and could account for a variance in the price target.

Energy Fuels is the largest uranium producer in the U.S. and holds more production capacity and uranium resources than any other U.S. producer. The Company also produces vanadium. Headquartered in Colorado, Energy Fuels holds three of America’s key uranium production centers: the White Mesa Mill in Utah, the Nichols Ranch ISR Facility in Wyoming, and the Alta Mesa ISR Facility in Texas. The producing White Mesa Mill is the only conventional uranium mill in the U.S. and has a licensed capacity of 8 million pounds of U3O8 per year. Nichols Ranch is in production and has a licensed capacity of 2 million pounds of U3O8 per year. Alta Mesa is currently on standby. Energy Fuels also owns several licensed and developed uranium and vanadium mines on standby and other projects in development.

Michael Heim, Senior Research Analyst, Noble Capital Markets, Inc.

Refer to the full report for the price target, fundamental analysis, and rating.

    Energy Fuels reported a loss net to the company of $10.9 million ($0.08) versus a loss of $5.7 million ($0.05). With uranium and vanadium operations largely shut down until prices improve, the loss was not unexpected. Revenues were a modest $353,000, in line with previous quarters. The company has been recovering modest amounts of uranium from alternate feed materials and mixed rare earth elements processing and uranium inventories have grown to 690,800 pounds of uranium from 134,000 a year ago. The company has not entered into any long-term sales contracts and does not expect to do so in 2020.

    Company is gearing up for a rare earth elements (REE) push.  Energy Fuels took advantage of a higher stock price to raise $12.99 million growing its cash position to $44 million from $24 million at the end of the year. In a recent presentation to analyst at another firm, management indicated it would take $2 million to convert the White Mesa mill to produce REE carbonate. It would take another $4-5 …


This Company Sponsored Research is provided by Noble Capital Markets, Inc., a FINRA and S.E.C. registered broker-dealer (B/D).

*Analyst certification and important disclosures included in the full report. NOTE: investment decisions should not be based upon the content of this research summary.  Proper due diligence is required before making any investment decision. 

Gevo Inc. (GEVO) – Net-Zero Concept On Track and RNG Project Financed

Friday, May 14, 2021

Gevo, Inc. (GEVO)
Net-Zero Concept On Track and RNG Project Financed

Gevo Inc is a renewable chemicals and biofuels company engaged in the development and commercialization of alternatives to petroleum-based products based on isobutanol produced from renewable feedstocks. Its operating segments are the Gevo segment and the Gevo Development/Agri-Energy segment. By its segments, it is involved in research and development activities related to the future production of isobutanol, including the development of its biocatalysts, the production and sale of biojet fuel, its Retrofit process and the next generation of chemicals and biofuels that will be based on its isobutanol technology. Gevo Development/Agri-Energy is the key revenue generating segment which involves the operation of the Luverne Facility and production of ethanol, isobutanol and related products.

Poe Fratt, Senior Research Analyst, Noble Capital Markets, Inc.

Refer to the full report for the price target, fundamental analysis, and rating.

    1Q2021 EBITDA Loss Higher Than Expected. Adjusting 2021 EBITDA loss estimate. 1Q2021 EBITDA loss of $7.8 million was higher than than expected due to early stage project development expenses of $2.7 million. Our new 2021 EBITDA loss estimate increases to $39.8 million to include the ramping up of early stage project costs, including FEED and other development costs.

    Renewable Natural Gas (RNG) financing closed and project on track for startup next year.  A 21-year green bond financing of $67.2 million at an interest rate of 1.5% closed and will finance the RNG plant. The wholly-owner project is likely to be consolidated, and development and other costs of $9.3 million were reimbursed at closing. RNG plant starts up in 2H2022 and annual cash flow is estimated at …


This Company Sponsored Research is provided by Noble Capital Markets, Inc., a FINRA and S.E.C. registered broker-dealer (B/D).

*Analyst certification and important disclosures included in the full report. NOTE: investment decisions should not be based upon the content of this research summary.  Proper due diligence is required before making any investment decision. 

Golden Predator Mining (NTGSF)(GPY:CA) – Will Patience Be Rewarded?

Friday, May 14, 2021

Golden Predator Mining (NTGSF)(GPY:CA)
Will Patience Be Rewarded?

Golden Predator Mining Corp is a Canada based exploration stage company engaged in the business of acquiring and exploring mineral properties. It owns properties primarily in Yukon, Canada. Some of the company’s projects located in Yukon are the 3 Aces, Sprogge, Reef, Brewery Creek, Marg, Sonora Gulch, Grew Creek, Upper Hyland and others.

Mark Reichman, Senior Research Analyst of Natural Resources, Noble Capital Markets, Inc.

Refer to the full report for the price target, fundamental analysis, and rating.

    Bankable feasibility study (BFS). A bankable feasibility study, expected to be completed early in the third quarter of 2021, is being completed by Kappes Cassiday & Associates and will include a multi-year mine plan for Brewery Creek. In addition to an inventory of material on the heap to be re-processed and a plan to resume mining of material from leachable resources, it will also include a mine schedule, operating and capital cost estimates, and economic cash flow model. Completion of the BFS will enable the company’s Board of Directors to make a production and financing decision.

    License renewal applications.  During the first quarter, Golden Predator submitted renewal applications for its water use and quartz mining licenses associated with its Brewery Creek Mine. The licenses expire December 31, 2021 and the company seeks renewal for an additional 10 years under the existing terms. Future amendments to the licenses would be evaluated separately based on any proposals by …


This Company Sponsored Research is provided by Noble Capital Markets, Inc., a FINRA and S.E.C. registered broker-dealer (B/D).

*Analyst certification and important disclosures included in the full report. NOTE: investment decisions should not be based upon the content of this research summary.  Proper due diligence is required before making any investment decision. 

Cannabis Customers Served by the Ice Cream Truck Delivery Model


image credit: Pexels/Cottonbro


Delivery as a Service Business Model is Serving Marijuana Customers


The “stay at home” mindset that was adopted over the past year has forever altered the way in which we work, visit with others, and shop. It was necessary to embrace other options for a while. But, even when the temporary lifestyle changes we made became no longer necessary, many of the alternatives continue to be common methods of doing business, visiting others, and buying goods.


Delivery as a Service

Ecommerce was particularly relied upon by those that might otherwise have run to the store for clothes, home furnishings, electronic upgrades, etc. Curbside Pick-up saw a massive increase in new customers and adoption by many businesses that had never considered it.

As part of this larger shift in consumer buying methods, the delivery as a service (DaaS) business has grown dramatically. DaaS consumers are now getting on-demand delivery of everything from groceries to prepared meals, liquor, and anything else that a retailer can provide in this way. It’s a great add-on service for anyone who sells retail products, home goods, groceries, prepared food, even alcohol. Today, even traditional sellers such as Apple, Walmart, Publix Supermarkets, and 7-11 are offering delivery options to their customers. The convenience will keep customers using the services long after there are any pandemic-related restrictions. In fact, the practice is expected to grow.


DaaS and Cannabis

Over the past few years, cannabis has been quickly losing its stigma. CBD oil is legal in all 50 states, medical marijuana is legal in 36 states, and recreational use is permitted in 17 of the 50 U.S. states. This growth in usage and acceptance has been taking the once illicit product and taken it more mainstream and overt.

Companies involved in cannabis products know that the potential growth of the industry is huge, and also that competition to survive and thrive as the industry matures requires adopting successful methods proven by other industries. This has come to include local delivery with cars standing-by and stocked with product, and also pick-and-pack orders from retailers.

STEM Holdings (DBA, Driven by STEM, ticker STMH) is involved in the cultivation and retail sale of marijuana. As part of their multichannel approach to sales, they have built a “farm to home” model. The CEO of Driven by STEM, Adam Berk, met virtually with Noble Capital Markets Senior Analyst, Joe Gomes, for a C-Suite interview released this week. Adam discussed his company, the impact of Covid, a recent acquisition, and plans to expand the company’s AI informed “ice cream truck” model of delivery.

In the recorded interview, the STEM Holdings CEO was asked about their acquisition of a cannabis delivery service and what the plans are for their non-brick and mortar retail outlets. Adam explained that “Easy, convenient accessible ecommerce delivery makes sense whether your buying toothpaste, toilet paper, or cannabis.” Berk discussed this portion of their business model by saying,”…it’s important to be an omnichannel retailer, it’s important to make delivery to homes. Buy behavior has completely changed for every consumer, and we just don’t see that going back.”


Take-Away

The Stem Holding C-Suite interview offers insight into how technology is changing how consumers select and receive products and how individuals can be better served – DaaS is not going to disappear. The discussion, of course, also covers the cannabis industry and how Stem is finding new ways to better their product and the customer experience, it’s well worth watching.

You can view the entire video by clicking on the first link below.


Suggested Content:

Stem Holdings, Inc. CEO, Adam Berk – C-Suite

Medicine Man Technologies, Inc. CEO Justin Dye


Artificial Intelligence Investment Opportunities

Medical Cannabis Companies vs. Recreational Cannabis


Sources:

https://www.sciencedirect.com/science/article/pii/S2352146520303641#:~:text=Delivery%20as%20a%20Service%20(DaaS,in%20the%20on%2Ddemand%20economy.&text=It%20contributes%20to%20a%20future%20scenario%20of%20urban%20logistics%20business%20models.

https://www.channelchek.com/channelcast-detail/220


Schwazze (SHWZ) Virtual Road Show – Monday May 17 @ 1:00pm EDT

Join Schwazze CEO Justin Dye and CFO Nancy Huber for this exclusive corporate presentation, followed by a Q & A session moderated by Joe Gomes, Noble’s senior research analyst, featuring questions taken from the audience. Registration is free and open to all investors, at any level.

Register Now  |  View All Upcoming Road Shows


Stay up to date. Follow us:


Stay up to date. Follow us:

Release – Harte-Hanks Inc. (HRTH) – Reports First Quarter 2021 Financial Results


Harte Hanks Reports First Quarter 2021 Financial Results


Company posts increase in revenues and expects to be operating free cash flow positive for 2021

AUSTIN, Texas
May 13, 2021 /PRNewswire/ — Harte Hanks, Inc. (OTCQX: HRTH), an industry leader in data-driven, omnichannel marketing, today announced financial results for the first quarter ended March 31, 2021.

First Quarter Operational and Financial Highlights

  • Revenues improved by 8% to 
    $43.8 million, compared to 
    $40.5 million in the same period last year.
  • Operating loss improved to a loss of (
    $884,000), compared to operating loss of 
    ($5.1) million in the same period last year.
  • EBITDA improved to (
    $186,000) compared to 
    ($4.0) million in the same period last year.1
  • Adjusted EBITDA improved to 
    $2.2 million compared to 
    ($2.4) million in the same period last year.

The first quarter results by operating segment were as follows:

  1. Customer Care$16.5 million in revenue, 38% of total – Revenue increased by 
    $8.1 million from the previous year and year-over-year EBITDA improved to 
    $2.6 million from (
    $795,000). Customer Care continued to experience strong revenue tailwinds from COVID related project work, which we expect to temper. New business wins for the quarter include providing COVID-vaccine customer care for a State government and delivering digital customer support technology for a major sports streaming network.
  2. Fulfillment & Logistics, $14.3 million in revenue, 33% of total – Revenue declined approximately 
    $4 million compared to the previous year, primarily due to the closure of the direct mail facility during 2020. EBITDA improved to 
    $1.2 million from (
    $678,000) in the prior year. With the consolidation of our Fulfillment operations into the 
    Kansas City facility complete, we anticipate continued margin improvement in 2021. New business wins for the quarter include a large sampling program for a multibillion-dollar CPG company, and literature fulfillment for a large courier company.
  3. Marketing Services, $12.9 million revenue, 29% of total – Revenue and EBITDA declined by 
    $622,000 and 
    $479,000, respectively, from the prior year due to continued softness in client marketing spend related to the pandemic. New business wins for the quarter include projects from two well-respected CPG brands to provide CRM services, including customer analytics, strategic planning, creative execution, and data management, and a B2B CRM engagement with one of the world’s largest electronic component distributors.

1 

EBITDA is the Company’s measure of segment profitability.  For additional information please see the Company’s Quarterly Report on Form 10-Q for the quarter ended March 31, 2021.

Harte Hanks CEO,  Andrew Benett, commented: “We have continued to drive productivity increases in our workforce and reduced our real estate footprint. Further, in Q1 we began implementing a new Enterprise Resource Planning system. We anticipate the ERP project to extend into 2022 and expect to realize cost savings along the way.”  Mr. Benett continued: “We have built a seasoned team to lead our businesses and expect to be operating free cash flow positive for the year.”

First Quarter 2021 Results

First quarter revenues were $43.8 million, up from 
$40.5 million a year ago and down sequentially from 
$47.1 million in the fourth quarter of 2020. Continued growth in our Customer Care segment led our first quarter performance.

First quarter operating loss was (
$884,000), compared to an operating loss of (
$5.1) million in the same quarter last year. The improvement resulted from the Company’s cost reduction efforts, including a 15% reduction in production and distribution expense.

First quarter Adjusted Operating Income was 
$1.5 million, compared to a loss of (
$3.5) million in the first quarter of 2020. The improvement in Adjusted Operating Income reflects continued cost-cutting actions taken by management. Loss attributable to common stockholders for the first quarter was ($1.9) million, or (
$0.28) per basic and diluted share.

Customer Care: Revenue grew across our Customer Care segment in the quarter.  Our Customer Care segment was up 
$8.1 million year-over-year, as a result of several large projects that we expect to wind down over the course of the year.  Operating income was 
$2.3 million, which was an increase of 
$3.3 million compared to an operating loss of 
($1.0) million in the same quarter last year.

Fulfillment & Logistics: Operating income for our Fulfillment & Logistics Services segment increased 
$2.3M on a revenue decrease of 
$4.2M in the same quarter last year. Operating income in the quarter includes a 
$750,000 favorable litigation settlement. As we have eliminated the underperforming direct mail locations and consolidated Fulfillment facilities, we expect to see continued improvement in operating income as we complete our facility consolidation in Q2 of this year.

Marketing Services: Revenue and operating income for our Marketing Services segment had slight declines of 
$622,000 and 
$448,000 respectively compared to the same quarter last year.  Although we experienced a decline in Q1, we are encouraged by new wins and increases in client spend we saw in March and moving into Q2.

Conference Call Information

The Company will host a conference call and live webcast to discuss these results today at 4:30 p.m. ET. To access the live call, please dial (866) 548-4713 (toll free) or (323) 794-2093 and reference conference ID 6013966. The conference call will also be webcast live in the Investors Events section of the Harte Hanks website and can be accessed from the link here.

Following the conclusion of the live call, a telephonic replay will be available for 48 hours by dialing (844) 512-2921 or (412) 317-6671 and using the pin number 6013966. The replay will also be available for at least 90 days in the Investors Events section of the 
Harte Hanks website.

Cautionary Note Regarding Forward-Looking Statements:

Our press release and related earnings conference call contain “forward-looking statements” within the meaning of U.S. federal securities laws. All such statements are qualified by this cautionary note, provided pursuant to the safe harbor provisions of Section 27A of the Securities Act of 1933 and Section 21E of the Securities Exchange Act of 1934.  Statements other than historical facts are forward-looking and may be identified by words such as “may,” “will,” “expects,” “believes,” “anticipates,” “plans,” “estimates,” “seeks,” “could,” “intends,” or words of similar meaning.  These forward-looking statements are based on current information, expectations and estimates and involve risks, uncertainties, assumptions and other factors that are difficult to predict and that could cause actual results to vary materially from what is expressed in or indicated by the forward-looking statements.  In that event, our business, financial condition, results of operations or liquidity could be materially adversely affected and investors in our securities could lose part or all of their investments.  These risks, uncertainties, assumptions and other factors include: (a) local, national and international economic and business conditions, including (i) the outbreak of diseases, such as the COVID-19 coronavirus, which has curtailed travel to and from certain countries and geographic regions, disrupted business operations resulting from travel restrictions and reduced consumer spending, and uncertainty regarding the duration of the virus’ impact, (ii) market conditions that may adversely impact marketing expenditures and (iii) the impact of economic environments and competitive pressures on the financial condition, marketing expenditures and activities of our clients and prospects; (b) the demand for our products and services by clients and prospective clients, including (i) the willingness of existing clients to maintain or increase their spending on products and services that are or remain profitable for us, and (ii) our ability to predict changes in client needs and preferences; (c) economic and other business factors that impact the industry verticals we serve, including competition and consolidation of current and prospective clients, vendors and partners in these verticals; (d) our ability to manage and timely adjust our facilities, capacity, workforce and cost structure to effectively serve our clients; (e) our ability to improve our processes and to provide new products and services in a timely and cost-effective manner though development, license, partnership or acquisition; (f) our ability to protect our facilities against security breaches and other interruptions and to protect sensitive personal information of our clients and their customers; (g) our ability to respond to increasing concern, regulation and legal action over consumer privacy issues, including changing requirements for collection, processing and use of information; (h) the impact of privacy and other regulations, including restrictions on unsolicited marketing communications and other consumer protection laws; (i) fluctuations in fuel prices, paper prices, postal rates and postal delivery schedules; (j) the number of shares, if any, that we may repurchase in connection with our repurchase program; (k) unanticipated developments regarding litigation or other contingent liabilities; (l) our ability to complete anticipated divestitures and reorganizations, including cost-saving initiatives; (m) our ability to realize the expected tax refunds; and (n) other factors discussed from time to time in our filings with the Securities and Exchange Commission, including under “Item 1A. Risk Factors” in our Annual Report on Form 10-K for the year ended December 31, 2020 which was filed on March 24, 2021. The forward-looking statements in this press release and our related earnings conference call are made only as of the date hereof, and we undertake no obligation to update publicly any forward-looking statement, even if new information becomes available or other events occur in the future.

Supplemental Non-GAAP Financial Measures:

The Company reports its financial results in accordance with generally accepted accounting principles (“GAAP”). In this press release and our related earnings conference call, however, the Company may use certain non-GAAP measures of financial performance in order to provide investors with a better understanding of operating results and underlying trends to assess the Company’s performance and liquidity. We have presented herein a reconciliation of these measures to the most directly comparable GAAP financial measure.

The Company presents the non-GAAP financial measure “Adjusted Operating Loss” as a measure useful to both management and investors in their analysis of the Company’s Condensed Consolidated Statements of Operations (Unaudited) because it facilitates a period-to-period comparison of Operating Revenue and Operating Loss by excluding restructuring expense, impairment expense and stock-based compensation in 2021 and 2020. The most directly comparable measure for this non-GAAP financial measure is Operating Loss.

The Company also presents the non-GAAP financial measure “Adjusted EBITDA” as a supplemental measure of operating performance in order to provide an improved understanding of underlying performance trends. The Company defines “Adjusted EBITDA” as earnings before interest expense net , income tax expense (benefit), depreciation expense, restructuring expense, impairment expense, stock-based compensation expense, and other non-cash expenses. The most directly comparable measure for Adjusted EBITDA is Net Income (Loss). We believe Adjusted EBITDA is an important performance metric because it facilitates the analysis of our results, exclusive of certain non-cash items, including items which do not directly correlate to our business operations; however, we urge investors to review the reconciliation of non-GAAP Adjusted EBITDA to the comparable GAAP Net Income (Loss), which is included in this press release, and not to rely on any single financial measure to evaluate the Company’s financial performance.

The foregoing measures do not serve as a substitute and should not be construed as a substitute for GAAP performance, but provide supplemental information concerning our performance that our investors and we find useful. The Company evaluates its operating performance based on several measures, including these non-GAAP financial measures. The Company believes that the presentation of these non-GAAP financial measures in this press release and earnings conference call presentations are useful supplemental financial measures of operating performance for investors because they facilitate investors’ ability to evaluate the operational strength of the Company’s business. However, there are limitations to the use of these non-GAAP measures, including that they may not be calculated the same by other companies in our industry limiting their use as a tool to compare results. Any supplemental non-GAAP financial measures referred to herein are not calculated in accordance with GAAP and they should not be considered in isolation or as substitutes for the most comparable GAAP financial measures.

As used herein, ”
Harte Hanks” or “the Company” refers to Harte Hanks, Inc. and/or its applicable operating subsidiaries, as the context may require. 
Harte Hanks’ logo and name are trademarks of Harte Hanks.

EBITDA is the Company’s measure of segment profitability. For additional information please see the Company’s Quarterly Report on Form 10-Q for the quarter ended 
March 31, 2021.

About Harte Hanks:
Harte Hanks is a global marketing services firm specializing in multi-channel marketing solutions that connect our clients with their customers in powerful ways. Experts in defining, executing and optimizing the customer journey, Harte Hanks offers end-to-end marketing services including consulting, strategic assessment, data, analytics, digital, social, mobile, print, direct mail and contact center. From visionary thinking to tactical execution, Harte Hanks delivers smarter customer interactions for some of the ‘world’s leading brands. Harte Hanks has approximately 2,500 employees located in North America, Asia-Pacific and Europe. For more information, visit Harte Hanks at www.hartehanks.com, call 800-456-9748, or email us at pr@hartehanks.com.

Investor Relations Contact:
Sheila Ennis
Abernathy MacGregor
415-745-3294
sbe@abmac.com


Harte Hanks, Inc


Consolidated Statements of Operations (Unaudited)


Three Months Ended
March 31,

In thousands, except per share data


2021


2020

Revenue


$          43,754


$     40,522

Operating expenses


Labor


26,352


23,948

Production and distribution


11,269


13,246

Advertising, selling, general and administrative


4,121


5,948

Restructuring expense


2,198


1,366

Depreciation Expense


698


1,121

Total operating expenses


44,638


45,629

Operating loss


(884)


(5,107)

Other expenses


Interest expense, net


268


312

Other, net


15


757

Total other expenses


283


1,069

Loss before income taxes


(1,167)


(6,176)

Income tax expense (benefit)


591


(11,294)

Net (loss) income


(1,758)


5,118

Less: Preferred Stock dividends


122


123

Less: Earnings attributable to participating securities


683

(Loss) income attributable to common stockholders


$           (1,880)


$      4,312


(Loss) earnings per common share


Basic


$             (0.28)


$        0.68

Diluted


$             (0.28)


$        0.67


Weighted-average common shares outstanding


Basic


6,651


6,320

Diluted


6,651


6,481


Harte Hanks, Inc


Reconciliations of Non-GAAP Financial Measures (Unaudited)


Three Months Ended
March 31,

In thousands, except per share data


2021


2020

Net income (loss) income


$       (1,758)


$      5,118

Income tax expense (benefit)


591


(11,294)

Interest expense, net


268


312

Other, net


15


757

Depreciation expense


698


1,121

EBITDA


$          (186)


$     (3,986)


Restructuring expense


$        2,198


$      1,366

Stock-based compensation


222


216

Adjusted EBITDA


$        2,234


$     (2,404)


Operating loss


$          (884)


$     (5,107)

Restructuring expense


2,198


1,366

Stock-based compensation


222


216

Adjusted operating income (loss)


$        1,536


$     (3,525)

Adjusted operating margin (a)


3.5%


-8.7%


(a) Adjusted Operating Margin equals Adjusted Operating Income (loss) divided by Revenues


Harte Hanks, Inc


Condensed Consolidated Balance Sheets (Unaudited)


March 31,


December 31,

In thousands, except per share data


2021


2020

ASSETS


Current Assets


Cash and cash equivalents


$          24,913


$            29,408

Restricted cash


1,582


4,154

Accounts receivable (less allowance for doubtful accounts of
$349 at March 31, 2021 and $241 at December 31, 2020)


45,405


41,533

Contract assets


326


613

Inventory


42


46

Prepaid expenses


3,986


2,256

Prepaid income tax and income tax receivable


6,822


7,388

Other current assets


814


840

Total current assets


83,890


86,238


Net property, plant and equipment


5,951


5,878

Right-of-use assets


24,190


24,750

Other assets


2,831


2,632

   Total assets


$         116,862


$          119,498


LIABILITIES AND STOCKHOLDERS’ DEFICIT


Current liabilities


Accounts payable and accrued expenses


$          16,136


$            16,294

Accrued payroll and related expenses


6,811


5,248

Short-term debt


8,730


4,926

Deferred revenue and customer advances


5,203


4,661

Customer postage and program deposits


6,105


6,497

Other current liabilities


2,947


2,903

Short-term lease liabilities


7,130


6,663

Total current liabilities


53,062


47,192


Long-term debt, net of current portion


18,370


22,174

Pensions


66,544


67,490

Long-term lease liabilities, net of current portion


20,582


21,295

Other long-term liabilities


3,004


4,747

Total liabilities


161,562


162,898


Preferred stock


9,723


9,723


Stockholders’ deficit


Common stock


12,121


12,121

Additional paid-in capital


367,243


383,043

Retained earnings


794,365


796,123

Less treasury stock


(1,162,819)


(1,178,799)

Accumulated other comprehensive loss


(65,333)


(65,611)

Total stockholders’ deficit


$         (54,423)


$           (53,123)


Total liabilities, preferred stock and stockholders’ deficit


$         116,862


$          119,498


Harte Hanks, Inc.


Statement of Operations by Segments (Unaudited)


Quarter ended March 31,


 Marketing
Services


Customer
Care


Fulfillment &
Logistics
Services (1)


Restructuring


Unallocated
Corporate


Total


 (In thousands)


2021


Revenues


$      12,878


$   16,544


$                  14,332


$                  —


$                     —


$    43,754

Segment Operating Expense


$      11,041


$   13,074


$                  12,174


$                  —


$               5,453


$    41,742

Restructuring


$              —


$           —


$                           —


$            2,198


$                     —


$      2,198

Contribution margin


$        1,837


$     3,470


$                     2,158


$          (2,198)


$             (5,453)


$        (186)

Overhead Allocation


$        1,255


$        870


$                        941


$                  —


$             (3,066)


$            —

EBITDA


$           582


$     2,600


$                     1,217


$          (2,198)


$             (2,387)


$        (186)

Depreciation


$           151


$        254


$                        167


$                  —


$                  126


$         698

Operating income (loss)


$           431


$     2,346


$                     1,050


$          (2,198)


$             (2,513)


$        (884)


(1) Operating expense in this segment includes $750 thousand favorable litigation settlement as well as the related legal expenses.


2020


Revenues


$      13,500


$     8,480


$                  18,542


$                  —


$                     —


$    40,522

Segment Operating Expense


$      11,092


$     8,346


$                  18,142


$                  —


$               5,562


$    43,142

Restructuring


$              —


$           —


$                           —


$            1,366


$                     —


$      1,366

Contribution margin


$        2,408


$        134


$                        400


$          (1,366)


$             (5,562)


$    (3,986)

Overhead Allocation


$        1,347


$        929


$                     1,078


$                  —


$             (3,354)


$            —

EBITDA


$        1,061


$       (795)


$                      (678)


$          (1,366)


$             (2,208)


$    (3,986)

Depreciation


$           182


$        217


$                        552


$                  —


$                  170


$      1,121

Operating income (loss)


$           879


$   (1,012)


$                   (1,230)


$          (1,366)


$             (2,378)


$    (5,107)

SOURCE 
Harte Hanks

Release – Energy Fuels (UUUU)(EFR:CA) – Energy Fuels Announces Q1-2021 Results


Energy Fuels Announces Q1-2021 Results, Including Robust Balance Sheet, Continued Readiness to Supply Uranium into the U.S. Uranium Reserve when Established & Continued Ramp-up to Commercial Rare Earth Production; Webcast on Monday, May 17, 2021


LAKEWOOD, Colo.May 13, 2021 /CNW/ – Energy Fuels Inc. (NYSE American: UUUU) (TSX: EFR) (“Energy Fuels” or the “Company”) today reported its financial results for the quarter ended March 31, 2021. The Company’s annual report on Form 10-K has been filed with the U.S. Securities and Exchange Commission (“SEC“) and may be viewed on the Electronic Document Gathering and Retrieval System (“EDGAR“) at www.sec.gov/edgar.shtml, on the System for Electronic Document Analysis and Retrieval (“SEDAR“) at www.sedar.com, and on the Company’s website at www.energyfuels.com. Unless noted otherwise, all dollar amounts are in U.S. dollars.

Highlights:

  • At March 31, 2021, the Company had $60.37 million of working capital, including $44.11 million of cash and marketable securities and $27.98 million of inventory, including approximately 690,800 pounds of uranium and 1,672,000 pounds of high-purity vanadium in the form of immediately marketable product.
  • Due to recent share price strength, the Company raised gross proceeds of $12.99 million on its at-the-market equity program between April 1, 2021 and May 12, 2021, further enhancing the Company’s financial position.
  • During the quarter ended March 31, 2021, the Company incurred a net loss of $10.91 million, compared to a net loss of $5.66 million for the first quarter of 2020, due primarily to an increase in the Company’s share price during Q1 2021, which resulted in a non-cash mark-to-market increase in warrant liabilities of $3.50 million during Q1 2021, and an increase of $2.69 million in development expenditures in Q1 2021 compared to Q1 2020 primarily due to the development and ramping up of the expected rare earth element (“REE“) carbonate production program at the White Mesa Mill during the first quarter of 2021.
  • With several existing mines on standby and existing inventories of Company-produced, U.S.-origin uranium, the Company continues to be ready to supply uranium into the U.S. Uranium Reserve once it is established by the U.S. government.
  • On March 1, 2020, the Company, along with Neo Performance Materials (“Neo“), announced the joint launch of a U.S.-European REE production initiative under which the parties plan to produce value-added REE products from natural monazite sands, a byproduct of heavy mineral sands mined in the southeastern United States. Pursuant to this initiative, in late-March 2021 Energy Fuels commenced ramping-up commercial production of a mixed rare earth carbonate (“REE Carbonate“) from natural monazite sands at the Company’s White Mesa Mill. Under an agreement in principle signed on March 1, and subject to completion of definitive agreements and successful ramp-up of production, Energy Fuels will ship a portion of its REE Carbonate production to Neo’s REE separations facility in Sillamae, Estonia (“Silmet“). Neo will then process the REE Carbonate into separated REE materials for use in REE permanent magnets and other REE-based advanced materials. 
  • On March 9, 2021, the Company announced that the first shipments of natural monazite ore arrived at the Company’s White Mesa Mill from The Chemours Company’s Offerman Plant in Georgia, pursuant to a supply agreement entered into by the Company and Chemours in December 2020.
  • On April 21, 2021, the Company announced the execution of a non-binding memorandum of understanding for the potential future supply of additional natural monazite sands from the Titan heavy mineral sand project in Tennessee owned by Hyperion Metals Limited.
  • On April 23, 2021, the Company announced that the U.S. Department of Energy (“DOE“) Office of Fossil Energy and National Energy Technology Laboratory exercised an option to award Energy Fuels, working with a team from Penn State University, an additional $1.75 million to complete a feasibility study on the production of REE products from natural coal-based resources, as well as from other materials such as REE-containing ores like the natural monazite ore the Company is currently processing at the White Mesa Mill.
  • On April 27, 2021, the Company announced that it engaged Carester SAS (“Carester“) to prepare a scoping study for the development of a solvent extraction (“SX“) REE separation circuit at the White Mesa Mill. Carester is one of the world’s leading global consultants on REE supply chains, with expertise in designing, constructing, operating and optimizing REE production facilities globally.

Mark S. Chalmers, Energy Fuels’ President and CEO, stated:

“Without a doubt, Energy Fuels is making major strides toward restoring critical U.S. rare earth supply chains, while also maintaining our position as the leading U.S. uranium producer,” stated Mark S. Chalmers, President and CEO of Energy Fuels. “On rare earths, our efforts over the past several months culminated in the announcement on March 1 that Energy Fuels and Neo Performance Materials were creating a new, U.S.-European rare earth supply chain. In early March, we began to receive shipments of rare-earth-rich natural monazite sands from Chemours’ Georgia heavy mineral sand operations. In late-March, we began to ramp-up production of an intermediate rare earth product at our White Mesa Mill in Utah using monazite from Chemours. This is expected to be a high-value product ready to be separated and refined into value-added rare earth products at Neo’s plant in Europe. At this time, no other U.S. company is producing a product this far down the rare earth value chain.

“However, as I’ve said many times, we have much bigger rare earth plans, and the momentum is building rapidly as we execute our purposeful strategy. We are now taking real steps toward designing and building fully integrated, U.S. rare earth production capabilities. To this end, we hired Carester SAS of Lyons, France, one of the world’s leading rare earth supply chain experts, to help us begin designing rare earth separation capabilities at the White Mesa Mill. And we are continuing several collaborations with the U.S. government and national laboratories on various rare earth initiatives, including being granted a $1.75 million contract by the U.S. Department of Energy to perform studies that complement our work to develop rare earth separation capabilities at the White Mesa Mill. We continue to believe Energy Fuels has distinct advantages in the rare earth sector. Monazite ore has superior distributions of the high-value magnetic rare earths, including NdPr and “heavy” rare earths, versus most other rare earth minerals mined around the world, and monazite is currently produced as a byproduct of existing heavy mineral sand operations. We are also taking steps to utilize licensed and existing facilities at the White Mesa Mill to process the monazite into value-added products. This is a highly capital efficient initiative.

“While we are obviously extremely excited about the potential for rare earths, our core business remains uranium production, and by almost any metric, including a successful track-record of past and current uranium production, experience in both ISR and conventional uranium mining, existing licensed and constructed processing capacity, U.S.-origin inventory, recycling capabilities, and the like, Energy Fuels is clearly the leading U.S. uranium company as well. We are particularly excited by actions the Biden Administration is taking to address climate change and support nuclear energy. The U.S. gets 20% of all of our electricity, and 55% of our carbon-free electricity, from nuclear. Meeting the President’s climate goals will require preserving America’s existing fleet of nuclear reactors, while quickly deploying the next generation of reactors. And global policies, including those in Europe and China, are supporting nuclear power to achieve carbon reduction goals. We remain ready to supply U.S.-origin uranium for these initiatives.

“At the same time, we are transforming our company into ‘America’s Critical Mineral Hub’, with the main focus being on the White Mesa Mill in Utah. While nearly all current and future nuclear reactors are fueled by uranium, other clean energy and advanced technologies, including electric vehicles renewable energy and batteries, require other critical minerals that Energy Fuels produces. A robust market for responsibly produced, American clean energy products and technologies, made by American workers, is possible in the U.S. How amazing would it be for electric vehicles to be built in America using rare earth products manufactured in America; and for those EVs to be charged using carbon-free, next generation American nuclear technologies fueled by American uranium and nuclear fuel, along with renewable energy systems using American rare earth products? Energy Fuels’ White Mesa Mill in Utah can help this vision become a reality. To say these are exciting times for our company would be the understatement of my lifetime.”

Webcast on Monday, May 17, 2021 at 4:00 pm ET (2:00 pm MT):

Energy Fuels will be hosting a video webcast Monday, May 17, 2021 at 4:00 pm ET (2:00 pm MT) to discuss its Q1-2021 financial results and corporate initiatives. To join the webcast, please click on the link below to access the presentation and the viewer-controlled webcast slides:

Energy Fuels’ Q1-2021 Results

If you would like to participate in the webcast and ask questions, please dial (888) 664-6392 (toll free in the U.S. and Canada). 

A link to a recorded version of the proceedings will be available on the Company’s website shortly after the webcast by calling (888) 390-0541 (toll free in the U.S. and Canada) and by entering the code 764688#. The recording will be available until May 31 ,2021.

Selected Summary Financial Information:


$000’s, except per share data

Three months ended
March 31, 2021

Three months ended
March 31, 2020

Total revenues

$

353

$

393

Gross profit (loss)

353

(685)

Operating loss

(8,847)

(7,806)

Net loss attributable to the company

(10,908)

(5,657)

Basic and diluted loss per share

(0.08)

(0.05)


As at March 31,

2021

As at December 31,
2020

Financial Position:


Working capital

$

60,365

$

40,158

Property, plant and equipment, net

23,457

23,621

Mineral properties, net

83,539

83,539

Total assets

207,219

183,236

Total long-term liabilities

13,581

13,376

Operations Update and Outlook for the Quarter Ending March 31, 2021:

Overview

In response to the proposed establishment of a strategic national U.S. Uranium Reserve program, the Company is evaluating activities aimed towards increasing uranium production at all or some of our production facilities, including the currently operating White Mesa Mill, as well as the Alta Mesa ISR Facility, the Nichols Ranch ISR Facility, the La Sal Complex and Pinyon Plain Mine, which are currently on standby.

During 2021, the Company expects to recover uranium at the White Mesa Mill from pond-returns and from alternate feed materials. The Company also expects to recover uranium and produce mixed REE carbonate from natural monazite ore during 2021, subject to successful ramp-up. The vanadium pond-return campaign that was conducted in 2019 was brought to a close in early 2020. The Company does not plan to extract and/or recover any amounts of uranium of any significance from its Nichols Ranch Project in 2021, which was placed on standby in the second quarter of 2020 due to the depletion of its existing wellfields. Uranium recovery is expected to be maintained at reduced levels, as a result of current uranium market conditions, until such time when market conditions improve sufficiently.

The Company is also seeking new sources of revenue, including its emerging REE business, as well as new sources of alternate feed materials and new fee processing opportunities at the White Mesa Mill that can be processed under existing market conditions (i.e., without reliance on current uranium sales prices). The Company will also continue its support of U.S. governmental activities to support the U.S. uranium mining industry, including the proposed establishment of a U.S. Uranium Reserve. In addition, the Company is in discussions to potentially sell certain of its non-core properties, although there are currently no binding offers, and there can be no assurance that a sale will be completed or that we will be successful in completing a sale on acceptable terms.

Extraction and Recovery Activities Overview

During the quarter ended March 31, 2021, the Company did not recover significant quantities of U3O8. The Company expects to recover approximately 30,000 to 60,000 pounds of U3O8 in the year ending December 31, 2021 for its own account. In 2021, the Company also expects to produce approximately 2,000 to 3,000 tons of mixed REE carbonate at the mill, containing approximately 1,000 to 1,600 tons of total rare earth oxides (“TREO“). The Company expects to produce no vanadium during 2021.

The Company has strategically opted not to enter into any uranium sales commitments for 2021. Therefore, subject to the proposed establishment of a U.S. Uranium Reserve and general market conditions, all 2021 uranium production is expected to be added to existing inventories, which inventories are expected to total approximately 720,000 to 750,000 pounds of U3O8 at year-end. Subject to any actions the Company may take in response to the proposed establishment of a U.S. Uranium Reserve or improvements in general market conditions, both ISR and conventional uranium extraction and/or recovery is expected to continue to be maintained at reduced levels until such time that improvements in uranium market conditions are observed or suitable sales contracts can be entered into. All V2O5 inventory is expected to be sold on the spot market if prices rise sufficiently above current levels, but otherwise maintained in inventory. The Company expects to sell all or a portion of its mixed REE carbonate to global separation facilities and/or to stockpile it for future separation at the Mill or elsewhere.

ISR Activities

The Company expects to produce insignificant quantities of U3O8 in the year ending December 31, 2021 from Nichols Ranch.

Until such time as improvement in uranium market conditions is observed, the proposed U.S. Uranium Reserve is established, and/or suitable sales contracts can be procured, the Company expects to maintain the Nichols Ranch Project on standby and defer development of further wellfields and header houses. The Company currently holds 34 fully permitted, undeveloped wellfields at Nichols Ranch, including four additional wellfields at the Nichols Ranch wellfields, 22 wellfields at the adjacent Jane Dough wellfields, and eight wellfields at the Hank Project, which is fully permitted to be constructed as a satellite facility to the Nichols Ranch Plant.

The Company expects to continue to keep the Alta Mesa Project on standby until such time as improvements in uranium market conditions are observed, the proposed U.S. Uranium Reserve is established, and/or suitable sales contracts can be procured.

Conventional Activities Conventional Extraction and Recovery Activities

During the quarter ended March 31, 2021, the White Mesa Mill did not recover any quantities of U3O8, focusing instead on developing its REE recovery business. However, during the remainder of 2021, the Company expects to recover approximately 30,000 to 60,000 pounds of U3O8 at the White Mesa Mill, including uranium recovered through the processing of REE- and uranium-bearing natural monazite ore. The Company also expects to produce approximately 2,000 to 3,000 tons of mixed REE carbonate at the Mill, containing approximately 1,000 to 1,600 tons TREO. The Company currently has approximately 150,000 pounds of U3O8 contained in stockpiled alternate feed material and ore inventory that can be recovered in the future for the proposed U.S. Uranium Reserve or as general market conditions warrant. In addition, there remains an estimated 1.5-3 million pounds of solubilized recoverable V2O5 inventory remaining in the Mill’s tailings facility awaiting future recovery, as market conditions may warrant.

Conventional Standby, Permitting and Evaluation Activities

During the quarter ended March 31, 2021, standby and environmental compliance activities occurred at the Pinyon Plain Project.

The Company is selectively advancing certain permits at its other major conventional uranium projects, such as the Roca Honda Project, a large, high-grade conventional project in New Mexico. The Company will also maintain required permits at the Company’s conventional projects, including the Sheep Mountain Project, La Sal Complex, and the Whirlwind mine. In addition, the Company will continue to evaluate the Bullfrog Property at its Henry Mountains Project. The Company is also in discussions to potentially sell the Tony M, Daneros, Rim and other non-core conventional assets.

Uranium Sales

During the quarter ended March 31, 2021, the Company completed no sales of uranium. The Company currently has no remaining contracts, and therefore all existing uranium inventory and future production is fully unhedged to future uranium price changes.

Vanadium Sales

During the quarter ended March 31, 2020, the Company completed no sales of vanadium. The Company expects to sell finished vanadium product when justified into the metallurgical industry, as well as other markets that demand a higher-purity product, including the aerospace, chemical, and potentially the vanadium battery industries.

Rare Earth Sales

The Company commenced ramping-up commercial production of a mixed REE carbonate in March 2021. Subject to successful ramp-up of production of a salable product during 2021, the Company expects to sell some or all of this intermediate REE product to Neo’s Silmet separation facility in Europe and potentially to other REE separation facilities outside the U.S. To the extent not sold, the Company expects to stockpile mixed REE carbonate at the Mill for future separation and other downstream REE processing at the Mill or elsewhere.

The Company also continues to pursue new sources of revenue, including additional alternate feed materials and other sources of feed for the White Mesa Mill.

About Energy Fuels: Energy Fuels is a leading U.S.-based uranium mining company, supplying U3O8 to major nuclear utilities. The Company also produces vanadium from certain of its projects, as market conditions warrant, and expects to commence commercial production of REE carbonate in 2021. Its corporate offices are in Lakewood, Colorado near Denver, and all of its assets and employees are in the United States. Energy Fuels holds three of America’s key uranium production centers: the White Mesa Mill in Utah, the Nichols Ranch in-situ recovery (“ISR”) Project in Wyoming, and the Alta Mesa ISR Project in Texas. The White Mesa Mill is the only conventional uranium mill operating in the U.S. today, has a licensed capacity of over 8 million pounds of U3O8 per year, and has the ability to produce vanadium when market conditions warrant, as well as REE carbonate from various uranium-bearing ores. The Nichols Ranch ISR Project is currently on standby and has a licensed capacity of 2 million pounds of U3O8 per year. The Alta Mesa ISR Project is also currently on standby. In addition to the above production facilities, Energy Fuels also has one of the largest NI 43-101 compliant uranium resource portfolios in the U.S. and several uranium and uranium/vanadium mining projects on standby and in various stages of permitting and development. The primary trading market for Energy Fuels’ common shares is the NYSE American under the trading symbol “UUUU,” and the Company’s common shares are also listed on the Toronto Stock Exchange under the trading symbol “EFR.” Energy Fuels’ website is www.energyfuels.com.

Cautionary Note Regarding Forward-Looking Statements: This news release contains certain “Forward Looking Information” and “Forward Looking Statements” within the meaning of applicable United States and Canadian securities legislation, which may include, but are not limited to, statements with respect to: production and sales forecasts; costs of production; any expectation that the Company will continue to be ready to supply uranium into the proposed U.S. Uranium Reserve once it is established; scalability, and the Company’s ability and readiness to re-start, expand or deploy any of its existing projects or capacity to respond to any improvements in uranium market conditions or in response to the proposed Uranium Reserve; any expectation regarding any remaining dissolved vanadium in the White Mesa Mill’s tailings facility solutions; the ability of the Company to secure any new sources of alternate feed materials or other processing opportunities at the White Mesa Mill; expected timelines for the permitting and development of projects; the Company’s expectations as to longer term fundamentals in the market and price projections; any expectation that the Company will maintain its position as a leading uranium company in the United States; any expectation that the proposed Uranium Reserve will be implemented and if implemented the manner in which it will be implemented and the timing of implementation; any expectation with respect to timelines to production; any expectation that the White Mesa Mill will be successful in producing REE Carbonate on a commercial basis; any expectation that Neo will be successful in separating the White Mesa Mill’s REE Carbonate on a commercial basis; any expectation that Energy Fuels will be successful in developing U.S. separation, or other value-added U.S. REE production capabilities at the White Mesa Mill, or otherwise; any expectation that the Company and Neo will be successful in jointly developing a fully integrated U.S.-European REE supply chain; any expectation that the Company will be successful in building fully integrated U.S REE production capabilities in the future; any expectation with respect to the future demand for REEs; any expectation with respect to the quantities of monazite ore to be acquired by Energy Fuels, the quantities of REE Carbonate to be produced by the White Mesa Mill or the quantities of contained TREO in the Mill’s REE carbonate; any expectation that Neo and Energy Fuels will be successful in completing definitive agreements and hence proceeding with their agreement in principle; any expectation that the Company will enter into definitive agreements with Hyperion Metals Limited for the potential future supply of natural monazite sands from the Titan heavy mineral sand project, or that the Titan project will commence production and be capable of supplying monazite sands to the Company; any expectation as to the results of the feasibility study on the production of REE products from natural coal-based resources, or that the work to be performed in connection with the feasibility study will complement the Company’s work to develop rare earth separation capabilities at the White Mesa Mill; any expectation that the Company has distinct advantages in the rare earth sector or that the Company’s REE initiative will be a highly capital efficient initiative; any expectation that the Company will be successful in transforming itself into America’s Critical Mineral Hub; any expectation as to the outcome of President Biden’s actions to address climate change and support nuclear energy, or their impacts on the Company, if any; any expectation that global policies will support nuclear power to achieve carbon reduction goals; any expectation that a robust market for responsibly-produced, American clean energy products and technologies, made by American workers, is possible in the U.S.; and any expectation that the Company will successfully sell certain of its non-core properties on acceptable terms or at all. Generally, these forward-looking statements can be identified by the use of forward-looking terminology such as “plans,” “expects,” “does not expect,” “is expected,” “is likely,” “budgets,” “scheduled,” “estimates,” “forecasts,” “intends,” “anticipates,” “does not anticipate,” or “believes,” or variations of such words and phrases, or state that certain actions, events or results “may,” “could,” “would,” “might” or “will be taken,” “occur,” “be achieved” or “have the potential to.” All statements, other than statements of historical fact, herein are considered to be forward-looking statements. Forward-looking statements involve known and unknown risks, uncertainties and other factors which may cause the actual results, performance or achievements of the Company to be materially different from any future results, performance or achievements express or implied by the forward-looking statements. Factors that could cause actual results to differ materially from those anticipated in these forward-looking statements include risks associated with: commodity prices and price fluctuations; processing and mining difficulties, upsets and delays; permitting and licensing requirements and delays; changes to regulatory requirements; legal challenges; the availability of sources of alternate feed materials and other feed sources for the White Mesa Mill; competition from other producers; public opinion; government and political actions; the appropriations for the proposed Uranium Reserve not being allocated to that program and the Uranium Reserve not being implemented; the manner in which the proposed Uranium Reserve, if established, will be implemented; the Company not being successful in selling any uranium into the proposed Uranium Reserve at acceptable quantities or prices, or at all; available supplies of monazite sands; the ability of the White Mesa Mill to produce REE Carbonate to meet commercial specifications on a commercial scale at acceptable costs; the ability of Neo to separate the REE Carbonate produced by the White Mesa Mill to meet commercial specifications on a commercial scale at acceptable costs; market factors, including future demand for REEs; the ability of Neo and Energy Fuels to finalize definitive agreements; and the other factors described under the caption “Risk Factors” in the Company’s most recently filed Annual Report on Form 10-K, which is available for review on EDGAR at www.sec.gov/edgar.shtml, on SEDAR at www.sedar.com, and on the Company’s website at www.energyfuels.com. Forward-looking statements contained herein are made as of the date of this news release, and the Company disclaims, other than as required by law, any obligation to update any forward-looking statements whether as a result of new information, results, future events, circumstances, or if management’s estimates or opinions should change, or otherwise. There can be no assurance that forward-looking statements will prove to be accurate, as actual results and future events could differ materially from those anticipated in such statements. Accordingly, the reader is cautioned not to place undue reliance on forward-looking statements. The Company assumes no obligation to update the information in this communication, except as otherwise required by law.

SOURCE Energy Fuels Inc.

For further information: Investor Inquiries: Energy Fuels Inc., Curtis Moore, VP – Marketing and Corporate Development, (303) 974-2140 or Toll free: (888) 864-2125, investorinfo@energyfuels.com, www.energyfuels.com

Release – Ayala Pharmaceuticals (AYLA) – Reports First Quarter 2021 Financial Results and Provides Business Update


Ayala Pharmaceuticals Reports First Quarter 2021 Financial Results and Provides Business Update


        – First Patient Dosed in Phase 1 AL102 Combination Trial with Novartis’ Anti-BCMA Agent for the Treatment of Multiple Myeloma –

– On Track to Initiate AL102 Phase 2/3 Pivotal Trial for the Treatment of Desmoid Tumors in 1H21-

– Multiple Near-Term Milestones Expected Across Clinical-Stage Pipeline –

REHOVOT, Israel and WILMINGTON, Del., May 14, 2021 (GLOBE NEWSWIRE) — Ayala Pharmaceuticals, Inc. (Nasdaq: AYLA), a clinical-stage oncology company focused on developing and commercializing small molecule therapeutics for patients suffering from rare and aggressive cancers, primarily in genetically defined patient populations, today reported financial results for the first quarter ended March 31, 2021 and highlighted recent progress and upcoming milestones for its pipeline programs.

“Continuing on the strong momentum set in 2020, we are pleased with our progress through the first quarter of 2021. With a strengthened balance sheet and extended cash runway into 2023, we are well positioned to further progress our innovative pipeline of assets targeting the inhibition of gamma secretase through key pathways implicated in rare and aggressive cancers, including adenoid cystic carcinoma, multiple myeloma, triple negative breast cancer and desmoid tumors,” said Roni Mamluk, Ph.D., Chief Executive Officer of Ayala. “We have made great strides to advance our pipeline programs in 2021 with the first patients dosed in both the Phase 2 TENACITY trial in triple negative breast cancer and the Phase 1 combination trial with Novartis in multiple myeloma. We also remain on track to report additional data from the 6mg cohort of our Phase 2 ACCURACY trial of AL101 for the treatment of adenoid cystic carcinoma in the second half of this year.”

Recent Business Highlights and Upcoming Milestones:

  • First Patient was dosed in Phase 1 Clinical Trial of AL102 in Combination with Novartis’ BCMA Targeting Agent, WVT087 for the Treatment of Relapsed/Refractory Multiple Myeloma: In April 2021, Ayala announced that the first patient was dosed in its Phase 1 combination trial of AL102 with Novartis’ investigational anti-B-cell maturation antigen (BCMA) agent, WVT078, for the treatment of relapsed and/or refractory multiple myeloma (MM).

  • Completed $25 million Strategic Financing: In February 2021, Ayala announced a $25 million strategic financing with investors including Redmile Group and SIO Capital Management, extending its cash runway into 2023.

  • Phase 2 TENACITY Clinical Trial Continues to Progress: In January 2021, Ayala announced the dosing of the first patient in the Phase 2 TENACITY clinical trial of its potent, selective small molecule, AL101, for the treatment of patients with Notch-activated recurrent or metastatic (R/M) triple negative breast cancer (TNBC). Ayala expects to report preliminary data from this ongoing trial by the end of 2021.

  • Accelerated Development of AL102 for the Treatment of Desmoid Tumors with Pivotal Trial; First site opened in the US for the Phase 2/3 RINGSIDE Trial: In January 2021, Ayala announced that based on its end-of-Phase 1 meeting with the U.S. Food and Drug Administration (FDA) on AL102 for the treatment of desmoid tumors, and data from AL101 and AL102 Phase 1 studies including durable responses observed in patients with desmoid tumors, the FDA agreed to advance the program into a Phase 2/3 pivotal trial. Ayala expects to initiate the pivotal RINGSIDE clinical trial of AL102 in adult and adolescent patients with desmoid tumors in the first half of 2021. Ayala expects an initial interim data read-out from part A of the study and dose selection by mid-2022 with part B of the study commencing immediately thereafter.
  • On Track to Report Additional ACCURACY Phase 2 Data; Patient Enrollment in 6mg Cohort of Phase 2 ACCURACY Study Ongoing: Ayala continues to enroll patients in the 6mg cohort of the Phase 2 ACCURACY study of AL101 for the treatment of recurrent/metastatic adenoid cystic carcinoma (R/M ACC), which will include up to 42 subjects. Further trial progress updates, including additional data, are expected in the second half of 2021.

First Quarter 2021 Financial Results

  • Cash Position: Cash and cash equivalents totaled $56.0 million as of March 31, 2021.
  • Collaboration Revenue: Collaboration revenue was $1.0 million for the first quarter of 2021 and 2020.
  • R&D Expenses: Research and development expenses were $6.9 million for the first quarter of 2021, compared to $5.1 million for the same period in 2020. The increase was primarily driven by additional costs in connection with the advancement of the Desmoids, TNBC and ACC clinical trials.
  • G&A Expenses: General and administrative expenses were $2.3 million for the first quarter of 2021, compared to $1.3 million for the same period in 2020. This increase was primarily due to higher expenses in connection with becoming a public company, including director and officers insurance and stock-based compensation.
  • Net Loss: Net loss was $9.6 million for the first quarter of 2021, resulting in a basic and diluted net loss per share of $0.74. Net loss was $6.6 million for the same period in 2020, resulting in a basic and diluted net loss per share of $1.32.

Financial Guidance

Ayala expects its existing cash balance to fund operating expenses and capital expenditure requirements through multiple potential key clinical and development milestones into 2023.

About Ayala Pharmaceuticals

Ayala Pharmaceuticals, Inc. is a clinical-stage oncology company focused on developing and commercializing small molecule therapeutics for patients suffering from rare and aggressive cancers, primarily in genetically defined patient populations. Ayala’s approach is focused on predicating, identifying and addressing tumorigenic drivers of cancer through a combination of its bioinformatics platform and next-generation sequencing to deliver targeted therapies to underserved patient populations. The company has two product candidates under development, AL101 and AL102, targeting the aberrant activation of the Notch pathway with gamma secretase inhibitors to treat a variety of tumors including Adenoid Cystic Carcinoma, Triple Negative Breast Cancer (TNBC), T-cell Acute Lymphoblastic Leukemia (T-ALL), Desmoid Tumors and Multiple Myeloma (MM) (in collaboration with Novartis). AL101, has received Fast Track Designation and Orphan Drug Designation from the U.S. FDA and is currently in a Phase 2 clinical trial for patients with ACC (ACCURACY) bearing Notch activating mutations and in a Phase 2 clinical trial for patients with TNBC (TENACITY) bearing Notch activating mutations and other gene rearrangements. AL102 is currently being advanced to a Phase 2/3 clinical trials for patients with desmoid tumors (RINGSIDE) and is being evaluated in a Phase 1 clinical trial in combination with Novartis’ BMCA targeting agent, WVT078, in Patients with relapsed/refractory Multiple Myeloma. For more information, visit www.ayalapharma.com.

Contacts:

Investors:
Julie Seidel
Stern Investor Relations, Inc.
+1-212-362-1200
Julie.seidel@sternir.com

Ayala Pharmaceuticals:
+1-857-444-0553
info@ayalapharma.com

Forward-Looking Statements

This press release contains forward-looking statements within the meaning of the Private Securities Litigation Reform Act of 1995. All statements contained in this press release that do not relate to matters of historical fact should be considered forward-looking statements, including statements relating to our development of AL101 and AL102, the promise and potential impact of our preclinical or clinical trial data, the timing of and plans to initiate additional clinical trials of AL101 and AL102, upcoming milestones, including without limitation the timing and results of any clinical trials or readouts, patient enrollment and the sufficiency of cash to fund operations. These forward-looking statements are based on management’s current expectations. The words “may,” “will,” “should,” “expect,” “plan,” “anticipate,” “could,” “intend,” “target,” “project,” “estimate,” “believe,” “predict,” “potential” or “continue” or the negative of these terms or other similar expressions are intended to identify forward-looking statements, although not all forward-looking statements contain these identifying words. These statements are neither promises nor guarantees, but involve known and unknown risks, uncertainties and other important factors that may cause our actual results, performance or achievements to be materially different from any future results, performance or achievements expressed or implied by the forward-looking statements, including, but not limited to, the following: the impact of the COVID-19 pandemic on our operations, including our preclinical studies and clinical trials, and the continuity of our business; we have incurred significant losses, are not currently profitable and may never become profitable; our need for additional funding; our cash runway; our limited operating history and the prospects for our future viability; the lengthy, expensive, and uncertain process of clinical drug development, including potential delays in regulatory approval; our requirement to pay significant payments under product candidate licenses; the approach we are taking to discover and develop product candidates and whether it will lead to marketable products; the expense, time-consuming nature and uncertainty of clinical trials; enrollment and retention of patients; potential side effects of our product candidates; our ability to develop or to collaborate with others to develop appropriate diagnostic tests; protection of our proprietary technology and the confidentiality of our trade secrets; potential lawsuits for, or claims of, infringement of third-party intellectual property or challenges to the ownership of our intellectual property; risks associated with international operations; our ability to retain key personnel and to manage our growth; the potential volatility of our common stock; costs and resources of operating as a public company; unfavorable or no analyst research or reports; and securities class action litigation against us. These and other important factors discussed under the caption “Risk Factors” in our Annual Report on Form 10-K for the year ended December 31, 2020 filed with the U.S. Securities and Exchange Commission (SEC) on March 24, 2021 and our other filings with the SEC could cause actual results to differ materially from those indicated by the forward-looking statements made in this press release. Any such forward-looking statements represent management’s estimates as of the date of this press release. New risk factors and uncertainties may emerge from time to time, and it is not possible to predict all risk factors and uncertainties. While we may elect to update such forward-looking statements at some point in the future, except as required by law, we disclaim any obligation to do so, even if subsequent events cause our views to change. Although we believe the expectations reflected in such forward-looking statements are reasonable, we can give no assurance that such expectations will prove to be correct. These forward-looking statements should not be relied upon as representing our views as of any date subsequent to the date of this press release.

 
AYALA PHARMACEUTICALS, INC.
CONDENSED CONSOLIDATED BALANCE SHEETS
(In thousands, except share and per share amounts)
 
  March 31,
  December 31
   2021    2020  
  (Unaudited)        
CURRENT ASSETS:            
Cash and Cash Equivalents $ 56,030   $ 42,025  
Short-term Restricted Bank Deposits   117     90  
Trade Receivables   169     681  
Prepaid Expenses and other Current Assets   1,534     1,444  
Total Current Assets   57,850     44,240  
LONG-TERM ASSETS:            
Other Assets $ 264   $ 305  
Property and Equipment, Net   1,119     1,283  
Total Long-Term Assets   1,383     1,588  
Total Assets $ 59,233   $ 45,828  
LIABILITIES, CONVERTIBLE PREFERRED STOCK, AND STOCKHOLDERS’ EQUITY:            
CURRENT LIABILITIES:            
Trade Payables $ 3,004   $ 3,726  
Other Accounts Payables   2,690     3,151  
Total Current Liabilities   5,694     6,877  
LONG TERM LIABILITIES:            
Long-term Rent Liability   505     553  
Total Long-Term Liabilities $ 505   $ 553  
STOCKHOLDERS’ DEFICIT:            
Common Stock of $0.01 par value per share; 200,000,000 shares authorized at March 31, 2021 and December 31,            
2020; 13,240,961 and 12,824,463 shares issued at March 31, 2021 and, respectively December 31, 2020;            
13,072,213 and 12,728,446 shares outstanding at March 31, 2021 and December 31, 2020, respectively $ 131   $ 128  
Additional Paid-in Capital   133,358     109,157  
Accumulated Deficit   (80,455 )   (70,887 )
Total Stockholders’ Equity   53,034     38,398  
Total Liabilities, Convertible Preferred Stock, and Stockholders’ Equity $ 59,233   $ 45,828  


AYALA PHARMACEUTICALS, INC.
CONDENSED CONSOLIDATED STATEMENTS OF OPERATIONS
(Unaudited)
(In thousands, except share & per share amounts)
 
    For the Three Months Ended
    March 31,
    2021       2020  
Revenues from licensing agreement $ 974     $ 1,001  
Cost of Revenues   (974 )     (1,001 )
Gross profit          
Operating expenses:              
Research and development   6,925       5,128  
General and administrative   2,303       1,311  
Operating loss   (9,228 )     (6,439 )
Financial loss, net   (92 )     (38 )
Loss before income tax   (9,320 )     (6,477 )
Taxes on income   (248 )     (121 )
Net loss attributable to common stockholders   (9,568 )     (6,598 )
Net Loss per share attributable to common stockholders, basic and diluted $ (0.74 )   $ (1.32 )
Weighted average common shares outstanding, basic and diluted   12,888,340       4,999,563  
           

Pros and Cons of FDA Funded in Part by Companies


image credit: Alan Kotov (flickr.com)


Pros and Cons of FDA Partly Funded by the Companies it Oversees


The Food and Drug Administration has moved from an entirely taxpayer-funded entity to one increasingly funded by user fees paid by manufacturers that are being regulated. Today, close to 45% of its budget comes from these user fees that companies pay when they apply for approval of a medical device or drug.


Positive and Negative Impact

As a pharmacist and medication and dietary supplement safety researcher, I understand the vital role that the FDA plays in ensuring the safety of medications and medical devices.

But I, along with many others, now wonder: Was this move a clever win-win for the manufacturers and the public, or did it place patient safety second to corporate profitability? It is critical that the U.S. public understand the positive and negative ramifications so the nation can strike the right balance.

Americans in the early 20th century were outraged when they found out that manufacturers used poor-quality methods for producing food and medication, and used unsafe, ineffective, and undisclosed addictive ingredients in medications. The resulting Food, Drug, and Cosmetic Act of 1938 gave the taxpayer-funded Food and Drug Administration new authority to protect the U.S. consumer.

One of the FDA’s most shining successes occurred in the late 1950s when the agency refused to approve thalidomide. By 1960, 46 countries allowed pregnant women to use thalidomide to treat morning sickness, but the FDA refused on the grounds that the studies were insufficient to demonstrate safety. Debilitating birth defects resulting from thalidomide arose in Europe and elsewhere in 1961. President John F. Kennedy heralded the FDA in 1962 for its stance. An FDA driven by the data – and not corporate pressure – prevented a major tragedy.


How AIDS Changed How the FDA is Funded

The FDA continued its work fully funded by U.S. taxpayers for many years until this model was upended by a new infectious disease. The first U.S. case of HIV-induced AIDS occurred in 1981. It was rapidly spreading, with devastating complications like blindness, dementia, severe respiratory diseases, and rare cancers. Well-known sports stars and celebrities died of AIDS-related complications. AIDS activists were incensed about long delays in getting experimental HIV drugs studied and approved by the FDA.

In 1992, in response to intense pressure, Congress passed the Prescription Drug User Fee Act. It was signed into law by President George H.W. Bush.

With the act, the FDA moved from a fully taxpayer-funded entity to one funded through tax dollars and new prescription drug user fees. Manufacturers pay these fees when submitting applications to the FDA for drug review and annual user fees based on the number of approved drugs they have on the market. However, it is a complex formula with waivers, refunds and exemptions based on the category of drugs being approved and the total number of drugs in manufacturers’ portfolios.

Over time, other user fees for generic, over-the-counter, biosimilar, animal, and animal generic drugs, as well as for medical devices, were created. As time passed, the FDA’s funding has increasingly come from the industries that it regulates. Of the FDA’s total US$5.9 billion budget, 45% comes from user fees, but 65% of the funding for human drug regulatory activities are derived from user fees. These user fee programs must be reauthorized every five years by Congress, and the current agreement remains in effect through September 2022.


Have User Fees Worked?

The FDA and the drug or device manufacturers negotiate the user fees. They also negotiate performance measures that the FDA has to meet to collect them and proposed changes in FDA processes. Performance measures include things such as how quickly the FDA responds to meeting requests, how quickly it generates correspondence, and how long it takes from submission of a new drug application until the FDA approves or refuses to approve a drug or product.

Because of the additional funding generated by user fees and performance measures that the FDA has to meet, the FDA is quicker and more willing to discuss what it wants to see in an application with manufacturers. It also offers clearer guidance for manufacturers. In 1987, it took 29 months from the time a new drug application was filed by the manufacturer for the FDA to decide whether to approve a medication in the U.S. In 2014, it only took 13 months and by 2018, it was down to 10 months.

Changes in more recent years have also increased the number of standard new drug applications approved the first time around by the FDA from 38% in 2005 to 61% in 2018. In diseases where there are not many medication options for patients, the FDA has a priority review process, where 89% of new drug applications were approved the first time around and the approvals were completed in eight months in 2018. All this occurred while the number of new drug applications have been increasing over time.

Most recently, the COVID-19 pandemic has seen the FDA provide emergency use authorization for potential treatments in a matter of weeks, not months. The infrastructure and capacity to review the available information so rapidly is due in large part to the funding from user fees.


While the number and speed of drug approvals have been increasing over time, so have the number of drugs that end up having serious safety issues coming to light after FDA approval. In one assessment, investigators looked at the number of newly approved medications that were subsequently removed from the market or had to include a new black box warning over 16 years from the year of approval. These black box warnings are the highest level of safety alert that the FDA can employ, warning users that a very serious adverse event could occur.

Before the user fee act was approved, 21% of medications were removed or had new black box warnings as compared to 27% afterward.

Some potential reasons that more adverse effects are coming to light after drug approval include senior FDA officials overturning scientist recommendations, a lower burden of proof for medication approval, and more clinical data in new drug applications coming from foreign clinical trial sites that require additional time to assess in an environment where regulators are rushing to meet tight deadlines.


Lack of Money Limits FDA

User fees are a viable way to shift some of the financial burden to manufacturers who stand to make money from the approval and sale of drugs in the lucrative U.S. market. Successes have occurred and provided U.S. citizens with medication more quickly than before.

However, without careful consideration of what is being negotiated, the FDA can become weak and ineffective, unable to protect its citizens from the next thalidomide. There are some signs that the pendulum may be swinging too far in the direction of the manufacturers. Additionally, while drug approval functions at the FDA are well funded, the FDA is insufficiently funded to protect consumers from other issues such as counterfeit drugs and dietary supplements because they cannot collect user fees to do so. In my view, these functions need to be identified and require additional taxpayer funding.


This article was republished
with permission from 
The
Conversation
,
 a news site dedicated to sharing ideas from academic
experts.  Written by ,
C. Michael White  Distinguished Professor and Head of the
Department of Pharmacy Practice, University of Connecticut.


Suggested Content:

PDS Biotechnology Corporation – C-Suite Interview (Video)

Ayala Pharmaceuticals Virtual Roadshow Replay (Video)


STEM Holdings – C-Suite Interview (Video)

Medicine Man Technologies – C-Suite Interview (Video)


Stay up to date. Follow us:


Stay up to date. Follow us:

One Stop Systems Inc. (OSS) – Runway Prepped for Exciting Growth Raising Rating and PT

Friday, May 14, 2021

One Stop Systems Inc. (OSS)
Runway Prepped for Exciting Growth; Raising Rating and PT

One Stop Systems Inc is US-based company which is principally engaged in designing, manufacturing, marketing high-end systems for high performance computing (HPC) applications. The company offers custom servers, compute accelerators, solid-state storage arrays and system expansion systems. The product line of the company includes GPU Appliances, GPU Expansion, GPUs and co-processors, Flash storage arrays, Flash storage expansion, Servers, Disk Arrays, Desktop computing appliances, accessories and parts. The company delivers high-end technology to customers through the sale of equipment and software for use on their premises or through remote cloud access to secure data centres housing technology.

Joe Gomes, Senior Research Analyst, Noble Capital Markets, Inc.

Refer to the full report for the price target, fundamental analysis, and rating.

    Raising Rating and PT. Given the sell off in the shares, we believe OSS presents investors with a favorable risk/reward, especially in light of the Company’s exciting growth potential, in our view. We are raising our rating and instituting a new 12-month price target. At our PT OSS shares would trade at 2.0x on a EV/estimated 2021 revenue.

    1Q21 Results.  Revenue of $13.3 million almost equaled the record $13.4 million generated in the first quarter of 2020, a non-COVID impacted quarter. OSS reported breakeven EPS for the quarter, compared to an EPS loss of $0.07 last year. Adjusted EPS was $0.03 in 1Q21 versus a loss of $0.04 in 1Q20. We had projected revenue of $13 million and a net loss of $0.03 per share …


This Company Sponsored Research is provided by Noble Capital Markets, Inc., a FINRA and S.E.C. registered broker-dealer (B/D).

*Analyst certification and important disclosures included in the full report. NOTE: investment decisions should not be based upon the content of this research summary.  Proper due diligence is required before making any investment decision. 

Kelly Services Inc. (KELYA) – Improving Operating Environment Raising PT

Friday, May 14, 2021

Kelly Services Inc. (KELYA)

Improving Operating Environment; Raising PT

Kelly Services Inc is a provider of workforce solutions and consulting and staffing services. The company’s operations are divided into three business segments namely Americas Staffing, Global Talent Solutions (“GTS”) and International Staffing. It provides staffing solutions through its branch networks in Americas and International operations and also provides a suite of innovative talent fulfilment and outcome-based solutions through GTS segment. Americas Staffing generates maximum revenue from its operations.

Joe Gomes, Senior Research Analyst, Noble Capital Markets, Inc.

Refer to the full report for the price target, fundamental analysis, and rating.

    1Q21. Revenue of $1.21 billion was down 4.4% year-over-year as the impact from COVID continued to moderate. Kelly reported operating earnings of $10.6 million compared to a loss in 1Q20 which was impacted by a goodwill impairment charges and a gain on the sale of assets. GAAP EPS for 1Q21 was $0.64 compared to an EPS loss of $3.91 in 1Q20. Adjusted EPS for the first quarter was $0.12 versus $0.20 last year. We had projected revenue of $1.18 billion and adjusted EPS of $0.16.

    Improving Demand.  Kelly saw strong demand across all of its operating segments in the quarter. OCG reported positive 9.5% revenue growth in the quarter and the SET, Education, and International segments all reported sequential revenue improvement. P&I is seeing improved revenue growth rates …


This Company Sponsored Research is provided by Noble Capital Markets, Inc., a FINRA and S.E.C. registered broker-dealer (B/D).

*Analyst certification and important disclosures included in the full report. NOTE: investment decisions should not be based upon the content of this research summary.  Proper due diligence is required before making any investment decision. 

Great Lakes Dredge and Dock (GLDD) – New Awards Out and Stellar Execution on Debt Refinancing

Friday, May 14, 2021

Great Lakes Dredge & Dock (GLDD)
New Awards Out and Stellar Execution on Debt Refinancing

Great Lakes Dredge & Dock Corp is a provider of dredging services in the United States. The company only’s operating segments is Dredging. Dredging involves the enhancement or preservation of navigability of waterways or the protection of shorelines through the removal or replenishment of soil, sand or rock. Its projects portfolio includes Coastal Restoration, Coastal Protection, Port expansion, and others.

Poe Fratt, Senior Research Analyst, Noble Capital Markets, Inc.

Refer to the full report for the price target, fundamental analysis, and rating.

    Dredging awards of $112.8 million announced. Awards include capital projects of $86.3 million, coastal protection of $15.6 million and maintenance of $10.9 million. The two capital projects are Mobile Harbor Phase 3 for $53.9 million and Golden Triangle Marsh Creation Project for $32.4 million. The coastal protection work is beach renourishment on Captiva Island for $15.6 million. The maintenance work is the Vicinity of McKellar Lake Harbor Project for $7.6 million and in Jacksonville Harbor for $3.3 million.

    A loss by a slight margin in Louisiana.  Bids were opened by the Coastal Protection & Restoration Authority (CPRA) on Wednesday for the Lake Borgne Marsh Creation Project (PO-0180) in Louisiana. Mike Hooks was the apparent low bidder at $60.7 million, with GLDD closely behind at $63.7 million. Among the seven bids, the highest bid was $102.0 million, and the low bid was below the designer’s estimate …


This Company Sponsored Research is provided by Noble Capital Markets, Inc., a FINRA and S.E.C. registered broker-dealer (B/D).

*Analyst certification and important disclosures included in the full report. NOTE: investment decisions should not be based upon the content of this research summary.  Proper due diligence is required before making any investment decision.