Release – Travelzoo (TZOO) – Reports First Quarter 2021 Results


Travelzoo Reports First Quarter 2021 Results


NEW YORK
April 22, 2021 (GLOBE NEWSWIRE) — Travelzoo® (NASDAQ: TZOO):

  • Consolidated revenue of 
    $14.3 million, down 30% year-over-year and up 14% quarter-over-quarter
  • Non-GAAP consolidated operating profit of 
    $0.6 million
  • Earnings per share (EPS) of (
    $0.14) attributable to 
    Travelzoo from continuing operations
  • Cash flow from operations of 
    $11.9 million

Travelzoo, a global Internet media company that publishes exclusive offers and experiences for members, today announced financial results for the first quarter ended 
March 31, 2021. Consolidated revenue was 
$14.3 million, down 30% from 
$20.3 million year-over-year and up 14% from 
$12.5 million in the prior quarter. Reported revenue excludes revenue from discontinued operations in 
Asia Pacific
Travelzoo’s reported revenue consists of advertising revenues and commissions, derived from and generated in connection with purchases made by 
Travelzoo members.

The reported net loss attributable to 
Travelzoo from continuing operations was 
$1.6 million for Q1 2021. At the consolidated level, including minority interests, the reported net loss from continuing operations was 
$1.7 million. EPS from continuing operations was (
$0.14), compared to (
$0.32) in the prior-year period.

Non-GAAP operating profit was 
$0.6 million. The calculation of non-GAAP operating profit excludes amortization of intangibles (
$0.3 million), stock option expenses (
$0.9 million), and severance-related expenses (
$0.2 million). See section “Non-GAAP Financial Measures” below.

“We see continued improvement in our business. 
Travelzoo is loved by travel enthusiasts who look for quality offers. 
Travelzoo members are affluent, active, and open for new experiences. 75% say 
Travelzoo influences their travel destinations because they trust 
Travelzoo. We believe that trust is becoming an important competitive advantage for Travelzoo,” said  Holger Bartel, Global CEO.

Cash Position
As of 
March 31, 2021, consolidated cash, cash equivalents and restricted cash were 
$72.0 million. Cash flow from operations was 
$11.9 million. There were no significant capital expenditures.

Reserve
Reported revenues include a reserve of 
$4.0 million related to commissions to be earned from vouchers sold. The reserve is booked as contra revenue. For Q1 2021, an adjustment to the reserve reduced reported revenue by 
$56,000.

Travelzoo North America

North America business segment revenue decreased 23% year-over-year to 
$9.8 million. Operating profit for Q1 2021 was 
$39,000, or 0.4% of revenue, compared to an operating loss of 
$976,000 in the prior-year period.

Travelzoo Europe

Europe business segment revenue decreased 48% year-over-year to 
$3.6 million. Operating loss for Q1 2021 was 
$696,000, compared to an operating loss of 
$1.3 million in the prior-year period.

Jack’s Flight Club 
On 
January 13, 2020
Travelzoo acquired 60% of Jack’s 
Flight Club, a membership subscription service. Jack’s 
Flight Club revenue increased 30% year-over-year to 
$887,000. Operating loss for Q1 2021 was 
$110,000, compared to an operating loss of 
$3.0 million in the prior-year period. After consolidation with 
Travelzoo, Jack’s 
Flight Club’s net loss was 
$121,000, with 
$73,000 attributable to 
Travelzoo as a result of recording 
$284,000 of amortization of intangible assets related to the acquisition.

Licensing
In 
June 2020
Travelzoo sold its subsidiary in 
Japan, Travelzoo Japan K.K., to Mr.  Hajime Suzuki. In connection with the sale, 
Travelzoo and Travelzoo Japan K.K. entered into a royalty-bearing licensing agreement for the exclusive use of 
Travelzoo members in 
Japan. In 
August 2020
Travelzoo sold its 
Singapore subsidiary to Mr.  Julian Rembrandt and entered into a royalty-bearing licensing agreement for, among other things, the exclusive use of 
Travelzoo’s members in 
Australia
New Zealand, and 
Singapore. Under the licensing agreements, 
Travelzoo’s existing members in 
Australia
Japan
New Zealand, and 
Singapore will continue to be owned by 
Travelzoo as the licensor. Licensing revenue is booked with a lag of one quarter. Licensing revenue from 
Japan of 
$9,000 generated in Q4 2020 was recognized in Q1 2021.

Members and Subscribers
As of 
March 31, 2021, we had 31.8 million members worldwide. In 
North America, the unduplicated number of 
Travelzoo members was 18.1 million as of 
March 31, 2021, up 7% from 
March 31, 2020. In 
Europe, the unduplicated number of 
Travelzoo members was 8.6 million as of 
March 31, 2021, down 6% from 
March 31, 2020. On 
March 15, 2021
Travelzoo added more than 2 million new members in the 
U.S. in connection with a direct competitor from 
Europe exiting the U.S. market. Jack’s 
Flight Club had 1.6 million subscribers as of 
March 31, 2021, down from 1.7 million subscribers as of 
March 31, 2020.

Discontinued Operations
As announced in a press release on 
March 10, 2020
Travelzoo decided to exit its 
Asia Pacific business which in 2019 reduced EPS by 
$0.60. The 
Asia Pacific business has been classified as discontinued operations since 
March 31, 2020. Prior periods have been reclassified to conform with the current presentation. Certain reclassifications have been made for current and prior periods between the continued operations and the discontinued operations in accordance with 
U.S. GAAP.

Income Taxes
Income tax expense was 
$742,000 in Q1 2021, compared to an income tax benefit of 
$517,000 in the prior-year period.

Non-GAAP Financial Measures
Management calculates non-GAAP operating income when evaluating the financial performance of the business. Travelzoo’s calculation of non-GAAP operating income, also called “non-GAAP operating profit” in this press release and today’s earnings conference call, excludes the following items: impairment of intangibles and goodwill, amortization of intangibles, stock option expenses, and severance-related expenses. This press release includes a table which reconciles GAAP operating income to the calculation of non-GAAP operating income. Non-GAAP operating income is not required by, or presented in accordance with, generally accepted accounting principles in 
the United States of America (“GAAP”). This information should be considered as supplemental in nature and should not be considered in isolation or as a substitute for the financial information prepared in accordance with GAAP. In addition, these non-GAAP financial measures may not be the same as similarly titled measures reported by other companies.

Looking Ahead
We currently expect for Q2 2021 to report significantly higher revenue and profitability. We see a trend of recovery of our revenue. We have been able to reduce our operating expenses, and we believe we can contain many of the lower costs in the foreseeable future.

Conference Call

Travelzoo will host a conference call to discuss first quarter results today at 
11:00 a.m. ET. Please visit http://ir.travelzoo.com/events-presentations to download the management presentation (PDF format) to be discussed in the conference call; and access the webcast.

About Travelzoo

Travelzoo® provides our 30 million members insider deals and one-of-a-kind experiences personally reviewed by one of our deal experts around the globe. We have our finger on the pulse of outstanding travel, entertainment, and lifestyle experiences. For over 20 years we have worked in partnership with more than 5,000 top travel suppliers—our long-standing relationships give 
Travelzoo members access to irresistible deals.

Certain statements contained in this press release that are not historical facts may be forward-looking statements within the meaning of Section 27A of the Securities Act of 1933 and Section 21E of the Securities and Exchange Act of 1934. These forward-looking statements may include, but are not limited to, statements about our plans, objectives, expectations, prospects and intentions, markets in which we participate and other statements contained in this press release that are not historical facts. When used in this press release, the words “expect”, “predict”, “project”, “anticipate”, “believe”, “estimate”, “intend”, “plan”, “seek” and similar expressions are generally intended to identify forward-looking statements. Because these forward-looking statements involve risks and uncertainties, there are important factors that could cause actual results to differ materially from those expressed or implied by these forward-looking statements, including changes in our plans, objectives, expectations, prospects and intentions and other factors discussed in our filings with the 
SEC. We cannot guarantee any future levels of activity, performance or achievements. 
Travelzoo undertakes no obligation to update forward-looking statements to reflect events or circumstances occurring after the date of this press release.

Travelzoo, Top 20, and 
Jack’s Flight Club are registered trademarks of 
Travelzoo.

 
Travelzoo
Condensed Consolidated Statements of Operations
(Unaudited)
(In thousands, except per share amounts)
   
  Three months ended
  March 31,
  2021   2020
Revenues $ 14,284     $ 20,327  
Cost of revenues 3,018     2,703  
Gross profit 11,266     17,624  
Operating expenses:      
Sales and marketing 6,790     13,094  
Product development 683     1,428  
General and administrative 4,560     5,522  
Impairment of intangible asset and goodwill     2,920  
Total operating expenses 12,033     22,964  
Operating loss (767 )   (5,340 )
Other income (loss), net (166 )   (6 )
Loss from continuing operations before income taxes (933 )   (5,346 )
Income tax expense (benefit) 742     (517 )
Loss from continuing operations (1,675 )   (4,829 )
Loss from discontinued operations, net of tax (15 )   (2,919 )
Net loss (1,690 )   (7,748 )
Net loss attributable to non-controlling interest (48 )   (1,139 )
Net loss attributable to 
Travelzoo
$ (1,642 )   $ (6,609 )
       
Net loss attributable to Travelzoo—continuing operations $ (1,627 )   $ (3,690 )
Net loss attributable to Travelzoo—discontinued operations $ (15 )   $ (2,919 )
       
Loss per share—basic      
Continuing operations $ (0.14 )   $ (0.32 )
Discontinued operations $     $ (0.26 )
Net loss per share —basic $ (0.14 )   $ (0.58 )
       
Loss per share—diluted      
Continuing operations $ (0.14 )   $ (0.32 )
Discontinued operations $     $ (0.26 )
Net loss per share—diluted $ (0.14 )   $ (0.58 )
Shares used in per share calculation from continuing operations—basic 11,391     11,439  
Shares used in per share calculation from discontinued operations—basic 11,391     11,439  
Shares used in per share calculation from continuing operations—diluted 11,391     11,439  
Shares used in per share calculation from discontinued operations—diluted 11,391     11,439  


Travelzoo
Condensed Consolidated Balance Sheets
(Unaudited)
(In thousands)
       
  March 31,
2021
  March 31,
2020
Assets      
Current assets:      
Cash and cash equivalents $ 70,862     $ 63,061  
Accounts receivable, net 7,293     4,519  
Prepaid income taxes 1,443     931  
Deposits 101     137  
Prepaid expenses and other 3,275     1,166  
Assets from discontinued operations 123     230  
Total current assets 83,097     70,044  
Deposits and other 1,351     745  
Deferred tax assets 4,400     5,067  
Restricted cash 1,157     1,178  
Operating lease right-of-use assets 8,474     8,541  
Property and equipment, net 1,152     1,347  
Intangible assets, net 4,250     4,534  
Goodwill 10,944     10,944  
Total assets $ 114,825     $ 102,400  
Liabilities and Stockholders’ Equity      
Current liabilities:      
Accounts payable $ 8,750     $ 6,996  
Merchant payables 70,094     57,104  
Accrued expenses and other 10,827     8,649  
Deferred revenue 2,417     2,688  
Operating lease liabilities 3,796     3,587  
PPP notes payable (current portion) 3,460     2,849  
Income tax payable 201     326  
Liabilities from discontinued operations 580     671  
Total current liabilities 100,124     82,870  
PPP notes payable 204     814  
Deferred tax liabilities 235     357  
Long-term operating lease liabilities 10,558     10,774  
Other long-term liabilities 2,027     1,085  
Total liabilities 113,148     95,900  
Non-controlling interest 4,560     4,609  
Common stock 115     114  
Treasury stock (at cost) (1,583 )    
Additional paid-in capital 4,279     6,239  
Retained earnings (accumulated deficit) (2,045 )   (403 )
Accumulated other comprehensive loss (3,649 )   (4,059 )
Total stockholders’ equity (2,883 )   1,891  
Total liabilities and stockholders’ equity $ 114,825     $ 102,400  


Travelzoo
Condensed Consolidated Statements of Cash Flows
(Unaudited)
(In thousands)
   
  Three months ended
  March 31,
  2021   2020
Cash flows from operating activities:      
Net income (loss) $ (1,690 )   $ (7,748 )
Adjustments to reconcile net income (loss) to net cash provided by (used in) operating activities:      
Depreciation and amortization 484     551  
Stock-based compensation 882     23  
Deferred income tax 541     (609 )
Impairment of intangible assets and goodwill     2,920  
Loss on long-lived assets     437  
Loss on equity investment in WeGo     195  
Net foreign currency effects (152 )   (681 )
Provision of loss on accounts receivable and other (454 )   1,441  
Changes in operating assets and liabilities, net of acquisitions:      
Accounts receivable (2,229 )   2,509  
Income tax receivable (545 )   989  
Prepaid expenses and other (2,357 )   862  
Accounts payable 1,727     547  
Merchant payables 13,212     (6,940 )
Accrued expenses and other 2,199     704  
Income tax payable (126 )   (333 )
Other liabilities 412     2,077  
Net cash provided by operating activities 11,904     (3,056 )
Cash flows from investing activities:      
Acquisition of business, net of cash acquired     (679 )
Purchases of property and equipment (7 )   (131 )
Net cash provided by (used in) investing activities (7 )   (810 )
Cash flows from financing activities:      
Repurchase of common stock (1,583 )   (1,205 )
Payment of promissory notes     (1,000 )
Proceeds from exercise of stock options, net of taxes for net share settlement (2,840 )    
Net cash used in financing activities (4,423 )   (2,205 )
Effect of exchange rate on cash, cash equivalents and restricted cash 270     (272 )
Net increase in cash, cash equivalents and restricted cash 7,744     (6,343 )
Cash, cash equivalents and restricted cash at beginning of period 64,385     20,710  
Cash, cash equivalents and restricted cash at end of period $ 72,129     $ 14,367  


Travelzoo
Segment Information from Continuing Operations
(Unaudited)
(In thousands)
                   
Three months ended
March 31, 2021
Travelzoo
North

America
  Travelzoo
Europe
  Jack’s Flight
Club
  Elimination   Consolidated
Revenue from unaffiliated customers $ 9,828     $ 3,569     $ 887     $     $ 14,284  
Intersegment revenue (9 )   9              
Total net revenues 9,819     3,578     887         14,284  
Operating income (loss) $ 39     $ (696 )   $ (110 )   $     $ (767 )
                   
Three months ended
March 31, 2020
Travelzoo
North

America
  Travelzoo
Europe
  Jack’s Flight
Club
  Elimination   Consolidated
Revenue from unaffiliated customers $ 12,549     $ 7,103     $ 683     $ (8 )   $ 20,327  
Intersegment revenue 148     (156 )       8      
Total net revenues 12,697     6,947     683         20,327  
Operating loss $ (976 )   $ (1,341 )   $ (3,015 )   $ (8 )   $ (5,340 )


Travelzoo
Reconciliation of GAAP to Non-GAAP Information
(Unaudited)
(In thousands, except per share amounts)
   
  Three months ended
March 31
  2021   2020
GAAP operating expense $ 12,033     $ 22,964  
Non-GAAP adjustments:      
Impairment of intangible and goodwill (A)     2,920  
Amortization of intangibles (B) 284     215  
Stock option expenses (C) 882     23  
Severance-related expenses (D) 223     217  
Non-GAAP operating expense 10,644     19,589  
       
GAAP operating income (loss) (767 )   (5,340 )
Non-GAAP adjustments (A through D) 1,389     3,375  
Non-GAAP operating income (loss) 622     (1,965 )
       

Investor Relations:
Almira Pusch
ir@travelzoo.com


Source: Travelzoo
Release – Ceapro Inc. (CRPOF)(CZO:CA) – Reports Fourth Quarter and Full Year 2020 Financial Results and Operational Highlights


Ceapro Inc. Reports Fourth Quarter and Full Year 2020 Financial Results and Operational Highlights


  • Maintained production operations during COVID-19 pandemic, providing customers with essential products and completing integration of manufacturing sitewhile ensuring the health and safety of employees
  • Substantially increased sales, net profits and cash generated from operations during the year 2020, representing one of Ceapro’s best performances in company history
  • R&D activities focused on advancing the development of innovative delivery systems and yeast beta glucan as a potential inhalable therapeutic for COVID-19

EDMONTON, Alberta, April 22, 2021 (GLOBE NEWSWIRE) — Ceapro Inc. (TSX-V: CZO, OTCQX: CRPOF) (“Ceapro” or the “Company”), a growth-stage biotechnology company focused on the development and commercialization of active ingredients for healthcare and cosmetic industries, today announced operational highlights and financial results for the fourth quarter and full year ended December 31, 2020.

“We could not be prouder of our resilient employees who worked tirelessly to deliver one of the best ever performances in the Company’s history during such a stressful year marked by the ongoing COVID-19 pandemic. While ensuring safety of our employees as our first priority, we were able to secure business continuity by putting more emphasis on production operations to serve our customers in the cosmetic sector. This approach, which has resulted in significant increase in sales, net profits and cash on hand, also allowed us to maintain investments in Research and Development as per our strategy to expand Ceapro’s business model from a contract manufacturer/commodity company to a high-value life science/biopharmaceutical company offering innovative products and delivery systems to the healthcare sector,” stated Gilles Gagnon, M.Sc., MBA, President and CEO, of Ceapro.

“In addition to excellent financial and operational results, main highlights of the year include the development of beta glucan from yeast and its potential as an inhalable therapeutic for COVID-19 patients as well as the development of new chemical complexes through the use of the PGX Technology. We are thrilled with the achievements made in 2020,” added Mr. Gagnon.

2020 Corporate and Operational Highlights

Pipeline Development

Oat Beta Glucan:

  • Resumed enrollment of patients for the clinical trial with beta glucan as a cholesterol reducing natural pharmaceutical product. The study will enroll approximately 264 patients. To date, two thirds of the patients have been screened and randomized.

  • Received approval from Health Canada for an amendment to the protocol to allow evaluation of subjects with confirmed pathophysiological condition of hyperlipidemia who voluntarily request to be treated with beta glucan only, without regular dosing of statins. This significant change, allowing patients to receive beta glucan as a stand-alone therapy, has accelerated patient enrollment and is expected to expand the target addressable patient population.

Avenanthramides:

  • Announced the publication of positive results from study evaluating avenanthramides in exercise-induced inflammation in the international, peer-reviewed Journal of the International Society of Sports Nutrition. Positive results support anti-inflammatory claims for avenanthramides as a nutraceutical product and pave the way for a Phase 1 clinical trial as a potential pharmaceutical product.

  • Continued to monitor stability studies for liquid avenanthramides produced at a new manufacturing site as well as for the pharmaceutical-grade dry powder formulation of avenanthramides to be used in a human Phase 1 bioavailability and safety study.

New Products:

Cannabis

  • Received approval from Health Canada Controlled Substances and Cannabis Branch for a five-year research license with medical cannabis for the formulation of unique solid cannabinoid delivery systems using PGX technology.

Yeast Beta Glucan (YBG)

  • Developed an optimal formulation of YBG coming from various sources.

  • Confirmed capability of PGX Technology to optimize and standardize the size and morphology of yeast beta-glucan (PGX-YBG) suitable for lung inhalation.

  • Achieved the first milestones in successful development of PGX-processed yeast beta glucan product as a potential inhalable therapeutic for COVID-19 and other fibrotic endpoint diseases of the lung.

  • Conducted an in-vitro study with human cell lines demonstrating that PGX-YBG obtained from different sources exhibited significant stimulatory effect on human immune response through activation of beta glucan specific Dectin 1 receptors.

  • Ongoing PGX-YBG project with McMaster University conducted in parallel for naïve and preclinical animal models. To date, no safety issues have been encountered. The preclinical phase has been extended to identify the maximum tolerated dose.

  • Conducted additional in vitro PGX-YBG dose response study to correlate with upcoming McMaster animal study results. YBG induces immunomodulation without affecting inflammation pathways. This product is poised to become a key strategic asset for the Company.

New Chemical Complexes:

  • Developed new PGX-dried chemical complexes like sodium alginate and gum arabic impregnated with co-enzyme Q10 (CoQ10). Positive results published in peer-reviewed journals demonstrate the versatility of the PGX Technology and the potential to develop significant bioactive delivery systems. Key learnings from these studies pave the way for the scale-up of the technology at the commercial level.

  • Subsequent to year-end, Ceapro announced the successful completion of a long-term research program conducted with University of Alberta. This screening program allowed Ceapro to retain the most promising products and expand the PGX-based products pipeline.

Technology:

  • Performed significant technical upgrades of PGX pilot plant in Edmonton to allow production of yeast beta glucan for a potential clinical trial with COVID-19 patients.

  • Completed a feasibility study for the commercial scale up of the PGX Technology. Several manufacturers and existing supercritical plants were contacted in 2020 for the choice of equipment and location. Given excellent results obtained with the new yeast beta glucan product, it became clear that location of the first large scale PGX unit should be close to the best source of raw material which was found in Germany where the Company also acquired pieces of equipment suitable for the assembling of such unit. Production at the retained site will be mostly for the commercialization of yeast beta glucan as an immune booster and for alginate as a carrier for other bioactives.

  • Initiated installment in Edmonton of a commercial scale unit for impregnation of bioactives with PGX-processed biopolymers.

  • Pursued research collaboration projects with University of Alberta and McMaster University for the impregnation of various bioactives using PGX-processed biopolymers as potential delivery systems for multiple applications in healthcare.

Bioprocessing Operations

  • Completed the integration of production operations under one roof in Edmonton. Ceapro’s dedicated production team successfully responded to the growing market demand for the cosmeceutical base business by producing over 250 metric tons of active ingredients in 2020, a 25% increase over the previous year.

  • Received renewal of the Site License from the Health Canada Natural Product Directorate. This License enables the Company to manufacture, package, label, release and distribute final products.

Corporate

  • Fully repaid loan with Agriculture Financial Services Corporation.

  • Announced expansion of a grant from National Research Council of Canada for the optimization and mass production of yeast beta glucan as a potential inhalable therapeutic for COVID-19 and other fibrotic end-point disease of the lung.

  • Pursued out-licensing discussions for PGX-processed new chemical complexes.

  • Secured DTC Eligibility for publicly traded shares under Ticker OTCQZ: CRPOF and to expand Company exposure to other markets with an emphasis in USA.

Financial Highlights for the Fourth Quarter and the Full Year 2020 Ended December 31, 2020

  • Total sales of $2,706,000 for the fourth quarter of 2020 and $15,121,000 for the full year of 2020 compared to $3,721,000 and $12,880,000 for the comparative periods in 2019. The 17% increase in revenue for the full year 2020 results from an 33% increase in sales of avenanthramides (mostly made to USA) partially offset by a 16% decrease in sales of beta glucan.

  • Net loss of $539,000 for the fourth quarter of 2020 and a net profit of $1,856,000 for the full year of 2020 compared to a net profit of $166,000 and a net loss of $1,133,000 for the comparative periods in 2019, a year over year improvement of $2,989,000 Third and fourth quarter 2020 were marked by the completion of the decommissioning of Leduc manufacturing site and the final integration of production operations in the Edmonton facility. These time-consuming moves resulted in some necessary adjustments in equipment at the new site. It also required additional training of relocated employees.

  • Cash generated from operations of $4,453,000, for the full year 2020 vs cash generated from operations of $882,000 for the full year 2019.

  • Positive working capital balance of $7,659,000 as of December 31, 2020.

“I strongly believe 2021 holds a lot of opportunity for Ceapro. Our focus remains on the health and safety of our associates during this COVID-19 pandemic crisis, followed by business continuity. Depending on the evolution of the COVID-19 pandemic, we expect Ceapro’s cosmeceuticals base business to continue to grow and provide positive operating cash flows to support the expansion to a new business model from a contract manufacturer to a biopharmaceutical development company involved in nutraceuticals and pharmaceuticals. Based on a very solid foundation, a highly competent team, a healthy balance sheet and a very strong technology and product portfolio with the potential to access key large markets, we have all the key components for success,” concluded Mr. Gagnon.

CEAPRO INC.    
Consolidated Balance Sheets    
     
  December 31, December 31,
  2020 2019
  $ $
     
ASSETS    
Current Assets    
Cash and cash equivalents 5,369,029 1,857,195
Trade receivables 2,019,723 3,659,541
Other receivables 102,224 46,812
Inventories (note 3) 1,210,079 669,005
Prepaid expenses and deposits 348,845 178,908
     
  9,049,900 6,411,461
Non-Current Assets    
   Investment tax credits receivable 607,700 607,700
Deposits 82,124 85,755
Licences (note 4) 18,514 21,477
Property and equipment (note 5) 18,591,189 19,764,122
Deferred tax assets (note 14 (b)) 874,304 378,643
     
  20,173,831 20,857,697
     
TOTAL ASSETS 29,223,731 27,269,158
     
LIABILITIES AND EQUITY    
Current Liabilities    
Accounts payable and accrued liabilities 1,067,622 1,291,204
Current portion of long-term debt (note 6) 111,865
Current portion of lease liabilities (note 7) 250,658 265,123
Current portion of CAAP loan (note 9) 72,263 72,942
     
  1,390,543 1,741,134
Non-Current Liabilities    
Long-term lease liabilities (note 7) 2,648,917 2,775,627
CAAP loan (note 9) 61,580
Deferred tax liabilities (note 14 (b)) 874,304 378,643
     
  3,523,221 3,215,850
     
TOTAL LIABILITIES 4,913,764 4,956,984
     
Equity    
Share capital (note 8 (b)) 16,511,067 16,401,677
Contributed surplus (note 8 (e)) 4,682,393 4,650,090
Retained earnings 3,116,507 1,260,407
     
  24,309,967 22,312,174
     
TOTAL LIABILITIES AND EQUITY 29,223,731 27,269,158


CEAPRO INC.    
Consolidated Statements of Net Income (Loss) and Comprehensive Income (Loss)
     
   
  2020   2019  
Year Ended December 31, $ $
     
Revenue (note 16) 15,121,282   12,880,006  
Cost of goods sold 7,498,996   7,434,654  
     
Gross margin 7,622,286   5,445,352  
     
Research and product development 1,881,883   2,393,607  
General and administration 3,282,754   2,952,488  
Sales and marketing 111,044   425,230  
Finance costs (note 12) 231,271   260,684  
     
Income (loss) from operations 2,115,334   (586,657 )
     
Other expenses (note 11) (259,234 ) (549,379 )
     
Income (loss) before tax 1,856,100   (1,136,036 )
     
Income taxes    
   Current tax recovery    
   Deferred tax benefit   3,408  
     
Income tax benefit   3,408  
     
Total comprehensive income (loss) for the year 1,856,100   (1,132,628 )
     
Net income (loss) per common share (note 21):    
Basic 0.02   (0.01 )
Diluted 0.02   (0.01 )
     
Weighted average number of common shares outstanding (note 21):    
Basic 77,594,629   77,188,505  
Diluted 78,143,033   77,188,505  


CEAPRO INC.    
Consolidated Statements of Cash Flows    
     
     
  2020   2019  
Year Ended December 31, $ $
OPERATING ACTIVITIES    
Net income (loss) for the year 1,856,100   (1,132,628 )
Adjustments for items not involving cash    
Finance costs 153,538   171,249  
Transaction costs 1,108   4,187  
Depreciation and amortization 1,841,033   1,831,744  
Foreign exchange gain on long-term debt   (307 )
Accretion 21,625   30,248  
Deferred tax benefit   (3,408 )
Share-based payments 136,796   212,517  
Net income (loss) for the year adjusted for non-cash items 4,010,200   1,113,602  
CHANGES IN NON-CASH WORKING CAPITAL ITEMS    
Trade receivables 1,639,818   (644,197 )
Other receivables (55,412 ) 87  
Inventories (541,074 ) 41,703  
Prepaid expenses and deposits (88,839 ) 154,106  
Accounts payable and accrued liabilities relating to operating activities (358,136 ) 388,064  
Total changes in non-cash working capital items 596,357   (60,237 )
Net income (loss) for the year adjusted for non-cash and working capital items 4,606,557   1,053,365  
Interest paid (153,538 ) (171,249 )
CASH GENERATED FROM OPERATIONS 4,453,019   882,116  
INVESTING ACTIVITIES    
Purchase of property and equipment (528,707 ) (332,186 )
Purchase of leasehold improvements (12,870 ) (6,007 )
Proceeds from sale of equipment 353    
Deposits relating to investment in equipment (77,467 ) 187,790  
Accounts payable and accrued liabilities relating to investing activities 134,554   (46,738 )
CASH USED IN INVESTING ACTIVITIES (484,137 ) (197,141 )
FINANCING ACTIVITIES    
Stock options exercised 4,897   17,284  
Repayment of long-term debt (112,973 ) (339,321 )
Repayment of CAAP loan (83,884 ) (83,884 )
Repayment of lease liabilities (265,088 ) (265,993 )
CASH USED IN FINANCING ACTIVITIES (457,048 ) (671,914 )
Increase in cash and cash equivalents 3,511,834   13,061  
     
Cash and cash equivalents at beginning of the year 1,857,195   1,844,134  
     
Cash and cash equivalents at end of the year 5,369,029   1,857,195  
     

The complete financial statements are available for review on SEDAR at https://sedar.com/Ceapro and on the Company’s website at www.ceapro.com.


About Ceapro Inc.

Ceapro Inc. is a Canadian biotechnology company involved in the development of proprietary extraction technology and the application of this technology to the production of extracts and “active ingredients” from oats and other renewable plant resources. Ceapro adds further value to its extracts by supporting their use in cosmeceutical, nutraceutical, and therapeutics products for humans and animals. The Company has a broad range of expertise in natural product chemistry, microbiology, biochemistry, immunology and process engineering. These skills merge in the fields of active ingredients, biopharmaceuticals and drug-delivery solutions. For more information on Ceapro, please visit the Company’s website at www.ceapro.com.

For more information contact:

Jenene Thomas
JTC Team, LLC
Investor Relations and Corporate Communications Advisor
T (US): +1 (833) 475-8247
E: czo@jtcir.com

Issuer:
Gilles R. Gagnon, M.Sc., MBA
President & CEO
T: 780-421-4555

Neither TSX Venture Exchange nor its Regulation Services Provider (as that term is defined in the policies of the TSX Venture Exchange) accepts responsibility for the adequacy or accuracy of this release


Source: Ceapro Inc.

Sierra Metals Inc. (SMT:CA)(SMTS) – To Invest US$28 Million For An Iron Ore Processing Plant


Sierra Metals To Invest US$28 Million For An Iron Ore Processing Plant Expected To Produce Approximately 500,000 Tonnes Per Year Of Magnetite Concentrate At The Bolivar Mine, Mexico


TORONTO–(BUSINESS WIRE)– Sierra Metals Inc. (TSX: SMT) (BVL: SMT) (NYSE AMERICAN: SMTS) (“Sierra Metals” or “the Company”) today announces that its Board of Directors has approved the investment by the Company of US$28 million for the construction of a magnetite processing plant including an initial expenditure of $5.2 million for early procurement and contracting on the project. The plant is expected to produce approximately 500,000 tonnes per year of 62% iron ore fines concentrate at the Company’s Bolivar Mine located in the Chihuahua State, Mexico.

Engineering and test work of the final process is currently underway, and construction of the processing plant is expected to commence this June and will take approximately six months to complete. The Company expects to concentrate magnetite as an additional process to the existing copper concentrator plant through a series of magnetic drums and regrinding equipment, at an added marginal cost for the process.

The magnetite project was previously mentioned in the Bolivar Mine’s Preliminary Economic Assessment (the “Report”) which was filed on SEDAR (sedar.com) and EDGAR (SEC.gov) on November 5, 2020. In the Report the Company mentioned that the economic analysis did not include the potential sale of magnetite but that the Company was studying this potential development and believed that doing so could result in the following outcomes:

1. Increased sales revenue

2. Reduced future closure costs; and

3. Reduced tailings for deposition, and its related costs.

The project has now been approved and will be included in an updated PEA for the Bolivar Mine which will be filed within 45 days.

Luis Marchese, CEO of Sierra Metals commented: “We are very excited about initiating this new process the potential for additional revenue for the Company. The iron ore market is presenting value enhancing opportunities for Sierra Metals and the Company is taking decisive action to extract value from its existing iron ore-copper mineral resources. As well, this process is expected to have additional benefits including reduced haulage costs of our copper concentrate by rail and enhance the Bolivar mine’s economics due to this new revenue stream. Overall, we believe that this is a great value-enhancing initiative for the Company and its shareholders.”

Quality Control

Américo Zuzunaga, FAusIMM CP (Mining Engineer) and Vice President of Corporate Planning, is a Qualified Person under National Instrument 43-101 – Standards of Disclosure for Mineral Projects.

Augusto Chung, FAusIMM CP (Metallurgist) and Vice President of Metallurgy and Projects, is a Qualified Person under National Instrument 43-101 – Standards of Disclosure for Mineral Projects.

About Sierra Metals

Sierra Metals Inc. is a diversified Canadian mining company focused on the production and development of precious and base metals from its polymetallic Yauricocha Mine in Peru and Bolivar and Cusi Mines in Mexico. The Company is focused on increasing production volume and growing mineral resources. Sierra Metals has recently had several new key discoveries and still has many more exciting brownfield exploration opportunities at all three Mines in Peru and Mexico that are within close proximity to the existing mines. Additionally, the Company also has large land packages at all three mines with several prospective regional targets providing longer-term exploration upside and mineral resource growth potential.

The Company’s Common Shares trade on the Bolsa de Valores de Lima and on the Toronto Stock Exchange under the symbol “SMT” and on the NYSE American Exchange under the symbol “SMTS”.

For further information regarding Sierra Metals, please visit www.sierrametals.com

Continue to Follow, Like and Watch our progress:

Webwww.sierrametals.com | Twittersierrametals | FacebookSierraMetalsInc | LinkedInSierra Metals Inc | Instagramsierrametals

Disclaimer Regarding Risks and Forward-Looking Statements

The decision to construct the processing plant has not been made based on a feasibility study and accordingly, involves increased uncertainty and risks.

This press release contains “forward-looking information” and “forward-looking statements” within the meaning of Canadian and U.S. securities laws (collectively, “forward-looking information”). Forward-looking information includes, but is not limited to, statements with respect to the timing of construction of the processing plant, its capacity and production, construction costs and expected iron content of the concentrate. Any statements that express or involve discussions with respect to predictions, expectations, beliefs, plans, projections, objectives, assumptions or future events or performance (often, but not always, using words or phrases such as “expects”, “anticipates”, “plans”, “projects”, “estimates”, “assumes”, “intends”, “strategy”, “goals”, “objectives”, “potential” or variations thereof, or stating that certain actions, events or results “may”, “could”, “would”, “might” or “will” be taken, occur or be achieved, or the negative of any of these terms and similar expressions) are not statements of historical fact and may be forward-looking information.

Forward-looking information is subject to a variety of risks and uncertainties, which could cause actual events or results to differ from those reflected in the forward-looking information, including, without limitation, the risks described under the heading “Risk Factors” in the Company’s annual information form dated March 30, 2021 for its fiscal year ended December 31, 2020 and other risks identified in the Company’s filings with Canadian securities regulators and the United States Securities and Exchange Commission, which filings are available at www.sedar.com and www.sec.gov, respectively.

The risk factors referred to above are not an exhaustive list of the factors that may affect any of the Company’s forward-looking information. Forward-looking information includes statements about the future and is inherently uncertain, and the Company’s actual achievements or other future events or conditions may differ materially from those reflected in the forward-looking information due to a variety of risks, uncertainties and other factors. The Company’s statements containing forward-looking information are based on the beliefs, expectations, and opinions of management on the date the statements are made, and the Company does not assume any obligation to update such forward-looking information if circumstances or management’s beliefs, expectations or opinions should change, other than as required by applicable law. For the reasons set forth above, one should not place undue reliance on forward-looking information.

Mike McAllister
Vice President, Investor Relations
Sierra Metals Inc.
(416) 366 7777
Email: info@sierrametals.com

Luis Marchese
CEO
Sierra Metals Inc.
(416) 366 7777

Source: Sierra Metals Inc.

Ceapro Inc. (CRPOF)(CZO:CA) – Reports Fourth Quarter and Full Year 2020 Financial Results and Operational Highlights


Ceapro Inc. Reports Fourth Quarter and Full Year 2020 Financial Results and Operational Highlights


  • Maintained production operations during COVID-19 pandemic, providing customers with essential products and completing integration of manufacturing sitewhile ensuring the health and safety of employees
  • Substantially increased sales, net profits and cash generated from operations during the year 2020, representing one of Ceapro’s best performances in company history
  • R&D activities focused on advancing the development of innovative delivery systems and yeast beta glucan as a potential inhalable therapeutic for COVID-19

EDMONTON, Alberta, April 22, 2021 (GLOBE NEWSWIRE) — Ceapro Inc. (TSX-V: CZO, OTCQX: CRPOF) (“Ceapro” or the “Company”), a growth-stage biotechnology company focused on the development and commercialization of active ingredients for healthcare and cosmetic industries, today announced operational highlights and financial results for the fourth quarter and full year ended December 31, 2020.

“We could not be prouder of our resilient employees who worked tirelessly to deliver one of the best ever performances in the Company’s history during such a stressful year marked by the ongoing COVID-19 pandemic. While ensuring safety of our employees as our first priority, we were able to secure business continuity by putting more emphasis on production operations to serve our customers in the cosmetic sector. This approach, which has resulted in significant increase in sales, net profits and cash on hand, also allowed us to maintain investments in Research and Development as per our strategy to expand Ceapro’s business model from a contract manufacturer/commodity company to a high-value life science/biopharmaceutical company offering innovative products and delivery systems to the healthcare sector,” stated Gilles Gagnon, M.Sc., MBA, President and CEO, of Ceapro.

“In addition to excellent financial and operational results, main highlights of the year include the development of beta glucan from yeast and its potential as an inhalable therapeutic for COVID-19 patients as well as the development of new chemical complexes through the use of the PGX Technology. We are thrilled with the achievements made in 2020,” added Mr. Gagnon.

2020 Corporate and Operational Highlights

Pipeline Development

Oat Beta Glucan:

  • Resumed enrollment of patients for the clinical trial with beta glucan as a cholesterol reducing natural pharmaceutical product. The study will enroll approximately 264 patients. To date, two thirds of the patients have been screened and randomized.

  • Received approval from Health Canada for an amendment to the protocol to allow evaluation of subjects with confirmed pathophysiological condition of hyperlipidemia who voluntarily request to be treated with beta glucan only, without regular dosing of statins. This significant change, allowing patients to receive beta glucan as a stand-alone therapy, has accelerated patient enrollment and is expected to expand the target addressable patient population.

Avenanthramides:

  • Announced the publication of positive results from study evaluating avenanthramides in exercise-induced inflammation in the international, peer-reviewed Journal of the International Society of Sports Nutrition. Positive results support anti-inflammatory claims for avenanthramides as a nutraceutical product and pave the way for a Phase 1 clinical trial as a potential pharmaceutical product.

  • Continued to monitor stability studies for liquid avenanthramides produced at a new manufacturing site as well as for the pharmaceutical-grade dry powder formulation of avenanthramides to be used in a human Phase 1 bioavailability and safety study.

New Products:

Cannabis

  • Received approval from Health Canada Controlled Substances and Cannabis Branch for a five-year research license with medical cannabis for the formulation of unique solid cannabinoid delivery systems using PGX technology.

Yeast Beta Glucan (YBG)

  • Developed an optimal formulation of YBG coming from various sources.

  • Confirmed capability of PGX Technology to optimize and standardize the size and morphology of yeast beta-glucan (PGX-YBG) suitable for lung inhalation.

  • Achieved the first milestones in successful development of PGX-processed yeast beta glucan product as a potential inhalable therapeutic for COVID-19 and other fibrotic endpoint diseases of the lung.

  • Conducted an in-vitro study with human cell lines demonstrating that PGX-YBG obtained from different sources exhibited significant stimulatory effect on human immune response through activation of beta glucan specific Dectin 1 receptors.

  • Ongoing PGX-YBG project with McMaster University conducted in parallel for naïve and preclinical animal models. To date, no safety issues have been encountered. The preclinical phase has been extended to identify the maximum tolerated dose.

  • Conducted additional in vitro PGX-YBG dose response study to correlate with upcoming McMaster animal study results. YBG induces immunomodulation without affecting inflammation pathways. This product is poised to become a key strategic asset for the Company.

New Chemical Complexes:

  • Developed new PGX-dried chemical complexes like sodium alginate and gum arabic impregnated with co-enzyme Q10 (CoQ10). Positive results published in peer-reviewed journals demonstrate the versatility of the PGX Technology and the potential to develop significant bioactive delivery systems. Key learnings from these studies pave the way for the scale-up of the technology at the commercial level.

  • Subsequent to year-end, Ceapro announced the successful completion of a long-term research program conducted with University of Alberta. This screening program allowed Ceapro to retain the most promising products and expand the PGX-based products pipeline.

Technology:

  • Performed significant technical upgrades of PGX pilot plant in Edmonton to allow production of yeast beta glucan for a potential clinical trial with COVID-19 patients.

  • Completed a feasibility study for the commercial scale up of the PGX Technology. Several manufacturers and existing supercritical plants were contacted in 2020 for the choice of equipment and location. Given excellent results obtained with the new yeast beta glucan product, it became clear that location of the first large scale PGX unit should be close to the best source of raw material which was found in Germany where the Company also acquired pieces of equipment suitable for the assembling of such unit. Production at the retained site will be mostly for the commercialization of yeast beta glucan as an immune booster and for alginate as a carrier for other bioactives.

  • Initiated installment in Edmonton of a commercial scale unit for impregnation of bioactives with PGX-processed biopolymers.

  • Pursued research collaboration projects with University of Alberta and McMaster University for the impregnation of various bioactives using PGX-processed biopolymers as potential delivery systems for multiple applications in healthcare.

Bioprocessing Operations

  • Completed the integration of production operations under one roof in Edmonton. Ceapro’s dedicated production team successfully responded to the growing market demand for the cosmeceutical base business by producing over 250 metric tons of active ingredients in 2020, a 25% increase over the previous year.

  • Received renewal of the Site License from the Health Canada Natural Product Directorate. This License enables the Company to manufacture, package, label, release and distribute final products.

Corporate

  • Fully repaid loan with Agriculture Financial Services Corporation.

  • Announced expansion of a grant from National Research Council of Canada for the optimization and mass production of yeast beta glucan as a potential inhalable therapeutic for COVID-19 and other fibrotic end-point disease of the lung.

  • Pursued out-licensing discussions for PGX-processed new chemical complexes.

  • Secured DTC Eligibility for publicly traded shares under Ticker OTCQZ: CRPOF and to expand Company exposure to other markets with an emphasis in USA.

Financial Highlights for the Fourth Quarter and the Full Year 2020 Ended December 31, 2020

  • Total sales of $2,706,000 for the fourth quarter of 2020 and $15,121,000 for the full year of 2020 compared to $3,721,000 and $12,880,000 for the comparative periods in 2019. The 17% increase in revenue for the full year 2020 results from an 33% increase in sales of avenanthramides (mostly made to USA) partially offset by a 16% decrease in sales of beta glucan.

  • Net loss of $539,000 for the fourth quarter of 2020 and a net profit of $1,856,000 for the full year of 2020 compared to a net profit of $166,000 and a net loss of $1,133,000 for the comparative periods in 2019, a year over year improvement of $2,989,000 Third and fourth quarter 2020 were marked by the completion of the decommissioning of Leduc manufacturing site and the final integration of production operations in the Edmonton facility. These time-consuming moves resulted in some necessary adjustments in equipment at the new site. It also required additional training of relocated employees.

  • Cash generated from operations of $4,453,000, for the full year 2020 vs cash generated from operations of $882,000 for the full year 2019.

  • Positive working capital balance of $7,659,000 as of December 31, 2020.

“I strongly believe 2021 holds a lot of opportunity for Ceapro. Our focus remains on the health and safety of our associates during this COVID-19 pandemic crisis, followed by business continuity. Depending on the evolution of the COVID-19 pandemic, we expect Ceapro’s cosmeceuticals base business to continue to grow and provide positive operating cash flows to support the expansion to a new business model from a contract manufacturer to a biopharmaceutical development company involved in nutraceuticals and pharmaceuticals. Based on a very solid foundation, a highly competent team, a healthy balance sheet and a very strong technology and product portfolio with the potential to access key large markets, we have all the key components for success,” concluded Mr. Gagnon.

CEAPRO INC.    
Consolidated Balance Sheets    
     
  December 31, December 31,
  2020 2019
  $ $
     
ASSETS    
Current Assets    
Cash and cash equivalents 5,369,029 1,857,195
Trade receivables 2,019,723 3,659,541
Other receivables 102,224 46,812
Inventories (note 3) 1,210,079 669,005
Prepaid expenses and deposits 348,845 178,908
     
  9,049,900 6,411,461
Non-Current Assets    
   Investment tax credits receivable 607,700 607,700
Deposits 82,124 85,755
Licences (note 4) 18,514 21,477
Property and equipment (note 5) 18,591,189 19,764,122
Deferred tax assets (note 14 (b)) 874,304 378,643
     
  20,173,831 20,857,697
     
TOTAL ASSETS 29,223,731 27,269,158
     
LIABILITIES AND EQUITY    
Current Liabilities    
Accounts payable and accrued liabilities 1,067,622 1,291,204
Current portion of long-term debt (note 6) 111,865
Current portion of lease liabilities (note 7) 250,658 265,123
Current portion of CAAP loan (note 9) 72,263 72,942
     
  1,390,543 1,741,134
Non-Current Liabilities    
Long-term lease liabilities (note 7) 2,648,917 2,775,627
CAAP loan (note 9) 61,580
Deferred tax liabilities (note 14 (b)) 874,304 378,643
     
  3,523,221 3,215,850
     
TOTAL LIABILITIES 4,913,764 4,956,984
     
Equity    
Share capital (note 8 (b)) 16,511,067 16,401,677
Contributed surplus (note 8 (e)) 4,682,393 4,650,090
Retained earnings 3,116,507 1,260,407
     
  24,309,967 22,312,174
     
TOTAL LIABILITIES AND EQUITY 29,223,731 27,269,158


CEAPRO INC.    
Consolidated Statements of Net Income (Loss) and Comprehensive Income (Loss)
     
   
  2020   2019  
Year Ended December 31, $ $
     
Revenue (note 16) 15,121,282   12,880,006  
Cost of goods sold 7,498,996   7,434,654  
     
Gross margin 7,622,286   5,445,352  
     
Research and product development 1,881,883   2,393,607  
General and administration 3,282,754   2,952,488  
Sales and marketing 111,044   425,230  
Finance costs (note 12) 231,271   260,684  
     
Income (loss) from operations 2,115,334   (586,657 )
     
Other expenses (note 11) (259,234 ) (549,379 )
     
Income (loss) before tax 1,856,100   (1,136,036 )
     
Income taxes    
   Current tax recovery    
   Deferred tax benefit   3,408  
     
Income tax benefit   3,408  
     
Total comprehensive income (loss) for the year 1,856,100   (1,132,628 )
     
Net income (loss) per common share (note 21):    
Basic 0.02   (0.01 )
Diluted 0.02   (0.01 )
     
Weighted average number of common shares outstanding (note 21):    
Basic 77,594,629   77,188,505  
Diluted 78,143,033   77,188,505  


CEAPRO INC.    
Consolidated Statements of Cash Flows    
     
     
  2020   2019  
Year Ended December 31, $ $
OPERATING ACTIVITIES    
Net income (loss) for the year 1,856,100   (1,132,628 )
Adjustments for items not involving cash    
Finance costs 153,538   171,249  
Transaction costs 1,108   4,187  
Depreciation and amortization 1,841,033   1,831,744  
Foreign exchange gain on long-term debt   (307 )
Accretion 21,625   30,248  
Deferred tax benefit   (3,408 )
Share-based payments 136,796   212,517  
Net income (loss) for the year adjusted for non-cash items 4,010,200   1,113,602  
CHANGES IN NON-CASH WORKING CAPITAL ITEMS    
Trade receivables 1,639,818   (644,197 )
Other receivables (55,412 ) 87  
Inventories (541,074 ) 41,703  
Prepaid expenses and deposits (88,839 ) 154,106  
Accounts payable and accrued liabilities relating to operating activities (358,136 ) 388,064  
Total changes in non-cash working capital items 596,357   (60,237 )
Net income (loss) for the year adjusted for non-cash and working capital items 4,606,557   1,053,365  
Interest paid (153,538 ) (171,249 )
CASH GENERATED FROM OPERATIONS 4,453,019   882,116  
INVESTING ACTIVITIES    
Purchase of property and equipment (528,707 ) (332,186 )
Purchase of leasehold improvements (12,870 ) (6,007 )
Proceeds from sale of equipment 353    
Deposits relating to investment in equipment (77,467 ) 187,790  
Accounts payable and accrued liabilities relating to investing activities 134,554   (46,738 )
CASH USED IN INVESTING ACTIVITIES (484,137 ) (197,141 )
FINANCING ACTIVITIES    
Stock options exercised 4,897   17,284  
Repayment of long-term debt (112,973 ) (339,321 )
Repayment of CAAP loan (83,884 ) (83,884 )
Repayment of lease liabilities (265,088 ) (265,993 )
CASH USED IN FINANCING ACTIVITIES (457,048 ) (671,914 )
Increase in cash and cash equivalents 3,511,834   13,061  
     
Cash and cash equivalents at beginning of the year 1,857,195   1,844,134  
     
Cash and cash equivalents at end of the year 5,369,029   1,857,195  
     

The complete financial statements are available for review on SEDAR at https://sedar.com/Ceapro and on the Company’s website at www.ceapro.com.


About Ceapro Inc.

Ceapro Inc. is a Canadian biotechnology company involved in the development of proprietary extraction technology and the application of this technology to the production of extracts and “active ingredients” from oats and other renewable plant resources. Ceapro adds further value to its extracts by supporting their use in cosmeceutical, nutraceutical, and therapeutics products for humans and animals. The Company has a broad range of expertise in natural product chemistry, microbiology, biochemistry, immunology and process engineering. These skills merge in the fields of active ingredients, biopharmaceuticals and drug-delivery solutions. For more information on Ceapro, please visit the Company’s website at www.ceapro.com.

For more information contact:

Jenene Thomas
JTC Team, LLC
Investor Relations and Corporate Communications Advisor
T (US): +1 (833) 475-8247
E: czo@jtcir.com

Issuer:
Gilles R. Gagnon, M.Sc., MBA
President & CEO
T: 780-421-4555

Neither TSX Venture Exchange nor its Regulation Services Provider (as that term is defined in the policies of the TSX Venture Exchange) accepts responsibility for the adequacy or accuracy of this release


Source: Ceapro Inc.

Release – Sierra Metals Inc. (SMT:CA)(SMTS) – To Invest US$28 Million For An Iron Ore Processing Plant


Sierra Metals To Invest US$28 Million For An Iron Ore Processing Plant Expected To Produce Approximately 500,000 Tonnes Per Year Of Magnetite Concentrate At The Bolivar Mine, Mexico


TORONTO–(BUSINESS WIRE)– Sierra Metals Inc. (TSX: SMT) (BVL: SMT) (NYSE AMERICAN: SMTS) (“Sierra Metals” or “the Company”) today announces that its Board of Directors has approved the investment by the Company of US$28 million for the construction of a magnetite processing plant including an initial expenditure of $5.2 million for early procurement and contracting on the project. The plant is expected to produce approximately 500,000 tonnes per year of 62% iron ore fines concentrate at the Company’s Bolivar Mine located in the Chihuahua State, Mexico.

Engineering and test work of the final process is currently underway, and construction of the processing plant is expected to commence this June and will take approximately six months to complete. The Company expects to concentrate magnetite as an additional process to the existing copper concentrator plant through a series of magnetic drums and regrinding equipment, at an added marginal cost for the process.

The magnetite project was previously mentioned in the Bolivar Mine’s Preliminary Economic Assessment (the “Report”) which was filed on SEDAR (sedar.com) and EDGAR (SEC.gov) on November 5, 2020. In the Report the Company mentioned that the economic analysis did not include the potential sale of magnetite but that the Company was studying this potential development and believed that doing so could result in the following outcomes:

1. Increased sales revenue

2. Reduced future closure costs; and

3. Reduced tailings for deposition, and its related costs.

The project has now been approved and will be included in an updated PEA for the Bolivar Mine which will be filed within 45 days.

Luis Marchese, CEO of Sierra Metals commented: “We are very excited about initiating this new process the potential for additional revenue for the Company. The iron ore market is presenting value enhancing opportunities for Sierra Metals and the Company is taking decisive action to extract value from its existing iron ore-copper mineral resources. As well, this process is expected to have additional benefits including reduced haulage costs of our copper concentrate by rail and enhance the Bolivar mine’s economics due to this new revenue stream. Overall, we believe that this is a great value-enhancing initiative for the Company and its shareholders.”

Quality Control

Américo Zuzunaga, FAusIMM CP (Mining Engineer) and Vice President of Corporate Planning, is a Qualified Person under National Instrument 43-101 – Standards of Disclosure for Mineral Projects.

Augusto Chung, FAusIMM CP (Metallurgist) and Vice President of Metallurgy and Projects, is a Qualified Person under National Instrument 43-101 – Standards of Disclosure for Mineral Projects.

About Sierra Metals

Sierra Metals Inc. is a diversified Canadian mining company focused on the production and development of precious and base metals from its polymetallic Yauricocha Mine in Peru and Bolivar and Cusi Mines in Mexico. The Company is focused on increasing production volume and growing mineral resources. Sierra Metals has recently had several new key discoveries and still has many more exciting brownfield exploration opportunities at all three Mines in Peru and Mexico that are within close proximity to the existing mines. Additionally, the Company also has large land packages at all three mines with several prospective regional targets providing longer-term exploration upside and mineral resource growth potential.

The Company’s Common Shares trade on the Bolsa de Valores de Lima and on the Toronto Stock Exchange under the symbol “SMT” and on the NYSE American Exchange under the symbol “SMTS”.

For further information regarding Sierra Metals, please visit www.sierrametals.com

Continue to Follow, Like and Watch our progress:

Webwww.sierrametals.com | Twittersierrametals | FacebookSierraMetalsInc | LinkedInSierra Metals Inc | Instagramsierrametals

Disclaimer Regarding Risks and Forward-Looking Statements

The decision to construct the processing plant has not been made based on a feasibility study and accordingly, involves increased uncertainty and risks.

This press release contains “forward-looking information” and “forward-looking statements” within the meaning of Canadian and U.S. securities laws (collectively, “forward-looking information”). Forward-looking information includes, but is not limited to, statements with respect to the timing of construction of the processing plant, its capacity and production, construction costs and expected iron content of the concentrate. Any statements that express or involve discussions with respect to predictions, expectations, beliefs, plans, projections, objectives, assumptions or future events or performance (often, but not always, using words or phrases such as “expects”, “anticipates”, “plans”, “projects”, “estimates”, “assumes”, “intends”, “strategy”, “goals”, “objectives”, “potential” or variations thereof, or stating that certain actions, events or results “may”, “could”, “would”, “might” or “will” be taken, occur or be achieved, or the negative of any of these terms and similar expressions) are not statements of historical fact and may be forward-looking information.

Forward-looking information is subject to a variety of risks and uncertainties, which could cause actual events or results to differ from those reflected in the forward-looking information, including, without limitation, the risks described under the heading “Risk Factors” in the Company’s annual information form dated March 30, 2021 for its fiscal year ended December 31, 2020 and other risks identified in the Company’s filings with Canadian securities regulators and the United States Securities and Exchange Commission, which filings are available at www.sedar.com and www.sec.gov, respectively.

The risk factors referred to above are not an exhaustive list of the factors that may affect any of the Company’s forward-looking information. Forward-looking information includes statements about the future and is inherently uncertain, and the Company’s actual achievements or other future events or conditions may differ materially from those reflected in the forward-looking information due to a variety of risks, uncertainties and other factors. The Company’s statements containing forward-looking information are based on the beliefs, expectations, and opinions of management on the date the statements are made, and the Company does not assume any obligation to update such forward-looking information if circumstances or management’s beliefs, expectations or opinions should change, other than as required by applicable law. For the reasons set forth above, one should not place undue reliance on forward-looking information.

Mike McAllister
Vice President, Investor Relations
Sierra Metals Inc.
(416) 366 7777
Email: info@sierrametals.com

Luis Marchese
CEO
Sierra Metals Inc.
(416) 366 7777

Source: Sierra Metals Inc.

QuickChek – April 22, 2021


Capstone Turbine Corporation Celebrates Earth Day 2021 With Its Transformation Into Capstone Green Energy Corporation (Nasdaq: CGRN)

Capstone Turbine announced that effective immediately it will become Capstone Green Energy Corporation (www.CapstoneGreenEnergy.com) (NASDAQ:CGRN), a global partner in carbon reduction and on-site resilient green energy solutions

Research, News & Market Data on Capstone Green Energy
Watch recent presentation from Capstone


Travelzoo Reports First Quarter 2021 Results

Travelzoo announced financial results for the first quarter ended March 31, 2021

Research, News & Market Data on Travelzoo



Lineage Announces Appointment Of Dr. Dipti Amin To Its Board Of Directors

Lineage Cell Therapeutics announced the appointment of Dr. Dipti Amin, MBBS, FFPM, MRCGP, DCPSA, DCH, DRCOG, DGM, to the Company’s Board of Directors, effective as of April 20, 2021

Research, News & Market Data on Lineage Cell Therapeutics

Watch recent presentation from NobleCon17


Ceapro Inc. Reports Fourth Quarter and Full Year 2020 Financial Results and Operational Highlights

Ceapro Inc. announced operational highlights and financial results for the fourth quarter and full year ended December 31, 2020.

Research, News & Market Data on Ceapro

Watch recent presentation from NobleCon17


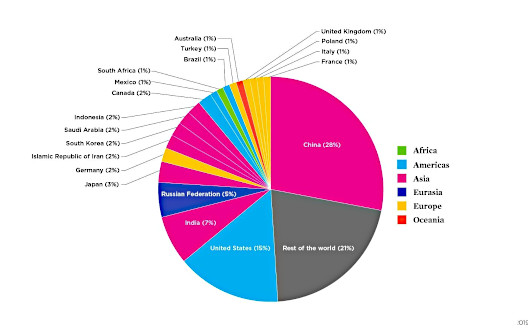
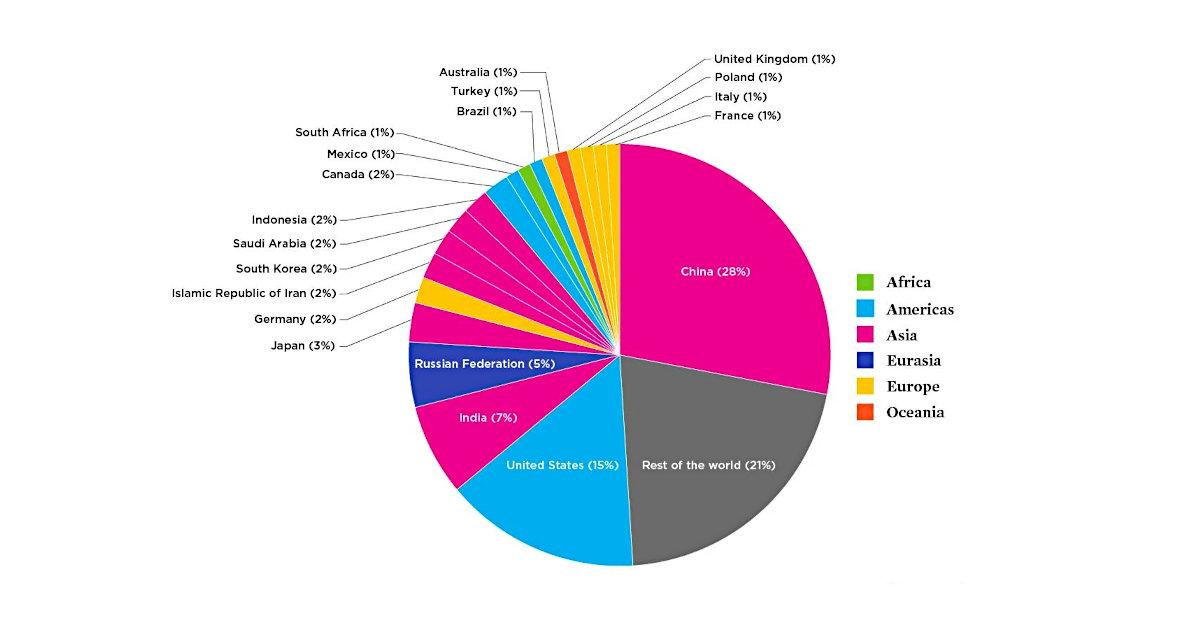
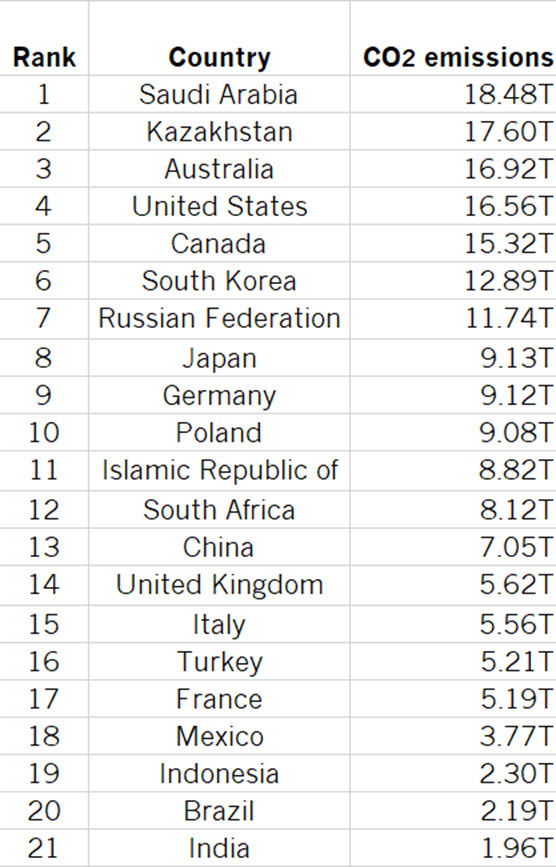
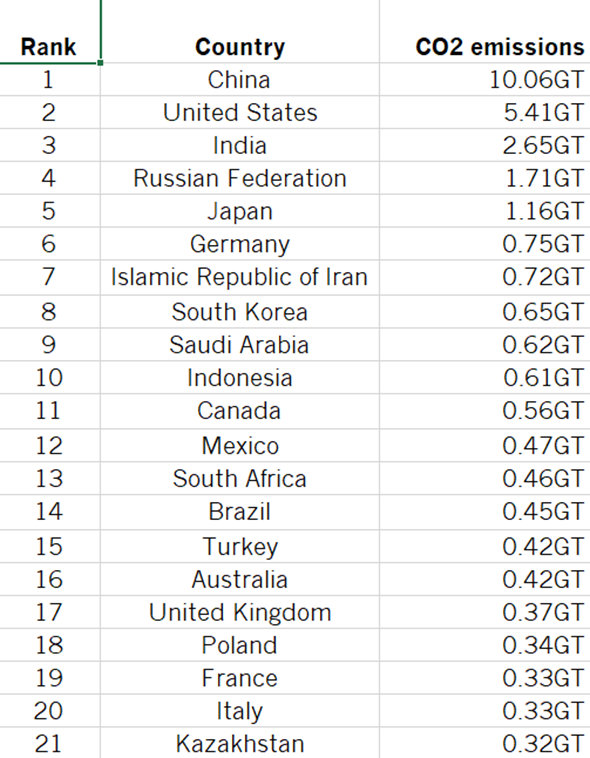
Happy Earth Day! The International Energy Agency has compiled some data for you

CO2 Emissions by Country


Sierra Metals To Invest US$28 Million For An Iron Ore Processing Plant

Sierra Metals announced that its Board of Directors has approved the investment by the Company of US$28 million for the construction of a magnetite processing plant

Research, News & Market Data on Sierra Metals

Watch recent presentation from NobleCon17

Stay up to date. Follow us:

Genco Shipping & Trading Limited (GNK) – New 2022 Dividend Estimate and Fleet Renewal Intact

Thursday, April 22, 2021

Genco Shipping & Trading Limited (GNK)
New 2022 Dividend Estimate and Fleet Renewal Intact

Genco Shipping & Trading Limited, incorporated on September 27, 2004, transports iron ore, coal, grain, steel products and other drybulk cargoes along shipping routes through the ownership and operation of drybulk carrier vessels. The Company is engaged in the ocean transportation of drybulk cargoes around the world through the ownership and operation of drybulk carrier vessels. As of December 31, 2016, its fleet consisted of 61 drybulk carriers, including 13 Capesize, six Panamax, four Ultramax, 21 Supramax, two Handymax and 15 Handysize drybulk carriers, with an aggregate carrying capacity of approximately 4,735,000 deadweight tons (dwt). Of the vessels in its fleet, 15 are on spot market-related time charters, and 27 are on fixed-rate time charter contracts. As of December 31, 2016, additionally, 19 of the vessels in its fleet were operating in vessel pools.

Poe Fratt, Senior Research Analyst, Noble Capital Markets, Inc.

Refer to the full report for the price target, fundamental analysis, and rating.

    Variable dividend policy begins in 1Q2022 and scenarios look attractive.  Our quarterly dividend calculation is based on estimated operating cash flow minus debt amortization, capex for drydocks and a reserve based on future quarterly debt amortization and interest expense.

    Our FY2022 dividend estimate is $2.25/share is based on our 2022 EBITDA estimate of $171.3 million, which implies a current yield of 16.4%.  Assuming TCE rates of $18.8k/day and TCE revenue of $272 million, operating cash flow should approximate $164 million. Incorporating debt amortization of $24 million, drydock capex of $11 million, and a reserve of $34 million, net cash flow of $95 million …


This research is provided by Noble Capital Markets, Inc., a FINRA and S.E.C. registered broker-dealer (B/D).

*Analyst certification and important disclosures included in the full report. NOTE: investment decisions should not be based upon the content of this research summary.  Proper due diligence is required before making any investment decision. 

Genetic Discoveries and Healthcare Innovation


Genetics Now Touch on All Areas of Life Sciences


The institutions and companies involved in genetics now lend support to most other areas of life sciences.  The contributions include the discovery of genetic markers of disease and gene therapy. The market for genetic testing continues to grow in leaps and bounds and has gained momentum as the field benefits from the compounding effect of past advances in understanding and technology. In addition, there’s been an increase in the study of chronic diseases for as-yet unmet therapeutic needs, including the development of testing kits to better assess patients’ needs.

The genetics market is expanding with new gene therapies, which has been a big of innovation and growth.  It’s estimated that this market’s worth is US$3.8 billion, and it is expected to reach US$13 billion by 2024. That’s a compound annual growth rate of 27.8 percent. The growing segment of healthcare or life sciences focuses on using genes to detect, prevent, and treat conditions to improve patient experience. More recent innovations include the potential for healthcare professionals to use genes at the cellular level instead of using surgery or medicines. The advanced method replaces “diseased” genes to potentially cure the ailment or disease.

Pharmaceutical and biotech companies involved in genetics include companies of every size and seemingly in every part of life sciences. Companies with the most potential to impact investors exist among smaller and more nimble companies in this space. Below are publicly traded genetics stocks listed on the Nasdaq or AMEX exchanges. They are small companies able to make a big impact with products related to gene therapy, cell therapy, genetic testing, and therapies for genetic diseases.


Genprex (NASDAQ:GNPX)

Genprex is a clinical-stage gene therapy company developing new therapies for patients with cancer and diabetes. Its therapies are based on the company’s proprietary ONCOPREX nanoparticle delivery system, which delivers cancer-fighting genes to tumor cells.

Market cap: US$168.68 million; current share price: US$3.90

In January, the company’s lead product candidate, the REQORSA immunogene therapy, was granted fast-track designation by the US Food and Drug Administration (FDA) for use in combination with AstraZeneca’s (NYSE:AZN) Tagrisso for the treatment of non-small cell lung cancer. The active ingredient in REQORSA is the tumor suppressor gene TUSC2.


Co-Diagnositics (NASDAQ:CODX)

Co-Diagnostics describes itself as a low-cost provider of molecular diagnostic services. The company’s technology is used in tests that are designed using the detection and/or analysis of nucleic acid molecules (DNA or RNA). Its molecular diagnostic tools detect infectious diseases, allow for liquid biopsy for cancer screening and have agricultural applications.

Market cap: US$257.99.81 million; current share price: US$9.00

In mid-December, Co-Diagnostics reported that it sold over 10 million Covid-19 test kits to its domestic and international network of laboratories, hospitals and distributors.


Lineage Cell Therapeutics (NYSE American:LCTX)

As a clinical-stage biotech company, Lineage develops new cell therapies for unmet medical needs. Their programs are based on a proprietary cell-based therapy platform and in-house development and manufacturing capabilities. Lineage develops and manufactures specialized, terminally differentiated human cells to either replace or support cells that are dysfunctional or absent due to degenerative disease or traumatic injury or administered as a means of helping the body mount an effective immune response to cancer.

Market cap: US$ 448.65 million; current
share price: US$2.52

Lineage’s clinical programs are in markets with billion-dollar opportunities and include three allogeneic (“off-the-shelf”) product candidates. 


Capricor Therapeutics (NASDAQ:CAPR)

Capricor Therapeutics is a clinical-stage biotechnology company working to develop and commercialize cell and exosome-based therapeutics for the treatment and prevention of diseases.

 Market cap: US$91.53; current share price:
US$4.02

In May 2020, Capricor announced positive top-line final results from a HOPE-2 study in patients with Duchenne muscular dystrophy who were treated with the company’s lead candidate, CAP-1002, an allogeneic cell therapy. In August, the FDA accepted Capricor’s investigational
new drug
 (IND) application for a Phase 2 clinical trial of CAP-1002 in patients with COVID-19.


OncoSec Medical (NASDAQ:ONCS)

OncoSec Medical is a late-stage biotechnology company focused on developing cytokine-based intratumoral immunotherapies to stimulate the body’s immune system to target and attack cancer.

Market cap: US$54.83 million; current
share price: US$4.78

In October 2020, OncoSec announced FDA clearance of an IND application to begin a Phase 1 clinical trial of its CORVax12 coronavirus vaccine candidate. CORVax combines OncoSec’s TAVO with a DNA-encodable stabilized trimeric SARS-CoV-2 spike glycoprotein developed by researchers at the National Institute of Health’s National Institute of Allergy and Infectious Diseases.


Suggested Reading:

What is the Approval Process for Medical Devices

Small-Caps in the Covid19 and Treatment Space


Scientists Now Better Understand Viral Mutations

The Lifecycle of a SPAC

 Sources:

https://www.marketsandmarkets.com/Market-Reports/gene-therapy-market-122857962.html?gclid=CjwKCAiA_eb-BRB2EiwAGBnXXuuMTUruQFdj5KL8TAfbMXS4xxjO1aSr-oYOTXmH-c77bqkZNsAO8RoC1O8QAvD_BwE

https://www.irdirect.net/prviewer/release_only/id/4433141

Stay up to date. Follow us:


Stay up to date. Follow us:

Release – Capstone Green Energy (CGRN) – Capstone Turbine Transforms Into Capstone Green Energy Corporation (Nasdaq: CGRN)


Capstone Turbine Corporation Celebrates Earth Day 2021 With Its Transformation Into Capstone Green Energy Corporation (Nasdaq: CGRN); Adding New Business Lines, Product Offerings And Network Partners


Capstone CEO, Darren Jamison Provides a Virtual New Company Overview

VAN NUYS, CA / ACCESSWIRE / April 22, 2021 / Capstone Turbine Corporation (www.capstoneturbine.com) (NASDAQ:CPST) (“Capstone” or the “Company”), the world’s leading manufacturer of clean technology microturbine energy systems, announced today that effective immediately it will become Capstone Green Energy Corporation (www.CapstoneGreenEnergy.com) (NASDAQ:CGRN), a global partner in carbon reduction and on-site resilient green energy solutions. Capstone Green Energy will be adding new business lines, product offerings, network partners, and services as part of the transition.

“This Earth Day, Capstone is celebrating our most tangible achievements in having shipped more than 10,000 units worldwide. Among other things, we estimate we helped customers reduce carbon emissions by approximately 397,000 tons annually in FY21 and saved them over $217 million in annual energy costs over the same time period,” said Capstone Green Energy Chief Executive Officer, Darren Jamison. “The Company is also using this day to announce a more intense focus on accelerating the market adoption of our unique, clean energy technologies and those of our network partners.”

“Our name is changing to reflect our evolution as a Company and the developments we are planning. While we have a new name, Capstone’s mission and goals for the future remain resolute, and that is to be a highly trusted partner providing energy conversion systems, microgrid solutions, energy as a service, and strategic energy management. Capstone Green Energy will help customers build and maintain smart energy infrastructure and engage with them as a long-term service provider and partner for their critical carbon saving initiatives,” added Jamison.

With this new name, Capstone demonstrates its intent to remain focused on clean energy technologies, while expanding its carbon reduction solutions portfolio to include new clean energy conversion technologies and battery storage offerings, as well as developing hydrogen-based products and bolstering its Energy as a Service (EaaS) business.

Virtual Company Overview

Capstone Green Energy Chief Executive Officer, Darren Jamison, will discuss the new developments in a virtual press release, which can be accessed here:

CGRN Virtual Press Release

New Capstone Green Energy

As a trusted energy solutions partner, Capstone places the power, literally and strategically, back into the hands of customers, by offering custom solutions that are designed to improve energy costs, reduce carbon footprints and provide energy resiliency. We will execute our strategy through four business lines.

  1. Energy as a Service (EaaS)
  2. Energy Conversion Products
  3. Energy Storage Products
  4. Hydrogen Solutions

EaaS is a growth area for Capstone Green Energy driven by its industry-leading Factory Protection Plan (FPP) service program and its ultra-low emission microturbine rental fleet, which currently stands at 10.6 megawatts (MW). At the same time, the Company’s Distributor Support System (DSS) subscription program generates increased marketing, branding, customer acquisition, documentation, and training of its worldwide Capstone distribution partners across 83 countries.

Leveraging its existing, reliable microturbine products, Capstone Green Energy is also proud to announce today that it is currently expanding its energy conversion and storage products with Baker Hughes 5 MW, 12 MW, and 16 MW industrial gas turbines. Capstone selected Baker Hughes as a network partner because of their similar focus on low emissions, long service intervals, low lifecycle costs, and hydrogen development program.

Capstone Green Energy is also introducing this quarter a new hybrid energy solutions product designed to meet a broad range of customized peak shaving and remote energy applications. Specifically, the Company will begin assembling modular hybrid energy stations and Lithium-Ion battery energy storage systems (BESS). These will be sold either individually or combined as part of a custom microturbine-battery storage solution.

Lastly, Capstone Green Energy will continue to expand and develop its Hydrogen Solutions business line. The Company recently demonstrated that it can safely run on a 10% hydrogen – 90% natural gas mix and is currently testing a 70% hydrogen – 30% natural gas configuration through its Research & Development partnership with Argonne National Laboratory. These are promising milestones on the development roadmap to 100% hydrogen solutions.

Changing Energy Landscape

Since the very first microturbine unit shipped more than 20 years ago from Capstone’s headquarters in Southern California, the clean energy landscape has shifted dramatically and includes a substantial increase in clean energy technologies and investments. This is being pushed even further by the rise in public awareness of climate issues and consumer preference.

According to Bloomberg, “In 2020, global investment in the low-carbon energy transition totaled $501.3 billion, up from $458.6 billion in 2019 and just $235.4 billion in 2010.” Investments in clean energy are driving markets and consumer decision-making now, as opposed to being viewed as promising technologies of the future.

“At Capstone Green Energy, we invite customers to partner with us in smart energy solutions to help lower their carbon footprint, increase cost efficiencies, and add resiliency to their business. This is also a reflection of how our customers’ customers view their businesses, and they are increasingly demanding green and sustainable products and services,” concluded Mr. Jamison.

This consumer choice is aptly demonstrated in a Nielsen study showing that “73% of consumers said they would likely change behavior to reduce their impact on the environment and sustainable and ethical business practices is the second-highest reason most consumers return to a brand, second only to product quality.”

Company History

In 1999, Capstone shipped its first commercial microturbine units and just a short time later announced to the world its clean energy focus in its Initial Public Offering that the Capstone MicroTurbine is a compact, environmentally friendly generator of electricity and heat. Our goal then was the same as it is now: Provide highly efficient, low-emission, cost-effective energy solutions in order to deliver on the promise of a sustainable clean energy future.

About Capstone Green Energy

Capstone Green Energy (www.CapstoneGreenEnergy.com) (NASDAQ: CGRN) is a leading provider of customized microgrid solutions and on-site energy technology systems focused on helping customers around the globe meet their environmental, energy savings, and resiliency goals. Capstone Green Energy focuses on four key business lines. Through its Energy as a Service (EaaS) business, it offers rental solutions utilizing its microturbine energy systems and battery storage systems, comprehensive Factory Protection Plan (FPP) service contracts that guarantee life-cycle costs, as well as aftermarket parts. Energy Conversion Products are driven by the Company’s industry-leading, highly efficient, low-emission, resilient microturbine energy systems offering scalable solutions in addition to a broad range of customer-tailored solutions, including hybrid energy systems and larger frame industrial turbines. The Energy Storage Products business line designs and installs microgrid storage systems creating customized solutions using a combination of battery technologies and monitoring software. Through Hydrogen Energy Solutions, Capstone Green Energy offers customers a variety of hydrogen products, including the Company’s microturbine energy systems.

For customers with limited capital or short-term needs, Capstone offers rental systems; for more information, contact: rentals@CGRNenergy.com. To date, Capstone has shipped over 10,000 units to 83 countries and in FY21, and estimates it saved customers over $217 million in annual energy costs and approximately 397,000 tons of carbon. Total savings over the last three years are estimated at 1,115,100 tons of carbon and $698 million in annual energy savings.

For more information about the Company, please visit: www.CapstoneGreenEnergy.com. Follow Capstone Green Energy on Twitter , LinkedInInstagramFacebook, and YouTube.

Cautionary Note Regarding Forward-Looking Statements

This release contains forward-looking statements as defined in the Private Securities Litigation Reform Act of 1995, including statements regarding expectations for green initiatives and execution on the Company’s growth strategy and other statements regarding the Company’s expectations, beliefs, plans, intentions, and strategies. The Company has tried to identify these forward-looking statements by using words such as “expect,” “anticipate,” “believe,” “could,” “should,” “estimate,” “intend,” “may,” “will,” “plan,” “goal” and similar terms and phrases, but such words, terms and phrases are not the exclusive means of identifying such statements. Actual results, performance and achievements could differ materially from those expressed in, or implied by, these forward-looking statements due to a variety of risks, uncertainties and other factors, including, but not limited to, the following: the ongoing effects of the COVID-19 pandemic; the availability of credit and compliance with the agreements governing the Company’s indebtedness; the Company’s ability to develop new products and enhance existing products; product quality issues, including the adequacy of reserves therefor and warranty cost exposure; intense competition; financial performance of the oil and natural gas industry and other general business, industry and economic conditions; the Company’s ability to adequately protect its intellectual property rights; and the impact of pending or threatened litigation. For a detailed discussion of factors that could affect the Company’s future operating results, please see the Company’s filings with the Securities and Exchange Commission, including the disclosures under “Risk Factors” in those filings. Except as expressly required by the federal securities laws, the Company undertakes no obligation to update or revise any forward-looking statements, whether as a result of new information, changed circumstances or future events or for any other reason.

CONTACT: Capstone Green Energy
Investor and investment media inquiries:
818-407-3628
ir@CGRNenergy.com

SOURCE: Capstone Green Energy Corporation

Capstone Green Energy (CGRN) – Capstone Turbine Transforms Into Capstone Green Energy Corporation (Nasdaq: CGRN)


Capstone Turbine Corporation Celebrates Earth Day 2021 With Its Transformation Into Capstone Green Energy Corporation (Nasdaq: CGRN); Adding New Business Lines, Product Offerings And Network Partners


Capstone CEO, Darren Jamison Provides a Virtual New Company Overview

VAN NUYS, CA / ACCESSWIRE / April 22, 2021 / Capstone Turbine Corporation (www.capstoneturbine.com) (NASDAQ:CPST) (“Capstone” or the “Company”), the world’s leading manufacturer of clean technology microturbine energy systems, announced today that effective immediately it will become Capstone Green Energy Corporation (www.CapstoneGreenEnergy.com) (NASDAQ:CGRN), a global partner in carbon reduction and on-site resilient green energy solutions. Capstone Green Energy will be adding new business lines, product offerings, network partners, and services as part of the transition.

“This Earth Day, Capstone is celebrating our most tangible achievements in having shipped more than 10,000 units worldwide. Among other things, we estimate we helped customers reduce carbon emissions by approximately 397,000 tons annually in FY21 and saved them over $217 million in annual energy costs over the same time period,” said Capstone Green Energy Chief Executive Officer, Darren Jamison. “The Company is also using this day to announce a more intense focus on accelerating the market adoption of our unique, clean energy technologies and those of our network partners.”

“Our name is changing to reflect our evolution as a Company and the developments we are planning. While we have a new name, Capstone’s mission and goals for the future remain resolute, and that is to be a highly trusted partner providing energy conversion systems, microgrid solutions, energy as a service, and strategic energy management. Capstone Green Energy will help customers build and maintain smart energy infrastructure and engage with them as a long-term service provider and partner for their critical carbon saving initiatives,” added Jamison.

With this new name, Capstone demonstrates its intent to remain focused on clean energy technologies, while expanding its carbon reduction solutions portfolio to include new clean energy conversion technologies and battery storage offerings, as well as developing hydrogen-based products and bolstering its Energy as a Service (EaaS) business.

Virtual Company Overview

Capstone Green Energy Chief Executive Officer, Darren Jamison, will discuss the new developments in a virtual press release, which can be accessed here:

CGRN Virtual Press Release

New Capstone Green Energy

As a trusted energy solutions partner, Capstone places the power, literally and strategically, back into the hands of customers, by offering custom solutions that are designed to improve energy costs, reduce carbon footprints and provide energy resiliency. We will execute our strategy through four business lines.

  1. Energy as a Service (EaaS)
  2. Energy Conversion Products
  3. Energy Storage Products
  4. Hydrogen Solutions

EaaS is a growth area for Capstone Green Energy driven by its industry-leading Factory Protection Plan (FPP) service program and its ultra-low emission microturbine rental fleet, which currently stands at 10.6 megawatts (MW). At the same time, the Company’s Distributor Support System (DSS) subscription program generates increased marketing, branding, customer acquisition, documentation, and training of its worldwide Capstone distribution partners across 83 countries.

Leveraging its existing, reliable microturbine products, Capstone Green Energy is also proud to announce today that it is currently expanding its energy conversion and storage products with Baker Hughes 5 MW, 12 MW, and 16 MW industrial gas turbines. Capstone selected Baker Hughes as a network partner because of their similar focus on low emissions, long service intervals, low lifecycle costs, and hydrogen development program.

Capstone Green Energy is also introducing this quarter a new hybrid energy solutions product designed to meet a broad range of customized peak shaving and remote energy applications. Specifically, the Company will begin assembling modular hybrid energy stations and Lithium-Ion battery energy storage systems (BESS). These will be sold either individually or combined as part of a custom microturbine-battery storage solution.

Lastly, Capstone Green Energy will continue to expand and develop its Hydrogen Solutions business line. The Company recently demonstrated that it can safely run on a 10% hydrogen – 90% natural gas mix and is currently testing a 70% hydrogen – 30% natural gas configuration through its Research & Development partnership with Argonne National Laboratory. These are promising milestones on the development roadmap to 100% hydrogen solutions.

Changing Energy Landscape

Since the very first microturbine unit shipped more than 20 years ago from Capstone’s headquarters in Southern California, the clean energy landscape has shifted dramatically and includes a substantial increase in clean energy technologies and investments. This is being pushed even further by the rise in public awareness of climate issues and consumer preference.

According to Bloomberg, “In 2020, global investment in the low-carbon energy transition totaled $501.3 billion, up from $458.6 billion in 2019 and just $235.4 billion in 2010.” Investments in clean energy are driving markets and consumer decision-making now, as opposed to being viewed as promising technologies of the future.

“At Capstone Green Energy, we invite customers to partner with us in smart energy solutions to help lower their carbon footprint, increase cost efficiencies, and add resiliency to their business. This is also a reflection of how our customers’ customers view their businesses, and they are increasingly demanding green and sustainable products and services,” concluded Mr. Jamison.

This consumer choice is aptly demonstrated in a Nielsen study showing that “73% of consumers said they would likely change behavior to reduce their impact on the environment and sustainable and ethical business practices is the second-highest reason most consumers return to a brand, second only to product quality.”

Company History

In 1999, Capstone shipped its first commercial microturbine units and just a short time later announced to the world its clean energy focus in its Initial Public Offering that the Capstone MicroTurbine is a compact, environmentally friendly generator of electricity and heat. Our goal then was the same as it is now: Provide highly efficient, low-emission, cost-effective energy solutions in order to deliver on the promise of a sustainable clean energy future.

About Capstone Green Energy

Capstone Green Energy (www.CapstoneGreenEnergy.com) (NASDAQ: CGRN) is a leading provider of customized microgrid solutions and on-site energy technology systems focused on helping customers around the globe meet their environmental, energy savings, and resiliency goals. Capstone Green Energy focuses on four key business lines. Through its Energy as a Service (EaaS) business, it offers rental solutions utilizing its microturbine energy systems and battery storage systems, comprehensive Factory Protection Plan (FPP) service contracts that guarantee life-cycle costs, as well as aftermarket parts. Energy Conversion Products are driven by the Company’s industry-leading, highly efficient, low-emission, resilient microturbine energy systems offering scalable solutions in addition to a broad range of customer-tailored solutions, including hybrid energy systems and larger frame industrial turbines. The Energy Storage Products business line designs and installs microgrid storage systems creating customized solutions using a combination of battery technologies and monitoring software. Through Hydrogen Energy Solutions, Capstone Green Energy offers customers a variety of hydrogen products, including the Company’s microturbine energy systems.

For customers with limited capital or short-term needs, Capstone offers rental systems; for more information, contact: rentals@CGRNenergy.com. To date, Capstone has shipped over 10,000 units to 83 countries and in FY21, and estimates it saved customers over $217 million in annual energy costs and approximately 397,000 tons of carbon. Total savings over the last three years are estimated at 1,115,100 tons of carbon and $698 million in annual energy savings.

For more information about the Company, please visit: www.CapstoneGreenEnergy.com. Follow Capstone Green Energy on Twitter , LinkedInInstagramFacebook, and YouTube.

Cautionary Note Regarding Forward-Looking Statements

This release contains forward-looking statements as defined in the Private Securities Litigation Reform Act of 1995, including statements regarding expectations for green initiatives and execution on the Company’s growth strategy and other statements regarding the Company’s expectations, beliefs, plans, intentions, and strategies. The Company has tried to identify these forward-looking statements by using words such as “expect,” “anticipate,” “believe,” “could,” “should,” “estimate,” “intend,” “may,” “will,” “plan,” “goal” and similar terms and phrases, but such words, terms and phrases are not the exclusive means of identifying such statements. Actual results, performance and achievements could differ materially from those expressed in, or implied by, these forward-looking statements due to a variety of risks, uncertainties and other factors, including, but not limited to, the following: the ongoing effects of the COVID-19 pandemic; the availability of credit and compliance with the agreements governing the Company’s indebtedness; the Company’s ability to develop new products and enhance existing products; product quality issues, including the adequacy of reserves therefor and warranty cost exposure; intense competition; financial performance of the oil and natural gas industry and other general business, industry and economic conditions; the Company’s ability to adequately protect its intellectual property rights; and the impact of pending or threatened litigation. For a detailed discussion of factors that could affect the Company’s future operating results, please see the Company’s filings with the Securities and Exchange Commission, including the disclosures under “Risk Factors” in those filings. Except as expressly required by the federal securities laws, the Company undertakes no obligation to update or revise any forward-looking statements, whether as a result of new information, changed circumstances or future events or for any other reason.

CONTACT: Capstone Green Energy
Investor and investment media inquiries:
818-407-3628
ir@CGRNenergy.com

SOURCE: Capstone Green Energy Corporation

Release – Lineage Cell Therapeutics (LCTX) – Announces Appointment Of Dr. Dipti Amin To Its Board Of Directors


Lineage Announces Appointment Of Dr. Dipti Amin To Its Board Of Directors


Medically Trained Senior Executive/Board Member with Extensive Experience in Clinical Research and Drug Development

CARLSBAD, Calif.–(BUSINESS WIRE)–Apr. 22, 2021– 

Lineage Cell Therapeutics, Inc.
 (NYSE American and TASE: LCTX), a clinical-stage biotechnology company developing novel cell transplants for serious medical conditions, today announced the appointment of Dr.  Dipti Amin, MBBS, FFPM, MRCGP, DCPSA, DCH, DRCOG, DGM, to the Company’s Board of Directors, effective as of 
April 20, 2021Dr. Amin is an experienced Non-Executive Director and a medically trained senior executive with broad expertise in medicine, pharmacology, healthcare, research, and product development.  Dr. Amin has more than 26 years of experience within the pharmaceutical sector and is accomplished across diverse functional areas including clinical research, drug development, ethics and compliance, and commercial operations. She currently serves as a Non-Executive Director on the board of directors of 

Buckinghamshire Healthcare National Health Service Trust
 and the 
University of Hertfordshire in the 
UK.

“We are honored that  Dr. Amin will be joining Lineage’s Board of Directors at this important time in the advancement of our mission to become the leading allogeneic cell transplant company,” stated  Al Kingsley, Lineage’s Chairman of the Board. “Dr. Amin has had leadership responsibility for many aspects of pharmaceutical product development and clinical trials and has worked with numerous sponsors on countless product candidates while at Quintiles (now IQVIA). We believe her breadth of experience in clinical research and drug development, as well as her medical expertise and practical operational experience, will be particularly valuable to our Board and management team as Lineage continues to advance its three product candidates toward later stage clinical trials. We look forward to her support in guiding our corporate, product, and clinical strategy as we position ourselves for years of growth in the field of cell therapy.”

“Lineage’s clinical-stage programs and platform technologies have the potential to transform outcomes for patients suffering from serious medical conditions,” stated  Dr. Amin. “I am excited about the opportunity to contribute to the Company’s future growth. I particularly look forward to helping guide the advancement of Lineage’s novel cell therapy product candidates toward later-stage clinical trials and the execution of other potentially valuable development activities, with an ultimate focus on transforming the lives of patients and creating value for the Company’s shareholders.”

Dipti Amin, MBBS, FFPM, MRCGP, DCPSA, DCH, DRCOG, DGM

Dipti Amin  is an experienced Non-Executive Director and medically trained senior executive with a passion for high quality pharmaceutical research and healthcare, and extensive commercial, leadership, operational experience, in the private & public sectors, in medicine, pharmacology and the highly-regulated healthcare & research sectors, as well as compliance expertise. Over a span of more than 26 years,  Dr. Amin has held positions of operational and strategic responsibility within Pharmaceutical Services at the C-suite and Board level, delivering consistently on growth, quality, customer, employee and process targets. Her broad experience covers Clinical Pharmacology, ethical issues in clinical research, drug development, ethics and compliance programs as well as leadership and management of large, multi-functional, multi-geography, global groups to deliver value-added, efficient growth and achieving business turnarounds.  Dr. Amin has extensive international operational experience, including in the 
U.S.
India
East Asia and 
Africa.

Dr. Amin spent more than 20 years at Quintiles Transnational (now IQVIA), the world’s largest provider of biopharmaceutical development & commercial outsourcing services. During her tenure,  Dr. Amin served in a number of senior executive roles including: Compliance; Ethics & Quality; Drug Safety and Medical Affairs; Medical and Scientific Services; Regulatory Affairs, Medical Writing and Strategic Drug Development; and Clinical Development and Scientific Operations.  Dr. Amin has successfully developed strategy and helped grow the P&L, sales & management for business units generating up to 
$600 million in revenue, while employing internationally based, multi-functional groups of highly qualified personnel.  Dr. Amin is an Honorary Lecturer in Clinical Pharmacology at Guy’s, King’s, and St. Thomas’ Hospitals Medical & Dental Schools.  Dr. Amin has also served on the Boards of 
Cambridge Innovation Capital and the Faculty of Pharmaceutical Medicine of the 
Royal College of Physicians, on the Innovation Board and Medical Expert Network of the 
Association of the British Pharmaceutical Industry, on a 
Department of Health Multi-centre Research Ethics Committee, on the 
Emerging Science and Bioethics Advisory Committee of the Dept. of Health, and on the 
Board of Governors of Heathfield School for Girls (The Girls’ 
Day School Trust).

Dr. Amin received her MB, BS (Bachelor of Medicine; Bachelor of Surgery) from 
Guys Hospital and St Thomas’ Hospitals (now GKT) 
Medical School in 1987. She holds the following certifications: DRCOG (Diploma of the 
Royal College of Obstetrics & Gynaecologists), DGM (Diploma in Geriatric Medicine of the 
Royal College of Physicians), MRCGP (Member of the 
Royal College of General Practitioners), DCH (Diploma in 
Child Health of the 
Royal College of Physicians), DCPSA (Diploma in Clinical Pharmacology), MFPM (Awarded Membership by Distinction of the Faculty of Pharmaceutical Medicine) and FFPM (Fellow of the Faculty of Pharmaceutical Medicine). Her clinical research work has been widely published in professional journals and textbooks, and she is a recognized presenter at international conferences.

About Lineage Cell Therapeutics, Inc. 

Lineage Cell Therapeutics is a clinical-stage biotechnology company developing novel cell therapies for unmet medical needs. Lineage’s programs are based on its robust proprietary cell-based therapy platform and associated in-house development and manufacturing capabilities. With this platform Lineage develops and manufactures specialized, terminally differentiated human cells from its pluripotent and progenitor cell starting materials. These differentiated cells are developed to either replace or support cells that are dysfunctional or absent due to degenerative disease or traumatic injury or administered as a means of helping the body mount an effective immune response to cancer. Lineage’s clinical programs are in markets with billion dollar opportunities and include three allogeneic (“off-the-shelf”) product candidates: (i) OpRegen®, a retinal pigment epithelium transplant therapy in Phase 1/2a development for the treatment of dry age-related macular degeneration, a leading cause of blindness in the developed world; (ii) OPC1, an oligodendrocyte progenitor cell therapy in Phase 1/2a development for the treatment of acute spinal cord injuries; and (iii) VAC, an allogeneic dendritic cell therapy platform for immuno-oncology and infectious disease, currently in clinical development for the treatment of non-small cell lung cancer. For more information, please visit www.lineagecell.com or follow the Company on Twitter @LineageCell.

Forward-Looking Statements

Lineage cautions you that all statements, other than statements of historical facts, contained in this press release, are forward-looking statements. Forward-looking statements, in some cases, can be identified by terms such as “believe,” “may,” “will,” “estimate,” “continue,” “anticipate,” “design,” “intend,” “expect,” “could,” “plan,” “potential,” “predict,” “seek,” “should,” “would,” “contemplate,” project,” “target,” “tend to,” or the negative version of these words and similar expressions. Such statements include, but are not limited to, statements relating to Lineage’s clinical advancement of its three product candidates, Lineage’s potential growth in the field of cell therapy, the potential of Lineage’s clinical-stage programs and platform technologies to help patients, and Lineage’s positioning for future success. Forward-looking statements involve known and unknown risks, uncertainties and other factors that may cause Lineage’s actual results, performance or achievements to be materially different from future results, performance or achievements expressed or implied by the forward-looking statements in this press release, including risks and uncertainties inherent in Lineage’s business and other risks described in Lineage’s filings with the 
Securities and Exchange Commission (SEC). Lineage’s forward-looking statements are based upon its current expectations and involve assumptions that may never materialize or may prove to be incorrect. All forward-looking statements are expressly qualified in their entirety by these cautionary statements. Further information regarding these and other risks is included under the heading “Risk Factors” in Lineage’s periodic reports with the 
SEC, including Lineage’s most recent Annual Report on Form 10-K filed with the 
SEC and its other reports, which are available from the SEC’s website. You are cautioned not to place undue reliance on forward-looking statements, which speak only as of the date on which they were made. Lineage undertakes no obligation to update such statements to reflect events that occur or circumstances that exist after the date on which they were made, except as required by law.

Lineage Cell Therapeutics, Inc. IR
Ioana C. Hone
(ir@lineagecell.com)
(442) 287-8963

Solebury Trout IR
Gitanjali Jain Ogawa
(Gogawa@soleburytrout.com)
(646) 378-2949

Russo Partners – Media Relations
Nic Johnson or  David Schull
Nic.johnson@russopartnersllc.com
David.schull@russopartnersllc.com
(212) 845-4242

Source: 
Lineage Cell Therapeutics, Inc.

Energy Fuels (UUUU)(EFR:CA) – Energy Fuels Signs New Supply Agreement to Process Rare Earth Elements

Thursday, April 22, 2021

Energy Fuels (UUUU)(EFR:CA)
Energy Fuels Signs New Supply Agreement to Process Rare Earth Elements

As of April 24, 2020, Noble Capital Markets research on Energy Fuels is published under ticker symbols (UUUU and EFR:CA). The price target is in USD and based on ticker symbol UUUU. Research reports dated prior to April 24, 2020 may not follow these guidelines and could account for a variance in the price target.

Energy Fuels is the largest uranium producer in the U.S. and holds more production capacity and uranium resources than any other U.S. producer. The Company also produces vanadium. Headquartered in Colorado, Energy Fuels holds three of America’s key uranium production centers: the White Mesa Mill in Utah, the Nichols Ranch ISR Facility in Wyoming, and the Alta Mesa ISR Facility in Texas. The producing White Mesa Mill is the only conventional uranium mill in the U.S. and has a licensed capacity of 8 million pounds of U3O8 per year. Nichols Ranch is in production and has a licensed capacity of 2 million pounds of U3O8 per year. Alta Mesa is currently on standby. Energy Fuels also owns several licensed and developed uranium and vanadium mines on standby and other projects in development.

Michael Heim, Senior Research Analyst, Noble Capital Markets, Inc.

Refer to the full report for the price target, fundamental analysis, and rating.

    Energy Fuels signed an memorandum of understanding with Hyperion Metals to process monazite sand from Hyperion’s Titan Project in Tennessee. The MOU does not specify the quantity of monazite to be processed, but we suspect the arrangement to be similar to Energy Fuels’ agreement with Chemours to process 2,500 tons/year by 2022. Further details will become available after Hyperion completes a mineral reserve estimate and other test work later in the year. Hyperion has released results from initial wells of a drilling program that confirm high concentrations of monazite, as well as titanium, zircon and silica.

    Energy Fuels indicates its intent to ramp up monazite processing at its White Mesa Mill to 15,000 tons/year or greater.  The announcement implies that management expects operations to grow rapidly and that future supply intake agreements could be announced. In addition to growing monazite processing, management has expressed an interest in separating rare earth elements (REE) removed from the …


Energy Fuels CEO Mark Chalmers recently sat down with Noble Capital Markets Senior Research Analyst Michael Heim for an exclusive interview. Topics included current projects, pricing, uranium reserves, supply and demand, vanadium, rare earths, and more.

Watch The ChannelCast Video Now

This Company Sponsored Research is provided by Noble Capital Markets, Inc., a FINRA and S.E.C. registered broker-dealer (B/D).

*Analyst certification and important disclosures included in the full report. NOTE: investment decisions should not be based upon the content of this research summary.  Proper due diligence is required before making any investment decision. 

CO2 Emissions by Country


CO2 Emissions by Country


Each Country’s Share of Emissions (GT=Gigaton)


Countries across the globe have varying populations and are at different stages of development which influences their CO2 output along with emitting other greenhouse gases into the atmosphere. The International Energy Agency has compiled related data in the pie chart above and tables below. The amount per country and amount per capita are startling in their differences.


The 21 Countries that Emitted the Most Carbon Dioxide  


Measured in gigatons, the top CO2-producing countries are among the most populous and industrial (above). Looking at how much CO2 is released per capita and the list provides a very different perspective. India moves down from #3 to #21, and Kazakstan which was #21 moves up to #2.


The story that emerges from this data is that, in general, developed countries and major emerging economy nations contribute the most in total carbon dioxide emissions while some developing nations lead in the average emitted carbon dioxide per resident.


Sources:

http://energyatlas.iea.org/#!/tellmap/1378539487

https://www.ucsusa.org/resources/each-countrys-share-co2-emissions


Stay up to date. Follow us:


Stay up to date. Follow us: