Digital, Media & Entertainment Industry – Quarterly Review & Outlook: What Kind Of Recovery Will It Be?

Tuesday, April 19, 2021

Digital, Media & Entertainment Industry
Quarterly Review & Outlook: What Kind Of Recovery Will It Be?

Michael Kupinski, DOR, Senior Research Analyst, Noble Capital Markets, Inc.

Refer to end of report for Analyst Certification & Disclosures

Overview. The Ride May Get A Little Bumpy. Investors appear eager to own companies that may benefit post pandemic. To that end, Media stocks outperformed the general market as measured by the S&P 500 Index in the last quarter and for the past year, with many stocks having doubled since November 2020. The outperformance is typical of an early stage economic and advertising recovery for these consumer cyclical stocks. But, there may be some headwinds looming. 

Broadcasting Television. Better Late Than Never. On April 1st, the Supreme Court upheld the relaxation of media ownership rules that the FCC tried to put in place, but was blocked by the Third District Court. These rules largely reflected cross ownership between owning a TV/Newspaper, TV/Radio and the number of radio and TV stations that one entity could own in a market. The Supreme Court ruling was not surprising, but could it pave the way for future FCC action on media ownership? 

Broadcast Radio. Diving Into Digital. Radio companies leaned into their digital growth strategies in the last quarter, highlighting the contributions of this growth-oriented business, which performed well even during the pandemic. Townsquare Media appears to be leading the way with nearly 50% of its revenues tied to Digital revenue. Most recently, one of the nation’s largest Radio companies rebranded its name from Entercom to Audacy to change the dynamics of the Radio industry and to recognize the key revenue growth driver for the company. 

Publishing. A Sweeter Offer. Tribune receives a competing bid of $18.50 per share, a substantial increase from the $17.25 per share from the Alden Group, which owns roughly 32% of the company. The latest offer inches closer to our original price target of $20.75. The question is whether the Alden Group walks away with an attractive return on its investment, as it did with the firm’s run at Gannett, or sweetens its offer?

Digital, Media & Technology. Taking A Breather? Most Digital Indices under performed the general market in Q1. The exceptions to the overall performance was notable. In this report, we highlight our coverage of Esports Entertainment and the fast growing industries of Esports and iGaming. Noble’s Esports/iGaming Index was up a strong 48% in Q1. While the pandemic adversely affected large stadium, in person tournament play, video gaming substantially increased due to stay at home mandates, What is the outlook post pandemic?

Overview

The Ride May Get A Little Bumpy 

Investors appear eager to own companies that may benefit from a post pandemic recovery. To that end, Media & Entertainment stocks outperformed the general market as measured by the S&P 500 Index in the last quarter and for the past year, with many stocks having doubled since November 2020. For the first time in a long while, traditional media companies outpaced the performance of the Digital Media group. The Media out-performance is typical of an early stage economic and advertising recovery for these consumer cyclical stocks. But, there may be some headwinds looming. Investors are likely to ponder these questions: Has the recovery in media stock valuations gone too far? How will the stocks react to the prospect of higher inflation? Will advertising continue to rebound with the prospect of increased corporate or personal taxes? And, how will the stocks perform in a period of rising interest rates. 

Stocks can climb a “wall of worry”, but it usually means that the road will become more bumpy. We look for a lot more volatility in the general market, as well as for these cyclical stocks, in coming months and quarters. In our view, stock valuations do not appear to be extended, with most stocks trading within historic five year trading average ranges. But, most media stocks have factored in a fairly robust recovery. In addition, for television stocks, there is anticipation that political advertising in 2022 may even exceed that of 2020, an historic political advertising year. It would be unusual for a biennial election year to exceed that of a presidential election year, but there has already been a record amount of money raised by politicians, PACs, and advocacy groups. For now, we see no reason to be less optimistic on the advertising front given significant economic stimulus. 

We believe that media stocks potentially have bigger headwinds with inflation, rising interest rates and taxes. In terms of inflation, historically media companies have been able to raise advertising rates faster than the rate of inflation. This was true until the advent of the Internet, when advertising deflation occurred. As such, the story is still out on whether advertising historic trends prevail. Certainly, in an inflationary environment, we would anticipate that there would be a contraction in cash flow multiples. On the tax front, as of now, the discussion relates to tax increases for those making $400,000 or more and for corporate tax rates to rise. State taxes appear to be generally going up as well. Generally, tax increases decrease discretionary disposable income and is negative for advertising. States appear to be seeking additional taxes, however, some even considering taxes on services, such as advertising. This would be a negative, potentially lowering margins for advertising driven companies. Finally, media stocks tend not to do well in periods of rising interest rates, which appears on the horizon. 

What are media investors to do? There is significant amount of stimulus, which should support a robust economic and advertising recovery. We believe that volatility likely will increase and stock valuation multiples likely will contract. As such, it is important for investors to be selective and seek “growthier” companies. Companies that have developed digital operations and those that are well positioned to grow above average in an economic recovery that may include higher inflation. Such companies in media exist and this report highlights a few of them including our favorites Esports Entertainment, Harte Hanks, Cumulus Media, Salem Media, Townsquare Media, Entravision, Gray Television and E.W. Scripps. 

Broadcast Television

What does the Supreme Court Ruling Mean?

On April 1st, the Supreme Court ruled that the Federal Communications Commission (FCC) was within its right to relax media ownership rules, particularly the newspaper/TV cross ownership, radio/TV cross ownership and the number of radio and television stations an operator could own in a single market and the number of TV stations an operator could own in a single market. These ownership rules were archaic. But, the Supreme Court decision to uphold the FCC’s relaxation of the ownership rules is not likely to change much.

First, many broadcast television companies sold or spun off newspaper operations long ago. This decision was largely based on the fact that public broadcast companies that owned newspapers traded at a discount to peers given the far lower multiple assigned to newspapers. In addition, many broadcasters with newspapers operations saw little synergies. 

The Supreme Court decision has more implications for a broadcaster owning 2 big four network stations in a market, commonly called the Big 4 rule. The Supreme Court decision paved the way for the FCC to loosen the restriction and allow the ownership of 2 “big four” network stations in the market. The FCC has rarely done this in the past since the combination would need to serve the public interest. It is unlikely that broadcasters would seek acquisitions to combine “big four” stations in a market given the high hurdle of the “public interest” and, especially, with the current administration that has been supportive of keeping ownership rules.

As such, the relaxation of these rules will not likely drive industry consolidation, nor did the Supreme Court ruling drive up media stocks, as some media outlets suggested. Investors are looking for the FCC to further lift television ownership rules, especially the current rule that limits television ownership to 39% of television households. We believe that this would be more important in driving industry consolidation. This is not expected to happen with the current administration. We believe that the recent rise in stock valuations relates to improving fundamentals.

Television investors are buoyed by core advertising gains that are expected in the first quarter and the upcoming easy comparison in the second quarter. On average, we believe that first quarter revenues are likely to be down 1% to 2% due to the heavy influx of political advertising in the first quarter 2020. The first quarter is not typically a huge political quarter, but last year was different, influenced by spending by billionaire presidential candidate Michael Bloomberg. Importantly, core advertising is expected to be up in March, which was not a huge political month. This bodes well for good advertising momentum in the second quarter.

The second quarter revenue comparisons will be much more favorable given significantly less political advertising and the year-earlier, advertising fallout from Covid 19. We estimate that industry mean revenues likely will increase as much as 18% in the second quarter. Looking forward toward the second half, comparisons will be difficult due to the year earlier historic influx of political advertising. All together, we expect television mean revenues to be down 2% to 3% for 2021. 

The Noble TV index increased a strong 21% in the first quarter, heavily influenced by the volatility in the shares of ViacomCBS. Nonetheless, most television broadcasters performed well in the first quarter and outperformed the S&P 500. We believe that investors are focused on the advertising recovery, which appears to be underway in the first quarter and into the second quarter. We believe that investors may give some pause in the enthusiasm for broadcast stocks heading into the second half, given the tough revenue comparisons to the year earlier heavy political advertising.

So, we are not looking for smooth sailing for the stocks in 2021. Nonetheless, we believe that investors should focus on 2022 and the prospect of an historic influx of political advertising. Many broadcasters indicated that political advertising could be greater than the record-breaking amount in 2020. This would be unprecedented, given that political advertising in biennial election years are usually lower than presidential election years. But there is a close balance of power in the House and Senate and there appears to be a record amount of money already raised by candidates and political groups. At this time, we anticipate that industry mean revenues will increase 15% in 2022. 

As the broadcast comparable chart indicates, television stocks do not appear to be overvalued, in spite of the recent out performance in the market. On average, stocks appear to trade at roughly 8 times enterprise value to 2022 cash flow estimates. In our view, this is within the range of historic trading averages between 8 to 12 times. As such, we believe that there is room for upside in the television group and reiterate our Outperform rating. We encourage investors to focus on our current favorites which include Entravision, E.W. Scripps and Gray Television. E.W. Scripps is an attractive political advertising play, but, also as a play on OTT broadcasting. For Gray, there is acquisition-fueled growth prospects. Entravision is an attractive recovery play as well as a play on acquisition fueled growth given its favorable, large cash position.


Broadcast Radio

Diving Into Digital

Radio companies leaned into their digital growth strategies in the last quarter, highlighting the contributions of this growth oriented business which performed well during the pandemic. Digital revenue grew roughly 8% in 2020 and is projected to accelerate to a strong 15% in 2021. The digital growth was significant given that traditional radio advertising declined an estimated 30% in 2020. The compelling digital revenue growth has been fueled by podcasts, but also reflect other digital initiatives including streaming, programmatic, and subscription businesses. Furthermore, digital revenue is expected to grow an attractive 10% for the next several years.

While traditional radio advertising is expected to have a recovery in 2021 as the economy reopens, we expect that traditional radio advertising is likely to struggle to reflect revenue growth thereafter given competition from alternative mediums. We estimate that traditional radio advertising will increase 15% in 2021, not fully recovering from the 30% drop in 2020. As a result, many radio companies are looking toward digital and other growth oriented businesses, including gambling and esports, as growth drivers.

Some radio companies have accelerated the trajectory of their digital revenue contribution through acquisitions. Entercom, now called Audacy, in March, purchased Podcorn, a company that connects advertisers to podcast content. This recent acquisition follows earlier purchases of Cadence13 and Pineapple Street Studios, establishing the company as a leading player in the podcast space. Notably, podcasting is the fastest growing segment of audio and is expected to increase a strong 41% in 2021 as forecasted by eMarketer. Furthermore, eMarketer projects that by 2024, 29% of digital audio ads will be derived from podcasts. Other companies, like UrbanOne, have looked outside of the audio space for growth. The company doubled down on its interests in casinos, partnering with the Colonial Downs owner, to build a casino in Richmond, Virginia.

While companies like Audacy have been playing catch up to transforming toward a digital, or even an entertainment-oriented company, through acquisitions, Townsquare Media has grown largely organically. Notably, with roughly 50% of its revenues derived from digital, Townsquare leads the way in the industry terms of diversified, growth oriented revenue streams. Recently, Townsquare management rolled out its “Digital First” strategy. Leading with its digital businesses is a change in strategy from the company’s “Local First” focus. But, the change is not surprising given the strong growth in its Digital businesses over the past year. Its Interactive subscription based business grew 14% in 2020. Furthermore, its programmatic business, Ignite, and other digital advertising revenue streams appear to be accelerating from that growth.  

As we look forward toward 2021, we believe that there will be a radio advertising recovery. Among our favorite radio advertising recovery play is Cumulus Media. Cumulus is expected to benefit from the radio advertising recovery given its less diversified revenue streams. We estimate that the company’s 2021 revenue growth will be roughly 12%. As the comparable chart shows below, the Cumulus shares trade among the lowest multiple of EV to EBITDA of the top tier Radio stocks.

In addition, as a diversified play, one with strong growth prospects in its Digital businesses, investors are encouraged to look at Salem Media. The company has significant Digital growth opportunities with is Salem Surround, its digital ad agency business, and SalemNow, an on demand pay-per-view video platform. Salem Surround, with over 3,000 customers, grew revenues strong double-digits in 2020 and the momentum continues into 2021. Furthermore, the company recently expanded its podcasting business with the launch of Salem Podcasting Network. 


Publishing

Tribune Publishing received a competing offer of $680.8 million, or $18.50 per share, for the company, beating the $634.8 million, or $17.25 per share, sweetened offer from hedge fund and largest Tribune shareholder, Alden Global Capital. Alden owns 31.6% of the TPCO shares outstanding. The $18.50 per share offer by Newslight, which is run by Stewart Bainum Jr., CEO of Choice Hotels, and Swiss billionaire Hansjoerg Wyss, was surprising, but not unrealistic. Alden agreed to sell the Baltimore Sun to a charity run by Bainum. That deal fell apart and Bainum formed a company to buy all of Tribune.

It appears that Newslight recognizes the sum of the parts valuation that we identified in our January 28, 2021 report, which indicated that the company could be worth as much as $20.75 per share, on a sum of the parts basis, recognizing the value of its unique newspaper assets and real estate holdings. Splitting up the company appears likely. Mason Slaine, a tech investor that has expressed interest in Tribune’s Florida newspapers, indicated plans to invest $100 million into the Newslight bid. Tribune’s special committee has determined that the Newslight’s offer would be a “superior proposal” to the Alden offer. 

So, what’s next and what should investors do? The move by the Special Committee allows the company to provide information to Newslight, which now can perform due diligence. It appears that Newslight has the financing available to complete their offer. The ball is in Alden’s court to determine if they would sweetened their offer to be “superior” to the Newslight offer. In our view, there is value left on the table to do that. But, investors should be mindful that Alden has walked away from the table before with its run at Gannett. 

In our view, investors have received the lion share of the upside in the TPCO shares. The prospective upside from here appears relatively modest. As such, investors should consider the opportunity costs of other potential investments. As such, we encourage investors to look at other of our favorite media names. 


Digital Media & Technology

Introducing Noble’s Esports and iGaming Index

Noble’s quarterly media newsletter has always covered seven distinct segments: four digital media sectors (Digital Media, Ad Tech, Marketing Tech, and Social Media) three traditional media sectors (TV, Radio and Publishing). With this edition, we are adding an Esports and iGaming sector, as advertising and sponsorships are key revenue categories for many esports companies. Over time, we expect sports betting and Esports betting to become larger revenue drivers of industry growth.

We have added 16 publicly traded companies to our new Esports and iGaming Index and comp sheet, with the two largest companies in the sector, Flutter Entertainment (ISE: FLTR, the owner of FanDuel) and DraftKings (ticker DKNG) accounting for 80% of the sector’s market cap.  Many companies in the sector are experiencing tremendous revenue growth (except for those that host live events) with organic growth augmented by acquisitions, and negative EBITDA margins as companies invest for growth.  Of the 16 companies in the sector, four are expected to generate positive EBITDA in 2021, but six companies are projected to do so in 2022.

The Esports/Gaming Noble Index increased 42.7% in the first quarter 2021, reflecting robust gains by several larger cap companies in the index. Companies with strong stock performance include Draft Kings, up 32.7% and BRAG, up 47%, which outperformed the general market as measured by the S&P 500 Index, which increased 5.8% in the comparable time frame. The strongest stock performances were from AESE, up 82.3%, SLGG, up 148.8%, SCR, up 124.5%, EGLX, up 106.2%, and, finally, Esports Entertainment, which is closely followed by Noble, up 136.4%.

Currently, one of our favored plays in the sector is Esports Entertainment. In our view, the company is establishing itself as a vertically integrated esports/gambling company. The company is expected to soon close on its Helix/ggCircuit acquisition, which will be one of the linchpins underscoring the company has a platform play in the space. 

Digital Stocks Take A Breather

Most Digital Media sectors under-performed the general market, as measured by the S&P 500 Index, in the first quarter, taking a breather from the strong year earlier stock performance. As the following figure illustrates, all of the digital media sectors outperformed the general market over the past 12 months, with a notably strong performance by the Noble Ad Tech Index, which increased an astounding 305%! 


That momentum faded as we entered 2021 as the digital stocks took a breather in the first quarter, with most digital sectors under-performing the general market. Only Noble’s Digital Media Index outperformed in the first quarter 2021, up roughly 13% versus the 6% gain by the S&P 500 Index. Noble’s Digital Media Index includes such company’s as Google, Spotify and Netflix, as well as closely followed Travelzoo. The Travelzoo shares increased a strong 110% from January 4th lows to recent highs in April. We believe that investors sought companies that would benefit as economies reopen, even global economies, and companies specifically related to the travel industry, the hardest hit during the pandemic. The other Digital sectors that under-performed in the first quarter were Noble’s Digital Technology Index, down 5%; Noble’s Ad Tech Index, down 2%; and, finally, Noble’s Social Media Index, up 5%.


Digital Advertising Continues its Double Digital Growth

On April 7, the Internet Advertising Bureau (IAB) released their 2020 internet advertising revenue report in conjunction with PricewaterhouseCoopers (PwC).  The report concluded that digital advertising in the U.S. increased by 12.2% to $139.8B in 2020 from $124.6B in 2019.  Growth was fueled by a strong rebound in digital advertising in the second half of the year, in which $80B, or 57% of the year’s total was booked.  Digital advertising of $45.6B in 4Q 2020 was the highest quarterly revenue number ever.  For perspective, the $80B of ad spend in the second half of 2020 was equivalent to the entirety of U.S. digital advertising in all of 2016. 

By quarter, digital advertising increased by 10.5% year-over-year in 1Q 2020, decreased by 5.2% in 2Q 2020 (when Covid-19 first hit), re-accelerated to 11.7% growth in 3Q 2020, and finished exceptionally strong with 28.7% in 4Q 2020.  Fourth quarter digital ad spend benefited from an influx of political advertising, but the bigger impact may have come from a “use or lose itâ€? mindset, in which ad budgets that weren’t spent earlier in the year were available to spend in the fourth quarter.

More importantly, digital ad spend in the U.S. was not just confined to the “duopolyâ€? of Google and Facebook, or the “tripoloyâ€? of Google, Facebook and Amazon Advertising.  According to the IAB, digital advertising revenues among the Top 10 companies grew by 14% in the U.S., as their share of ad spend increased to 78% in 2020 from 77% in 2019.  Ad spend from the fifteen next largest companies (companies 11-25 increased by 2.4% to $8B.  The remaining companies in the PwC universe were able to post revenue growth of 8.3% to $22B in 2020 from $20.3B in 2019.  The key take-away is that the size of the “open internetâ€? (after the “walled gardensâ€? of the top 10 companies) remains a sizable addressable market ($30B+ in the U.S. alone) and grew at an attractive rate of 7% (when excluding the top 10), despite what we believe was a double-digit decline in ad spend in 2Q 2020.

Internet and Digital Media M&A Activity Off to a Strong Start in 2021

In the first quarter of 2021, Noble tracked 167 M&A transactions in the internet and digital media sector, up 8% over the 154 transactions we tracked in the first quarter of 2020.  The most active sectors included digital content (54 deals), marketing technology (43), agency & analytics (29) and advertising technology (16).  Within the digital content sector, the most active subsector were companies in the gaming sector, such as game studios or mobile game developers.  There were $6.0B worth of M&A in the gaming/entertainment sector, with the largest being Electonics Art’s nearly $2.0B acquisition of mobile game developer Glu Mobile, followed by Embracer Group’s $1.4B acquisition of Gearbox Entertainment, as shown below. 

Among the stocks in the marketing technology space, investors should take a look at Harte Hanks. After a turbulent 2019 and 2020, the company appears to be on the mend, having restructured many of its vendor agreements, lowered infrastructure costs, and exited low margin businesses. The company has swung toward cash flow positive and has maintained a large cash position. This allows the company to service its debt and unfunded pension liabilities. Now, management appears to focus on driving the top line, a key element toward returning the company toward growth and positive free cash flow. The HRTH shares have had a strong performance so far this year, up 59% from January 4th lows to near current levels. We believe that the strong performance reflected favorable fourth quarter results, which reflected positive adjusted EBITDA.  


Companies mentioned in this report:

Cumulus Media

E.W. Scripps

Entravision

Esports Entertainment

Gray Television

Harte Hanks

Salem Media 

Townsquare Media

Travelzoo

Tribune Publishing

GENERAL DISCLAIMERS

All statements or opinions contained herein that include the words “we”, “us”, or “our” are solely the responsibility of Noble Capital Markets, Inc.(“Noble”) and do not necessarily reflect statements or opinions expressed by any person or party affiliated with the company mentioned in this report. Any opinions expressed herein are subject to change without notice. All information provided herein is based on public and non-public information believed to be accurate and reliable, but is not necessarily complete and cannot be guaranteed. No judgment is hereby expressed or should be implied as to the suitability of any security described herein for any specific investor or any specific investment portfolio. The decision to undertake any investment regarding the security mentioned herein should be made by each reader of this publication based on its own appraisal of the implications and risks of such decision.

This publication is intended for information purposes only and shall not constitute an offer to buy/sell or the solicitation of an offer to buy/sell any security mentioned in this report, nor shall there be any sale of the security herein in any state or domicile in which said offer, solicitation or sale would be unlawful prior to registration or qualification under the securities laws of any such state or domicile. This publication and all information, comments, statements or opinions contained or expressed herein are applicable only as of the date of this publication and subject to change without prior notice. Past performance is not indicative of future results.

Noble accepts no liability for loss arising from the use of the material in this report, except that this exclusion of liability does not apply to the extent that such liability arises under specific statutes or regulations applicable to Noble. This report is not to be relied upon as a substitute for the exercising of independent judgement. Noble may have published, and may in the future publish, other research reports that are inconsistent with, and reach different conclusions from, the information provided in this report. Noble is under no obligation to bring to the attention of any recipient of this report, any past or future reports. Investors should only consider this report as single factor in making an investment decision.

IMPORTANT DISCLOSURES

This publication is confidential for the information of the addressee only and may not be reproduced in whole or in part, copies circulated, or discussed to another party, without the written consent of Noble Capital Markets, Inc. (“Noble”). Noble seeks to update its research as appropriate, but may be unable to do so based upon various regulatory constraints. Research reports are not published at regular intervals; publication times and dates are based upon the analyst’s judgement. Noble professionals including traders, salespeople and investment bankers may provide written or oral market commentary, or discuss trading strategies to Noble clients and the Noble proprietary trading desk that reflect opinions that are contrary to the opinions expressed in this research report.

The majority of companies that Noble follows are emerging growth companies. Securities in these companies involve a higher degree of risk and more volatility than the securities of more established companies. The securities discussed in Noble research reports may not be suitable for some investors and as such, investors must take extra care and make their own determination of the appropriateness of an investment based upon risk tolerance, investment objectives and financial status.

Company Specific Disclosures

The following disclosures relate to relationships between Noble and the company (the “Company”) covered by the Noble Research Division and referred to in this research report.

Noble is not a market maker in any of the companies mentioned in this report. Noble intends to seek compensation for investment banking services and non-investment banking services (securities and non-securities related) with any or all of the companies mentioned in this report within the next 3 months

ANALYST CREDENTIALS, PROFESSIONAL DESIGNATIONS, AND EXPERIENCE

Director of Research. Senior Equity Analyst specializing in Media & Entertainment. 34 years of experience as an analyst. Member of the National Cable Television Society Foundation and the National Association of Broadcasters. BS in Management Science, Computer Science Certificate and MBA specializing in Finance from St. Louis University.

Named WSJ ‘Best on the Street’ Analyst six times.

FINRA licenses 7, 24, 66, 86, 87

WARNING

This report is intended to provide general securities advice, and does not purport to make any recommendation that any securities transaction is appropriate for any recipient particular investment objectives, financial situation or particular needs. Prior to making any investment decision, recipients should assess, or seek advice from their advisors, on whether any relevant part of this report is appropriate to their individual circumstances. If a recipient was referred to Noble Capital Markets, Inc. by an investment advisor, that advisor may receive a benefit in respect of transactions effected on the recipients behalf, details of which will be available on request in regard to a transaction that involves a personalized securities recommendation. Additional risks associated with the security mentioned in this report that might impede achievement of the target can be found in its initial report issued by Noble Capital Markets, Inc.. This report may not be reproduced, distributed or published for any purpose unless authorized by Noble Capital Markets, Inc..

RESEARCH ANALYST CERTIFICATION

Independence Of View
All views expressed in this report accurately reflect my personal views about the subject securities or issuers.

Receipt of Compensation
No part of my compensation was, is, or will be directly or indirectly related to any specific recommendations or views expressed in the public
appearance and/or research report.

Ownership and Material Conflicts of Interest
Neither I nor anybody in my household has a financial interest in the securities of the subject company or any other company mentioned in this report.

NOBLE RATINGS DEFINITIONS % OF SECURITIES COVERED % IB CLIENTS
Outperform: potential return is >15% above the current price 78% 31%
Market Perform: potential return is -15% to 15% of the current price 8% 3%
Underperform: potential return is >15% below the current price 0% 0%

NOTE: On August 20, 2018, Noble Capital Markets, Inc. changed the terminology of its ratings (as shown above) from “Buy” to “Outperform”, from “Hold” to “Market Perform” and from “Sell” to “Underperform.” The percentage relationships, as compared to current price (definitions), have remained the same.

Additional information is available upon request. Any recipient of this report that wishes further information regarding the subject company or the disclosure information mentioned herein, should contact Noble Capital Markets, Inc. by mail or phone.

Noble Capital Markets, Inc.
225 NE Mizner Blvd. Suite 150
Boca Raton, FL 33432
561-994-1191

Noble Capital Markets, Inc. is a FINRA (Financial Industry Regulatory Authority) registered broker/dealer.
Noble Capital Markets, Inc. is an MSRB (Municipal Securities Rulemaking Board) registered broker/dealer.
Member – SIPC (Securities Investor Protection Corporation)

Report ID: 12200

Sierra Metals (SMTS)(SMT:CA) – Updating Estimates Based on Lower-Than-Expected First Quarter Production

Monday, April 19, 2021

Sierra Metals (SMTS)(SMT:CA)
Updating Estimates Based on Lower-Than-Expected First Quarter Production

As of April 24, 2020, Noble Capital Markets research on Sierra Metals is published under ticker symbols (SMTS and SMT:CA). The price target is in USD and based on ticker symbol SMTS. Research reports dated prior to April 24, 2020 may not follow these guidelines and could account for a variance in the price target.

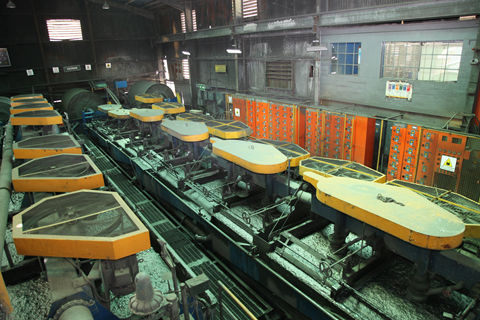
Sierra Metals Inc is a precious and base metals producer in Latin America. The company acquires, explores, extracts, and produces mineral concentrates consisting of silver, copper, lead, zinc and gold in Mexico and Peru. Its activity includes the operation of the Yauricocha Mine in Peru, and the Bolivar and Cusi mines in Mexico. Yauricocha is an underground polymetallic mine using the sublevel block caving and cut-and-fill mining methods. Bolivar is a copper-silver-zinc-gold underground mine using room-and-pillar mining method. The majority of the revenue is earned by selling of the mineral concentrates to its customers in Peru.

Mark Reichman, Senior Research Analyst of Natural Resources, Noble Capital Markets, Inc.

Refer to the full report for the price target, fundamental analysis, and rating.

    First quarter production was below expectations. First quarter production was negatively impacted by lower grades of ore mined at the Yauricocha and Bolivar mines. Copper, lead, and zinc production amounted to 7.9 million, 9.0 million, and 24.1 million pounds, respectively, while silver and gold production amounted to 961.0 and 2.6 thousand ounces. Copper production decreased 26% relative to the fourth quarter of 2020 and 33% compared to the prior year period.

    2021 production guidance unchanged.  First quarter production results were impacted by some transitory operational issues that resulted in production from lower grade ore bodies. Despite lower-than-expected production, the company is still expected to meet its forecasted production guidance ranges despite the ongoing challenges of the pandemic. Sierra Metals will release first quarter 2021 financial …


This Company Sponsored Research is provided by Noble Capital Markets, Inc., a FINRA and S.E.C. registered broker-dealer (B/D).

*Analyst certification and important disclosures included in the full report. NOTE: investment decisions should not be based upon the content of this research summary.  Proper due diligence is required before making any investment decision. 

Will Mortgage Forbearance Impact Other Markets?


A Look at Real Estate Risks to the Stock Market


Mortgage service providers, under a new rule, proposed last week, would be required to delay foreclosures on primary residences until after 2021. This proposed rule would affect all servicing lenders, not just FNMA, FHLB, FHA, and VA mortgages that had previously fallen under the original forbearance mandates in the CARES Act. Recent figures by the Consumer Protection Financial Bureau (CFPB) show nearly 3 million homeowners are behind on their mortgage payments presently. This is an improvement from the high last June when, according to data from the Mortgage Bankers Association (MBA), there were 4.3 million households in arrears or 8.53% of single-family home mortgages. This month (April 2021), the MBA reported an estimated 2.5 million homeowners, or 4.9%, are in forbearance. This is a very slight reduction from the 4.96% in forbearance recorded the month before.


About the Consumer Protection Finance Bureau

The CFPB was created in the aftermath of the 2008 financial crisis that triggered a huge increase in foreclosures. The agency is resolute to prevent that from happening in the current financial downturn and is encouraging lenders to be proactive about working with and protecting their borrowers from being forced out of their homes.


Importance of RE Markets
for Stock Investors

Still fresh in the minds of many is the impact the mortgage crisis of 2008 had on asset prices, including equities. Problems similar to 2008 were circumvented in 2020 even as unemployment spiked upward to 14.7% last April. The latest unemployment report for March shows only 6% unemployed. With millions behind on mortgage payments and landlords unable to evict renters for non-payment, investors need to determine if extensions to give more time to those behind on payments a solid solution to a unique problem, or a delay that may even exacerbate an inevitable economic problem. Theories and arguments can be found on both sides; some see forbearance as the piece that could have prevented devastation in 2008 and is now proving its effectiveness as the economy has put many people back to work. Others believe any delay in dealing with market-related pain only creates larger problems down the road.

Contrasting opinions and analysis are what markets. If we all thought “buy” was the only direction, or “sell” was the only sane action, there would be no market. With no one to take the other side of a trade, transactions would quickly cease. However, with economic orchestration in housing now measuring over 500 billion, being wrong (in either direction) could be costly to stock market investors. 

Therefore it’s necessary to understand both sides to the legitimized deference of payment (forbearance) reality. It has been extended before, and with its creation and extension, it either helps households out who will be better equipped to pay their mortgages or exacerbates a problem that will become larger as it has been allowed to fester.

Doomsayers Awaiting Opportunity

“Doom” may not be the right word.  Of those expecting that real estate will crumble and bring other assets with it, they see an opportunity for those that are keeping some powder dry as they wait for lower prices.

Fitting in this camp is Marc Snydeman. Marc is the Founder and CEO of Snyderman Law Group. His firm provides strategic business and legal solutions to small and medium-sized businesses. They also specialize in helping businesses grow, and investors find opportunities to disrupt and better marketplaces. Snyderman is positive on the opportunities the current situation will bring.  Marc’s reply to Channelchek when asked about his thinking was blunt. He said, ”The continued mortgage forbearances are essentially a ticking time bomb for real estate on both the residential and commercial sides that will affect the economy across the board. When the forbearance runs out after having that proverbial can kicked down the road multiple times the flood of foreclosures will likely eclipse 2008.” Although Snyderman recognizes the conditions are different than 2008, he believes there are big challenges and opportunities yet to come. “While there’s no securitization of those mortgages at risk like in 2008 the overall economic effects of this bomb going off will create significant issues and opportunities in real estate to pick up properties well below market value.” Snyderman said. It can be expected that any “across the board” negative economic impact could take stock prices down with it.


Light at End of the Tunnel

When the strong economy was abruptly altered for the novel coronavirus last March, unemployment spiked; meanwhile, delinquency rates on loans plunged. This is the opposite of what happened in the financial crisis of 2008 and in virtually all other downturns. For example, looking back to the financial crisis, mortgage delinquencies jumped from 2% to 8%. Compare this to the pandemic’s first seven months when they fell from 3% to 1.8%. Historically unemployment leads to mortgage foreclosures; depressed housing generally snowballs down, creating lower economic activity and higher defaults. This is why the CARES Act included a section requiring forbearance of federally insured mortgages (70% of all mortgages) was instituted.

The pandemic has not to date resulted in house price declines that history suggests should occur at some point. Keifer
Rowlands
of Keifer
Rowlands Real Estate
is a veteran real estate professional based in the Los Angeles area. Rowlands focuses on residential real estate and has experienced 25 years of market swings. He believes the current guidance and regulatory support is leading to a soft landing and suspects lower interest rates could place the economy in a stronger position later on.  “I think this will be a smooth ending for all involved. I’d urge everyone to think positive. All factors are pointing towards good news on the horizon — borrowers will likely return to the workforce, and now they will most likely have a lower house payment than they did before the pandemic. This suggests that with the return of the economy, a vast majority of borrowers that received forbearance will be in a position to bring their mortgage current and keep it there.” Keifer said. He doesn’t think this is misaligned with historical experience as he offered some additional history and how the lessons from it are helping today. “When banks did mortgage forbearance after the Great Recession they found that borrowers, unfortunately, ended up back in default at an alarming rate. Based on data from Freddie Mac, the current forbearance packages being offered to borrowers are not fairing significantly better. Freddie Mac states that last year after the 7th-month post forbearance, barely half of borrowers were current. There may be several factors that kept borrowers from being successful. The main reason is most likely that during this period that Freddie Mac analyzed the United States was still at a very high level of unemployment. The highest since the Great Recession (2007-2009). This means that with the end of the pandemic nearing, and the economy having record output and returning to full employment, the prospects for borrowers in forbearance are extremely positive.”

With unemployment levels now in the mid-single digits, any further improvement could bring many more borrowers who have deferred payments back from their hiatus. This would mean that a deeper asset value crisis was avoided.

Take-Away

Although the long-term correlation of stocks to real estate is only .20%, 2008 has shown us the potential impact in severe cases.  We also know the statistics for a deep recession; no matter the cause, takes everything except US Treasuries down with it. If the CFPB proposal eventually gets approved and foreclosure proceedings can’t start until next year, many more at-risk borrowers will likely find financially meaningful jobs, thereby getting back on mortgage track. The impact so far has been an increase in real estate prices that has served to prevent people from buying a home. Is this a bubble? How will all the borrowers who lost months repaying make up that time? What will be their ultimate cost? There are many factors in play, interest rates, joblessness, government-supported deferment, worker inertia, contract law, and tax impact.  Stock market investors need to keep aware of what is occurring in all the other markets, including real estate, as it could either provide an opportunity or signal a time to take some chips off the table. 

 Paul Hoffman

Managing Editor, Channelchek

Suggested Reading:

Space as a Lucrative Investment Space

Who Benefits from the American Jobs Plan?


How Much is a Trillion?

Michael Burry says COVID 19 Cure Worse than Disease (April 17, 2020)


Sources:

https://www.mba.org/2021-press-releases/april/mortgage-applications-decrease-in-latest-mba-weekly-survey-x278966

https://www.youtube.com/user/CitrusValleyRealtors

http://sp2018zaqfqqg.wpengine.com/

https://www.consumerfinance.gov/rules-policy/rules-under-development/protections-for-borrowers-affected-by-the-covid-19-emergency-under-the-real-estate-settlement-procedures-act-regulation-x/

https://www.whitehouse.gov/briefing-room/statements-releases/2021/03/29/fact-sheet-the-biden-harris-administrations-multi-agency-effort-to-support-renters-and-landlords/


Photo: Levittown, PA / Tom Sofield

Stay up to date. Follow us:


Stay up to date. Follow us:

Sierra Metals Inc. (SMT:CA)(SMTS) – Reports First Quarter 2021 Production Results


Sierra Metals Reports First Quarter 2021 Production Results


Maintaining Full-Year 2021 Production Guidance

(All metal prices reported in USD)

TORONTO–(BUSINESS WIRE)– Sierra Metals Inc. (TSX: SMT) (BVL: SMT) (NYSE AMERICAN: SMTS) (“Sierra Metals” or “the Company”) announces first quarter 2021 production results featuring 4.5% growth of consolidated ore throughput.

Results are from Sierra Metals’ three underground mines in Latin America: The Yauricocha polymetallic mine in Peru, and the Bolivar copper and Cusi silver mines in Mexico.

First Quarter 2021 Production Highlights

  • Silver production of 1.0 million ounces; a 1% increase from Q1 2020
  • Copper production of 7.9 million pounds; a 33% decrease from Q1 2020; mainly due to a temporary shift from copper-rich zones to lower grade polymetallic areas at Yauricocha caused by temporary operational challenges.
  • Lead production of 9.0 million pounds; a 1% decrease from Q1 2020
  • Zinc production of 24.1 million pounds; an 11% increase from Q1 2020
  • Gold production of 2,636 ounces; a 28% decrease from Q1 2020
  • Copper equivalent production of 25.5 million pounds; an 18% decrease from Q1 2020
  • Record quarterly throughput of 3,728 tpd at the Yauricocha Mine

The Yauricocha Mine achieved 14% higher throughput as compared to Q1 2020 despite the various operational challenges still posed by the COVID-19 pandemic. Lower grades for all metals negated the impact of higher throughput resulting in a 21% decrease in copper equivalent pounds produced during Q1 2021 compared to Q1 2020.

At Bolivar, a 2% decrease in throughput combined with lower grades for all metals resulted in a 20% decrease in copper equivalent pounds produced during Q1 2021 as compared to Q1 2020. At Cusi, 30% higher silver grades offset the impact of 2% lower throughput in Q1 2021 as compared to Q1 2020, resulting in 17% higher silver equivalent Q1 2021 production.

Luis Marchese, CEO of Sierra Metals, commented, “The health and safety of our work force and surrounding communities continues to be of the upmost importance and we continue to manage the implications of COVID-19 using best practices with a goal of avoiding any mine closures, while continuing to aim for production targets.”

He continued,“Facing ongoing operational difficulties due to Covid-19 in Peru and México, the Company performed relatively well during the first quarter with a 4.5% increase in consolidated throughout as well as record quarterly throughput at Yauricocha. These results were despite of other additional challenges, including a power failure at the Cusi Mine resulting from the large scale power outage originating in Texas. Additionally, at Yauricocha we experienced some operational issues at the Esperanza Zone which provides most of the copper ore for the mine. However, these have since been resolved and normal operations have resumed. Furthermore, the annual production guidance previously provided remains in place without any changes.”

He concluded,“The coming months continue to look challenging for the Company due to Covid-19 operational constraints at all mines but particularly in Peru. We expect to improve upon the first quarter production results and continue to work on completion of Preliminary Feasibility Studies for all three mines building upon the positive Preliminary Economic Assessments released in 2020. Brownfield and Greenfield Exploration continues, and we strive to optimize and improve operations with an aim of reducing costs where possible at all mines.”

Consolidated Production Results

Consolidated Production Q1 2021 Q1 2020

% Var.


Tonnes processed

774,421

740,698

5%

Daily throughput

8,851

8,465

5%


Silver production (000 oz)

961

948

1%

Copper production (000 lb)

7,895

11,775

-33%

Lead production (000 lb)

9,004

9,079

-1%

Zinc production (000 lb)

24,123

21,646

11%

Gold Production (oz)

2,636

3,657

-28%


Silver equivalent ounces (000’s)(1)

3,741

4,749

-21%

Copper equivalent pounds (000’s)(1)

25,496

31,182

-18%

Zinc equivalent pounds (000’s)(1)

79,778

84,477

-6%


(1) Silver equivalent ounces and copper and zinc equivalent pounds for Q1 2021 were calculated using the following realized prices: $26.44/oz Ag, $3.88/lb Cu, $1.24/lb Zn, $0.92/lb Pb, $1,778/oz Au. Silver equivalent ounces and copper and zinc equivalent pounds for Q1 2020 were calculated using the following realized prices: $16.57/oz Ag, $2.53/lb Cu, $0.93/lb Zn, $0.80/lb Pb, $1,585/oz Au.

Yauricocha Mine, Peru

The Yauricocha Mine processed 326,211 tonnes during Q1 2021, which is a 14% increase from Q1 2020, despite continuing to face various COVID-19 related operational challenges during the quarter.

Negative variances in grades resulted from the irregular contribution from the high-grade cuerpos chicos zones,due to lack of development as well as operational issues at the copper rich Esperanza Zone which has subsequently been corrected This led to a higher proportion of ore coming from the low-grade larger ore bodies. Q1 2021 metal production was 50%, 29% and 9% lower for copper, gold and silver respectively, while zinc and lead production were 11% and 1% higher as compared to Q1 2020.

A summary of production from the Yauricocha Mine for Q1 2021 is provided below:

Yauricocha Production Q1 2021 Q1 2020

% Var.


Tonnes processed

326,211

285,225

14%

Daily throughput

3,728

3,260

14%


Silver grade (g/t)

54.34

65.86

-17%

Copper grade

0.56%

1.14%

-51%

Lead grade

1.34%

1.56%

-14%

Zinc grade

3.71%

3.91%

-5%

Gold Grade (g/t)

0.43

0.69

-38%


Silver recovery

79.05%

82.01%

-4%

Copper recovery

66.26%

75.42%

-12%

Lead recovery

90.16%

87.91%

3%

Zinc recovery

90.34%

87.96%

3%

Gold Recovery

19.77%

19.89%

-1%


Silver production (000 oz)

451

495

-9%

Copper production (000 lb)

2,682

5,384

-50%

Lead production (000 lb)

8,706

8,608

1%

Zinc production (000 lb)

24,123

21,646

11%

Gold Production (oz)

890

1,254

-29%


Copper equivalent pounds (000’s)(1)

15,937

20,147

-21%

Zinc equivalent pounds (000’s)(1)

49,867

54,605

-9%


(1) Silver equivalent ounces and copper and zinc equivalent pounds for Q1 2021 were calculated using the following realized prices: $26.44/oz Ag, $3.88/lb Cu, $1.24/lb Zn, $0.92/lb Pb, $1,778/oz Au. Silver equivalent ounces and copper and zinc equivalent pounds for Q1 2020 were calculated using the following realized prices: $16.57/oz Ag, $2.53/lb Cu, $0.93/lb Zn, $0.80/lb Pb, $1,585/oz Au.

Bolivar Mine, Mexico

Mining operations at Bolivar in Q1 2021 were impacted by the lack of manpower due to COVID-19 and bad weather earlier during the quarter. As a result, the Bolivar mine processed 371,608 tonnes in Q1 2021, representing a 2% decrease from Q1 2020. Head grades were also impacted by delays in development attributable to COVID-19 issues. Grades for copper, silver and gold were 13%, 7% and 32% lower respectively, as compared to Q1 2020. The decrease in throughput and grades resulted in a 20% decrease in copper equivalent pounds produced during Q1 2021 as compared to Q1 2020. In Q1 2021, copper production decreased by 18% to 5.2 million pounds, silver production decreased 6% to 0.2 million ounces, and gold production decreased 27% to 1,591 ounces compared to Q1 2020.

A summary of production for the Bolivar Mine for Q1 2021 is provided below:

Bolivar Production Q1 2021 Q1 2020

% Var.


Tonnes processed (t)

371,608

377,562

-2%

Daily throughput

4,247

4,315

-2%


Copper grade

0.77%

0.89%

-13%

Silver grade (g/t)

19.68

21.09

-7%

Gold grade (g/t)

0.19

0.28

-32%


Copper recovery

82.80%

85.91%

-4%

Silver recovery

83.60%

82.01%

2%

Gold recovery

69.60%

63.89%

9%


Copper production (000 lb)

5,213

6,391

-18%

Silver production (000 oz)

197

210

-6%

Gold production (oz)

1,591

2,191

-27%


Copper equivalent pounds (000’s)(1)

7,285

9,147

-20%


(1) Silver equivalent ounces and copper and zinc equivalent pounds for Q1 2021 were calculated using the following realized prices: $26.44/oz Ag, $3.88/lb Cu, $1.24/lb Zn, $0.92/lb Pb, $1,778/oz Au. Silver equivalent ounces and copper and zinc equivalent pounds for Q1 2020 were calculated using the following realized prices: $16.57/oz Ag, $2.53/lb Cu, $0.93/lb Zn, $0.80/lb Pb, $1,585/oz Au.

Cusi Mine, Mexico

Operating at an average throughput of 875 tpd, Cusi processed 2% lower tonnes of ore in Q1 2021 as compared to Q1 2020. Silver grades were 30% higher than Q1 2020 as mining continued in the high-grade Northeast Southwest vein system. Silver production increased 29% to 0.3 million ounces, but gold and lead production were 27% and 37% lower due to lower grades for these metals. Additionally, production was impacted by the large scale power outage originating in Texas that was experienced during the quarter. Silver equivalent ounces produced for the quarter increased to 336,000 ounces or 17% higher as compared to Q1 2020.

A summary of production for the Cusi Mine for Q1 2021 is provided below:

Cusi Production Q1 2021 Q1 2020

% Var.


Tonnes processed (t)

76,602

77,911

-2%

Daily throughput

875

890

-2%


Silver grade (g/t)

157.22

120.88

30%

Gold grade (g/t)

0.16

0.18

-11%

Lead grade

0.22%

0.33%

-33%


Silver recovery (flotation)

80.91%

80.21%

1%

Gold recovery (lixiviation)

39.57%

46.53%

-15%

Lead recovery

81.46%

84.17%

-3%


Silver production (000 oz)

313

243

29%

Gold production (oz)

155

212

-27%

Lead production (000 lb)

298

471

-37%


Silver equivalent ounces (000’s)(1)

334

286

17%


(1) Silver equivalent ounces and copper and zinc equivalent pounds for Q1 2021 were calculated using the following realized prices: $26.44/oz Ag, $3.88/lb Cu, $1.24/lb Zn, $0.92/lb Pb, $1,778/oz Au. Silver equivalent ounces and copper and zinc equivalent pounds for Q1 2020 were calculated using the following realized prices: $16.57/oz Ag, $2.53/lb Cu, $0.93/lb Zn, $0.80/lb Pb, $1,585/oz Au.

Quality Control

All technical production data contained in this news release has been reviewed and approved by Americo Zuzunaga, FAusIMM (CP Mining Engineer) and Vice President of Corporate Planning is a Qualified Person and chartered professional qualifying as a Competent Person under the Joint Ore Reserves Committee (JORC) Australasian Code for Reporting of Exploration Results, Mineral Resources and Ore Reserves.

Augusto Chung, FAusIMM (CP Metallurgist) and Vice President Special Projects and Metallurgy and a chartered professional qualifying as a Competent Person on metallurgical processes.

About Sierra Metals

Sierra Metals Inc. is a diversified Canadian mining company focused on the production and development of precious and base metals from its polymetallic Yauricocha Mine in Peru, and Bolivar and Cusi Mines in Mexico. The Company is focused on increasing production volume and growing mineral resources. Sierra Metals has recently had several new key discoveries and still has many more exciting brownfield exploration opportunities at all three Mines in Peru and Mexico that are within close proximity to the existing mines. Additionally, the Company also has large land packages at all three mines with several prospective regional targets providing longer-term exploration upside and mineral resource growth potential.

The Company’s Common Shares trade on the Toronto Stock Exchange and the Bolsa de Valores de Lima under the symbol “SMT” and on the NYSE American Exchange under the symbol “SMTS”.

For further information regarding Sierra Metals, please visit www.sierrametals.com.

Continue to Follow, Like and Watch our progress:

Webwww.sierrametals.com | Twittersierrametals | FacebookSierraMetalsInc | LinkedInSierra Metals Inc | Instagramsierrametals

Forward-Looking Statements

This press release contains “forward-looking information” and “forward-looking statements” within the meaning of Canadian and U.S. securities laws related to the Company (collectively, “forward-looking information”). Forward-looking information includes, but is not limited to, statements with respect to the Company’s operations, including anticipated developments in the Company’s operations in future periods, the Company’s planned exploration activities, the adequacy of the Company’s financial resources, and other events or conditions that may occur in the future. Statements concerning mineral reserve and resource estimates may also be considered to constitute forward-looking statements to the extent that they involve estimates of the mineralization that will be encountered if and when the properties are developed or further developed. These statements relate to analyses and other information that are based on forecasts of future results, estimates of amounts not yet determinable and assumptions of management. Any statements that express or involve discussions with respect to predictions, expectations, beliefs, plans, projections, objectives, assumptions or future events or performance (often, but not always, using words or phrases such as “expects”, “anticipates”, “plans”, “projects”, “estimates”, “assumes”, “intends”, “strategy”, “goals”, “objectives”, “potential” or variations thereof, or stating that certain actions, events or results “may”, “could”, “would”, “might” or “will” be taken, occur or be achieved, or the negative of any of these terms and similar expressions) are not statements of historical fact and may be forward-looking information.

Forward-looking information is subject to a variety of risks and uncertainties, which could cause actual events or results to differ from those reflected in the forward-looking information, including, without limitation, the risks described under the heading “Risk Factors” in our Annual Information Form dated March 18, 2021 in respect of the year ended December 31, 2020 and other risks identified in the Company’s filings with Canadian securities regulators and the U.S. Securities and Exchange Commission, which filings are available at www.sedar.com and www.sec.gov, respectively.

The risk factors referred to above is not exhaustive of the factors that may affect any of the Company’s forward-looking information. Forward looking information includes statements about the future and are inherently uncertain, and the Company’s actual achievements or other future events or conditions may differ materially from those reflected in the forward-looking information due to a variety of risks, uncertainties and other factors. The Company’s statements containing forward-looking information are based on the beliefs, expectations and opinions of management on the date the statements are made, and the Company does not assume any obligation to update forward-looking information if circumstances or management’s beliefs, expectations or opinions should change, other than as required by applicable law. For the reasons set forth above, one should not place undue reliance on forward-looking information.

Mike McAllister
V.P., Investor Relations
Sierra Metals Inc.
+1 (416) 366-7777
Email: info@sierrametals.com

Luis Marchese
CEO
Sierra Metals Inc.
+1(416) 366-7777

Source: Sierra Metals Inc.

QuickChek – April 16, 2021


CoreCivic Announces Agreement In Principle to Settle Shareholder Litigation

CoreCivic announced that it has reached an agreement in principle to settle a purported securities class action lawsuit filed on August 23, 2016

Research, News & Market Data on CoreCivic

Watch recent presentation from NobleCon17


Neovasc Provides Tiara TA Update

Neovasc announced that the Tiara Transapical system (Tiara TA) will be unable to receive a European CE mark under the current Medical Device Directive regulations (MDD) ending on May 26, 2021.

Research, News & Market Data on Neovasc

Watch recent Virtual Roadshow Replay featuring Neovasc


Sierra Metals Reports First Quarter 2021 Production Results

Sierra Metals announced first quarter 2021 production results featuring 4.5% growth of consolidated ore throughput

Research, News & Market Data on Sierra Metals

Watch recent presentation from NobleCon17

Stay up to date. Follow us:

Release – CoreCivic (CXW) Announces Agreement In Principle to Settle Shareholder Litigation


CoreCivic Announces Agreement In Principle to Settle Shareholder Litigation

BRENTWOOD, Tenn., April 16, 2021 (GLOBE NEWSWIRE) — CoreCivic, Inc. (NYSE: CXW) (“CoreCivic”) announced today that it has reached an agreement in principle to settle a purported securities class action lawsuit filed on August 23, 2016, against CoreCivic and certain of its current and former officers in the United States District Court for the Middle District of Tennessee, captioned Grae v. Corrections Corporation of America et al.. The lawsuit was filed after the company’s stock price declined following issuance of an August 18, 2016 memorandum from the Department of Justice instructing the Federal Bureau of Prisons (“BOP”) to reduce and ultimately end the use of privately operated prisons.

“We are pleased to resolve this matter and put it behind us in order to focus on the Company’s business,” said Damon Hininger, CoreCivic’s President and Chief Executive Officer. “While we continue to believe the allegations in this case were without merit, we also believe that eliminating the risk, cost and distraction related to the litigation is in the best interest of CoreCivic and its shareholders.”

The monetary terms of the settlement of the Grae case include a payment by CoreCivic of $56 million in return for a dismissal of the Grae case with prejudice and a full release of all claims against all defendants, including CoreCivic and its current and former officers. The proposed settlement contains no admission of liability, wrongdoing, or responsibility by any of the defendants, including CoreCivic, and is subject to the negotiation and execution of a definitive settlement agreement among the parties, and court approval of such definitive settlement agreement. A jury trial for the case was previously scheduled to begin May 10, 2021.

This press release contains “forward-looking statements” within the meaning of federal securities laws. Words such as “will,” “should,” “expect,” “plans” and “intend” and similar expressions identify forward-looking statements, which include but are not limited to statements related to CoreCivic’s expectations regarding the agreement in principle to settle the Grae case. These forward-looking statements may be affected by risks and uncertainties in CoreCivic’s business and market conditions. This information is qualified in its entirety by cautionary statements and risk factor disclosures contained in CoreCivic’s Securities and Exchange Commission (“SEC”) filings, including CoreCivic’s Annual Report on Form 10-K for the fiscal year ended December 31, 2020 filed with the SEC on February 22, 2021. CoreCivic wishes to caution readers that certain important factors may have affected and could in the future affect CoreCivic’s actual results and could cause CoreCivic’s actual results for subsequent periods to differ materially from those expressed in any forward-looking statement made by or on behalf of CoreCivic. CoreCivic undertakes no obligation to update forward-looking statements to reflect events or circumstances after the date hereof.

About CoreCivic

CoreCivic is a diversified government solutions company with the scale and experience needed to solve tough government challenges in flexible, cost-effective ways. CoreCivic provides a broad range of solutions to government partners that serve the public good through corrections and detention management, a network of residential reentry centers to help address America’s recidivism crisis, and government real estate solutions. CoreCivic is the nation’s largest owner of partnership correctional, detention and residential reentry facilities, and believes it is the largest private owner of real estate used by government agencies in the U.S. CoreCivic has been a flexible and dependable partner for government for more than 35 years. CoreCivic’s employees are driven by a deep sense of service, high standards of professionalism and a responsibility to help government better the public good.

Contact:

Investors: Cameron Hopewell – Managing Director, Investor Relations – (615) 263-3024

Media: Steve Owen – Vice President, Communications – (615) 263-3107

Palladium One Mining Inc. (NKORF)(PDM:CA) – Shaping Up to be a Promising Open Pit Scenario

Friday, April 16, 2021

Palladium One Mining Inc. (NKORF)(PDM:CA)
Shaping Up to be a Promising Open Pit Scenario

Palladium One Mining Inc is a palladium dominant, PGE, nickel, copper exploration and development company. Its assets consist of the Lantinen Koillismaa and Kostonjarvi PGE-Cu-Ni projects, located in north-central Finland and the Tyko Ni-Cu-PGE and Disraeli PGE-Ni-Cu properties in Ontario, Canada. LK is targeting disseminated sulphide along 38 kilometers of favorable basal contact. The KS project is targeting massive sulphide within a 20,000-hectare land package covering a regional scale gravity and magnetic geophysical anomaly. Tyko is a 13,000-hectare project targeting disseminated and massive sulphide in a highly metamorphosed Archean terrain. Disraeli is a 2,500-hectare project targeting PGE-rich disseminated and massive sulphide in a highly productive Proterozoic mid-continent rift.

Mark Reichman, Senior Research Analyst of Natural Resources, Noble Capital Markets, Inc.

Refer to the full report for the price target, fundamental analysis, and rating.

    Phase II drilling program at the LK Project. In November 2020, the company began its 17,500-meter Phase II resource definition drilling program at its palladium-dominant Lantinen Koillismaa (LK) project in Finland. To date, 46 holes, representing 9,220 meters of drilling have been completed at Kaukua South. Results for 29 drill holes have been released, while 17 are pending. Drilling has focused on defining mineralization to a depth of 200 meters and continues to affirm continuity of near surface open pit grades and widths. Drilling at greater depth has also returned impressive results as demonstrated by Hole LK21-061 which returned 2.32 grams of palladium equivalent at 203.2 meters to 250.0 meters depth. Drilling has been paused for the spring thaw and is scheduled to resume in mid-May.
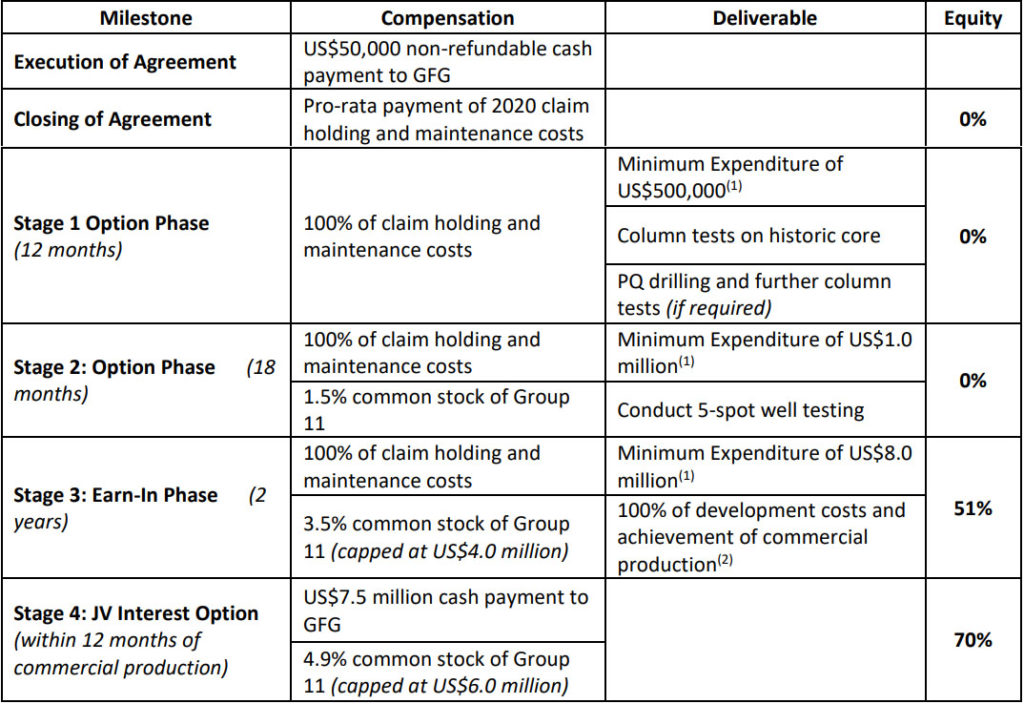
    Opportunity for a deeper open pit mine.  Kaukua South consists of two mineralized zones. The upper zone typically returns higher Cu-Ni values and lower PGE grades. While less continuous than the lower zone, it exhibits greater widths. The continuous lower zone, the focus of the drilling program, is like the Kaukua deposit with high PGE tenors. Management plans to increase the average drilling depth …


This Company Sponsored Research is provided by Noble Capital Markets, Inc., a FINRA and S.E.C. registered broker-dealer (B/D).

*Analyst certification and important disclosures included in the full report. NOTE: investment decisions should not be based upon the content of this research summary.  Proper due diligence is required before making any investment decision. 

Release – Neovasc (NVCN) Provides Tiara TA Update


Neovasc Provides Tiara TA Update

VANCOUVER and MINNEAPOLIS – (NewMediaWire) – April 16, 2021 – Neovasc Inc.(“Neovasc” or the “Company”) (NASDAQ,TSX: NVCN), today announced that the Tiara Transapical system (Tiara TA) will be unable to receive a European CE mark under the current Medical Device Directive regulations (MDD) ending on May 26, 2021. The Company is collaborating with its European Notified Body (the Notified Body) on potential next steps.

Neovasc has been working with its Notified Body for more than a year to obtain a decision on a CE Mark for Tiara TA, including an ongoing exchange of additional information beyond the original submission. The Company has determined that it will be unable to provide the additional information required by the Notified Body, which includes further testing data, before the current MDD regulations end next month.

The MDD is set to be replaced by the newer Medical Device Regulation (MDR) on May 26, 2021.A CE Mark under either the MDD or MDR regulations would allow the Company to commercialize the Tiara TA system in Europe.

We are disappointed that the MDD regulations are going to be replaced before we are able to gain CE Mark approval for the Tiara TA system, said Fred Colen, Chief Executive Officer Neovasc. We believe that the Tiara valve has shown to be a remarkable device and we are pleased with the safety and efficacy profile the device has displayed in clinical trials to date. Our team has worked tirelessly, and we believe we have made meaningful progress with our notified body during COVID-19 lockdowns to advance the approval process, but we have run out of time to complete the review before the transition to MDR next month, our previously announced target date for a CE mark decision.

The Company expects to provide an update at, or around, the upcoming Q1 2021 Earnings Call scheduled for early May.

The transition from MDD to MDR does not impact the Tiara transfemoral program (Tiara TF). The Company has always anticipated that Tiara TFs CE Mark submission would be assessed under MDR.


ABOUT NEOVASC INC.

Neovasc is a specialty medical device company that develops, manufactures and markets products for the rapidly growing cardiovascular marketplace. The Company is a leader in the development of minimally invasive transcatheter mitral valve replacement technologies, and minimally invasive devices for the treatment of refractory angina. Its products include Neovasc Reducer(TM), for the treatment of refractory angina, which is not currently commercially available in the United States and has been commercially available in Europe since 2015, and Tiara(TM), for the transcatheter treatment of mitral valve disease, which is currently under clinical investigation in the United States, Canada, Israel and Europe. For more information, visit: www.neovasc.com.


Investors

Mike Cavanaugh
Westwicke/ICR
Phone: +1.646.877.9641
Mike.Cavanaugh@westwicke.com

Media

SeanLeous
Westwicke/ICR
Phone: +1.646.866.4012
Sean.Leous@westwicke.com

Release – Sierra Metals Inc. (SMT:CA)(SMTS) – Reports First Quarter 2021 Production Results


Sierra Metals Reports First Quarter 2021 Production Results


Maintaining Full-Year 2021 Production Guidance

(All metal prices reported in USD)

TORONTO–(BUSINESS WIRE)– Sierra Metals Inc. (TSX: SMT) (BVL: SMT) (NYSE AMERICAN: SMTS) (“Sierra Metals” or “the Company”) announces first quarter 2021 production results featuring 4.5% growth of consolidated ore throughput.

Results are from Sierra Metals’ three underground mines in Latin America: The Yauricocha polymetallic mine in Peru, and the Bolivar copper and Cusi silver mines in Mexico.

First Quarter 2021 Production Highlights

  • Silver production of 1.0 million ounces; a 1% increase from Q1 2020
  • Copper production of 7.9 million pounds; a 33% decrease from Q1 2020; mainly due to a temporary shift from copper-rich zones to lower grade polymetallic areas at Yauricocha caused by temporary operational challenges.
  • Lead production of 9.0 million pounds; a 1% decrease from Q1 2020
  • Zinc production of 24.1 million pounds; an 11% increase from Q1 2020
  • Gold production of 2,636 ounces; a 28% decrease from Q1 2020
  • Copper equivalent production of 25.5 million pounds; an 18% decrease from Q1 2020
  • Record quarterly throughput of 3,728 tpd at the Yauricocha Mine

The Yauricocha Mine achieved 14% higher throughput as compared to Q1 2020 despite the various operational challenges still posed by the COVID-19 pandemic. Lower grades for all metals negated the impact of higher throughput resulting in a 21% decrease in copper equivalent pounds produced during Q1 2021 compared to Q1 2020.

At Bolivar, a 2% decrease in throughput combined with lower grades for all metals resulted in a 20% decrease in copper equivalent pounds produced during Q1 2021 as compared to Q1 2020. At Cusi, 30% higher silver grades offset the impact of 2% lower throughput in Q1 2021 as compared to Q1 2020, resulting in 17% higher silver equivalent Q1 2021 production.

Luis Marchese, CEO of Sierra Metals, commented, “The health and safety of our work force and surrounding communities continues to be of the upmost importance and we continue to manage the implications of COVID-19 using best practices with a goal of avoiding any mine closures, while continuing to aim for production targets.”

He continued,“Facing ongoing operational difficulties due to Covid-19 in Peru and México, the Company performed relatively well during the first quarter with a 4.5% increase in consolidated throughout as well as record quarterly throughput at Yauricocha. These results were despite of other additional challenges, including a power failure at the Cusi Mine resulting from the large scale power outage originating in Texas. Additionally, at Yauricocha we experienced some operational issues at the Esperanza Zone which provides most of the copper ore for the mine. However, these have since been resolved and normal operations have resumed. Furthermore, the annual production guidance previously provided remains in place without any changes.”

He concluded,“The coming months continue to look challenging for the Company due to Covid-19 operational constraints at all mines but particularly in Peru. We expect to improve upon the first quarter production results and continue to work on completion of Preliminary Feasibility Studies for all three mines building upon the positive Preliminary Economic Assessments released in 2020. Brownfield and Greenfield Exploration continues, and we strive to optimize and improve operations with an aim of reducing costs where possible at all mines.”

Consolidated Production Results

Consolidated Production Q1 2021 Q1 2020

% Var.


Tonnes processed

774,421

740,698

5%

Daily throughput

8,851

8,465

5%


Silver production (000 oz)

961

948

1%

Copper production (000 lb)
7,895

11,775

-33%

Lead production (000 lb)

9,004

9,079

-1%

Zinc production (000 lb)

24,123

21,646

11%

Gold Production (oz)

2,636

3,657

-28%


Silver equivalent ounces (000’s)(1)

3,741

4,749

-21%

Copper equivalent pounds (000’s)(1)

25,496

31,182

-18%

Zinc equivalent pounds (000’s)(1)

79,778

84,477

-6%


(1) Silver equivalent ounces and copper and zinc equivalent pounds for Q1 2021 were calculated using the following realized prices: $26.44/oz Ag, $3.88/lb Cu, $1.24/lb Zn, $0.92/lb Pb, $1,778/oz Au. Silver equivalent ounces and copper and zinc equivalent pounds for Q1 2020 were calculated using the following realized prices: $16.57/oz Ag, $2.53/lb Cu, $0.93/lb Zn, $0.80/lb Pb, $1,585/oz Au.

Yauricocha Mine, Peru

The Yauricocha Mine processed 326,211 tonnes during Q1 2021, which is a 14% increase from Q1 2020, despite continuing to face various COVID-19 related operational challenges during the quarter.

Negative variances in grades resulted from the irregular contribution from the high-grade cuerpos chicos zones,due to lack of development as well as operational issues at the copper rich Esperanza Zone which has subsequently been corrected This led to a higher proportion of ore coming from the low-grade larger ore bodies. Q1 2021 metal production was 50%, 29% and 9% lower for copper, gold and silver respectively, while zinc and lead production were 11% and 1% higher as compared to Q1 2020.

A summary of production from the Yauricocha Mine for Q1 2021 is provided below:

Yauricocha Production Q1 2021 Q1 2020

% Var.


Tonnes processed

326,211

285,225

14%

Daily throughput

3,728

3,260

14%


Silver grade (g/t)

54.34

65.86

-17%

Copper grade

0.56%

1.14%

-51%

Lead grade

1.34%

1.56%

-14%

Zinc grade

3.71%

3.91%

-5%

Gold Grade (g/t)

0.43

0.69

-38%


Silver recovery

79.05%

82.01%

-4%

Copper recovery

66.26%

75.42%

-12%

Lead recovery

90.16%

87.91%

3%

Zinc recovery

90.34%

87.96%

3%

Gold Recovery

19.77%

19.89%

-1%


Silver production (000 oz)

451

495

-9%

Copper production (000 lb)

2,682

5,384

-50%

Lead production (000 lb)

8,706

8,608

1%

Zinc production (000 lb)

24,123

21,646

11%

Gold Production (oz)

890

1,254

-29%


Copper equivalent pounds (000’s)(1)

15,937

20,147

-21%

Zinc equivalent pounds (000’s)(1)

49,867

54,605

-9%


(1) Silver equivalent ounces and copper and zinc equivalent pounds for Q1 2021 were calculated using the following realized prices: $26.44/oz Ag, $3.88/lb Cu, $1.24/lb Zn, $0.92/lb Pb, $1,778/oz Au. Silver equivalent ounces and copper and zinc equivalent pounds for Q1 2020 were calculated using the following realized prices: $16.57/oz Ag, $2.53/lb Cu, $0.93/lb Zn, $0.80/lb Pb, $1,585/oz Au.

Bolivar Mine, Mexico

Mining operations at Bolivar in Q1 2021 were impacted by the lack of manpower due to COVID-19 and bad weather earlier during the quarter. As a result, the Bolivar mine processed 371,608 tonnes in Q1 2021, representing a 2% decrease from Q1 2020. Head grades were also impacted by delays in development attributable to COVID-19 issues. Grades for copper, silver and gold were 13%, 7% and 32% lower respectively, as compared to Q1 2020. The decrease in throughput and grades resulted in a 20% decrease in copper equivalent pounds produced during Q1 2021 as compared to Q1 2020. In Q1 2021, copper production decreased by 18% to 5.2 million pounds, silver production decreased 6% to 0.2 million ounces, and gold production decreased 27% to 1,591 ounces compared to Q1 2020.

A summary of production for the Bolivar Mine for Q1 2021 is provided below:

Bolivar Production Q1 2021 Q1 2020

% Var.


Tonnes processed (t)

371,608

377,562

-2%

Daily throughput

4,247

4,315

-2%


Copper grade

0.77%

0.89%

-13%

Silver grade (g/t)

19.68

21.09

-7%

Gold grade (g/t)

0.19

0.28

-32%


Copper recovery

82.80%

85.91%

-4%

Silver recovery

83.60%

82.01%

2%

Gold recovery

69.60%

63.89%

9%


Copper production (000 lb)

5,213

6,391

-18%

Silver production (000 oz)

197

210

-6%

Gold production (oz)

1,591

2,191

-27%


Copper equivalent pounds (000’s)(1)

7,285

9,147

-20%


(1) Silver equivalent ounces and copper and zinc equivalent pounds for Q1 2021 were calculated using the following realized prices: $26.44/oz Ag, $3.88/lb Cu, $1.24/lb Zn, $0.92/lb Pb, $1,778/oz Au. Silver equivalent ounces and copper and zinc equivalent pounds for Q1 2020 were calculated using the following realized prices: $16.57/oz Ag, $2.53/lb Cu, $0.93/lb Zn, $0.80/lb Pb, $1,585/oz Au.

Cusi Mine, Mexico

Operating at an average throughput of 875 tpd, Cusi processed 2% lower tonnes of ore in Q1 2021 as compared to Q1 2020. Silver grades were 30% higher than Q1 2020 as mining continued in the high-grade Northeast Southwest vein system. Silver production increased 29% to 0.3 million ounces, but gold and lead production were 27% and 37% lower due to lower grades for these metals. Additionally, production was impacted by the large scale power outage originating in Texas that was experienced during the quarter. Silver equivalent ounces produced for the quarter increased to 336,000 ounces or 17% higher as compared to Q1 2020.

A summary of production for the Cusi Mine for Q1 2021 is provided below:

Cusi Production Q1 2021 Q1 2020

% Var.


Tonnes processed (t)

76,602

77,911

-2%

Daily throughput

875

890

-2%


Silver grade (g/t)

157.22

120.88

30%

Gold grade (g/t)

0.16

0.18

-11%

Lead grade

0.22%

0.33%

-33%


Silver recovery (flotation)

80.91%

80.21%

1%

Gold recovery (lixiviation)

39.57%

46.53%

-15%

Lead recovery

81.46%

84.17%

-3%


Silver production (000 oz)

313

243

29%

Gold production (oz)

155

212

-27%

Lead production (000 lb)

298

471

-37%


Silver equivalent ounces (000’s)(1)

334

286

17%


(1) Silver equivalent ounces and copper and zinc equivalent pounds for Q1 2021 were calculated using the following realized prices: $26.44/oz Ag, $3.88/lb Cu, $1.24/lb Zn, $0.92/lb Pb, $1,778/oz Au. Silver equivalent ounces and copper and zinc equivalent pounds for Q1 2020 were calculated using the following realized prices: $16.57/oz Ag, $2.53/lb Cu, $0.93/lb Zn, $0.80/lb Pb, $1,585/oz Au.

Quality Control

All technical production data contained in this news release has been reviewed and approved by Americo Zuzunaga, FAusIMM (CP Mining Engineer) and Vice President of Corporate Planning is a Qualified Person and chartered professional qualifying as a Competent Person under the Joint Ore Reserves Committee (JORC) Australasian Code for Reporting of Exploration Results, Mineral Resources and Ore Reserves.

Augusto Chung, FAusIMM (CP Metallurgist) and Vice President Special Projects and Metallurgy and a chartered professional qualifying as a Competent Person on metallurgical processes.

About Sierra Metals

Sierra Metals Inc. is a diversified Canadian mining company focused on the production and development of precious and base metals from its polymetallic Yauricocha Mine in Peru, and Bolivar and Cusi Mines in Mexico. The Company is focused on increasing production volume and growing mineral resources. Sierra Metals has recently had several new key discoveries and still has many more exciting brownfield exploration opportunities at all three Mines in Peru and Mexico that are within close proximity to the existing mines. Additionally, the Company also has large land packages at all three mines with several prospective regional targets providing longer-term exploration upside and mineral resource growth potential.

The Company’s Common Shares trade on the Toronto Stock Exchange and the Bolsa de Valores de Lima under the symbol “SMT” and on the NYSE American Exchange under the symbol “SMTS”.

For further information regarding Sierra Metals, please visit www.sierrametals.com.

Continue to Follow, Like and Watch our progress:

Webwww.sierrametals.com | Twittersierrametals | FacebookSierraMetalsInc | LinkedInSierra Metals Inc | Instagramsierrametals

Forward-Looking Statements

This press release contains “forward-looking information” and “forward-looking statements” within the meaning of Canadian and U.S. securities laws related to the Company (collectively, “forward-looking information”). Forward-looking information includes, but is not limited to, statements with respect to the Company’s operations, including anticipated developments in the Company’s operations in future periods, the Company’s planned exploration activities, the adequacy of the Company’s financial resources, and other events or conditions that may occur in the future. Statements concerning mineral reserve and resource estimates may also be considered to constitute forward-looking statements to the extent that they involve estimates of the mineralization that will be encountered if and when the properties are developed or further developed. These statements relate to analyses and other information that are based on forecasts of future results, estimates of amounts not yet determinable and assumptions of management. Any statements that express or involve discussions with respect to predictions, expectations, beliefs, plans, projections, objectives, assumptions or future events or performance (often, but not always, using words or phrases such as “expects”, “anticipates”, “plans”, “projects”, “estimates”, “assumes”, “intends”, “strategy”, “goals”, “objectives”, “potential” or variations thereof, or stating that certain actions, events or results “may”, “could”, “would”, “might” or “will” be taken, occur or be achieved, or the negative of any of these terms and similar expressions) are not statements of historical fact and may be forward-looking information.

Forward-looking information is subject to a variety of risks and uncertainties, which could cause actual events or results to differ from those reflected in the forward-looking information, including, without limitation, the risks described under the heading “Risk Factors” in our Annual Information Form dated March 18, 2021 in respect of the year ended December 31, 2020 and other risks identified in the Company’s filings with Canadian securities regulators and the U.S. Securities and Exchange Commission, which filings are available at www.sedar.com and www.sec.gov, respectively.

The risk factors referred to above is not exhaustive of the factors that may affect any of the Company’s forward-looking information. Forward looking information includes statements about the future and are inherently uncertain, and the Company’s actual achievements or other future events or conditions may differ materially from those reflected in the forward-looking information due to a variety of risks, uncertainties and other factors. The Company’s statements containing forward-looking information are based on the beliefs, expectations and opinions of management on the date the statements are made, and the Company does not assume any obligation to update forward-looking information if circumstances or management’s beliefs, expectations or opinions should change, other than as required by applicable law. For the reasons set forth above, one should not place undue reliance on forward-looking information.

Mike McAllister
V.P., Investor Relations
Sierra Metals Inc.
+1 (416) 366-7777
Email: info@sierrametals.com

Luis Marchese
CEO
Sierra Metals Inc.
+1(416) 366-7777

Source: Sierra Metals Inc.

The Lifecycle of a SPAC


Lifecycle of a Special Purpose Acquisition Company
(Part of a Channelchek Series on SPACs)


Special purpose acquisition companies (SPACs) are essentially shell companies. That is to say; they have no business activities, just a legal structure. On the path to becoming a SPAC, the shell company applies for a listing on a stock exchange to raise money with the intent to use the capital to acquire a business.  While there is a lot of information available to consume surrounding the magnitude of 2020s SPAC activity (up 400%), or the more accelerated level of deals in 2021, our readers have told us they would like more information regarding the structure of these opportunities, how they might become involved, where research might be found on acquisition targets, common terms used, and risks.

Lifecycle
of a SPAC
is the first of what will be ongoing educational pieces published by Channelchek on the subject. From it, you should gain a better understanding of:

  • How the initial SPAC comes into being and the risk and rewards of the SPAC founders
  • Expectations, contractual and otherwise of all parties
  • The fate of the minority SPAC shareholders that reject a target for acquisition of an upvoted company
  • How SPACs differ from traditional IPOs

At its
Most Basic

All SPACs originate with an initial formation, which is then followed by its IPO. After there is a search for a target acquisition. Once found, there is a shareholder merger vote, with approval by shareholders, the acquisition is close upon. Should no identified target be acceptable to shareholders, after an agreed-upon time frame spelled out during the SPAC formation, proceeds are returned to the initial investors. 

Five Main Steps from SPAC to De-SPAC


Life Cycle

FORMATION
– Step One

 At the outset, when a SPAC is created, the sponsor and often its management team contribute a relatively small amount for a cash stake in the investment offering; this “skin-in-the-game” is referred to as “founders’ stock.”  The stock of these founding investors is generally 20 percent of the stock after the SPACs initial public offering.  This is their compensation for creating the shell company, identifying a suitable target, and closing the merger. The sponsor that is managing parts of the structure may lend use of the founder’s contribution to fund ongoing expenses. In addition, the SPAC selects legal counsel and underwriters and establishes its governing documents.


INITIAL
PUBLIC OFFERING (IPO) – Step Two

After the SPAC is created and all of the defining documents, including legal existence are in place, the shell corp begins the public offering process with the intent to find a suitable target.  This includes the SPAC filing with the SEC, an initial registration statement. The SPAC then typically raises capital by issuing units (these often consist of common shares and warrants); the proceeds raised are held in a trust and not released until a target is acquired or funds returned to investors.

After the offering, the units are separated into shares of common stock and tradable warrants. The warrants are designed to minimize dilution yet provide added compensation for the initial investors. They are often exercisable within a short time frame after a merger is completed.


TARGET
SEARCH
– Step
Three

The search for a suitable acquisition includes the sponsors vetting potential businesses through a ramped-up financial and legal due diligence process. Historically, SPACs had been focused on companies with a positive EBITDA. More common targets since 2020 have been a pre-revenue “story-stock.” These are at times referred to as a “unicorn,” ie, it is so special that its apparent value creates enthusiasm.

There is a timeline defined prior to the SPAC IPO to close an acquisition, it depends on multiple factors. One factor is that dissenting SPAC shareholders have the right to redeem shares; this could create uncertainty regarding the amount of funding available to pay target shareholders and to cover months of operating expenses after closing. This often leads to SPACs, and the acquired to negotiate “minimum cash” on closing. For this reason, SPAC acquisitions often include a simultaneous Private Investment in Public Equity (PIPE) upon merging.


SHAREHOLDER
VOTE – Step Four

SEC proxy rules and approval of corporate bylaws typically require shareholder acceptance before the completion of the de-SPAC process. With this, the completion of a merger typically requires the entities to file a proxy with the SEC, obtain and respond to the SEC’s comments, mail the proxy to the SPAC’s shareholders, and hold a shareholder meeting. The sponsor and other founding shareholders committed as they founded the entity to vote their interest which is typically 20% in favor of a transaction, this decreases the number of additional common shares needed to vote in favor of the merger.


ACQUISITION
CLOSE – Step Five

If an affirmative majority vote is obtained from the proxy process, the target acquisition can close by merging into the SPAC, then the target company becomes a reorganized publicly traded entity. A Super 8-K must be filed within four days of the acquisition. It contains substantially the same information that would be required in a registration statement for companies that go through a traditional IPO. Further, the sponsor’s founders’ shares and warrants are locked up for a specified period (the “lock-up period”) starting from the date of the Super 8-K filing. The lock-up period is typically one year and was decided at the early stages of the SPAC.

Other
Information

The public offering steps of a SPAC differ from that of a traditional IPO in at least one very important way.  The target company, if it is eventually acquired, was not involved in the formation of the SPAC or the IPO. Instead, the terms of the offering in a SPAC IPO and the agreements the SPAC has with their management team, and sponsor, takes the lead role. They decide the value that the acquired company investors extract from any SPAC merger.


Related Channelchek
Articles:

Will 2020 go Down as the Year of the SPAC (July 27, 2020)

SPAC Activity Accelerating in 2020 (August 21, 2020)


Stay up to date. Follow us:


Stay up to date. Follow us:

Group 11 Technologies – Signs Option Agreement with GFG to Advance the Rattlesnake Hills Gold Project


Group 11 Technologies Signs Option Agreement with GFG to Advance the Rattlesnake Hills Gold Project with Revolutionary Technology

Environmentally Friendly Solutions and In Place Mining to Extract Precious Metals

April 14, 2021, Dallas, Texas: Group 11 Technologies Inc. (“Group 11”) is pleased to announce it has signed an option and earn-in agreement (the “Agreement”) with GFG Resources Inc. (TSXV: GFG) (OTCQB: GFGSF) (“GFG”) to advance GFG’s Rattlesnake Hills Gold Project (the “Project”) in Wyoming, United States. Under the terms of the Agreement, Group 11 has the right to acquire, in multiple stages, up to 70% of the Project by completing a series of exploration and development expenditures (“Expenditures”) as summarized below and making staged cash and equity payments to GFG.

Group 11 Technologies Inc. is led by a group of technical pioneers and experts in the development and application of in-situ recovery (“ISR”) with significant experience operating in Wyoming. Group 11’s goal is to combine ISR, a non-invasive extraction technology, with an environmentally friendly water-based chemistry to recover gold and other metals, providing an alternative development path to conventional open pit and underground mineral extraction.

The Rattlesnake Hills Gold Project is viewed as an ideal test project for Group 11 for the following reasons:

  • Wyoming is a top United States mining jurisdiction with regulators who understand and effectively legislate ISR better than anywhere else in the US;
  • Gold grades throughout the system vary from low to high allowing for testing various grades response to the ISR process;
  • Gold occurs in a variety of geological settings, allowing for testing of various styles of mineralization;
  • Gold occurs across a large physical area allowing for testing under various lithostatic conditions across and through several rock types and chemistries;
  • Gold occurs under relatively accessible topography, an important consideration for wellfield development.

Live Webcast – April 15, 2021

Management of GFG and Group 11 will host a webcast on Thursday, April 15 at 10:00 am Eastern Standard

Time (7:00 am Pacific Standard Time) to discuss the Agreement, Group 11’s innovative technology, the

upcoming programs and to answer any questions from shareholders. Shareholders, analysts, investors, and media are invited to join the live webcast by registering using the link below.

Link: https://6ix.com/event/gfg-and-group11/

After registering, you will receive a confirmation email containing details to access the webinar via conference call or webcast. A replay of the webcast will be available following the conclusion of the call.

“Group 11 is very excited to establish its first anchor project with GFG and the Rattlesnake Hills Gold Project. Rattlesnake hosts all the necessary parameters, in a well-established jurisdiction, to test and apply the combination of ISR technology and our exclusive use of EnviroLeach’s non-cyanide water based chemistry for ISR applications,” said Janet Lee-Sheriff, President of Group 11. “We already have successfully tested the EnviroLeach non-cyanide chemistry on sulfide concentrates and achieved optimal results in shorter timelines than cyanide. The recyclability of the environmentally-friendly chemistry makes it an attractive ingredient in ISR technology and an alternative to cyanide for gold recovery. Group 11 will commence first stage lab test work on drill core in the summer of 2021 and we look forward to advancing our work to develop new solutions for the mineral extraction industry.”

“We are excited to have entered into a partnership with Group 11 to advance our Rattlesnake Hills Gold Project and be part of a technology that could revolutionize the gold mining industry,” stated Brian Skanderbeg, President and CEO of GFG. “Our Project is the ideal asset to test and optimize Group 11’s technology given the character of the mineralized systems, significant zones of gold mineralization and the established permitting path for ISR mining in Wyoming. This is an exciting development for our shareholders and stakeholders as we work with our partners to develop and apply ISR technology to gold systems. Over the last several decades, this technology has been successfully applied in both uranium and copper mining, driving significantly reduced development timeframes, lower capital intensity and materially reduced environmental impacts. We believe in its potential to be equally applicable to the gold space.”

Terms of the Agreement

Under the terms of the Agreement, Group 11 has a right to earn 70% interest in the Project over a six- year period by:

  • Incurring a minimum of US$9.5 million in Expenditures.
  • Paying 100% of holding and maintenance costs related to the Project.
  • Covering all Expenditures to advance the Project into commercial production.
  • Making staged equity payments to GFG of Group 11 common stock of up to 9.9% of Group 11’s common shares issued and outstanding on a fully-diluted basis.
  • Making a cash payment of US$7.5 million.

Summary of Agreement Stages


(1) Minimum expenditures exclude holding and maintenance costs.

(2) Commercial production is deemed as a rate of not less than 50% of the feasibility study-rated annual capacity.

Additional terms:

  • Closing of the Agreement is conditional upon Group 11 raising a minimum of US$1.5 million within 45 days after the execution of the Agreement.
  • The Agreement contains pre-emptive rights provisions should either party elect to sell its interest in the Project.
  • Group 11 has the option to extend any stage for 12 additional months by making a US$500,000 cash payment to GFG.
  • Group 11 will act as manager on the Project.

The Rattlesnake Hills Gold Project

The Rattlesnake Hills Gold Project is a district-scale gold exploration project located in central Wyoming approximately 100 kilometres southwest of Casper. Geologically, the Project is centrally located within a roughly 1,500-kilometre-long belt of alkalic intrusive complexes that occur along the eastern side of the Rocky Mountains from Montana to New Mexico, several of which are associated with multiple gold deposits.

The Project has approximately 100,000 metres (“m”) of historic drilling which has outlined three significant zones of alteration and precious metal mineralization that are associated with Eocene age alkalic intrusions at North Stock, Antelope Basin and Blackjack. The majority of the drilling has focused on near-surface, open pit mineralization in the North Stock and Antelope Basin deposits with highlights that include intercepts(3) of 1.85 grams of gold per tonne (g/t Au) over 236.2 m hole length; 4.20 g/t Au over

77.7 m hole length; 2.08 g/t Au over 150.9 m hole length and 0.82 g/t Au over 99.1 m hole length. In addition  to  the  outlined  zones  of  mineralization,  the  Company  believes  that  the  district  is  highly

prospective and has outlined several kilometre-scale greenfield targets that have never been drill tested. These greenfield targets were generated from the Company’s geophysical and geochemical programs and host strong similarities to the North Stock and Antelope Basin systems.

(3) Gold intervals reported are based on a 0.20 g/t or 0.50 g/t Au cutoff. Weighted averaging has been used to calculate all reported intervals. True widths are estimated at 60-100% of drilled thicknesses.

Qualified Persons

Brian Skanderbeg, P.Geo. and M.Sc., serves as President and CEO of GFG, and is a “qualified person” within the meaning of National Instrument 43-101 – Standards of Disclosure for Mineral Projects. Mr. Skanderbeg has reviewed the respective core intervals, sampling and QA/QC procedures and results thereof as verification of the historical drilling data disclosed above and has approved the information contained in this news release.

About GFG Resources Inc.

GFG Resources is a North American precious metals exploration company focused on district scale gold projects in tier one mining jurisdictions, Ontario and Wyoming. In Ontario, the Company owns 100% of the Pen and Dore gold projects, two large and highly prospective gold properties west of the prolific gold district of Timmins, Ontario, Canada. The Pen and the Dore gold projects have similar geological settings that host most of the gold deposits found in the Timmins Gold Camp which have produced over 70 million ounces of gold. The Company also owns 100% of the Rattlesnake Hills Gold Project, a district scale gold exploration project located approximately 100 kilometres southwest of Casper, Wyoming, U.S. The geologic setting, alteration and mineralization seen in the Rattlesnake Hills are similar to other gold deposits of the Rocky Mountain alkaline province which, collectively, have produced over 50 million ounces of gold.

About Group 11 Technologies Inc.

Group 11 is a private US-based company committed to the development and application of environmentally and socially responsible precious metals mineral extraction. The combination of in-situ recovery extraction (ISR) technology and environmentally friendly water based chemistry to recover gold and other metals provides a promising alternate solution to conventional open pit and underground mineral extraction. The goal of advancing sustainable extraction considers growing concerns surrounding water use and discharge, carbon footprint, energy consumption, community stakeholders and workplace safety while addressing a growing global need for metals in our daily lives. Group 11 was founded by Enviroleach Technologies Inc. (CSE: ETI; OTCQB: EVLLF), Encore Energy Corp. (TSXV: EU; OTCQB: ENCUF) and Golden Predator Mining Corp. (TSXV: GPY; OTCQB: NTGSF).

Group 11 is a group of elements in the periodic table, also known as the coinage metals, consisting of gold (Au), silver (Ag) and copper (Cu).

For additional information: Group 11 Technologies Inc.

Janet Sheriff, President

214-304-9552

info@gr11tech.com www.gr11tech.com

GFG Resources Inc.

Brian Skanderbeg, President & CEO or

Marc Lepage, Vice President, Business Development Phone: (306) 931-0930

info@gfgresources.com www.gfgresources.com

Cautionary Note Regarding Forward-Looking StatementsThis news release includes certain forward-looking statements within the meaning of applicable securities laws including transactions and other properties, and the potential advancement thereof. Forward- looking statements are statements that relate to future, not past, events. In this context, forward- looking statements often address expected future business and financial performance, and often contain words such as “anticipate”, “believe”, “plan”, “estimate”, “expect”, and “intend”, statements that an action or event “may”, “might”, “could”, “should”, or “will” be taken or occur, or other similar expressions. Estimates of mineral resources and reserves are also forward looking statements because they constitute projections regarding the amount of minerals that may be encountered in the future. All statements, other than statements of historical fact, included herein including, without limitation; statements about the terms and completion of the transaction are forward-looking statements. By their nature, forward-looking statements involve known and unknown risks, uncertainties and other factors, which may cause the actual results, performance or achievements, or other future events, to be materially different from any future results, performance or achievements expressed or implied by such forward-looking statements. Forward-looking statements are made based on management’s beliefs, estimates and opinions on the date that statements are made and the respective companies undertakes no obligation to update forward-looking statements if these beliefs, estimates and opinions or other circumstances should change, except as required by applicable securities laws. Investors are cautioned against attributing undue certainty to forward-looking statements.

CoreCivic (CXW) – Announces Closing of $450 Million 8.25 Percent Senior Notes Due 2026


CoreCivic Announces Upsizing and Pricing of $450 Million 8.25% Senior Notes Due 2026


BRENTWOOD, Tenn., April 15, 2021 (GLOBE NEWSWIRE) — CoreCivic, Inc. (NYSE: CXW) (the “Company”) closed its offering of $450,000,000 aggregate principal amount of 8.25% senior unsecured notes due 2026 (the “Notes”) on April 14, 2021. The Notes were priced at 99.0% of face value and have an effective yield to maturity of 8.50%. The aggregate net proceeds from the sale of the Notes are expected to be approximately $435.1 million, after deducting the original issuance and underwriting discounts and estimated offering expenses. CoreCivic is using a significant amount of the net proceeds from the offering of the Notes (i) to redeem all $250 million principal amount of its outstanding 5.00% senior notes due 2022 (the “2022 Senior Notes”), which have been called for redemption on May 14, 2021 by a redemption notice issued on April 14, 2021, including the payment of the applicable make-whole amount and accrued interest, and (ii) to otherwise repay or reduce its other indebtedness, which includes repurchasing approximately $128 million principal amount of the $350 million aggregate principal amount of 4.625% senior notes due 2023 (the “2023 Senior Notes”). Following the repurchases of the 2023 Senior Notes described in the preceding sentence, the outstanding principal balance of the 2023 Senior Notes will be approximately $222 million. CoreCivic may use any remaining proceeds for general corporate purposes.

Imperial Capital acted as left lead underwriter, StoneX Financial Inc. acted as joint bookrunner, and Wedbush Securities Inc. acted as co-manager for the offering.

The Notes were offered pursuant to CoreCivic’s effective shelf registration statement on Form S-3ASR, which became effective upon filing with the Securities and Exchange Commission on April 6, 2021. A prospectus supplement describing the terms of the offering has been filed with the Securities and Exchange Commission and is available at www.sec.gov. The offering may be made only by means of a prospectus supplement and the accompanying prospectus. Copies of the prospectus supplement and accompanying prospectus relating to this offering may be obtained at Imperial Capital, LLC, 10100 Santa Monica Boulevard, Suite 2400, Los Angeles, CA 90067, Attn: Prospectus Department, or by telephone at (310) 246-3700.

This press release is neither an offer to sell nor a solicitation of an offer to buy any securities, nor shall it constitute a notice of redemption under the indenture governing the 2022 Senior Notes or the indenture governing the 2023 Senior Notes, nor shall there be any offer, solicitation or sale in any jurisdiction in which such offer, solicitation or sale would be unlawful.

This press release includes forward-looking statements regarding CoreCivic’s intended use of the remaining net proceeds from the issuance of the Notes. These forward-looking statements may be affected by risks and uncertainties in CoreCivic’s business and market conditions. This information is qualified in its entirety by cautionary statements and risk factor disclosures contained in CoreCivic’s Securities and Exchange Commission filings, including CoreCivic’s Annual Report on Form 10-K for the fiscal year ended December 31, 2020, filed with the Securities and Exchange Commission on February 22, 2021, as well as the risks identified in the prospectus supplement and the accompanying prospectus relating to the offering. CoreCivic wishes to caution readers that certain important factors may have affected and could in the future affect CoreCivic’s actual results and could cause CoreCivic’s actual results for subsequent periods to differ materially from those expressed in any forward-looking statement made by or on behalf of CoreCivic, including the risk that the offering of the Notes cannot be successfully completed. CoreCivic undertakes no obligation to update forward-looking statements to reflect events or circumstances after the date hereof.

About CoreCivic

CoreCivic is a diversified government solutions company with the scale and experience needed to solve tough government challenges in flexible, cost-effective ways. CoreCivic provides a broad range of solutions to government partners that serve the public good through corrections and detention management, a network of residential reentry centers to help address America’s recidivism crisis, and government real estate solutions. CoreCivic is the nation’s largest owner of partnership correctional, detention and residential reentry facilities, and believes it is the largest private owner of real estate used by government agencies in the U.S. CoreCivic has been a flexible and dependable partner for government for more than 35 years. CoreCivic’s employees are driven by a deep sense of service, high standards of professionalism and a responsibility to help government better the public good.

Contact: Investors: Cameron Hopewell – Managing Director, Investor Relations – (615) 263-3024
Media: Steve Owen – Vice President, Communications – (615) 263-3107


Toilet Paper Sales Unravel as Households are Flush with Paper Goods


Toilet Paper Sales Unravel as Households are Flush with Paper Goods


2020 blurred people’s focus as fight-or-flight instincts sometimes overruled common sense; this caused many to react by… you were there… making runs on toilet paper.

The tear on products from Kimberly Clark (KMB), Proctor and Gamble (PG), and Georgia Pacific (GP) was far from a short squeeze on Charmin; people went very long the paper in 2020, anything left on shelves was spotty. 

 One year later, households are bumping up against expiration dates and storage limits as they work off their load of inventory.

 The numbers are staggering; Americans spent $2 billion more on toilet paper in 2020 ($11 billion) than in a typical year, according to NielsinIQ.  This hoarding of an extra 22% has been cutting into sales in 2021. The current pace is below $9 billion. 

According to reelpaper.com, the expiration date on the package of your favorite toilet paper can be passed as long as you don’t get the product wet or allow dust and dirt to get into the packaging. According to Reel Paper, “the product can last years or even decades.”


Sales Circling the Drain

Sales of toilet paper are down 0.2% for the 52-week period ended April 3. In January, according to NielsenIQ, toilet paper sales were down 4.3% from January 2020.

 The declines have accelerated since then, with toilet-paper sales down about 14% in February and 33% in March, according to NielsenIQ. The drops, however, reflect comparisons to periods in which demand was soaring.

 The Under/Over on TP Sales in 2021

 As economist Milton Friedman often repeated, “There ain’t no such thing as a free lunch” this is true of companies that benefitted from last year’s frenzy. They aren’t getting off scott free as they find the current period sales have been perforated. Fortunately, the pile of profits from last year should average out with current lower sales as the year rolls on and consumers eventually work off their last sheet.


Paul Hoffman

Channelchek.com


(Readers are welcome to share this as a post on social media, or
in their own blog or publication, provided it includes a link to the original)


Sources:

https://www.telegram.com/news/20200331/fight-or-flight-response-explains-toilet-paper-hoarding-neuroscientist-says

https://www.wsj.com/articles/americans-have-too-much-toilet-paper-it-is-catching-up-to-companies-11618306200

https://nielseniq.com/?s=toilet+paper&market=global&language=en&orderby=&order=&post_type=

https://reelpaper.com/blogs/reel-talk