One Stop Systems Inc. (OSS) – Steadily Improving Operating Environment

Friday, March 26, 2021

One Stop Systems Inc. (OSS)
Steadily Improving Operating Environment

One Stop Systems Inc is US-based company which is principally engaged in designing, manufacturing, marketing high-end systems for high performance computing (HPC) applications. The company offers custom servers, compute accelerators, solid-state storage arrays and system expansion systems. The product line of the company includes GPU Appliances, GPU Expansion, GPUs and co-processors, Flash storage arrays, Flash storage expansion, Servers, Disk Arrays, Desktop computing appliances, accessories and parts. The company delivers high-end technology to customers through the sale of equipment and software for use on their premises or through remote cloud access to secure data centres housing technology.

Joe Gomes, Senior Research Analyst, Noble Capital Markets, Inc.

Refer to the full report for the price target, fundamental analysis, and rating.

    4Q20 Results. Fourth quarter revenue of $13.9 million, up 17% sequentially, down 24% y-o-y, and above guidance. Net income was $244,000, or $0.01 per share. On an adjusted EPS basis, 4Q20 diluted EPS was $0.04 versus diluted adjusted EPS of $0.07 for 4Q19. Although the top line exceeded our expectation, net income was below our projection. We were at $13.5 million of revenue and EPS of $0.05, while consensus was $13.2 million and $0.04, respectively.

    New Wins.  OSS added four new $1+ million wins in the quarter, increasing the total to 16 for the year, the same as in 2019, a strong accomplishment in a COVID impacted year, in our view. The 32 program wins over the past two years contributed $18 million to 2020 revenue, including $12 million from new customers …


This Company Sponsored Research is provided by Noble Capital Markets, Inc., a FINRA and S.E.C. registered broker-dealer (B/D).

*Analyst certification and important disclosures included in the full report. NOTE: investment decisions should not be based upon the content of this research summary.  Proper due diligence is required before making any investment decision. 

Release – QuoteMedia Inc. (QMCI) – Announces 5 Percent Revenue Growth for 2020


QuoteMedia Announces 5% Revenue Growth for 2020

PHOENIX, March 26, 2021 (GLOBE NEWSWIRE) — QuoteMedia, Inc. (OTCQB: QMCI), a leading provider of market data and financial applications, announced financial results for the fiscal year ended December 31, 2020.

QuoteMedia provides banks, brokerage firms, private equity firms, financial planners and sophisticated investors with a more economical, higher quality alternative source of stock market data and related research information. We compete with several larger legacy organizations and a modest community of other smaller companies.  QuoteMedia provides streaming data feeds, on-demand request-based data (XML/JSON), web content solutions (financial content for website integration) and applications such as Quotestream Professional desktop and mobile.

Revenue for the year ended December 31, 2020 was $12,402,224 versus $11,793,731 in the comparative 2019 period, resulting in a 5% increase. Consistent with our forecasts, revenue for the fourth quarter of 2020 was $3,266,083 versus $2,975,094 in the comparative 2019 quarter, resulting in a 10% increase.

“This has been a very successful year for QuoteMedia,” said Robert J. Thompson, Chairman of the Board of QuoteMedia, Inc. “Despite the disruption caused by the COVID-19 pandemic we experienced healthy improvements in revenue, significantly increased staffing, and made major advances in product and business development.

“Looking ahead, based on customers currently under contract, we are expecting a significant improvement in revenue growth and a return to profitability in 2021. For the first quarter of 2021, we are forecasting revenue growth of approximately 20% and expect to maintain this trajectory for the remainder of the year. We also expect our cash balances to rebound in 2021 as our revenue catches up with the increased expenditures associated with the new products and data expansion initiatives undertaken in 2020.

“The economic downturn related to COVID-19 did not leave us unaffected, as it forced some of our clients to halt projects and even caused some to cease business activities entirely. As a result, we saw a 365% increase in bad debts compared to 2019. Still, we are continuing to take advantage of new opportunities arising from the economic downturn, as the added pressure on financial sector firms to find more efficient and cost-effective solutions to their data and technology needs is leading them to explore QuoteMedia’s offerings. Additionally, we are seeing an increase in the need for our services for customers working remotely during the pandemic, and we expect this to be a lasting trend.

“As a result of increased expenses related to our recent expansion activities and the impact of Covid-19, we experienced a net loss of $646,324 for the year ended December 31, 2020 compared to net income of $558,997 in the comparative 2019 period. Our adjusted EBITDA was $734,068 for the year ended December 31, 2020 versus $2,124,498 in the comparative 2019 period. The company undertook major growth initiatives in 2020 and we expect to continue and expand these programs in 2021. We have invested in technological and infrastructure advancement, new product development, data collection and aggregation initiatives, the extension of our global market coverage, and new marketing campaigns. These strategic investments are producing very positive results. This year will mark the launch of major new product lines, data sets, proprietary analytics, and key partnerships, and we are very excited about our future.”

QuoteMedia will host a conference call Friday, March 26, 2021 at 2 PM Eastern Time to discuss the 2020 financial results and provide a business update.

Conference Call Details:

March 26, 2021, 2:00 PM Eastern

Dial-in numbers: 877-876-9173, 785-424-1667

Conference ID: QUOTEMEDIA

An audio rebroadcast of the call will be available later at: www.quotemedia.com

About QuoteMedia

QuoteMedia is a leading software developer and cloud-based syndicator of financial market information and streaming financial data solutions to media, corporations, online brokerages, and financial services companies. The Company licenses interactive stock research tools such as streaming real-time quotes, market research, news, charting, option chains, filings, corporate financials, insider reports, market indices, portfolio management systems, and data feeds. QuoteMedia provides data and services for companies such as the Nasdaq Stock Exchange, TMX Group (TSX Stock Exchange), Canadian Securities Exchange (CSE), London Stock Exchange Group, FIS, U.S. Bank, Broadridge Financial Systems, JPMorgan Chase, CI Financial, Canaccord Genuity Corp., Hilltop Securities, HD Vest, Stockhouse, Zacks Investment Research, General Electric, Boeing, Bombardier, Business Wire, PR Newswire, FolioFN, Regal Securities, ChoiceTrade, Cetera Financial Group, Dynamic Trend, Inc., Qtrade Financial, CNW Group, Industrial Alliance, Ally Invest, Inc., Suncor, Virtual Brokers, Equities.com, Leede Jones Gable, Firstrade Securities, Charles Schwab, First Financial, Cirano, Equisolve, Stock-Trak, Mergent, Cision, Warrior Trading and others. Quotestream®, QMod TM and Quotestream Connect TM are trademarks of QuoteMedia. For more information, please visit www.quotemedia.com.

Statements about QuoteMedia’s future expectations, including future revenue, earnings, and transactions, as well as all other statements in this press release other than historical facts are “forward-looking statements” within the meaning of the Private Securities Litigation Reform Act of 1995. QuoteMedia intends that such forward-looking statements be subject to the safe harbors created thereby. These statements involve risks and uncertainties that are identified from time to time in the Company’s SEC reports and filings and are subject to change at any time. QuoteMedia’s actual results and other corporate developments could differ materially from that which has been anticipated in such statements.

Below are the specific forward-looking statements included in this press release:

  • Looking ahead, based on customers currently under contract, we are expecting a significant improvement in revenue growth and a return to profitability in 2021.
  • For the first quarter of 2021, we are forecasting revenue growth of approximately 20% and expect to maintain this trajectory for the remainder of the year.
  • We also expect our cash balances to rebound in 2021 as our revenue catches up with the increased expenditures associated with the new products and data expansion initiatives undertaken in 2020.

QuoteMedia Investor Relations
Brendan Hopkins
Email: investors@quotemedia.com
Call: (407) 645-5295

Note 1 on Non-GAAP Financial Measures

We believe that Adjusted EBITDA, as a non-GAAP pro forma financial measure, provides meaningful information to investors in terms of enhancing their understanding of our operating performance and results, as it allows investors to more easily compare our financial performance on a consistent basis compared to the prior year periods. This non-GAAP financial measure also corresponds with the way we expect investment analysts to evaluate and compare our results. Any non-GAAP pro forma financial measures should be considered only as supplements to, and not as substitutes for or in isolation from, or superior to, our other measures of financial information prepared in accordance with GAAP, such as net income attributable to QuoteMedia, Inc.

We define and calculate Adjusted EBITDA as net income attributable to QuoteMedia, Inc., plus: 1) depreciation and amortization, 2) stock compensation expense, 3) interest expense, 4) foreign exchange loss (or minus a foreign exchange gain), and 5) income tax expense. We disclose Adjusted EBITDA because we believe it is a useful metric by which to compare the performance of our business from period to period. We understand that measures similar to Adjusted EBITDA are broadly used by analysts, rating agencies, investors and financial institutions in assessing our performance. Accordingly, we believe that the presentation of Adjusted EBITDA provides useful information to investors. The table below provides a reconciliation of Adjusted EBITDA to net income attributable to QuoteMedia, Inc., the most directly comparable GAAP financial measure.

QuoteMedia, Inc. Adjusted EBITDA Reconciliation to Net Income

2020 2019
Net income (loss) $ (646,324 ) $ 558,997
Depreciation and amortization 1,331,910 1,113,129
Stock-based compensation 37,872 411,714
Interest expense 4,582 6,259
Foreign exchange loss 3,791 31,385
Income tax expense 2,237 3,014
Adjusted EBITDA $ 734,068 $ 2,124,498

SOURCE: QuoteMedia

QuickChek – March 26, 2021


OSS Reports Q4 2020 Revenue

Noble Capital Markets Senior Research Analyst Joe Gomes’ report
One Stop Systems’ full press release

Research, News & Market Data on One Stop Systems

Watch recent presentation from NobleCon17


Comstock Announces 2021 Annual Meeting of Shareholders and Record Date

Comstock Mining announced that the 2021 Annual Meeting of Shareholders is scheduled for Thursday, June 3, 2021

Research, News & Market Data on Comstock Mining

Watch recent presentation from Comstock Mining


QuoteMedia Announces 5% Revenue Growth for 2020

QuoteMedia announced financial results for the fiscal year ended December 31, 2020.

Research, News & Market Data on QuoteMedia

Stay up to date. Follow us:

Why Oil Prices Could Continue Going Up


Are There Long-Lived Changes in Oil Markets that Hold it Above $50/bbl?


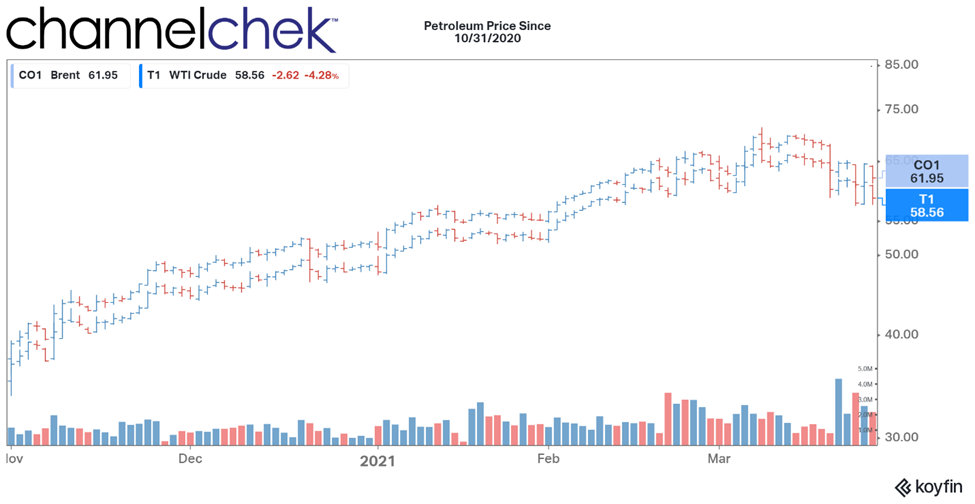
Oil prices have risen dramatically in recent months. The upward trend took root in November of 2020 and seems firmly in place. Oil’s current strength reflects increasing optimism for a global economic recovery as fewer cases of Covid19 lead to more petroleum-consuming activities.  While prices have gone up, producers have been slow to respond to the increase, as evidenced by continued low rig count numbers. These factors provide investors hope that there has been a fundamental change to the supply and demand of oil that could lead to oil prices staying above $50/bbl.  The below graph shows the recent rise in WTI and Brent oil prices.


Is Backwardation a Concern?

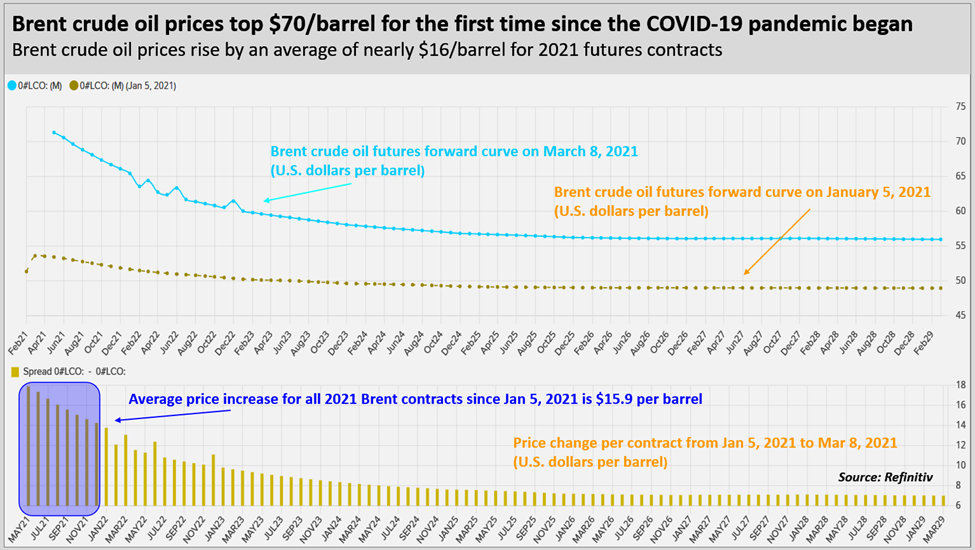
The upward trend in oil prices accelerated in March as OPEC unexpectedly held supply reduction levels despite growing demand. Spot prices have jumped again in recent days with the news that a container ship was blocking the Suez Canal and could take weeks to free. These two events have moved spot and futures prices higher, but not evenly. At current levels, spot prices are higher than future prices, a situation referred to as backwardation (see chart below). When near-term prices are below long-term prices, that situation is referred to as contango.


Higher spot prices relative to longer-term contracts is often a sign that prices are expected to fall. This is often the case when spot prices have risen due to events that are seen as temporary (OPEC decisions and Suez Canal Blockage) as opposed to events that may be longer-term in nature (Increased drilling, changing economic conditions, technological breakthroughs, etc.)  Futures curve backwardation is not unusual. However, the current spread between near-term and longer-term prices is unusually large. The chart below shows how the spread has been growing over the last twelve months.


Take-Away

A futures curve is by no means a perfect predictor of the direction of oil prices. However, it can give investors insight into other investor expectations. And, of course, the futures curve tells us something about what price might be received by energy producers seeking to hedge production. Investors should make sure to monitor all oil pricing when deciding whether to buy an energy stock and not just the spot price.

Suggested Reading:


Uranium is an ESG Energy Source Getting More Attention Private Energy Companies Role in Energy Cycle


Ruling Out Nuclear Energy Now Could be a Mistake Energy 2020-4Q Review and Outlook


C-Suite Series: enCore Energy (ENCUF)(EU.V) CEO Paul Goranson
& Exec. Chairman William Sheriff

  • Outlook for uranium pricing; how enCore’s production capabilities position them well for the next big move
  • Supply and demand outlook for uranium; value of building a strategic reserve
  • Steps they’ve taken to restart the processing plants acquired in 2020
  • Long term plans for existing assets in New Mexico; addressing environmental & community standards in restarting activities
  • Current cash position; plans to finance future growth

Watch The Video


Sources:

https://finance.yahoo.com/news/low-tide-slows-clear-suez-033034022.html, Yusri Modamed, Gavin Maguire and Florence Tan, Reuters, March 24, 2021

https://www.eia.gov/outlooks/steo/marketreview/crude.php, EIA, March 9, 2021

https://www.reuters.com/article/uk-global-oil-idUSKBN2B001L, Laura Sanicola, Reuters, March 7, 2021

Release – One Stop Systems (OSS) – Reports Q4 2020 Revenue


OSS Reports Q4 2020 Revenue up 7% over Q3 to $13.9 Million, Net Income of $244,000 or $0.01 per Share


ESCONDIDO, Calif., March 25, 2021 (GLOBE NEWSWIRE) — One Stop Systems, Inc. (Nasdaq: OSS), a leader in specialized high-performance edge computing, reported results for the fourth quarter and full year ended December 31, 2020.

Q4 Financial Highlights

  • Revenue in the fourth quarter of 2020 totaled $13.9 million, up 7% from Q3 2020, and lower by 24% versus the same year-ago quarter due to COVID-19-related issues.
  • Operating expenses in the fourth quarter of 2020 decreased 9% from the year-ago quarter to $4.3 million.
  • Net income on a GAAP basis totaled $244,000 or $0.01 per share.
  • Cash and cash equivalents totaled $6.3 million on December 31, 2020, up from $5.5 million on September 30, 2020. Earlier this month the company raised net proceeds of approximately $9.3 million via a registered direct offering, resulting in current cash of about $19 million.

Full Year 2020 Financial Highlights

  • Revenue totaled $51.9 million.
  • Operating expenses decreased 16% to $16.9 million. This reduction in operating expenses by more than $3.3 million includes the prior year’s charge of $1.7 million for goodwill impairment which was recorded in Q2 2019. On a proforma basis, after eliminating the effect of the prior year impairment charge, operating expenses were reduced by $1.6 million.
  • Loss from operations decreased to $424,000 compared to a loss of $779,000 in the prior year. After giving effect to the goodwill impairment charge described above, loss from operations increased $1.3 million.
  • Net loss on a GAAP basis for the full year of 2020 totaled $6,500 or $(0.00) per basic and diluted share, as compared to a net loss of $0.9 million or $(0.06) per basic and diluted share.
  • Non-GAAP net income for the full year of 2020 totaled $1.4 million or $0.08 per share, compared to non-GAAP net income of $2.3 million or $0.14 per diluted share.

2020 Operational Highlights

  • New program wins continued at a strong pace despite the pandemic. For 2020, the company won 16 new $1 million-plus programs, with 10 representing new customers.
  • The new program wins in 2019 and 2020 yielded $18 million of revenue for 2020, with $12 million generated by new customers. This diversification has reduced OSS’ dependency on its top two customers, which represented 25% of the company’s total business in 2020 compared to 41% in 2019.
  • Awarded fourth major program win by the company’s second largest customer, a large military prime contractor.
  • Company’s first-to-market PCI Express Gen 4 products generated more than $6.0 million in revenue. Applications included autonomous vehicles, military, and instrumentation.
  • Appointed technology industry veteran, David Raun, as president and CEO. (Q2)
  • Added three new independent board members while supporting gender and ethnic diversity. (Q3)
  • Completed reorganization with focus on long-term strategic vision, stronger margins, and enhancing shareholder value. This included the implementation of an expense reduction program. Savings from this effort are estimated to be $2.5 million on an annual basis. (Q2)

2020 Product and Technology Highlights

  • Introduced PCI Express Gen 4 compute accelerator incorporating the NVIDIA V100S Tensor Core GPU, thereby delivering data center capabilities to HPC and AI deployments at the edge. (Q1)
  • First-to-market with NVIDIA’s latest A100 Tensor Core GPU in an OSS upgraded compute accelerator, boosting performance by 20x over the previous generation. (Q2)
  • Introduced a new 4U Pro PCI Express Gen 4 expansion platform for edge, AI Transportables™ applications. (Q4)

Q4 Financial Summary

Revenue in the fourth quarter of 2020 totaled $13.9 million, up 7.4% from $13.0 million in the previous quarter. The sequential improvement in the fourth quarter of 2020 was due to increased sales to the company’s two largest accounts and new customers.

On a quarterly year over year basis, revenue was lower by 24.4% compared to $18.4 million in the same year-ago quarter. The decrease compared to the year-ago quarter was primarily due to pandemic driven reductions.

Gross profit was $4.8 million or 34.5% of revenue, which decreased by one percentage point from 35.5% in Q4 2019. The decrease was attributed to $4.5 million less in revenue in Q4 2020 and a higher mix of Bressner sales in Q4 2019.

Operating expenses decreased 9.2% to $4.3 million compared to $4.7 million in the same year-ago quarter. Operating expenses as a percentage of revenue increased to 30.9% in the fourth quarter of 2020 versus 25.7% in the year-ago quarter. The increase was primarily attributable to lower revenue.

Net income on a GAAP basis totaled $244,000 or $0.01 per basic and diluted share compared to a net income of $1.1 million or $0.06 per diluted share in the year-ago period.

Non-GAAP net income totaled $636,000 or $0.04 per share, as compared to $1.3 million or $0.07 per diluted share in the same year-ago period.

Adjusted EBITDA, a non-GAAP term, totaled $1.1 million as compared to $2.4 million in the same year-ago period.

Cash and cash equivalents totaled $6.3 million as of December 31, 2020, as compared to $5.5 million at September 30, 2020. Current cash on hand totals approximately $19 million after a registered direct offering for net proceeds of approximately $9.3 million completed earlier this month. The company believes its cash position and other available funds provides sufficient liquidity to meet its cash requirements for working capital and paying down debt, while also supporting the company’s growth and strategic initiatives.

Full Year 2020 Financial Summary

For the full year of 2020, revenue was $51.9 million, a decrease of 11% from $58.3 million in the same year-ago period. The decrease was primarily due to the impact of COVID-19.

Gross profit was $16.4 million or 31.7% of revenue, compared to $19.4 million or 33.3% of revenue in 2019.

Operating expenses decreased 16.5% to $16.9 million from $20.2 million in 2019. Operating expenses as a percentage of revenue improved to 32.5% versus 34.6% in the year-ago period. The decrease in operating expense is largely attributable to the company’s expense reduction program, less the goodwill impairment charge of $1.7 million in the prior year.

Net loss on a GAAP basis totaled $6,500 or $(0.00) per share, as compared to a loss of $900,000 or $(0.06) per share in 2019.

Non-GAAP net income totaled $1.4 million or $0.08 per share, as compared to non-GAAP net income of $2.3 million or $0.14 per diluted share in the full year of 2019.

Adjusted EBITDA, a non-GAAP term, was $1.8 million, as compared to $3.2 million in 2019.

Management Commentary

“In 2020 we seized the opportunity to take several transformative steps and have laid the cornerstones for a stronger foundation on which to build our future growth,” commented OSS president and CEO, David Raun. “These steps included new senior leadership and corporate reorganization, reduced spending, three new independent board members, which also added to our board diversity, and we directed more focus on our long-term strategic vision to increase shareholder value over time.

“Regarding our financials, we are pleased to announce that we were able to exceed our Q4 2020 revenue outlook by about $900,000. This was a direct result of our continued efforts to drive existing OEM business and our success in expanding our customer base, offsetting some of the downside from the pandemic.

“We see early indications of improvements with customers impacted by COVID. While we anticipate the impact will continue for some time in 2021, our energies are focused on a return to normalcy and the opportunities inherent in that improved environment.

“As previously stated, the pandemic impacted our top-line revenue growth in 2020 with several of our key customers. We identified about $14 million in lost or delayed revenue compared to our annual plan due to COVID-related matters.

“More than half of the lost or delayed revenue in 2020 was from our largest customer in the media and entertainment industry. During the fourth quarter we saw an encouraging rebound by this customer, as their 3D virtual product line continues to develop traction in the market.

“Their product premiered last year on American Idol as the virtual performance stage in a Katy Perry music video. We expect their virtual platform to drive increased sales in the current and future quarters. The eventual return of live events should contribute additional revenue from their core products in the second half of the year.

“Earlier this month, we announced a direct offering which further fortified our cash position. In addition to the offering, we achieved significant cash gains through a combination of lower expenses, increased efficiency, and improvements in working capital. The result is that we currently have a cash position of approximately $19 million. This gives us the ability to invest in key strategic initiatives that should fuel future growth.

“During the fourth quarter of 2020, we closed four additional major OEM opportunities, including two industrial, one instrumentation and one autonomous driving project. For 2020, the program wins totaled 16, which matched 2019 without the pandemic. As a reminder, we define program wins as those expected to yield $1 million or more of revenue within four years. Our 32 program wins over the past two years contributed $18 million to 2020 revenue, including $12 million from new customers supporting our diversification initiatives.

“We have defined and started implementation of a multi-year strategic plan to enhance our product road map, market position and value proposition for target industries and customers. After confidential discussions with customers, much research, trend analysis, review of core strengths and our current business, we have identified a focus segment within the fast-growing edge computing space.

“Our strategic focus is on a quickly developing segment of edge computing. We call it AI Transportables. This includes anything that is not in a fixed location but requires the very latest in high-performance computing for AI where responsive action needs to be taken immediately at the very edge.

“The challenges associated with these AI Transportables is where OSS core capabilities and expertise is strongest, and we believe will offer the greatest growth opportunities. We look forward to sharing additional details on our quarterly conference call later today and in future communications.

“While there remains uncertainty around when we will finally conquer the pandemic and return to business as usual, we believe the worst is now behind us. We see signs of improvement, and OSS has become foundationally stronger to execute its strategic plan and create increasing value for our shareholders.”

Outlook
For the first quarter of 2021, OSS expects revenue of approximately $13 million.

Conference Call
OSS management will hold a conference call to discuss its fourth quarter and full year 2020 results later today, followed by a question-and-answer period.

Date: Thursday, March 25, 2021
Time: 5:00 p.m. Eastern time (2:00 p.m. Pacific time)
Toll-free dial-in number: 1-800-437-2398
International dial-in number: 1-786-204-3966
Conference ID: 1791479

The conference call will be webcast live and available for replay here as well as via a link in the Investors section of the company’s website at ir.onestopsystems.com. OSS regularly uses its website to disclose material and non-material information to investors, customers, employees and others interested in the company.

Please call the conference telephone number five minutes prior to the start time. An operator will register your name and organization. If you have any difficulty connecting with the conference call, please contact CMA at 1-949-432-7566.

A replay of the call will be available after 8:00 p.m. Eastern time on the same day through April 8, 2021.

Toll-free replay number: 1-844-512-2921
International replay number: 1-412-317-6671
Replay ID: 1791479

About One Stop Systems
One Stop Systems, Inc. (OSS) designs and manufactures innovative specialized high-performance edge computing modules and systems, including customized servers, compute accelerators, expansion systems, flash storage arrays and Ion Accelerator storage software. These products are used for deep learning, AI, defense, finance, and entertainment applications, and empower scientists, engineers, creators and other professionals to push the boundaries of their industries.

OSS utilizes the power of PCI Express, the latest GPU accelerators and NVMe storage to build award-winning systems, including many industry firsts, for OEMs and government customers. The company enables AI on the Fly® by bringing AI datacenter performance to ‘the edge’ and on mobile platforms, and by addressing the entire AI workflow, from high speed data acquisition to deep learning, training and inference. OSS products are available directly or through global distributors. For more information, go to www.onestopsystems.com.

Non-GAAP Financial Measures
Management believes that the use of adjusted earnings before interest, taxes, depreciation and amortization, or adjusted EBITDA, is helpful for an investor to assess the performance of the company. The company defines adjusted EBITDA as income (loss) attributable to common stockholders before interest, taxes, depreciation, amortization, acquisition expense, impairment of long-lived assets, financing costs, fair value adjustments from purchase accounting, stock-based compensation expense and expenses related to discontinued operations.

Adjusted EBITDA is not a measurement of financial performance under generally accepted accounting principles in the United States, or GAAP. Because of varying available valuation methodologies, subjective assumptions and the variety of equity instruments that can impact a company’s non-cash operating expenses, management believes that providing a non-GAAP financial measure that excludes non-cash and non-recurring expenses allows for meaningful comparisons between the company’s core business operating results and those of other companies, as well as providing the company with an important tool for financial and operational decision making and for evaluating its own core business operating results over different periods of time.

The company’s adjusted EBITDA measure may not provide information that is directly comparable to that provided by other companies in its industry, as other companies in the company’s industry may calculate non-GAAP financial results differently, particularly related to non-recurring and unusual items. The company’s adjusted EBITDA is not a measurement of financial performance under GAAP, and should not be considered as an alternative to operating income or as an indication of operating performance or any other measure of performance derived in accordance with GAAP. Management does not consider adjusted EBITDA to be a substitute for, or superior to, the information provided by GAAP financial results.

                 
    For the Three Months Ended December 31,   For the Year Ended December 31,
      2020       2019       2020       2019  
Net loss attributable to common stockholders   $ 243,860     $ 1,094,126     $ (6,544 )   $ (900,337 )
Depreciation and amortization     397,770       415,104       1,606,532       1,655,288  
Amortization of deferred gain           (12,359 )     (53,838 )     (28,555 )
Impairment of goodwill                       1,697,394  
Stock-based compensation expense     220,959       159,329       724,378       649,469  
Interest income     (150,468 )     (25,266 )     (418,379 )     (151,113 )
Interest expense     157,599       54,097       550,774       165,560  
Costs resulting from dissolution of SkyScale           (146,150 )           (146,150 )
Acquisition expenses                       4,075  
(Benefit) provision for income taxes     247,312       832,142       (603,744 )     237,252  
Adjusted EBITDA   $ 1,117,032     $ 2,371,023     $ 1,799,179     $ 3,182,883  
                 

Adjusted EPS excludes the impact of certain items and, therefore, has not been calculated in accordance with GAAP. Management believes that exclusion of certain selected items assists in providing a more complete understanding of the company’s underlying results and trends and allows for comparability with its peer company index and industry. Management uses this measure along with the corresponding GAAP financial measures to manage the company’s business and to evaluate its performance compared to prior periods and the marketplace. The Company defines non-GAAP (loss) income attributable to common stockholders as (loss) or income before amortization, stock-based compensation, expenses related to discontinued operations, and acquisition costs. Adjusted EPS expresses adjusted (loss) income on a per share basis using weighted average diluted shares outstanding.

Adjusted EPS is a non-GAAP financial measure and should not be considered in isolation or as a substitute for financial information provided in accordance with GAAP. These non-GAAP financial measures may not be computed in the same manner as similarly titled measures used by other companies. Management expects to continue to incur expenses similar to the adjusted income from continuing operations and adjusted EPS financial adjustments described above, and investors should not infer from our presentation of these non-GAAP financial measures that these costs are unusual, infrequent or non-recurring.

The following table reconciles net loss attributable to common stockholders and diluted earnings per share:

                 
    For The Three Months Ended December 31,   For the Year Ended December 31,
      2020       2019       2020       2019  
Net loss attributable to common stockholders   $ 243,860     $ 1,094,126     $ (6,544 )   $ (900,337 )
Amortization of intangibles     170,985       174,525       683,935       984,065  
Impairment of goodwill                       1,697,394  
Stock-based compensation expense     220,959       159,329       724,378       649,469  
Cost resulting from dissolution of SkyScale           (146,150 )           (146,150 )
Acquisition expenses                       4,075  
Non-GAAP net income attributable to common stockholders   $ 635,804     $ 1,281,830     $ 1,401,769     $ 2,288,516  
                 
Non-GAAP net income per share attributable to common stockholders:                
Basic   $ 0.04     $ 0.08     $ 0.08     $ 0.15  
Diluted   $ 0.04     $ 0.07     $ 0.08     $ 0.14  
Weighted average common shares outstanding:                
Basic     16,639,514       16,107,786       16,512,203       15,148,613  
Diluted     17,143,126       17,117,800       16,752,434       16,158,627  
                 

Forward-Looking Statements
One Stop Systems cautions you that statements in this press release that are not a description of historical facts are forward-looking statements. These statements are based on the company’s current beliefs and expectations. The inclusion of forward-looking statements should not be regarded as a representation by One Stop Systems or its partners that any of our plans or expectations will be achieved, including but not limited to, to our management’s expectations for revenue growth generated by new products and design wins. Actual results may differ from those set forth in this press release due to the risk and uncertainties inherent in our business, including risks described in our prior press releases and in our filings with the Securities and Exchange Commission (SEC), including under the heading “Risk Factors” in our Annual Report on Form 10-K and any subsequent filings with the SEC. You are cautioned not to place undue reliance on these forward-looking statements, which speak only as of the date hereof, and we undertake no obligation to revise or update this press release to reflect events or circumstances after the date hereof. All forward-looking statements are qualified in their entirety by this cautionary statement, which is made under the safe harbor provisions of the Private Securities Litigation Reform Act of 1995.

Media Contact:
Katie Rivera
One Stop Systems, Inc.
Tel (760) 745-9883
Email contact

Investor Relations:
Ronald Both or Grant Stude
CMA
Tel (949) 432-7557
Email contact


ONE STOP SYSTEMS, INC. (OSS)

CONSOLIDATED BALANCE SHEETS

    December 31,   December 31,
    2020   2019
ASSETS                
Current assets                
Cash and cash equivalents   $ 6,316,921     $ 5,185,321  
Accounts receivable, net     7,458,383       11,667,157  
Inventories, net     9,647,504       7,369,356  
Prepaid expenses and other current assets     655,708       453,938  
Total current assets     24,078,516       24,675,772  
Property and equipment, net     3,487,178       3,568,564  
Deposits and other     81,709       47,146  
Deferred tax assets, net     3,698,593       3,019,823  
Goodwill     7,120,510       7,120,510  
Intangible assets, net     662,257       1,346,192  
    $ 39,128,763     $ 39,778,007  
                 
LIABILITIES AND STOCKHOLDERS’ EQUITY                
Current liabilities                
Accounts payable   $ 976,420     $ 4,115,977  
Accrued expenses and other liabilities     3,481,444       4,607,432  
Current portion of notes payable, net of debt discount of $2,047 and $7,019, respectively     1,365,204       1,377,751  
Current portion of related-party notes payable, net of debt discount of $6,726 and $23,060, respectively     199,943       561,441  
Senior secured convertible note, net of discounts of $256,242     1,789,212        
Total current liabilities     7,812,223       10,662,601  
Notes payable, net of current portion and debt discount of $0 and $2,047, respectively           149,301  
Related-party notes payable, net of current portion and debt discount of $0 and $6,726, respectively           199,943  
Senior secured convertible note, net of discounts of $14,107     531,347        
Paycheck protection plan note payable     1,499,360        
Total liabilities     9,842,930       11,011,845  
Commitments and contingencies                
Stockholders’ equity                
Common stock, $.0001 par value; 50,000,000 shares authorized; 16,684,424 and 16,121,747 shares issued and outstanding, respectively     1,668       1,612  
Additional paid-in capital     30,758,354       30,537,015  
Noncontrolling interest           500  
Accumulated other comprehensive income (loss)     287,547       (17,773 )
Accumulated deficit     (1,761,736 )     (1,755,192 )
Total stockholders’ equity     29,285,833       28,766,162  
    $ 39,128,763     $ 39,778,007  


ONE STOP SYSTEMS, INC. (OSS)

CONSOLIDATED STATEMENTS OF OPERATIONS

    For the Three Months Ended December 31,   For the Year Ended December 31,
      2020       2019       2020       2019  
Revenue   $ 13,934,365     $ 18,424,920     $ 51,895,388     $ 58,308,019  
Cost of revenue     9,122,247       11,877,357       35,460,774       38,905,756  
Gross margin     4,812,118       6,547,563       16,434,614       19,402,263  
Operating expenses:                
General and administrative     2,209,436       2,033,551       8,418,358       8,501,572  
Impairment of goodwill                       1,697,394  
Marketing and selling     982,945       1,379,861       4,120,778       5,138,762  
Research and development     1,106,420       1,320,039       4,319,759       4,843,554  
Total operating expenses     4,298,801       4,733,451       16,858,895       20,181,282  
Income (loss) from operations     513,317       1,814,112       (424,281 )     (779,019 )
Other (expense) income:                
Interest income     150,468           418,379      
Interest expense     (157,599 )     (54,096 )     (550,774 )     (165,560 )
Other (expense) income, net     (15,014 )     166,252       (53,612 )     281,494  
Total other (expense) income, net     (22,145 )     112,156       (186,007 )     115,934  
Income (loss) before income taxes     491,172       1,926,268       (610,288 )     (663,085 )
Provision (benefit) for income taxes     247,312       832,142       (603,744 )     237,252  
Net income (loss)   $ 243,860     $ 1,094,126     $ (6,544 )   $ (900,337 )
                 
Net income (loss) per share:                
Basic   $ 0.01     $ 0.07     $ (0.00 )   $ (0.06 )
Diluted   $ 0.01     $ 0.06     $ (0.00 )   $ (0.06 )
                 
Weighted average common shares outstanding:                
Basic     16,639,514       16,107,786       16,512,203       15,148,613  
Diluted     17,143,126       17,117,800       16,512,203       15,148,613  
                 

Source: One Stop Systems, Inc.
FAT Brands Inc. (FAT) – Solid 4Q as Operations Continue to Rebound

Friday, March 26, 2021

FAT Brands Inc. (FAT)
Solid 4Q as Operations Continue to Rebound

FAT Brands Inc is a multi-brand restaurant franchising company. It develops, markets, and acquires predominantly fast casual restaurant concepts. The company provides turkey burgers, chicken Sandwiches, chicken tenders, burgers, ribs, wrap sandwiches, and others. Its brand portfolio comprises Fatburger, Buffalo’s Cafe and Express, and Ponderosa and Bonanza. The company’s overall footprint covers nearly 32 countries. Fatburger generates maximum revenue for the company.

Joe Gomes, Senior Research Analyst, Noble Capital Markets, Inc.

Refer to the full report for the price target, fundamental analysis, and rating.

    4Q20 Results. Fat Brands reported 4Q20 revenue of $6.5 million, compared to $5.3 million in 4Q19. The increased revenue was driven by royalties, which rose to $4.7 million in the quarter from $3.8 million in 4Q19. Cost and expenses were impacted by a number of one-time items, which combined with higher interest expense resulted in a reported loss for the quarter of $7.67 million, or $0.64 per share, compared to a loss of $953,000, or $0.08 per share last year. We had projected revenue of $6 million and a net loss of $1.24 million, or $0.10 per share.

    Improving Trends and Pipeline.  Systemwide sales rose to $106.9 million, up from $72.2 million in the third quarter. Y-o-Y same store sales decline continued to improve, dropping to 9.4% in 4Q20, compared to down 13.2% in 3Q20. So far in 1Q21 weekly system-wide sales rose from $7.9 million in early January to $9.6 million in mid-March. In 4Q20, 29 new locations opened, increasing the full year total …


This Company Sponsored Research is provided by Noble Capital Markets, Inc., a FINRA and S.E.C. registered broker-dealer (B/D).

*Analyst certification and important disclosures included in the full report. NOTE: investment decisions should not be based upon the content of this research summary.  Proper due diligence is required before making any investment decision. 

Indonesia Energy Corp (INDO) – Rating Upgraded, PO Reinstated

Thursday, March 25, 2021

Indonesia Energy Corp (INDO)
Rating Upgraded, PO Reinstated

Indonesia Energy Corp Ltd is an oil and gas exploration and production company focused on Indonesia. It holds two oil and gas assets through its subsidiaries in Indonesia: one producing block (the Kruh Block) and one exploration block (the Citarum Block). The Kruh Block is located to the northwest of Pendopo, Pali, South Sumatra. The Citarum Block is located to the south of Jakarta.

Michael Heim, Senior Research Analyst, Noble Capital Markets, Inc.

Refer to the full report for the price target, fundamental analysis, and rating.

    We are upgrading the shares of INDO following weakness in the share price. Recall that we had downgraded the shares on March 3rd when the share price crossed our price objective and traded above our P.O. for several weeks. The shares have been weak in recent weeks and now trade below our estimated fair value. As a result, we are upgrading the shares and reinstating our price objective.

    Stock value is not dependent on near-term energy pricing.  Our valuation work is based on a two-stage discounted cash flow analysis. In the case of INDO who has limited current production but large drilling plans, much of the company’s valuation is back-end loaded. When we downgraded the shares, we did so because they had risen based on near-term oil price strength even as our long-term oil price …


This Company Sponsored Research is provided by Noble Capital Markets, Inc., a FINRA and S.E.C. registered broker-dealer (B/D).

*Analyst certification and important disclosures included in the full report. NOTE: investment decisions should not be based upon the content of this research summary.  Proper due diligence is required before making any investment decision. 

Are Small Cap Stocks Smart Investments?


Stimulus Checks, Taxes, and Investments


IRA tax season and the third round of stimulus checks are inspiring recipients to deploy their $1,400 stimulus to reduce their 2020 tax burden. A deposit in a qualified retirement account could minimize 2020 (or 2021) taxes and at the same time enhance retirement – or even help with home purchase options down the road. Getting the most benefit from investing these longer-term assets is dependent on many factors, including the individual’s time horizon. The following advice from a highly credentialled investment analyst may help inform investors’  allocation options.

Robert R. Johnson, Ph.D., CFA, CAIA, is a Professor of Finance at Heider College of Business, Creighton University. He is also a co-author of The Tools and Techniques Of Investment
Planning
, Strategic Value Investing, and Investment Banking for Dummies, among others. As if these credentials aren’t enough, he is the former deputy CEO of the CFA Institute and headed the CFA Program, as well as having been the President of the American College of Financial Services. Dr. Johnson is one of the most credentialed individuals in the field of finance and investment, so I asked him a question important to those that use Channelchek for insight on small and microcap investments. The answer is worth knowing for anyone that is more investment than trading-oriented.

Channelchek (PH): “Dr. Johnson, if over a long enough timeline, small-cap indices outperform large-cap. Could it stand to reason that if you’re a young saver for retirement, holding stocks that have demonstrated a greater return over time should have an allocation? Also, could individual stocks be more suitable than an ETF in the small-cap sector? What stipulations would you have for an investor buying small or even microcap stocks in their IRA?

Dr. Robert R. Johnson: You are absolutely correct in that small-cap stocks are most suitable for investors with a long time horizon. According to data by Duff & Phelps [formerly Ibbotson Associates] from 1926 through 2019, an index of small-cap stocks returned 11.9% compounded annually, while large-cap stocks returned 10.2% compounded annually. While that may not sound like much of a difference, one dollar invested in a large-cap index would have grown to $9,243 at year-end 2019. That same dollar invested in a small-cap index would have grown to $39,381 at year-end 2019. Now, those higher long-term returns come at a cost of higher volatility. Over that same time period, the standard deviation of annual returns was 19.8% for the large-cap index and 31.5% for the small-cap index.


“…one dollar invested in a large-cap index would have grown to $9,243 at year-end 2019. That same dollar invested in a small-cap index would have grown to $39,381 at year-end 2019.” – Robert R. Johnson, PhD, CFA, CAIA


Individuals need to be taught to invest for retirement and not to save for retirement. The surest way to build true long-term wealth for retirement is to invest in the stock market. Starting early is the key to successfully building wealth because of the effect of compound interest. Albert Einstein said that “compound interest is the greatest mathematical discovery of all time.” Time is the greatest ally of the investor because of the “magic” of compound interest. An IRA is the perfect investment vehicle for an individual with a long time horizon. They can weather the increased volatility of the small-cap universe.

People in their 20s should begin investing in a low-fee, diversified small-cap equity index fund and continue to invest consistently whether the market is up, down, or sideways. Dollar-cost averaging into an index mutual fund or ETF is a terrific lifelong strategy. Dollar-cost averaging is a simple technique that entails investing a fixed amount of money in the same fund or stock at regular intervals over a long period of time.

Additionally, these investors should be 100% invested in stocks and have no bond exposure. Ironically, one of the biggest mistakes young investors make is taking too little risk, not too much risk.


“…often that is what happens to beginning investors who buy the stock of the company they work for or the stock of a product they like. When they experience failure, they withdraw from the equity markets. Investing in a broadly diversified basket of securities is a prudent strategy.” – Robert R. Johnson, PhD, CFA, CAIA


For the vast majority of investors, the KISS mantra — keep It simple, stupid — should guide their investment philosophy. The idea behind index investing is “if you can’t beat ‘em, join ‘em.” Investors simply can’t afford to make oversized bets on individual securities. And, often that is what happens to beginning investors who buy the stock of the company they work for or the stock of a product they like. When they experience failure, they withdraw from the equity markets. Investing in a broadly diversified basket of securities is a prudent strategy. An interesting study done by University of Arizona professor Hendrick Bessembinder shows that only four percent of common stocks have provided a higher return than Treasury bills. In other words, the returns on the market have been driven by a small percentage of big winners. Trying to pick winners, for most, is a loser’s game. The solution is to invest in diversified funds and you don’t need to pick those winners.”

Take-Away

There is debate whether today’s popular cap-weighted indices represent diversification relative to a well-selected, large diversified basket of a more even weighting. A previous Channechek article is provided below that discusses this concern; it was published before the 2020 explosion of tech stocks. Last year’s uneven growth reduced their diversification even more. Investors should evaluate if the current imbalance of individual index funds is now in fact making an oversized bet. 

Professor Robert R. Johnson, Ph.D., CFA, CAIA, certainly feels strongly that there is a difference between savings and investing. Bank accounts, CDs, bonds and notes are not the path for true long-term wealth. IRAs, 401ks and other funds earmarked for retirement should be in equities if you are not soon expected to live off those funds. For those that have a longer time horizon, accepting the higher volatility of small-cap stocks for the higher probable returns could be viewed as most prudent.


Paul Hoffman

Managing Editor, Channelchek

Suggested Reading:


Investment Barriers Once Seen Insurmountable are Falling Taking Stock of Index Funds


Large-Cap and Small-Cap Return Probabilities Company Sponsored Research/Small-Cap Stocks


Stay up to date. Follow us:


Stay up to date. Follow us:

QuickChek – March 25, 2021


Esports Entertainment Group Signs Multi-Year Deal with Denver Broncos

Esports Entertainment signed a multi-year partnership with the Denver Broncos to be the NFL franchise’s esports tournament provider

Research, News & Market Data on Esports Entertainment

Watch recent presentation from NobleCon17


Enochian BioSciences up in early trading on Case Report of Complete Remission of Recurrent Glioblastoma with Innovative Therapy

Enochian BioSciences reported that a 36-year old patient with recurrent glioblastoma achieved complete remission for a period of 15 months.

Research, News & Market Data on Enochian BioSciences


Ayala Pharmaceuticals Reports Full Year 2020 Financial Results and Provides Business Update

Ayala Pharmaceuticals reported financial results for the full year ended December 31, 2020 and highlighted recent progress and upcoming milestones for its pipeline programs.

Research, News & Market Data on Ayala Pharmaceuticals

Watch recent presentation from NobleCon17

Stay up to date. Follow us:

Seanergy Maritime (SHIP) – 4Q2020 Results In Line. Expanding for Upturn

Thursday, March 25, 2021

Seanergy Maritime (SHIP)
4Q2020 Results In Line. Expanding for Upturn.

Seanergy Maritime Holdings Corp., an international shipping company, provides marine dry bulk transportation services through the ownership and operation of dry bulk vessels. Seanergy Maritime Holdings Corp. is the only pure-play Capesize shipping company listed in the US capital markets. Seanergy provides marine dry bulk transportation services through a modern fleet of 10 Capesize vessels, with total capacity of approximately 1,748,581 dwt and an average fleet age of about 9.8 years. The Company is incorporated in the Marshall Islands with executive offices in Athens, Greece and an office in Hong Kong. The Company’s common shares trade on the Nasdaq Capital Market under the symbol “SHIP” and class A warrants under “SHIPW”.

Poe Fratt, Senior Research Analyst, Noble Capital Markets, Inc.

Refer to the full report for the price target, fundamental analysis, and rating.

    4Q2020 Operating results were in line with expectations. Reported adjusted EBITDA of $8.3 million was in line with our expectations after adding back the one-time items from the costs of debt restructuring and refinancing. TEC revenue of $16.7 million was slightly higher than expected due to higher TCE rates of $16,511/day but was offset by higher opex of $6,132/day. Management fees were $276/day and G&A expenses were $1,902/day.

    Increasing 2021 EBITDA estimate to $51.0 million from $47.7 million to reflect 1Q2021 forward cover, current dry bulk market conditions and pending acquisitions.  Our estimate is based on TCE rates of $17,742/day, up from a previous estimate of $17,742/day with no change in ownership days of 4,613. With the quarter largely passed,1Q2021 forward cover was 98% booked at an average TCE rate of …


This research is provided by Noble Capital Markets, Inc., a FINRA and S.E.C. registered broker-dealer (B/D).

*Analyst certification and important disclosures included in the full report. NOTE: investment decisions should not be based upon the content of this research summary.  Proper due diligence is required before making any investment decision. 

Pyxis Tankers Inc. (PXS) – Weak End to 2020, But Capital Raises Add Flexibility

Thursday, March 25, 2021

Pyxis Tankers Inc. (PXS)
Weak End to 2020, But Capital Raises Add Flexibility

Pyxis Tankers Inc is a United States-based international maritime transportation company which focuses on the product tanker sector. It owns a fleet which comprises of double hull product tankers employed under a mix of short- and medium-term time charters and spot charters. The fleet owned by the company includes Pyxis Epsilon, Pyxis Theta, Pyxis Malou, Pyxis Delta, Northsea Alpha, and Northsea Beta. Each of the vessels in the fleet is capable of transporting refined petroleum products, such as naphtha, gasoline, jet fuel, kerosene, diesel, fuel oil, and other liquid bulk items, such as vegetable oils and organic chemicals.

Poe Fratt, Senior Research Analyst, Noble Capital Markets, Inc.

Refer to the full report for the price target, fundamental analysis, and rating.

    4Q2020 EBITDA Below Expectations. Adjusted 4Q2020 EBITDA of negative $0.2 million was below our estimate due to lower TCE revenue, higher opex and G&A expenses. Versus our estimate, TCE revenue of $3.58 million was $0.8 million lower and opex of $2.86 million was $0.3 million above. G&A expense of $0.61 million was slightly lower than expected by $0.1 million.

    Adjusting 2021 EBITDA estimates with potential 2H2021 rebound as the swing factor.  Our 2021 EBITDA estimate drops to $4.3 million from $4.5 million, which is based on TCE rates of $10,167/day and operating days of 1,611. With the quarter largely behind us, 1Q2021 forward cover on the MR fleet is 100% booked at an average rate of ~ $13.2k and 75% of available 2Q2021 available days are booked at …


This research is provided by Noble Capital Markets, Inc., a FINRA and S.E.C. registered broker-dealer (B/D).

*Analyst certification and important disclosures included in the full report. NOTE: investment decisions should not be based upon the content of this research summary.  Proper due diligence is required before making any investment decision. 

Chakana Copper Corp (CHKKF)(PERU:CA) – Drilling at Huancarama Reveals Second High-Grade Discovery

Thursday, March 25, 2021

Chakana Copper Corp (CHKKF)(PERU:CA)
Drilling at Huancarama Reveals Second High-Grade Discovery

Noble Capital Markets research on Chakana Copper Corp is published under ticker symbols CHKKF and PERU:CA. The price target is in USD and based on ticker symbol CHKKF. Chakana Copper Corp is a Canadian-based minerals exploration company that is currently advancing the high-grade gold-copper-silver Soledad Project located in the Ancash region of Peru, a highly favorable mining jurisdiction with supportive communities. The Soledad Project consists of high-grade gold-copper-silver mineralization hosted in tourmaline breccia pipes. A total of 33,353 metres of drilling has been completed to-date, testing nine (9) of twenty-three (23) confirmed breccia pipes with more than 92 total targets. Chakana’s investors are uniquely positioned as the Soledad Project provides exposure to several metals including copper, gold, and silver.

Mark Reichman, Senior Research Analyst of Natural Resources, Noble Capital Markets, Inc.

Refer to the full report for the price target, fundamental analysis, and rating.

    High-grade breccia pipe discovery at Huancarama. Chakana Copper announced the discovery of a second high-grade breccia pipe within the Huancarama Breccia Complex at the Soledad Project in Peru. The new high-grade breccia pipe (Huancarama West) is only 75 meters west of the previously announced Huancarama East discovery. To date, a total of 33 diamond core holes have been completed within the Huancarama Breccia Complex to delineate the boundaries of the breccia pipes.

    Drill results highlight near-surface mineralization potential.  The company released results for six drill holes at Huancarama West and three drill holes at Huancarama East. Five of the six drill holes at Huancarama West intersected mineralized breccia starting at depths ranging from 2.75 to 4.0 meters with significant gold and silver intercepts. The three holes at Huancarama East confirmed that the …


This Company Sponsored Research is provided by Noble Capital Markets, Inc., a FINRA and S.E.C. registered broker-dealer (B/D).

*Analyst certification and important disclosures included in the full report. NOTE: investment decisions should not be based upon the content of this research summary.  Proper due diligence is required before making any investment decision. 

Release – Ayala Pharmaceuticals (AYLA) – Reports Full Year 2020 Financial Results and Provides Business Update


Ayala Pharmaceuticals Reports Full Year 2020 Financial Results and Provides Business Update


– Completed $25 Million Strategic Financing; Extending Cash Runway into
2023

            – Accelerated Development of AL102 Desmoid Tumor Program
into Phase 2/3 Pivotal Trial

– On Track to Report Multiple Milestones in
2021 Across Clinical-Stage Pipeline

REHOVOT, Israel & WILMINGTON, Del., March 25, 2021 – (GLOBE NEWSWIRE) – Ayala Pharmaceuticals, Inc. (Nasdaq: AYLA), a clinical-stage oncology company focused on developing and commercializing small molecule therapeutics for patients suffering from rare and aggressive cancers, primarily in genetically defined patient populations, today reported financial results for the full year ended December 31, 2020 and highlighted recent progress and upcoming milestones for its pipeline programs.

“We are pleased with all that we were able to accomplish in 2020 despite the ongoing challenges of the COVID-19 pandemic, keeping clinical execution and patient and employee safety at the forefront of our everyday work. In 2020, we announced encouraging new data from the Phase 2 ACCURACY study of AL101 in R/M ACC, demonstrating initial safety and efficacy for the 4mg monotherapy cohort and we look forward to reporting additional data, including new 6mg cohort results from this program later this year,” said Roni Mamluk, Ph.D., Chief Executive Officer of Ayala. “With a strong foundation built in 2020, we have already achieved significant milestones across our broader pipeline in 2021 with the first patient dosing in our Phase 2 TENACITY trial in TNBC, accelerated development pathway and pivotal trial design for AL102 in desmoid tumors, as well as our $25 million strategic financing. We look forward to continuing this momentum with several key clinical milestones expected during the remainder of this year, including two new trial initiations and interim data readouts.”

Business and Clinical Highlights

  • Completed $25 million
    Strategic Financing:
    In February 2021, Ayala announced a $25 million strategic financing with investors including Redmile Group and SIO Capital Management, extending its cash runway into 2023.
  • Dosed First Patient in
    Phase 2 TENACITY Clinical Trial of AL101 for the Treatment of
    Notch-Activated Triple Negative Breast Cancer:
    In January 2021, Ayala announced the dosing of the first patient in the Phase 2 TENACITY clinical trial of its potent, selective small molecule, AL101, for the treatment of patients with Notch-activated recurrent or metastatic (R/M) triple negative breast cancer (TNBC).
  • Accelerated Development
    of AL102 for the Treatment of Desmoid Tumors with Pivotal Trial:
    In January 2021, Ayala announced that based on its end-of-Phase 1 meeting with the U.S. Food and Drug Administration (FDA) on AL102 for the treatment of desmoid tumors, and data from AL101 and AL102 Phase 1 studies
    including durable responses observed in patients with desmoid tumors,
    the FDA agreed to advance the program into a Phase 2/3 pivotal trial.
  • Presented Updated Positive Interim Data from Phase 2 ACCURACY Study of AL101 for the
    Treatment of Recurrent/Metastatic Adenoid Cystic Carcinoma at European
    Society for Medical Oncology (ESMO) Virtual Congress 2020:
    In September 2020, Ayala presented updated interim data from the 4mg cohort of its ongoing Phase 2 ACCURACY study of AL101 for the treatment of recurrent/metastatic adenoid cystic carcinoma (R/M ACC) harboring Notch activating mutations, demonstrating meaningful clinical activity of AL101 4mg monotherapy with a 68% disease control rate across 40 evaluable patients. Partial responses were observed in six subjects (15%) and stable disease was observed in 21 subjects (53%).


Upcoming Milestones

  • On Track to Initiate Phase 2/3 Pivotal RINGSIDE Clinical Trial of AL102 for the
    Treatment of Desmoid Tumors:
    Ayala expects to initiate the pivotal RINGSIDE clinical trial of AL102 in adult and adolescent patients with desmoid tumors in the first half of 2021. Ayala expects an
    initial interim data read-out from part A and dose selection by mid-2022 with part B of the study
    commencing immediately thereafter
    .
  • Patient
    Enrollment in 6mg Cohort of Phase 2 ACCURACY Study Ongoing:
    Ayala continues to enroll patients in the 6mg cohort of the Phase 2 ACCURACY study of AL101 for the treatment of R/M ACC, which will contain up to 42 subjects. The Company expects to provide further trial progress updates, including additional data, in the second half of 2021.
  • TENACITY Preliminary Data to be Reported in 2021: Ayala expects to report preliminary data from the recently initiated Phase 2 TENACITY clinical trial of AL101 for the treatment of R/M TNBC in the second half of 2021.


Full Year 2020 Financial Results

  • Cash Position: Cash and cash equivalents were $42.4 million as of December 31, 2020,
    as compared to $16.8 million
    as of December 31, 2019. The increase in cash and cash equivalents was primarily due to Ayala’s initial public offering in May 2020.
  • Collaboration Revenue: Collaboration revenue was $3.7 million for the full year of 2020, as compared to $2.3 million for the same period in 2019. The increase was primarily attributable to the advancement of Ayala’s
    collaboration with Novartis in 2020.
  • R&D Expenses: Research and development expenses were $22.4 million for the full year 2020, compared to $14.4 million for the same period in 2019. The increase was primarily driven by an increase in expenses in connection with the advancement of the clinical trials in ACC and TNBC.
  • G&A Expenses: General and administrative expenses were $7.4 million for the full year 2020, compared to $4.3 million for the same period in 2019. The increase was primarily related to increased costs in connection with becoming a publicly traded company in 2020.
  • Net Loss: Net loss was $30.1 million for the full year 2020, resulting in a basic net loss per share of $3.06 and a diluted net loss per share of $3.06. Net loss was $17.8 million for the same period in 2019, resulting in a basic net loss per share of $3.57 and a diluted net loss per share of $3.57.


Financial Guidance

Ayala expects its existing cash balance to fund operating expenses and capital expenditure requirements through multiple potential key clinical and development milestones into 2023.


About Ayala Pharmaceuticals

Ayala Pharmaceuticals, Inc. is a clinical-stage oncology company focused on developing and commercializing small molecule therapeutics for patients suffering from rare and aggressive cancers, primarily in genetically defined patient populations. Ayala’s approach is focused on predicating, identifying and addressing tumorigenic drivers of cancer through a combination of its bioinformatics platform and next-generation sequencing to deliver targeted therapies to underserved patient populations. The company has two product candidates under development, AL101 and AL102, targeting the aberrant activation of the Notch pathway with gamma secretase inhibitors to treat a variety of tumors including Adenoid Cystic Carcinoma, Triple Negative Breast Cancer (TNBC), T-cell Acute Lymphoblastic Leukemia (T-ALL), Desmoid Tumors and Multiple Myeloma (MM) (in collaboration with Novartis). Ayala’s lead product candidate, AL101, has received Fast Track Designation and Orphan Drug Designation from the U.S. FDA and is currently in a Phase 2 clinical trial for patients with ACC (ACCURACY) bearing Notch activating mutations and in a Phase 2 clinical trial for patients with TNBC (TENACITY) bearing Notch activating mutations and other gene rearrangements. AL102 is currently being advanced to a Phase 2/3 clinical trials for patients with desmoid tumors (RINGSIDE). For more information, visit www.ayalapharma.com.


Contacts:

Investors:
Julie Seidel
Stern Investor Relations, Inc.
+1-212-362-1200
Julie.seidel@sternir.com

Ayala Pharmaceuticals:
+1-857-444-0553
info@ayalapharma.com


Forward-Looking Statements

This press release contains forward-looking statements within the meaning of the Private Securities Litigation Reform Act of 1995. All statements contained in this press release that do not relate to matters of historical fact should be considered forward-looking statements, including statements relating to our development of AL101 and AL102, the promise and potential impact of our preclinical or clinical trial data, the timing of and plans to initiate additional clinical trials of AL101 and AL102, upcoming milestones, including without limitation the timing and results of any clinical trials or readouts, patient enrollment and the sufficiency of cash to fund operations. These forward-looking statements are based on management’s current expectations. The words “may,” “will,” “should,” “expect,” “plan,” “anticipate,” “could,” “intend,” “target,” “project,” “estimate,” “believe,” “predict,” “potential” or “continue” or the negative of these terms or other similar expressions are intended to identify forward-looking statements, although not all forward-looking statements contain these identifying words. These statements are neither promises nor guarantees, but involve known and unknown risks, uncertainties and other important factors that may cause our actual results, performance or achievements to be materially different from any future results, performance or achievements expressed or implied by the forward-looking statements, including, but not limited to, the following: the impact of the COVID-19 pandemic on our operations, including our preclinical studies and clinical trials, and the continuity of our business; we have incurred significant losses, are not currently profitable and may never become profitable; our need for additional funding; our cash runway; our limited operating history and the prospects for our future viability; the lengthy, expensive, and uncertain process of clinical drug development, including potential delays in regulatory approval; our requirement to pay significant payments under product candidate licenses; the approach we are taking to discover and develop product candidates and whether it will lead to marketable products; the expense, time-consuming nature and uncertainty of clinical trials; enrollment and retention of patients; potential side effects of our product candidates; our ability to develop or to collaborate with others to develop appropriate diagnostic tests; protection of our proprietary technology and the confidentiality of our trade secrets; potential lawsuits for, or claims of, infringement of third-party intellectual property or challenges to the ownership of our intellectual property; risks associated with international operations; our ability to retain key personnel and to manage our growth; the potential volatility of our common stock; costs and resources of operating as a public company; unfavorable or no analyst research or reports; and securities class action litigation against us. These and other important factors discussed under the caption “Risk Factors” in our
Annual
Report on Form 10-K for the year ended December 31, 2020 filed with the U.S. Securities and Exchange Commission (SEC) on March 24, 2021 and our other filings with the SEC could cause actual results to differ materially from those indicated by the forward-looking statements made in this press release. Any such forward-looking statements represent management’s estimates as of the date of this press release. New risk factors and uncertainties may emerge from time to time, and it is not possible to predict all risk factors and uncertainties. While we may elect to update such forward-looking statements at some point in the future, except as required by law, we disclaim any obligation to do so, even if subsequent events cause our views to change. Although we believe the expectations reflected in such forward-looking statements are reasonable, we can give no assurance that such expectations will prove to be correct. These forward-looking statements should not be relied upon as representing our views as of any date subsequent to the date of this press release.

 
AYALA PHARMACEUTICALS, INC.
CONSOLIDATED BALANCE SHEETS
U.S. dollars in thousands (except share and per share data)
 
    December 31,
2019
    December 31,
2020
 
Assets                
Current Assets:                
Cash and Cash Equivalents   $ 16,725     $ 42,025  
Short-Term Restricted Bank Deposits     83       90  
Trade Receivables     469       681  
Prepaid Expenses and Other Current Assets     417       1,444  
Total Current Assets     17,694       44,240  
Long-Term Assets:                
Other Assets     283       305  
Deferred Offering Costs     656        
Property and Equipment, Net     1,421       1,283  
Total Long-Term Assets     2,360       1,588  
Total Assets   $ 20,054     $ 45,828  
Liabilities, Convertible Preferred Stock, and Stockholders’ (Deficit) Equity:                
Current Liabilities:                
Trade Payables   $ 2,922     $ 3,726  
Other Accounts Payables     2,380       3,151  
Total Current Liabilities     5,302       6,877  
Long-Term Liabilities:                
Long-Term Rent Liability     299     $ 553  
Total Long-Term Liabilities   $ 299     $ 553  
Convertible Preferred Stock, $0.01 par value:                
Series A Preferred Stock of $0.01 par value per share; 3,700,000 shares authorized at December 31, 2019; 3,679,778 issued and outstanding shares at December 31, 2019; aggregate liquidation preference value of $23,919 at December 31, 2019     23,823        
Series B Preferred Stock of $0.01 par value per share; 4,500,000 shares authorized at December 31, 2019; 3,750,674 issued and outstanding shares at December 31, 2019, respectively; aggregate liquidation preference value of $29,668 at December 31, 2019     29,550        
     Total Convertible Preferred Stock     53,373        
Stockholders’ (Deficit) Equity:                
Common Stock of $0.01 par value per share; 20,000,000 and 200,000,000 shares authorized at December 31, 2019 and 2020, respectively; shares issued at December 31, 2019 and 2020, respectively; 4,998,874 and 12,728,446 shares outstanding at December 31, 2019 and 2020, respectively   $ 51     $ 128  
Additional Paid-in Capital     1,770       109,157  
Accumulated Deficit     (40,741 )     (70,887 )
Total Stockholders’ (Deficit) Equity     (38,920 )     38,398  
Total Liabilities, Convertible Preferred Stock, and Stockholders’ (Deficit) Equity   $ 20,054     $ 45,828  


AYALA PHARMACEUTICALS, INC.
CONSOLIDATED STATEMENTS OF OPERATIONS
U.S. dollars in thousands (except shares and per shares data)
 
    Year ended
December 31,
2019
    Year ended
December 31,
2020
 
Revenue from License Agreement   $ 2,334     $ 3,708  
Cost of Revenue     (1,285 )     (3,708 )
Gross Profit     1,049        
Research and Development   $ 14,424     $ 22,406  
General and Administrative     4,336       7,371  
Operating Loss     (17,711 )     (29,777 )
Financial Income, Net     225       56  
Loss before Income Tax     (17,486 )     (29,721 )
Taxes on Income     (306 )     (425 )
Net Loss attributable to Common Stockholders   $ (17,792 )   $ (30,146 )
Net Loss per Share attributable to Common Stockholders, Basic and Diluted   $ (3.57 )   $ (3.06 )
Weighted Average Shares Used to Compute Net Loss per Share, Basic and Diluted     4,979,606       9,860,610  

Source: Ayala Pharmaceuticals