Breakdown How Might Americans Allocate Their Stimulus Checks


Breakdown How Americans Might Allocate Their Stimulus Checks


Individually the stimulus checks being sent may not have a measurable impact on the 85% of Americans expected to receive them. However, in the aggregate, the force of the combined payments of $1400 (individuals) earning up to $75,000, and a little less for those up to $80,000, will add to the bottom lines of different industries, as we’ve seen before, can send sectors of the stock market soaring.

We thought you’d like a look at some numbers off of The Census Bureau’s Household Pulse Survey to see what people said they did with their last stimulus check earlier in 2021.


This
Household Pulse survey was taken between February 3–15.

Just over half of all surveyed adults said they are part of a household where someone received a stimulus payment within the previous week.

-57% of respondents said at least part of the checks were used to pay for food.

-44% said part or all of the check would be used to pay for utilities.

-21% Would use the money toward vehicle payments.

-15% used their stimulus check during that period toward savings and investment.


Release – Gevo (GEVO) – Reports Fourth Quarter 2020 Financial Results


Gevo Reports Fourth Quarter 2020 Financial Results


Gevo to Host Conference Call Today at 4:30 p.m. EDT/2:30 p.m. MDT

ENGLEWOOD,
Colo. – March 17, 2021
– Gevo, Inc. (NASDAQ: GEVO) today announced financial results for the fourth quarter of 2020 and recent corporate highlights.

Recent Corporate Highlights

  • In January 2021, Gevo announced the plans for its Net-Zero 1 Project (“Net-Zero 1”) to be located in Lake Preston, South Dakota.  Net-Zero 1 is expected to produce about 45 MGPY of energy dense liquid hydrocarbons that, when burned as transportation fuels, should have a net-zero greenhouse gas footprint across the whole of the life cycle based on Argonne National Laboratories’ GREET model.  Net-Zero 1 is being designed to eliminate the fossil based energy footprint to run the production facility.  Importantly, Net-Zero 1 is expected to produce ~400 million pounds per year of protein rich animal feed, and about 30 million pounds per year of corn oil.  The 45 MGPY of hydrocarbons would be sold into the gasoline and jet fuel markets under existing take-or-pay contracts.  Net-Zero 1 is expected to produce its own biogas.  The biogas would be used to heat the production facility and provide approximately 30% of the electricity needed to power the production facility.   In addition, wind power is being developed and is expected to supply the other 70% of electricity needed to run the production facility.  Green hydrogen will also be produced from the renewable electricity as part of the productions processes at Net-Zero 1.  Net-Zero 1 is also expected to have its own water treatment plant to further improve the environmental footprint.
  • In February 2021, Gevo signed an amendment to its Fuel Sales Agreement with Scandinavian Airlines System (“SAS”) for sustainable aviation fuel.  The volume in the amendment is 5 million gallons per year, and is a “take-or-pay” contract worth ~$100 of revenue across the life of the contract.  This volume for the SAS contract is expected to be supplied by Gevo’s second Net-Zero Project beginning in 2024.
  • As of February 26, 2021, Gevo had approximately $530.6 million in cash and no significant debt.
  • Gevo believes it has the cash on the balance sheet needed to fund the project equity required for Net-Zero 1.  A tax-exempt private activity bond debt structure has been developed and vetted by Citigroup which Gevo currently expects to utilize.  In order to close the financing for Net-Zero 1, the engineering design and costs first need to be delivered in suitable form for project style financing, and the EPC firm needs to be selected prior to the bond offering.  The financial close for Net-Zero 1 is targeted for the first half of 2022.
  • In January 2021, Gevo announced that it had selected Koch Process Solutions to provide the Front End Engineering and Design services (FEED) for Net-Zero 1.  FEED is expected to be completed in December of 2021.  The completion of the FEED work is necessary before the financing of Net-Zero 1 can be completed with Citigroup Global Markets, Inc.
  • In January 2021, Gevo completed a registered direct offering of 43.7 million shares of common stock (or common stock equivalents) at $8.0 per share. Total proceeds were $321.7 million, net of closing costs.
  • In January 2021, Gevo raised $135.8 million, net of fees, by issuing 24.4 million shares of common stock through its At-the-Market (“ATM”) offering program.
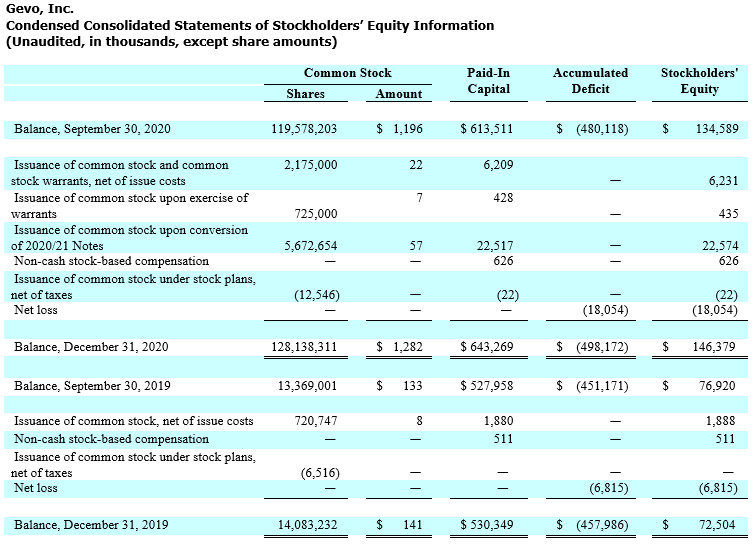
  • In December 2020, the holders of Gevo’s 12.0% Convertible Senior Secured Notes due 2020/2021 (the “2020/21 Notes”) converted $12.7 million in aggregate outstanding principal amount of 2020/21 Notes (including the applicable make-whole payment) into an aggregate of 5,672,654 shares of common stock.  As a result, as of December 31, 2020, all obligations under the 2020/2021 Notes had been fully paid and satisfied.
  • In December 2020, Gevo entered into an option agreement for the right to purchase approximately 240 acres of land near Lake Preston, SD.  Gevo expects to construct its Net-Zero 1 Project on this land. 

2020 Fourth Quarter Financial Highlights

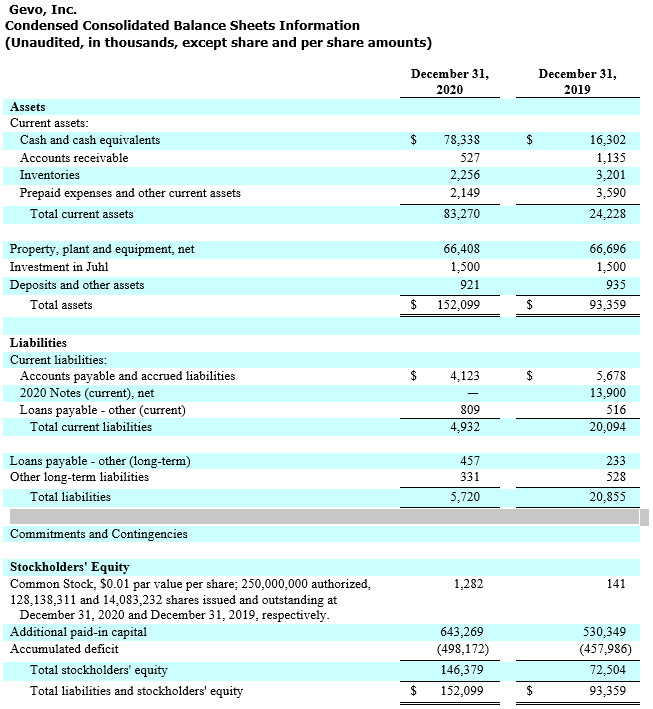
  • Ended the quarter with cash and cash equivalents of $78.3 million. 
  • Revenue totaled $0.5 million for the quarter compared to $6.9 million in Q4 2019.
  • Hydrocarbon revenue totaled $0.4 million for the quarter compared to $1.0 million in Q4 2019.
  • Loss from operations of ($7.0) million for the quarter compared to ($6.2) million in Q4 2019.
  • Non-GAAP cash EBITDA loss[1] of ($5.1) million for the quarter compared to ($4.0) million in Q4 2019.
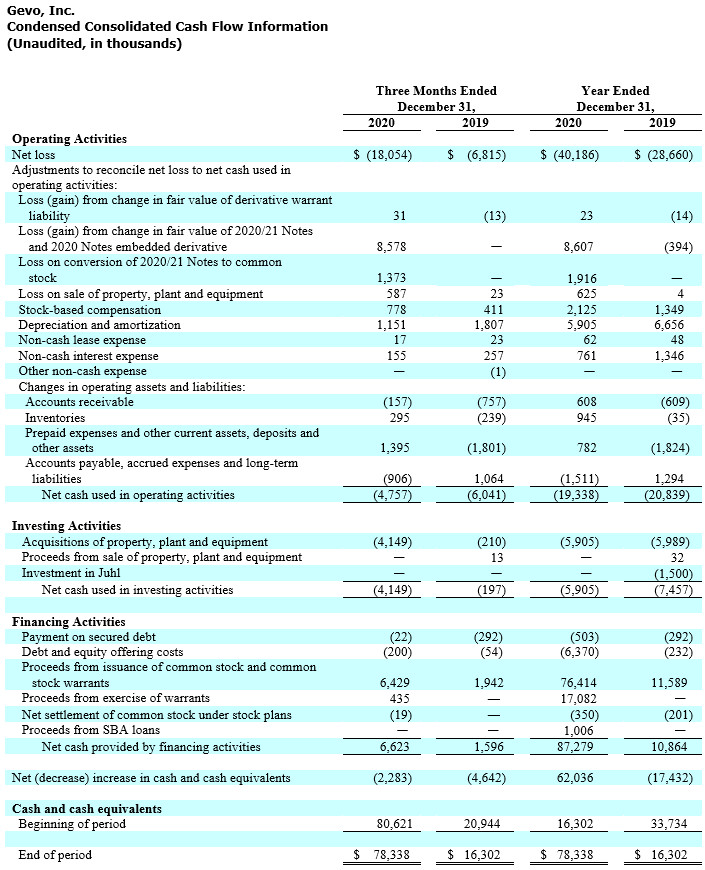
  • Net loss per share of ($0.15) based on 120,017,120 weighted average shares outstanding for the quarter compared to ($0.50) based on 13,659,944 weighted average shares outstanding for the quarter in Q4 2019.
  • Non-GAAP adjusted net loss per share[2] of ($0.07) based on 120,017,120 weighted average shares outstanding for the quarter compared to ($0.50) based on 13,659,944 weighted average shares outstanding for the quarter in Q4 2019.

Commenting on the fourth quarter of 2020 and recent corporate events, Dr. Patrick R. Gruber, Gevo’s Chief Executive Officer, said “Net-Zero 1 is a first of a kind, off-the-grid type of plant where we are putting great effort into making Net-Zero 1 the most sustainable plant it can be.  I’m glad we have the customers secured, Citigroup to help us with the debt financing, and that the economics of Net-Zero 1 are attractive at this stage.  I’m also pleased that we are making progress on filling up production capacity at Net-Zero 2 as evidenced by the recent SAS contract.  We are making great progress, fast.”

Fourth Quarter 2020 Financial Results

Revenue for the three months ended December 31, 2020 was $0.5 million compared with $6.9 million in the same period in 2019.

Revenue
derived at our production facility located in Luverne, Minnesota (
the “Luverne Facility”) related to ethanol sales and related products was nil compared to $5.9 million for the fourth quarter of 2020. As a result of COVID-19 and in response to an unfavorable commodity environment, Gevo terminated its production of ethanol and distiller grains at the Luverne Facility in March 2020.  The Luverne Facility is currently shut down until further notice. Currently, the South Hampton Facility is not producing renewable premium gasoline or jet fuel. Gevo expects to produce isobutanol in intermittent campaigns during 2021 to supply the demonstration plant at the South Hampton Resources, Inc. facility in Silsbee, Texas (the “South Hampton Facility”) so that renewable premium gasoline or jet fuel can be produced in 2021.

During the three months ended December 31, 2020, hydrocarbon revenue was $0.4 million compared with $1.0 million in the same period in 2019 as a result of decreased shipments of finished products from our demonstration plant at the South Hampton Facility. Gevo’s hydrocarbon revenue is comprised of sales of alcohol-to-jet fuel, isooctane and isooctene.

Cost of goods sold was $2.0 million for the three months ended December 31, 2020, compared with $9.4 million in the same period in 2019, primarily as a result of terminating ethanol production at the Luverne Facility as discussed above. Cost of goods sold included approximately $0.9 million associated with the production of isobutanol and related products and maintenance of the Luverne Facility and approximately $1.1 million in depreciation expense for the three months ended December 31, 2020.

Gross loss was $1.4 million for the three months ended December 31, 2020, versus a $2.5 million gross loss in the same period in 2019.

Research and development expense increased by $1.7 million during the three months ended December 31, 2020 compared with the same period in 2019, due primarily to an increase in consultant and personnel expenses.

Selling, general and administrative expense increased by $0.2 million during the three months ended December 31, 2020, compared with the same period in 2019, due primarily to an increase in consulting and personnel costs offset by a decrease in investor relations and marketing costs.

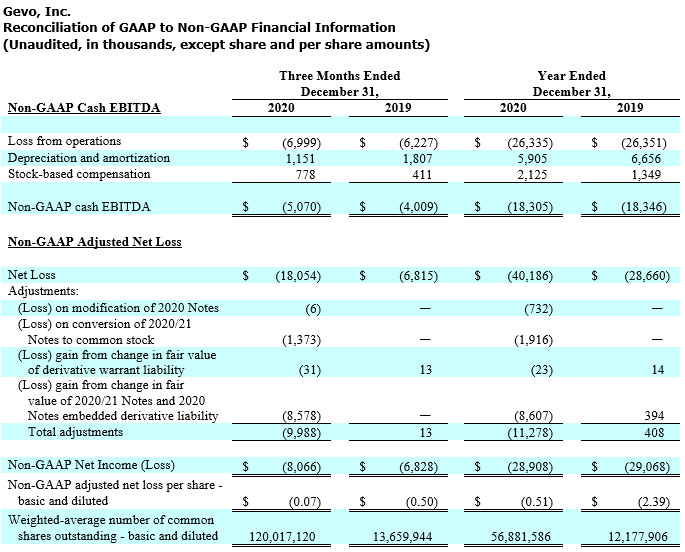
Loss from operations in the three months ended December 31, 2020 was $(7.0) million, compared with a ($6.2) million loss from operations in the same period in 2019.

Non-GAAP cash EBITDA loss[3] in the three months ended December 31, 2020 was ($5.1) million, compared with a ($4.0) million non-GAAP cash EBITDA loss in the same period in 2019.

Interest expense in the three months ended December 31, 2020 was $0.5 million, a decrease of $0.1 million as compared to the same period in 2019, primarily due to a decline in amortization of original issue discounts and debt issuance costs compared to the same period last year and the conversion of $2.0 million of 2020/21 Notes in July 2020.

In the three months ended December 31, 2020, Gevo recognized net non-cash loss totaling $1.4 million due to the conversion of $12.7 million of 2020/21 Notes during December 2020.

During the three months ended December 31, 2020, Gevo recognized net non-cash loss totaling $8.6
million due to changes in the fair value of our 2020/21 Notes embedded derivative liability resulting from the increase in the price of our common stock prior to the conversion of the $12.7 million of 2020/21 Notes.

Gevo incurred a net loss for the three months ended December 31, 2020 of ($18.1) million, compared with a net loss of ($6.8) million during the same period in 2019. Non-GAAP adjusted net loss[4] for the three months ended December 31, 2020 was ($8.1) million, compared with a non-GAAP adjusted net loss of ($6.8) million during the same period in 2019.

Cash at December 31, 2020 was $78.3 million, and the total principal face value of 2020/21 Notes was $0.

Webcast
and Conference Call Information

Hosting today’s conference call at 4:30 p.m. EDT (2:30 p.m. MDT) will be Dr. Patrick R. Gruber, Chief Executive Officer, L. Lynn Smull, Chief Financial Officer, Carolyn M. Romero, Chief Accounting Officer, and Geoffrey T. Williams, Jr., Vice President – General Counsel & Secretary. They will review Gevo’s financial results and provide an update on recent corporate highlights.

To participate in the conference call, please dial (833) 729-4776 (inside the U.S.) or (830) 213-7701 and reference the access code 3178466#, or through the event weblink: https://edge.media-server.com/mmc/p/xhvdnuqd.

A replay of the call and webcast will be available two hours after the conference call ends on March 17, 2021. To access the replay, please visit https://edge.media-server.com/mmc/p/xhvdnuqd. The archived webcast will be available in the Investor Relations section of Gevo’s website at www.gevo.com.


About Gevo

Gevo’s mission is to transform renewable energy and carbon into energy-dense liquid hydrocarbons. These liquid hydrocarbons can be used for drop-in transportation fuels such as gasoline, jet fuel, and diesel fuel, that when burned have potential to yield net-zero greenhouse gas emissions when measured across the full lifecycle of the products. Gevo uses low-carbon renewable resource-based carbohydrates as raw materials, and is in an advanced state of developing renewable electricity and renewable natural gas for use in production processes, resulting in low-carbon fuels with substantially reduced carbon intensity (the level of greenhouse gas emissions compared to standard petroleum fossil-based fuels across their lifecycle). Gevo’s products perform as well or better than traditional fossil-based fuels in infrastructure and engines, but with substantially reduced greenhouse gas emissions. In addition to addressing the problems of fuels, Gevo’s technology also enables certain plastics, such as polyester, to be made with more sustainable ingredients. Gevo’s ability to penetrate the growing low-carbon fuels market depends on the price of oil and the value of abating carbon emissions that would otherwise increase greenhouse gas emissions. Gevo believes that its proven, patented, technology enabling the use of a variety of low-carbon sustainable feedstocks to produce price-competitive low carbon products such as gasoline components, jet fuel, and diesel fuel yields the potential to generate project and corporate returns that justify the build-out of a multi-billion-dollar business.

Gevo believes that Argonne National Laboratory GREET model is the best available standard of scientific based measurement for life cycle inventory or LCI.

Learn more at Gevo’s website: www.gevo.com

Forward-Looking Statements

Certain statements in this press release may constitute “forward-looking statements” within the meaning of the Private Securities Litigation Reform Act of 1995. These forward-looking statements relate to a variety of matters, including, without limitation, Gevo’s business development activities, Gevo’s Net-Zero Projects, Gevo’s offtake agreements, Gevo’s plans to develop its business, Gevo’s ability to successfully construct and finance its operations and growth projects, Gevo’s ability to achieve cash flow from its planned projects, the ability of Gevo’s products to contribute to lower greenhouse gas emissions, particulate and sulfur pollution and other statements that are not purely statements of historical fact. These forward-looking statements are made based on the current beliefs, expectations and assumptions of the management of Gevo and are subject to significant risks and uncertainty. Investors are cautioned not to place undue reliance on any such forward-looking statements. All such forward-looking statements speak only as of the date they are made, and Gevo undertakes no obligation to update or revise these statements, whether as a result of new information, future events or otherwise. Although Gevo believes that the expectations reflected in these forward-looking statements are reasonable, these statements involve many risks and uncertainties that may cause actual results to differ materially from what may be expressed or implied in these forward-looking statements. For a further discussion of risks and uncertainties that could cause actual results to differ from those expressed in these forward-looking statements, as well as risks relating to the business of Gevo in general, see the risk disclosures in the Annual Report on Form 10-K of Gevo for the year ended December 31, 2020 and in subsequent reports on Forms 10-Q and 8-K and other filings made with the U.S. Securities and Exchange Commission by Gevo.

Non-GAAP Financial Information

This press release contains financial measures that do not comply with U.S. generally accepted accounting principles (GAAP), including non-GAAP cash EBITDA loss, non-GAAP adjusted net loss and non-GAAP adjusted net loss per share. Non-GAAP cash EBITDA excludes depreciation and non-cash stock-based compensation. Non-GAAP adjusted net loss and adjusted net loss per share excludes non-cash gains and/or losses recognized in the quarter due to the changes in the fair value of certain of Gevo’s financial instruments, such as warrants, convertible debt and embedded derivatives. Management believes these measures are useful to supplement its GAAP financial statements with this non-GAAP information because management uses such information internally for its operating, budgeting and financial planning purposes. These non-GAAP financial measures also facilitate management’s internal comparisons to Gevo’s historical performance as well as comparisons to the operating results of other companies. In addition, Gevo believes these non-GAAP financial measures are useful to investors because they allow for greater transparency into the indicators used by management as a basis for its financial and operational decision making. Non-GAAP information is not prepared under a comprehensive set of accounting rules and therefore, should only be read in conjunction with financial information reported under U.S. GAAP when understanding Gevo’s operating performance. A reconciliation between GAAP and non-GAAP financial information is provided in the financial statement tables below.


[1] Cash EBITDA loss is a non-GAAP
measure calculated by adding back depreciation and non-cash stock compensation
to GAAP loss from operations. A reconciliation of cash EBITDA loss to GAAP loss
from operations is provided in the financial statement tables following this
release.

[2] Adjusted net loss per share is a
non-GAAP measure calculated by adding back non-cash gains and/or losses
recognized in the quarter due to the changes in the fair value of certain of
our financial instruments, such as warrants, convertible debt and embedded
derivatives, to GAAP net loss per share. A reconciliation of adjusted net loss
per share to GAAP net loss per share is provided in the financial statement
tables following this release.

[3] Cash EBITDA loss is a non-GAAP
measure calculated by adding back depreciation and non-cash stock compensation
to GAAP loss from operations. A reconciliation of cash EBITDA loss to GAAP loss
from operations is provided in the financial statement tables following this
release.

[4] Adjusted net loss is a non-GAAP
measure calculated by adding back non-cash gains and/or losses recognized in
the quarter due to the changes in the fair value of certain of our financial
instruments, such as warrants, convertible debt and embedded derivatives, to
GAAP net loss. A reconciliation of adjusted net loss to GAAP net loss is
provided in the financial statement tables following this release.


Gevo,
Inc.


Investor and Media Contact

+1 720-647-9605

IR@gevo.com

Uranium is an ESG Energy Source Getting More Attention


How Does Uranium Fit Into the ESG Energy Landscape?


Since the November elections in the U.S., so-called ESG (environmental, social, and governance) stocks have seen a dramatic uptick as investors anticipate a shift in policy away from fossil fuels and towards cleaner-burning energy sources.

While perhaps not an obvious clean energy investment play, uranium and rare earth producers have benefitted from this ESG boom.  Despite the known risks associated with nuclear power, nuclear power plants represent a carbon and emission-free source of energy.

The months following the Fukushima disaster, in March 2011, saw a drop in nuclear-power generation of about 11%, but the industry remained strong, representing about 10% of total global electricity generation.  Today, In the U.S., nuclear power generates about 20% of the total electricity consumed.

Upward pressure on uranium’s price?

The price of uranium is driven by nuclear power demand, global supply and inventories, and macroeconomic and political factors. The highest demand for uranium is nuclear power use. Factors impacting this demand are the price of alternative generating fuels like coal, oil, and natural gas. Higher fossil-fuel prices increases demand for nuclear generation.

Nuclear accidents such as Chernobyl or the Fukushima tsunami have the potential to very quickly turn public sentiment against nuclear generation. These two accidents (Chernobyl 1986) and Fukishima Daiichi (2011) are the only two events with reported release of radioactivity. Although public sentiment towards nuclear quickly turned negative after these two and the Three Mile Island (1979) cooling malfunction, which did not involve radioactive release, there have been over 18,500 cumulative reactor-years of commercial nuclear power operation in 36 countries. Although this track record puts public safety numbers inline or lower than many other acceptable industries, it is still a factor in public policy.

Electricity demand is often correlated with a strong economy. When world economies are expanding, industries and consumers require more electricity. This increased demand drives more demand from all sources of power. With current politics leaning more heavily toward non-fossil fuel solutions to satisfy demand increases, nuclear power is again on the rise.

The current U.S. and global environment is one where demand for energy is increasing. Traditional generating fuels such as coal and oil are at odds with the current environmentally minded political climate. Fuels with minimum carbon emissions are gaining in popularity, adoption, and government support.


Some Companies Involved in Uranium Production

Energy Fuels (UUUU)

Energy Fuels is the leading U.S. producer of uranium and vanadium, and an emerging player in the commercial rare earth business where its work is helping to reestablish a fully integrated U.S. supply chain. The company boasts more production capacity, licensed mines and processing facilities, and in-ground uranium resources than any other U.S.-based producer.

Energy Fuels recently announced that they had received the first shipments of natural monazite ore, with commercial recovery of rare earths expected to begin in the U.S. in the coming weeks, as part of their increased “rare earths” focus.  In the press release, Mark S. Chalmers, President and CEO of Energy Fuels stated: “Over the past few months, Energy Fuels, Neo and Chemours have quietly worked to create something very significant: a new, fully-integrated, U.S.-Europe rare earth supply chain. This weekend’s shipments of monazite ore from Chemours to Energy Fuels marks the beginning of operations for what we believe will become a burgeoning supply chain. There is a lot of excitement building for rare earths, because they make many clean energy and advanced technologies possible, including electric vehicles, wind generation, batteries, and advanced electronics. Today’s announcement is a key milestone as our companies create, refine, and grow a sustainable rare earth supply chain capable of supplying the growing demand for clean technologies in the U.S. and Europe.

Over the past three months, the UUUU price per share has increased over 75%, with the company’s market cap recently surpassing $750MM.

Watch the video
replay
of Energy Fuels CEO Mark Chalmers presentation at NobleCon17 (January 2021).


enCore Energy Corp (ENCUF)

enCore Energy is a domestic uranium developer focused on becoming a leading in-situ recovery (ISR) uranium producer, based in the U.S. In-site recovery mining involves leaving the ore in the ground, dissolving the minerals in place and pumping the solution created to the surface.  enCore’s flagship ISR project hosts an indicated mineral resource containing 26.6 million pounds of uranium.  The company also has several high-grade conventional projects in the U.S.

In January, 2021 enCore Energy acquired Westwater Resources’ Texas-based uranium production and resource assets, which included two licensed in-situ recovery uranium production facilities, as well as mineral exploration leases in Texas, and more than 270 square miles of deeded mineral rights in New Mexico. 

William M. Sheriff, Executive Chairman of enCore Energy stated “This transformational acquisition is the first significant step to build enCore into a domestic uranium producer. Our experienced and accomplished management team believes that a major change is coming in the uranium market in the next 12 to 24 months. The recent impressive strength in the uranium equity market is evidence of a broader realization within the financial community of the early changes in the dynamics of the uranium market. In addition to the key acquisition of licensed production facilities in Texas, enCore will hold the leading land position in New Mexico, consolidating the large Santa Fe and Frisco railroad “checkerboard” mineral rights land grant running through most of the Grants mineral belt.

Shares of ENCUF have traded over 60% higher over the past 3 months.  The company’s market cap is just under $150MM.

Watch the video
replay
of encore Energy CEO Paul Goranson and Executive Chairman William Sheriff  presentation at NobleCon17 (January 2021).


Standard Uranium Ltd. (STTDF)

Standard Uranium is a pre-discovery uranium exploration company based in Canada.  The company’s primary focus is its Davidson River flagship project in the Southwest Athabasca Uranium District.

In February, the company began its phase II winter drill program at its Davidson River Project.  The project will consist of ~4500m of diamond drilling in 9 holes. Jon Bey, President, CEO and Chairman commented: “It is great to see the drills turning again on our Davidson River Project and to have the Aggressive Drilling team working with us once again. Their experience with our Phase I drilling program, and in this region, will go a long way to help us in making a high-grade uranium discovery. Our technical team have prepared an exciting drill program and I look forward to getting to the project site to view core with them.”

STTDF has risen 26% over the past 3 months.

Watch the Video
Replay
  of Standard Uranium CEO Jon Bey presentation at NobleCon17 (January 2021).


Ur-Energy Inc. (URG)

Ur-Energy is a junior mining company operating an in-situ uranium facility in Wyoming.  Their Lost Creek processing facility is designed to have a two million pound-per-year capacity.  They have produced, packaged, and shipped more than 2.6 million pounds from Lost Creek since the commencement of operations. Ur-Energy engages in a wide range of uranium mining and recovery operations, with activities including acquisition, exploration, development, and operation of uranium mineral properties.

Ur-Energy recently announced the closing of a $15.24MM public equity offering.  They anticipate using the proceeds from the offering to maintain and enhance operational readiness, for possible strategic transactions and/or acquisitions, and for operating capital.

In a recent press release covering 2020 year-end results, Ur-Energy CEO, Jeff Klenda said: “We look forward to 2021 as a year with numerous prospective catalysts for the domestic uranium recovery industry – catalysts from which our proven operational results at Lost Creek position us to benefit. We are pleased that, already, the Biden Administration has committed to integrate nuclear energy into its clean energy mandate, which is coupled with its pledge, expressed just this week, to ‘expand and strengthen domestic mining and processing capacity of the U.S. These priorities, and the growing bipartisan support for nuclear energy, will facilitate the formation of the national uranium reserve approved in December 2020, as well as implementation of other recommendations of the U.S. Nuclear Fuel Working Group.”

URG is up 77% over the past 3 months.

Take-Away

There is no way to overstate the importance of energy in society or the economy at large. It’s a necessity that can only grow. The current trend away from carbon-emitting fossil-fuels and toward fuel sources viewed to have a less negative impact on the planet is changing the wealth of companies involved in sourcing fuel and products related to alternatives.  Investors are looking beyond wind and solar to also consider uranium producers and the potential for nuclear-generated electricity demand to experience increased growth.

Content Team, Channelchek


Suggested Reading:


Lithium-Ion Battery Recycling Market Heats Up Is the Price of Uranium Rising?


What to Look for in Mining Stocks? What is an ESG Score?


Watch Channelchek’s C-Suite
Interview
with Capstone Turbine’s Darren Jamison


Capstone Turbine (CPST) CEO Darren Jamison

Micro-turbines: an economically competitive green energy source with flexible application

  • Customer base; largest current clients, pandemic impacts on growth, and the post-covid strategy
  • The future of hydrogen and its use as a blending fuel
  • Recent Texas blackouts and the impact of natural disasters
  • Service business growth, reoccurring revenues, and their current cash position


Sources:


https://www.world-nuclear.org/information-library/nuclear-fuel-cycle/mining-of-uranium/in-situ-leach-mining-of-uranium.aspx

https://www.world-nuclear.org/information-library/safety-and-security/safety-of-plants/safety-of-nuclear-power-reactors.aspx

https://finance.yahoo.com/news/ur-energy-releases-2020-end-230500192.html

https://finance.yahoo.com/news/ur-energy-inc-announces-closing-173700737.html

https://www.bloomberg.com/news/articles/2021-03-03/rare-earth-uranium-miners-benefit-from-ev-mania-and-dash-of-esg

https://www.energyfuels.com/

https://www.energyfuels.com/2021-03-09-Energy-Fuels-Receives-First-Shipments-of-Natural-Monazite-Ore-Commercial-Recovery-of-Rare-Earths-Expected-to-Begin-in-U-S-in-Coming-Weeks

https://encoreenergycorp.com/

https://www.globenewswire.com/news-release/2021/01/05/2153363/0/en/enCore-Energy-Corp-Completes-Acquisition-of-Westwater-Resources-Texas-Based-Uranium-Production-Resource-Assets.html

https://www.standarduranium.ca/

https://www.standarduranium.ca/news-releases/standard-uranium-begins-phase-ii-winter-drill-program-at-its-flagship-davidson-river-project/

Release – Euroseas (ESEA) – Announces New Charters for Two of Its Vessels


Euroseas Ltd. Announces New Charters for Two of Its Vessels, M/V “Synergy Busan” and M/V “EM Kea”


ATHENS, Greece, March 17, 2021 (GLOBE NEWSWIRE) — Euroseas Ltd. (NASDAQ: ESEA, the “Company” or “Euroseas”), an owner and operator of container vessels and provider of seaborne transportation for containerized cargoes, announced today the extension of the charter of its container vessels M/V “EM Kea” and a new time charter contract for its container vessel M/V “Synergy Busan”. Specifically:

  • The charter of M/V “EM Kea”, a 3,091 TEU vessel built in 2007, was extended for a period between a minimum of twenty-five and a maximum of twenty-eight months at the option of the charterer, at a daily rate of $22,000. The new rate will commence on April 25, 2021 about 2 months earlier than the latest expiration of the present charter.
  • M/V “Synergy Busan”, a 4,253 TEU vessel built in 2009, entered into a new time charter contract for a period of between a minimum of thirty-six and a maximum of forty months at the option of the charterer, at a daily rate of $25,000. The new rate will commence between June 9, 2021 and August 9, 2021 when the vessel will be redelivered from its current charterer.

Aristides Pittas, Chairman and CEO of Euroseas, commented: “We are very pleased to announce new charters for two of our vessels for periods of at least two and three years, respectively, at rates more than twice the levels of their existing employment. The new charters secure a minimum of $40m of contracted revenues and make an annualized EBITDA contribution of approximately $11.5m which is about $9.0m higher than, or 4.5 times, their present contribution of about $2.5m, significantly improving our profitability and cash flow visibility.

“Undoubtedly, the containership markets have had a remarkable run over the last six months with all factors in the marketplace suggesting continuing strength. After these two charters, seven of our fourteen vessels would be earning higher rates reflective of the recent market recovery. If the present market levels continue, renewals of the five remaining charters with legacy rates expiring in 2021 should result in significant further increase in our profitability. The cash flow generated would be available to further strengthen our balance sheet, be used for further investment or for reinstitution of dividends or a combination thereof, as always, at the discretion of our Board or Directors.”

Fleet Profile:

The Euroseas Ltd. fleet profile is as follows:

Name Type Dwt TEU Year
Built
Employment(*) TCE Rate ($/day)

Container Carriers
           
AKINADA BRIDGE (*) Intermediate 71,366 5,610 2001 TC until Oct-21
plus 10-12
months option
$17,250; option
$20,000
SYNERGY BUSAN (+) Intermediate 50,726 4,253 2009 TC until Aug-21 /
TC until Aug-24
$12,000
$25,000
SYNERGY ANTWERP (*) Intermediate 50,726 4,253 2008 TC until Sep-23 $18,000
SYNERGY OAKLAND (*) Intermediate 50,787 4,253 2009 TC until Jun-21 CONTEX(**) 4,250
less 10%
SYNERGY KEELUNG (+) Intermediate 50,969 4,253 2009 TC until Jun-22
plus 8- 12 months
option
$10,000 until Jun-
21; $11,750 until
Jun-22; option
$14,500
EM KEA Feeder 42,165 3,100 2007 TC until Apr-21
TC until May-23
$8,100
$22,000
EM ASTORIA (*) Feeder 35,600 2,788 2004 TC until Dec-21 $18,650
EVRIDIKI G (*) Feeder 34,677 2,556 2001 TC until Dec-21 $15,500
EM CORFU (*) Feeder 34,654 2,556 2001 TC until Sep-21 $10,200
DIAMANTIS P (+) Feeder 30,360 2,008 1998 TC until Aug-21 $6,500
EM SPETSES (+) Feeder 23,224 1,740 2007 TC until Jul-21 $8,100
EM HYDRA (+) Feeder 23,351 1,740 2005 TC until May-21 $7,200
JOANNA (+) Feeder 22,301 1,732 1999 TC until Apr-21 $8,050
AEGEAN  EXPRESS (*) Feeder 18,581 1,439 1997 TC until Mar-22 $11,500

Total Container Carriers

14

539,487

42,281
     

Notes:
(*) TC denotes time charter. All dates listed are the earliest redelivery dates under each time charter unless the contract rate is lower than the current market rate in which cases the latest redelivery date is assumed; vessels with the latest redelivery date shown are marked by (+).
(**)The CONTEX (Container Ship Time Charter Assessment Index) has been published by the Hamburg and Bremen Shipbrokers’ Association (VHBS) since October 2007. The CONTEX is a company-independent index of time charter rates for container ships. It is based on assessments of the current day charter rates of six selected container ship types, which are representative of their size categories: Type 1,100 TEU and Type 1,700 TEU with a charter period of one year, and the Types 2,500, 2,700, 3,500 and 4,250 TEU, all with a charter period of two years.

About Euroseas Ltd.
Euroseas Ltd. was formed on May 5, 2005 under the laws of the Republic of the Marshall Islands to consolidate the ship owning interests of the Pittas family of Athens, Greece, which has been in the shipping business over the past 140 years. Euroseas trades on the NASDAQ Capital Market under the ticker ESEA.

Euroseas operates in the container shipping market. Euroseas’ operations are managed by Eurobulk Ltd., an ISO 9001:2008 and ISO 14001:2004 certified affiliated ship management company, which is responsible for the day-to-day commercial and technical management and operations of the vessels. Euroseas employs its vessels on spot and period charters and through pool arrangements. 

The Company has a fleet of 14 vessels, including 9 Feeder containerships and 5 Intermediate Container carriers. Euroseas 14 containerships have a cargo capacity of 42,281 teu.

Forward Looking Statement
This press release contains forward-looking statements (as defined in Section 27A of the Securities Act of 1933, as amended, and Section 21E of the Securities Exchange Act of 1934, as amended) concerning future events and the Company’s growth strategy and measures to implement such strategy; including expected vessel acquisitions and entering into further time charters. Words such as “expects,” “intends,” “plans,” “believes,” “anticipates,” “hopes,” “estimates,” and variations of such words and similar expressions are intended to identify forward-looking statements. Although the Company believes that the expectations reflected in such forward-looking statements are reasonable, no assurance can be given that such expectations will prove to have been correct. These statements involve known and unknown risks and are based upon a number of assumptions and estimates that are inherently subject to significant uncertainties and contingencies, many of which are beyond the control of the Company. Actual results may differ materially from those expressed or implied by such forward-looking statements. Factors that could cause actual results to differ materially include, but are not limited to changes in the demand for containerships, competitive factors in the market in which the Company operates; risks associated with operations outside the United States; and other factors listed from time to time in the Company’s filings with the Securities and Exchange Commission. The Company expressly disclaims any obligations or undertaking to release publicly any updates or revisions to any forward-looking statements contained herein to reflect any change in the Company’s expectations with respect thereto or any change in events, conditions or circumstances on which any statement is based. 

Visit our website: www.euroseas.gr

Company Contact Investor Relations / Financial Media
Tasos Aslidis
Chief Financial Officer
Euroseas Ltd.
11 Canterbury Lane,
Watchung, NJ 07069
Tel. (908) 301-9091
E-mail: aha@euroseas.gr
Nicolas Bornozis
President
Capital Link, Inc.
230 Park Avenue, Suite 1536
New York, NY 10169
Tel. (212) 661-7566
E-mail: nbornozis@capitallink.com

Source: Euroseas Ltd.

Release – Cocrystal Pharma (COCP) – Reports 2020 Financial Results


Cocrystal Pharma Reports 2020 Financial Results, Provides Business Update Including Antiviral Program Milestones


Outlines 2021 product pipeline milestones for COVID-19, influenza A and norovirus antiviral programs

Ends 2020 with cash exceeding $33 million and a clean capital structure

BOTHELL, Wash., March 17, 2021 (GLOBE NEWSWIRE) — Cocrystal Pharma, Inc. (Nasdaq: COCP), (“Cocrystal” or the “Company”), a clinical-stage biotechnology company discovering and developing novel antiviral therapeutics that target the replication machinery of influenza viruses, the SARS-CoV-2 virus, hepatitis C viruses and noroviruses, reports financial results for the year ended December 31, 2020 and provides updates on its antiviral pipeline and business activities.

“We made across-the-board progress last year with our pipeline of broad-spectrum antiviral drugs that feature a high barrier to drug resistance, and we anticipate further advancements in 2021,” said Sam Lee, Ph.D., President of Cocrystal. “In just over a year since initiating our COVID-19 program, we selected a broad-spectrum protease inhibitor, CDI-45205, as a lead drug candidate and are conducting remaining preclinical studies. This antiviral agent presents a novel approach to COVID-19 and other coronaviruses with the potential as both a therapeutic for infected patients and as a prophylactic to protect those who may become exposed. We have also made strides in our norovirus program and expect to complete a proof-of-concept study in norovirus in the first half of this year.”

“Our influenza programs are also advancing well,” stated Gary Wilcox, Ph.D., Chairman and Chief Executive Officer of Cocrystal. “We successfully completed our obligations under the exclusive worldwide licensing and collaboration agreement with Merck for the discovery and development of influenza A/B drug candidates, with Merck now assuming sole responsibility for further program development. With our in-house influenza A program, we are conducting the remaining preclinical studies with CC-42344 and plan to initiate a Phase 1 study in the third quarter. Influenza continues to be a major global health concern and our antiviral agents are being developed to be effective against both seasonal and pandemic influenza.

“We are employing our proprietary technology platform to discover and develop antiviral drug candidates that address major global medical concerns, such as influenza and coronaviruses, that present significant market opportunities,” he added. “We are well positioned to execute on our goals with the guidance and support of our outstanding leadership team and our scientific advisory board, which includes two Nobel laureates. Following successful financings completed last year, we ended 2020 with more than $33 million of cash and have sufficient capital to fund our current operations and development programs beyond 2022.”

Antiviral Development Pipeline Milestones and Updates

 COVID-19 Programs

  ? Advancing preclinical studies with CDI-45205. This compound, obtained under an agreement with Kansas State University Research Foundation (KSURF), demonstrated in vitro and in vivo activity in animal models against the viral pathogens MERS and SARS and has significant potential for delivery either by injection or inhalation.
  ? Applying the Company’s proprietary structure-based platform technology to discover novel COVID-19 inhibitors with the potential for oral administration.

Influenza A Program

  ? Completing IND-enabling activities with CC-42344 and planning to initiate a Phase 1 study during the third quarter of 2021. CC-42344 has demonstrated excellent preclinical antiviral activity against influenza A strains, including avian pandemic strains and oseltamivir-resistant and baloxavir-resistant strains, while also showing favorable pharmacokinetic and safety profiles.
     
    Influenza remains a major global concern with cases approximating 1 billion annually. The World Health Organization estimates that worldwide, annual influenza epidemics result in approximately 3-5 million cases of severe illness and about 250,000 to 500,000 deaths. Approved influenza therapies have major limitations due to drug-resistant issues and emerging virus mutations. Cocrystal is designing influenza drug candidates to be active against drug-resistant strains, effective against future mutations, and available for delivery through multiple routes of administration, including oral, inhalation and injection.

Hepatitis C Program

  ? Seeking a partner to advance the development of CC-31244. This compound showed positive safety and preliminary efficacy data from a triple regimen Phase 2a study in combination with Epclusa (sofosbuvir/velpatasvir) for the ultra-short treatment of individuals infected with the hepatitis C virus.

Norovirus Therapy Program

  ? Expect to complete a proof-of-concept animal study in the first half of 2021 with a potential first-in-class non-nucleoside inhibitor with potent and broad-spectrum Noro polymerase inhibitors.

2020 and Recent Highlights

Licensing and Collaboration Agreements

  ? Completed all research obligations under the Merck exclusive worldwide license and collaboration agreement for influenza A/B antiviral compounds. As of mid-January 2021, Merck has assumed all responsibility for further program development.
  ? Entered into two exclusive, royalty-bearing license agreements with KSURF to develop and commercialize therapeutic, diagnostic and prophylactic products against coronaviruses, caliciviruses and picornaviruses based on antivirals discovered by KSURF.
  ? Extended a drug discovery collaboration with HitGen and InterX, combining three independent platforms to discover and optimize molecules that could lead to novel antiviral drug candidates.

Scientific Publications and Presentations

  ? Announced the publication by collaborators of positive preclinical animal data demonstrating potent inhibition of coronavirus antiviral compounds in the prestigious medical journal Science Translational Medicine.
  ? Presented an overview of the Company’s drug discovery platform technology, including its unique ability to develop broad-spectrum antiviral therapeutics and its advantages compared with the traditional drug discovery and development process, presented at the “reimagine Health Research Symposium” in January 2021.

Corporate Developments

  ? Appointed Nobel laureate Roger D. Kornberg, Ph.D. to the Cocrystal Board of Directors, adding to his positions as Chief Scientist and Chairman of the Scientific Advisory Board.
  ? Received $2.0 million in Merck payments and $35.8 million in net proceeds from common-stock financings.
  ? Negotiated and executed approved settlement of the class-action lawsuit, the derivative lawsuit and two related derivative actions with agreement to pay $450,000 for its share of the total class action settlement and make certain corporate governance changes.

2020 Financial Results

Revenues for the year ended December 31, 2020 were $2.0 million, which consisted entirely of research and development (R&D) services performed by Cocrystal and reimbursed program expenses paid by Merck for the influenza A/B program. This compares with revenues of $6.6 million for the year ended December 31, 2019, which included $4.4 million in exchange for conveyance of intellectual property rights at the signing of the Merck collaboration agreement, $1.8 million for R&D services and $358,000 for program expense reimbursements.

In mid-January 2021 Merck assumed all activities and expenses associated with the continued development of the influenza A/B compounds. Cocrystal does not expect to report revenues or offsetting R&D expenses related to this agreement in 2021. Cocrystal is eligible to receive milestone payments related to designated development, regulatory and sales milestones with the potential to earn up to $156 million, as well as royalties on product sales.

R&D expenses for 2020 were $6.3 million compared with $4.0 million for 2019, with the increase primarily due to costs related to advancing the coronavirus, influenza and norovirus programs. General and administrative expenses for 2020 were $5.3 million compared with $4.9 million for the prior year, with the increase primarily due to professional fees incurred as a result of the now settled class action matter mentioned above in Corporate Developments. The operating loss for 2020 was $9.6 million compared with an operating loss of $48.4 million in 2019, which included a $46.1 million non-cash goodwill impairment charge on an intangible asset in 2019.

Other expense for 2020 was $62,000, which was primarily due to a $54,000 loss on the fair value of derivative liabilities. This compares with other income for 2019 of $237,000, that was primarily due to a $256,000 gain on derivative liabilities.

The net loss for 2020 was $9.6 million, or $0.17 per share, compared with a net loss for 2019 of $48.2 million, or $1.51 per share, which included the $46.1 million impairment.

The Company reported $33.1 million in cash and cash equivalents as of December 31, 2020, compared with $7.4 million as of December 31, 2019. The Company reported working capital of $32.6 million as of December 31, 2020.

About Cocrystal Pharma, Inc.

Cocrystal Pharma, Inc. is a clinical-stage biotechnology company discovering and developing novel antiviral therapeutics that target the replication process of influenza viruses, coronaviruses (including SARS-CoV-2), hepatitis C viruses and noroviruses. Cocrystal employs unique structure-based technologies and Nobel Prize-winning expertise to create first- and best-in-class antiviral drugs. For further information about Cocrystal, please visit www.cocrystalpharma.com.

Cautionary Note Regarding Forward-Looking Statements

This press release contains forward-looking statements within the meaning of the Private Securities Litigation Reform Act of 1995, including statements regarding the expected further advancements in our programs, including the planned initiation of the influenza A Phase 1 study during the third quarter of 2021 and our plans regarding the expected completion of a norovirus proof-of-concept animal study in the first half of 2021; our expectations and estimates regarding the future applications and effectiveness of, and the market opportunities for, our product candidates; our expectations regarding future operating results; the expected results of Cocrystal’s collaboration with Merck, including potential receipt of future milestone payments of up to $156,000,000 and royalties; and future liquidity. The words “believe,” “may,” “estimate,” “continue,” “anticipate,” “intend,” “should,” “plan,” “could,” “target,” “potential,” “is likely,” “will,” “expect” and similar expressions, as they relate to us, are intended to identify forward-looking statements. We have based these forward-looking statements largely on our current expectations and projections about future events. Some or all of the events anticipated by these forward-looking statements may not occur. Important factors that could cause actual results to differ from those in the forward-looking statements include, but are not limited to, the risks arising from the impact of the COVID-19 pandemic on the national and global economy, on our collaboration partners and on our Company, including supply chain disruptions and our continued ability to proceed with our programs, our reliance on Merck for further development in the influenza A/B program under the license and collaboration agreement, , the results of future preclinical and clinical studies, general risks arising from clinical trials, receipt of regulatory approvals, regulatory changes, and development of effective treatments and/or vaccines by competitors, including as part of the programs financed by the U.S. government. Further information on our risk factors is contained in our filings with the SEC, including our Annual Report on Form 10-K for the year ended December 31, 2020. Any forward-looking statement made by us herein speaks only as of the date on which it is made. Factors or events that could cause our actual results to differ may emerge from time to time, and it is not possible for us to predict all of them. We undertake no obligation to publicly update any forward-looking statement, whether as a result of new information, future developments or otherwise, except as may be required by law.

Investor Contact:
LHA Investor Relations
Jody Cain
310-691-7100
jcain@lhai.com

Financial Tables to follow


COCRYSTAL PHARMA, INC.

CONSOLIDATED BALANCE SHEETS
(in thousands)

    December 31, 2020     December 31, 2019  
             
Assets                
Current assets:                
Cash   $ 33,010     $ 7,418  
Restricted cash     50       50  
Accounts receivable     556       644  
Prepaid expenses and other current assets     399       169  
Total current assets     34,015       8,281  
Property and equipment, net     591       431  
Deposits     46       50  
Operating lease right-of-use assets, net (including $39 to related party)     498       677  
Goodwill     19,092       19,092  
Total assets   $ 54,242     $ 28,531  
Liabilities and stockholders’ equity                
Current liabilities:                
Accounts payable and accrued expenses   $ 1,080     $ 1,999  
Current maturities of finance lease liabilities     39       103  
Current maturities of operating lease liabilities (including $39 to related party)     178       177  
Derivative liabilities     61       7  
Total current liabilities     1,358       2,286  
Long-term liabilities:                
Finance lease liabilities     34       14  
Operating lease liabilities     345       523  
Total long-term liabilities     379       537  
Total liabilities     1,737       2,823  
Commitments and contingencies                
Stockholders’ equity:                
Common stock, $0.001 par value; 100,000 shares authorized as of December 31, 2020 and December 31, 2019; 70,439 and 35,150 shares issued and outstanding as of December 31, 2020 and December 31, 2019, respectively     71       36  
Additional paid-in capital     297,342       260,932  
Accumulated deficit     (244,908 )     (235,260 )
Total stockholders’ equity     52,505       25,708  
Total liabilities and stockholders’ equity   $ 54,242     $ 28,531  


COCRYSTAL PHARMA, INC.

CONSOLIDATED STATEMENTS OF OPERATIONS
(in thousands, except per share data)

    December 31,  
    2020     2019  
             
Revenues:                
Collaboration revenue   $ 2,014     $ 6,564  
                 
Operating expenses:                
Research and development     6,307       4,004  
General and administrative     5,293       4,863  
Impairments           46,103  
Total operating expenses     11,600       54,970  
                 
Loss from operations     (9,586 )     (48,406 )
                 
Other (expense) income:                
Interest expense, net     (8 )     (19 )
Change in fair value of derivative liabilities     (54 )     256  
Total other income (expense), net     (62 )     237  
                 
Loss before income taxes     (9,648 )     (48,169 )
                 
Income tax            
                 
Net loss   $ (9,648 )   $ (48,169 )
                 
Net loss per common share:                
Loss per share, basic and diluted   $ (0.17 )   $ (1.51 )
Weighted average number of common shares outstanding, basic and diluted     55,217       31,859  

Source: Cocrystal Pharma, Inc.

Release – QuoteMedia Inc. (QMCI) – Welcomes Bookmap as Newest Quotestream Connect Partner


QuoteMedia Welcomes Bookmap as Newest Quotestream Connect Partner


PHOENIX, March 17, 2021 (GLOBE NEWSWIRE) — QuoteMedia, Inc. (OTCQB: QMCI), a leading provider of market data and financial applications, is pleased to introduce Bookmap, as its newest Quotestream Connect Partner. QuoteMedia has integrated its Quotestream Connect data APIs for use within Bookmap’s impressive data visualization software.

Quotestream Connect includes QuoteMedia’s low-latency, highly accurate Streaming Datafeed API, state of the art On-Demand APIs, and an extensive User Management System, for integration into third party applications developed by Independent Software Vendors (ISVs) like Bookmap.

“We are always happy to add ISVs like Bookmap as Quotestream Connect Partners,” says Dave Shworan, CEO of QuoteMedia Ltd. “Bookmap is an innovative company, and it’s rewarding to see our data being utilized by users of this remarkable software application.”

QuoteMedia has integrated its Canadian and London order book APIs within Bookmaps’ exceptional Level 2 focused software platform, providing users the unique ability to visualize liquidity and trends in these markets.

“QuoteMedia is a real frontrunner in the financial market data industry, and we’re excited to partner with them to open Bookmap to the Canadian and London Stock Exchange markets,” says Tsachi Galanos, Bookmap CEO. “With QuoteMedia’s data solutions, traders using Bookmap to trade these markets will be able to visualize the real support and resistance levels and will take better trading decisions, gaining an edge over other traders.”

About QuoteMedia

QuoteMedia is a leading software developer and cloud-based syndicator of financial market information and streaming financial data solutions to media, corporations, online brokerages, and financial services companies. The Company licenses interactive stock research tools such as streaming real-time quotes, market research, news, charting, option chains, filings, corporate financials, insider reports, market indices, portfolio management systems, and data feeds. QuoteMedia provides data and services for companies such as the Nasdaq Stock Exchange, TMX Group (TSX Stock Exchange), Canadian Securities Exchange (CSE), London Stock Exchange Group, FIS, U.S. Bank, Broadridge Financial Systems, Ridge Clearing, JPMorgan Chase, CI Financial, Canaccord Genuity Corp., Hilltop Securities, HD Vest, Stockhouse, Zacks Investment Research, General Electric, Boeing, Bombardier, Business Wire, PR Newswire, FolioFN, Regal Securities, ChoiceTrade, Cetera Financial Group, Dynamic Trend, Inc., Qtrade Financial, CNW Group, Industrial Alliance, Ally Invest, Inc., Suncor, Virtual Brokers, Equities.com, Leede Jones Gable, Firstrade Securities, Charles Schwab, First Financial, Cirano, Equisolve, Stock-Trak, Mergent, Cision, Warrior Trading and others. Quotestream®, QMod™ and Quotestream Connect™ are trademarks of QuoteMedia. For more information, please visit www.quotemedia.com .

QuoteMedia Investor Relations
Brendan Hopkins
Email: investors@quotemedia.com
Call: (407) 645-5295

About Bookmap

Bookmap Ltd. is a financial services firm and the creator of Bookmap ( www.bookmap.com ). The Bookmap team brings experience in High Frequency Trading, which was instrumental in creating the Bookmap trading platform that visualizes both real-time order book data combined with historical depth-of-market (DOM) data. Bookmap accurately shows the entire market liquidity and trading activities, enabling traders to identify market trends and hidden price patterns with high precision.

Bookmap connects to more than 30 exchanges and platforms, covering futures, stocks and cryptocurrencies. It is used by scalpers, day traders, swing traders and algo traders all over the world. In addition to the platform, Bookmap established a marketplace that offers unique add-ons, such as a stop & iceberg order detector, third-party market data, and educational services. For more information, please visit www.bookmap.com or send an email to info@bookmap.com .

SOURCE: QuoteMedia

Release – Capstone Turbine (CPST) – Continues Market Penetration in Mexico With C600 Signature Series Microturbine Order


Capstone Turbine Continues Market Penetration in Mexico With C600 Signature Series Microturbine Order


Order Increases Capstone’s Mexican Fleet to Over 46 Megawatts (MW)

VAN NUYS, CA / ACCESSWIRE / March 17, 2021 / Capstone Turbine Corporation (www.capstoneturbine.com) (NASDAQ:CPST), the world’s leading manufacturer of clean technology microturbine energy systems, announced today that it has received an order for a five-bay C600 Signature Series microturbine to be installed in a combined heat and power (CHP) application for an industrial customer in Mexico. The order, secured by DTC Ecoenergía (www.dtc.mx), Capstone’s exclusive distributor for Mexico, increases Capstone’s Mexican fleet to over 46 Megawatts (MW).

According to the Energy Information Administration (EIA), Mexico’s population is expected to grow to more than 150 million in 2050 from 125 million today. This, together with productivity improvements, is expected to drive economic growth. As a result, energy demand is predicted to increase significantly. Power generation from renewable sources is anticipated to grow thanks in part to targets and support for clean energy solutions.

“Back in 2012, Mexico became the first, large, oil-producing emerging economy to adopt climate legislation with common-sense goal setting,” said Darren Jamison, President and Chief Executive Officer. “An additional 2018 decree brought Mexico’s domestic emission reduction targets in line with the Paris Agreement on climate change, which at that time put it ahead of the U.S. on climate change initiatives. However, the new Biden administration recently signed an executive order to rejoin the U.S. into the Paris climate accord, his first major action to tackle global warming,” added Mr. Jamison.

A five-bay Capstone C600S package will provide 24/7 reliable and continuous electrical power and thermal energy for the customer. Capstone’s scalable on-site energy efficiency systems are engineered to meet the large electrical and thermal demand requirements of industrial manufacturers, delivering energy independence with higher operational efficiency than the local utility grid.

“DTC Ecoenergía is experiencing tremendous growth with the sale of Capstone energy efficiency systems in the manufacturing sector,” said Alejandro Muñoz, President of DTC Ecoenergía. “Despite the disruptions we faced during the COVID-19 pandemic, the Mexican-based manufacturing industry looks poised for growth in the months to come,” concluded Mr. Muñoz.

Environmentally-conscious industrial leaders throughout Mexico have partnered with DTC on over 100 projects and capitalized on Capstone’s efficient microturbine technology for a variety of solutions and applications. Capstone-powered CHP solutions not only allow customers to quickly realize the benefits of Capstone’s highly reliable, low-emission technology but also lower their energy costs while ensuring minimal downtime and production losses.

One of the core challenges faced by the manufacturing industry is the implementation of highly-reliable energy solutions for their facilities that not only reduce operational costs and increase reliability but also support sustainability goals. Utilizing the heat by-product from a microturbine allows operators to reduce emissions and save added costs that would otherwise be required to produce heat or steam in a separate unit. While traditional electricity from the grid with coal and gas-fired plants produce power at 33% efficiency, Capstone CHP systems can reach efficiencies of more than 80%.

About Capstone Turbine Corporation
Capstone Turbine Corporation (www.capstoneturbine.com) (NASDAQ:CPST) is the world’s leading producer of highly efficient, low-emission, resilient microturbine energy systems. Capstone microturbines serve multiple vertical markets worldwide, including natural resources, energy efficiency, renewable energy, critical power supply, transportation and microgrids. Capstone offers a comprehensive product lineup via our direct sales team, as well as our global distribution network. Capstone provides scalable solutions from 30 kWs to 10 MWs that operate on a variety of fuels and are the ideal solution for today’s multi-technology distributed power generation projects.

For customers with limited capital or short-term needs, Capstone offers rental systems; for more information, contact: rentals@capstoneturbine.com. To date, Capstone has shipped nearly 10,000 units to 83 countries and in FY20, saved customers an estimated $219 million in annual energy costs and 368,000 tons of carbon.

For more information about the company, please visit www.capstoneturbine.com. Follow Capstone Turbine on TwitterLinkedInInstagram, Facebook and YouTube.

Cautionary Note Regarding Forward-Looking Statements
This release contains forward-looking statements as defined in the Private Securities Litigation Reform Act of 1995, including statements regarding expectations, beliefs, plans, intentions, and strategies of the Company. The Company has tried to identify these forward-looking statements by using words such as “expect,” “anticipate,” “believe,” “could,” “should,” “estimate,” “intend,” “may,” “will,” “plan,” “goal” and similar terms and phrases, but such words, terms and phrases are not the exclusive means of identifying such statements. Actual results, performance and achievements could differ materially from those expressed in, or implied by, these forward-looking statements due to a variety of risks, uncertainties and other factors, including, but not limited to, the following: the ongoing effects of the COVID-19 pandemic; the availability of credit and compliance with the agreements governing the Company’s indebtedness; the Company’s ability to develop new products and enhance existing products; intense competition; financial performance of the oil and natural gas industry and other general business, industry and economic conditions; the Company’s ability to adequately protect its intellectual property rights; and the impact of pending or threatened litigation. For a detailed discussion of factors that could affect the Company’s future operating results, please see the Company’s filings with the Securities and Exchange Commission, including the disclosures under “Risk Factors” in those filings. Except as expressly required by the federal securities laws, the Company undertakes no obligation to update or revise any forward-looking statements, whether as a result of new information, changed circumstances or future events or for any other reason.

“Capstone” and “Capstone Microturbine” are registered trademarks of Capstone Turbine Corporation. All other trademarks mentioned are the property of their respective owners.

CONTACT:
Capstone Turbine Corporation
Investor and investment media inquiries:}
818-407-3628
ir@capstoneturbine.com

SOURCE: Capstone Turbine Corporation

Release – Helius Medical Technologies (HSDT) – Appoints Sherrie Perkins to its Board of Directors


Helius Medical Technologies, Inc. Appoints Sherrie Perkins to its Board of Directors


NEWTOWN, Pa., March 17, 2021 (GLOBE NEWSWIRE) — Helius Medical Technologies, Inc. (Nasdaq:HSDT) (TSX:HSM) (“Helius” or the “Company”), a neurotech company focused on neurological wellness, today announced the appointment of Sherrie Perkins, effective March 15, 2021.

“Ms. Perkins’ career history includes over 20 years of experience in the healthcare industry, including significant experience advising neuromodulation companies on their commercial and marketing activities,” said Blane Walter, Chairman of Helius’ Board of Directors. “We are pleased to expand our Board of Directors with the appointment of Ms. Perkins and look forward to leveraging her expertise and strategic insight as Helius prepares its next phase of market development activities.”

“I am delighted to join the Board of Directors of Helius Medical Technologies and appreciate the opportunity to help the company advance its unique therapy in ways that provide meaningful benefit to patients, physicians, and payers,” said Ms. Perkins.

Ms. Perkins currently serves as a member of the Venture Mentoring Service at the University of Texas MD Anderson Cancer Center, providing guidance and perspective on commercialization-related topics that are important and relevant to the progression of various ventures.

From 2017 to 2019, Ms. Perkins served as a consultant to LivaNova, PLC (NASDAQ: LIVN), a global medical technology company that designs, develops, manufactures and sells innovative therapeutic solutions in the fields of neuromodulation and cardiovascular disease. She previously spent 17 years at LivaNova and its affiliates in several roles, including serving as Vice President in the sleep apnea, new ventures space within the company from 2015 to 2017, and as Vice President of Marketing and New Business Development of Cyberonics, Inc. from 2011 to 2015.

Ms. Perkins received a B.S. in Medical Technology from Mississippi State University and an M.A. in Management from Central Michigan University.

About
Helius Medical Technologies, Inc.

Helius Medical Technologies is a neurotech company focused on neurological wellness. The Company’s purpose is to develop, license and acquire unique and non-invasive platform technologies that amplify the brain’s ability to heal itself. The Company’s first commercial product is the Portable Neuromodulation Stimulator (PoNS
TM). For more information, visit www.heliusmedical.com.

About
the PoNS™ Device and PoNS Treatment™

The Portable Neuromodulation Stimulator (PoNS™) is authorized for sale in Canada as a class II, non-implantable, medical device intended as a short term treatment (14 weeks) of gait deficit due to mild and moderate symptoms from multiple sclerosis (MS), and chronic balance deficit due to mild-to-moderate traumatic brain injury (mmTBI) and is to be used in conjunction with physical therapy. The PoNS™ is an investigational medical device in the United States, the European Union (“EU”), and Australia (“AUS”). The device is currently under review for de novo classification and clearance by the FDA. It is also under premarket review by the AUS Therapeutic Goods Administration. PoNS™ is currently not commercially available in the United States, the European Union or Australia.

Investor
Relations Contact:

Westwicke Partners on behalf of Helius Medical Technologies, Inc.
Jack Powell, Vice President
investorrelations@heliusmedical.com

Cautionary
Disclaimer Statement: 

Certain statements in this news release are not based on historical facts and constitute forward-looking statements or forward-looking information within the meaning of the U.S. Private Securities Litigation Reform Act of 1995 and Canadian securities laws. All statements other than statements of historical fact included in this news release are forward-looking statements that involve risks and uncertainties. Forward-looking statements are often identified by terms such as “believe,” “continue,” “look forward,” “will,” “committed to,” “goal,” “expect,” “remain,” “hope” and similar expressions. Such forward-looking statements include, among others, statements regarding the Company’s future growth and operational progress, the next phase of the Company’s market development activities, clinical and regulatory development plans for the PoNS device, and potential regulatory clearance of the PoNS device, including expected timing for the FDA to resume its review of our request for de novo classification and clearance and expected timing for receipt of the FDA’s decision on such request.

These statements involve substantial known and unknown risks and uncertainties. There can be no assurance that such statements will prove to be accurate and actual results and future events could differ materially from those expressed or implied by such statements. Important factors that could cause actual results to differ materially from the Company’s expectations include uncertainties associated with the clinical development process and FDA regulatory submission and approval process, including that the Company’s request for de novo classification and clearance may be declined by the FDA, that the FDA is not required to and may not respond to the Company’s request in the timeframe indicated by its de novo review goals or in the time the Company expects, whether the Company’s response will be satisfactory to the FDA, whether the FDA will require additional information, whether the Company will be able to provide it in a timely manner and whether such additional information will be satisfactory to the FDA, uncertainties regarding the Company’s capital requirements to achieve its business objectives, the impact of the COVID-19 pandemic, uncertainties associated with future clinical trials and other development activities, and other risks detailed from time to time in the filings made by the Company with securities regulators, including the risks and uncertainties described in the “Risk Factors” sections of the Company’s Annual Report on Form 10-K for the year ended December 31, 2020 and its other filings with the United States Securities and Exchange Commission and the Canadian securities regulators, which can be obtained from either at www.sec.gov or www.sedar.com.The reader is cautioned not to place undue reliance on any forward-looking statement. The forward-looking statements contained in this news release are made as of the date of this news release and the Company assumes no obligation to update any forward-looking statement or to update the reasons why actual results could differ from such statements except to the extent required by law.

The Toronto Stock Exchange has not reviewed and does not accept responsibility for the adequacy or accuracy of the content of this news release.

Release – Endeavor Silver (EXK) – Signs Definitive Agreement to Sell the El Cubo Mine in Guanajuato Mexico


Endeavour Silver Signs Definitive Agreement to Sell the El Cubo Mine in Guanajuato, Mexico to VanGold Mining; Endeavour to be Added to the S&P/TSX Composite and NYSE Arca Gold Miners (GDX ETF) Indices


VANCOUVER, British Columbia, March 17, 2021 (GLOBE NEWSWIRE) — Endeavour
Silver Corp. (TSX: EDR, NYSE: EXK)
(“Endeavour”) announces that it has signed a definitive agreement to sell the El Cubo mine in Guanajuato, Mexico to VanGold Mining Corp. (“VanGold”) for $15 million in cash and share payments plus up to $3 million in contingent payments (all dollar amounts in USD unless otherwise noted).

VanGold will pay $15,000,000 to Endeavour as follows:

  • A non-refundable down-payment of $500,000 cash (received).
  • $7.0 million cash payment on closing, anticipated by the end of March 2021.
  • $5.0 million in VanGold common shares on closing, priced at $0.2344 (CAD$0.30) per share for a total of 21,331,058 VanGold shares representing approximately 11.3% of the issued shares.
  • $2.5 million promissory note due 12 months from the closing date.

Endeavour has agreed to (a) abstain from voting its shares of VanGold, other than as recommended by VanGold’s management, for a period of two years from the closing date and (b) a 12-month restriction on the resale of any VanGold shares acquired in this transaction.

VanGold has also agreed to pay Endeavour up to an additional $3.0 million in contingent payments based on the following:

  • $1.0 million upon VanGold producing 3,000,000 silver equivalent ounces at El Cubo mill, derived from either the El Cubo or El Pinguico project.
  • $1.0 million if the price of gold closes at or above $2,000 per ounce for 20 consecutive days within two years after closing.
  • $1.0 million if the price of gold closes at or above $2,200 per ounce for 20 consecutive days within three years after closing.

Endeavour also announces its common shares will be be added to the S&P/TSX Composite and the NYSE Arca Gold Miners (GDX ETF) Indices effective after market close on Friday March 19, 2021, as per their respective Q1, 2021 rebalances, as announced on Friday March 12, 2021.

Bradford Cooke, Endeavour CEO, commented, “Inclusion in these two major indices is a great milestone for the Company, validating our recent success and providing greater visibility to investors. Constituents of these indices receive both an increase in the company profile and inclusion in mutual and pension funds that use these indices as benchmarks.”

The S&P/TSX Composite Index is the benchmark index for the Canadian equity market. It is the broadest measure of the S&P/TSX family and tracks approximately 250 companies. For more information, visit: www.standardandpoors.com.

The NYSE Arca Gold Miners Index is a modified market capitalization weighted index comprised of approximately 50 publicly traded companies primarily involved in the mining of gold and silver globally, and it is the underlying index to the VanEck Vectors Gold Miners ETF (GDX). For more information, visit: www.nyse.com.

About Endeavour Silver – Endeavour Silver Corp. is a mid-tier precious metals mining company that owns and operates three high-grade, underground, silver-gold mines in Mexico. Endeavour is currently advancing the Terronera mine project towards a development decision and exploring its portfolio of exploration and development projects in Mexico and Chile to facilitate its goal to become a premier senior silver producer. Our philosophy of corporate social integrity creates value for all stakeholders.

SOURCE Endeavour Silver Corp.

Contact Information
Galina Meleger, Director Investor Relations
Toll free: (877) 685-9775
Tel: (604) 640-4804

Email:
gmeleger@edrsilver.com
Website: www.edrsilver.com

Follow Endeavour Silver on Facebook, Twitter, Instagram and LinkedIn

Cautionary Note Regarding Forward-Looking Statements

This
news release contains “forward-looking statements” within the meaning of the
United States private securities litigation reform act of 1995 and “forward-looking
information” within the meaning of applicable Canadian securities legislation.
Such forward-looking statements and information herein include but are not
limited to statements regarding closing of the sale of El Cubo, Endeavour’s
anticipated performance in 2021 including changes in mining operations and
production levels, the timing and results of various activities and the impact
of the COVID 19 pandemic on operations. The Company does not intend to and does
not assume any obligation to update such forward-looking statements or
information, other than as required by applicable law. 

Forward-looking
statements or information involve known and unknown risks, uncertainties and
other factors that may cause the actual results, level of activity, production
levels, performance or achievements of Endeavour and its operations to be
materially different from those expressed or implied by such statements. Such
factors include but are not limited to the ultimate impact of the COVID 19
pandemic on operations and results, changes in production and costs guidance,
national and local governments, legislation, taxation, controls, regulations
and political or economic developments in Canada and Mexico; financial risks
due to precious metals prices, operating or technical difficulties in mineral
exploration, development and mining activities; risks and hazards of mineral
exploration, development and mining; the speculative nature of mineral
exploration and development, risks in obtaining necessary licenses and permits,
and challenges to the Company’s title to properties; as well as those factors
described in the section “risk factors” contained in the Company’s most recent
form 40F/Annual Information Form filed with the S.E.C. and Canadian securities
regulatory authorities.

Forward-looking
statements are based on assumptions management believes to be reasonable,
including but not limited to:closing of the sale of El Cubo the continued
operation of the Company’s mining operations, no material adverse change in the
market price of commodities, mining operations will operate and the mining
products will be completed in accordance with management’s expectations and
achieve their stated production outcomes, and such other assumptions and
factors as set out herein. Although the Company has attempted to identify
important factors that could cause actual results to differ materially from
those contained in forward-looking statements or information, there may be
other factors that cause results to be materially different from those
anticipated, described, estimated, assessed or intended. There can be no
assurance that any forward-looking statements or information will prove to be
accurate as actual results and future events could differ materially from those
anticipated in such statements or information. Accordingly, readers should not
place undue reliance on forward-looking statements or information.

Source: Endeavour Silver Corporation

QuickChek – March 17, 2021


Gevo Reports Fourth Quarter 2020 Financial Results

Gevo announces financial results for the fourth quarter of 2020 and recent corporate highlights.

Research, News & Market Data on Gevo

Watch recent presentation from NobleCon17


Federal Reserve Board and Federal Open Market Committee release economic projections from the March 16-17 FOMC meeting

Inflation Expectations, FOMC Meetings, and Investor Anticipation


Onconova Therapeutics Up 15% in Midday Trading


Research, News & Market Data on Onconova Therapeutics

Watch recent Onconova presentation from NobleCon17


Euroseas Announces New Charters for Two of Its Vessels

Euroseas Ltd. announced the extension of the charter of its container vessels M/V “EM Kea” and a new time charter contract for its container vessel M/V “Synergy Busan”.

Research, News & Market Data on Euroseas

Watch recent presentation from NobleCon17


Cocrystal Pharma Reports 2020 Financial Results

Cocrystal Pharma, Inc. reports financial results for the year ended December 31, 2020 and provides updates on its antiviral pipeline and business activities.

Research, News & Market Data on Cocrystal Pharma

Watch recent presentation from NobleCon17


QuoteMedia Welcomes Bookmap as Newest Quotestream Connect Partner

QuoteMedia, Inc. announced Bookmap as its newest Quotestream Connect Partner. QuoteMedia has integrated its Quotestream Connect data APIs for use within Bookmap’s impressive data visualization software.

Research, News & Market Data on QuoteMedia


Capstone Turbine Continues Market Penetration in Mexico With C600 Signature Series Microturbine Order

Capstone Turbine Corporation announced that it has received an order for a five-bay C600 Signature Series microturbine to be installed in a combined heat and power (CHP) application for an industrial customer in Mexico.

Research, News & Market Data on Capstone Turbine

Watch recent C-Suite interview with Capstone Turbine President & CEO Darren Jamison


Travelzoo Reports Fourth Quarter 2020 Results

Travelzoo reports financial results for the fourth quarter ended December 31, 2020.

Research, News & Market Data on Travelzoo


Endeavor Silver Signs Definitive Agreement to Sell the El Cubo Mine in Guanajuato, Mexico

Endeavour Silver Corporation announced that it has signed a definitive agreement to sell the El Cubo mine in Guanajuato, Mexico to VanGold Mining Corp for $15 million in cash and share payments plus up to $3 million in contingent payments.

Research, News & Market Data on Endeavour Silver

Watch recent presentation from NobleCon17


Helius Medical Technologies Appoints Sherrie Perkins to its Board of Directors

Helius Medical Technologies, Inc. announced the appointment of Sherrie Perkins, effective March 15, 2021.

Research, News & Market Data on Helius Medical Technologies

Watch recent presentation from NobleCon17

Stay up to date. Follow us:

Release – Travelzoo (TZOO) – Reports Fourth Quarter 2020 Results


Travelzoo Reports Fourth Quarter 2020 Results


NEW YORK
March 17, 2021 (GLOBE NEWSWIRE) — Travelzoo® (NASDAQ: TZOO):

  • Consolidated revenue of 
    $12.5 million, down 51% from 
    $25.3 million year-over-year
  • Net income of 
    $702,000
  • Non-GAAP consolidated operating profit of 
    $547,000
  • Earnings per share (EPS) of 
    $0.02 attributable to 
    Travelzoo from continuing operations
  • Cash flow from operations of 
    $9.2 million

Travelzoo, a global Internet media company that publishes exclusive offers and experiences for members, today announced financial results for the fourth quarter ended 
December 31, 2020. Consolidated revenue was 
$12.5 million, down 51% from 
$25.3 million year-over-year. Reported revenue excludes revenue from discontinued operations in 
Asia Pacific
Travelzoo’s reported revenue consists of advertising revenues and commissions, derived from and generated in connection with purchases made by 
Travelzoo members.

The reported net income attributable to 
Travelzoo from continuing operations was 
$173,000 for Q4 2020. At the consolidated level, including minority interests, the reported net income from continuing operations was 
$702,000. EPS from continuing operations was 
$0.02, down from 
$0.15 in the prior-year period.

Non-GAAP operating profit was 
$547,000. The calculation of non-GAAP operating profit excludes amortization of intangibles (
$0.3 million), stock option expenses (
$1.0 million), and severance-related expenses (
$0.2 million). See section “Non-GAAP Financial Measures” below.

“We see continued improvement in our business. We are seeing irresistibly priced deals from travel companies, and 
Travelzoo, as the most trusted media brand publishing and recommending deals, is bringing the very best deals to its members,” said  Holger Bartel, Global CEO.

“In 
March 2021, we saw the strongest activity from 
Travelzoo members in the 
U.S. since 
March 2020, as measured by user sessions on the 
Travelzoo site and app.”

Cash Position
As of 
December 31, 2020, consolidated cash, cash equivalents and restricted cash were 
$64.2 million.

Reserve
Reported revenues include a reserve of 
$3.9 million related to commissions to be earned from vouchers sold. The reserve was booked contra revenue and reduced reported Q4 2020 revenue by 
$1.6 million.

Travelzoo North America
North America business segment revenue decreased 45% year-over-year to 
$8.9 million. Operating profit for Q4 2020 was 
$1.3 million, or 15% of revenue, compared to an operating profit of 
$2.0 million, or 12% of revenue in the prior-year period.

Travelzoo Europe
Europe business segment revenue decreased 71% year-over-year to 
$2.7 million. Operating loss for Q4 2020 was 
$2.4 million, compared to an operating profit of 
$925,000, or 10% of revenue in the prior-year period.

Jack’s Flight Club 
On 
January 13, 2020
Travelzoo acquired 60% of Jack’s 
Flight Club, a membership subscription service. In Q4 2020, the 
Jack’s Flight Club business segment generated 
$971,000 in revenue from subscriptions with operating profit of 
$582,000. After consolidation with 
Travelzoo, Jack’s 
Flight Club’s net loss was 
$62,000, with 
$37,000 attributable to 
Travelzoo as a result of recording 
$333,000 of amortization of intangible assets related to the acquisition and haircut of revenue (derived from deferred revenue sold prior to acquisition) of 
$49,000 due to purchase accounting in accordance with 
U.S. GAAP.

Licensing
In 
June 2020
Travelzoo sold its subsidiary in 
Japan, Travelzoo Japan K.K., to Mr.  Hajime Suzuki. In connection with the sale, 
Travelzoo and Travelzoo Japan K.K. entered into a royalty-bearing licensing agreement for the exclusive use of 
Travelzoo members in 
Japan. In 
August 2020
Travelzoo sold its 
Singapore subsidiary to Mr.  Julian Rembrandt and entered into a royalty-bearing licensing agreement for, among other things, the exclusive use of 
Travelzoo’s members in 
Australia
New Zealand, and 
Singapore. Under the licensing agreements, 
Travelzoo’s existing members in 
Australia
Japan
New Zealand, and 
Singapore will continue to be owned by 
Travelzoo as the licensor. Licensing revenue from 
Japan was 
$9,000 in Q4 2020. However, licensing revenue is booked with a lag of one quarter.

Members and Subscribers
As of 
December 31, 2020, we had 30.2 million members worldwide. In 
Europe, the unduplicated number of 
Travelzoo members was 8.7 million as of 
December 31, 2020, down 4% from 
December 31, 2019. In 
North America, the unduplicated number of 
Travelzoo members was 16.3 million as of 
December 31, 2020, down 8% from 
December 31, 2019. On 
March 15, 2021
Travelzoo added more than 2 million new members in the 
U.S. in connection with a direct competitor from 
Europe exiting the U.S. market. Jack’s 
Flight Club had 1.7 million subscribers as of 
December 31, 2020, up 6% from 
December 31, 2019.

Discontinued Operations
As announced in a press release on 
March 10, 2020
Travelzoo decided to exit its 
Asia Pacific business which in 2019 reduced EPS by 
$0.60. The 
Asia Pacific business was classified as discontinued operations at 
March 31, 2020. Prior periods have been reclassified to conform with the current presentation. Certain reclassifications have been made for current and prior periods between the continued operations and the discontinued operations in accordance with 
U.S. GAAP.

Income Taxes
Income tax benefit was 
$368,000 in Q4 2020, compared to an income tax expense of 
$1.1 million in the prior-year period.

Non-GAAP Financial Measures
Management calculates non-GAAP operating income when evaluating the financial performance of the business. Travelzoo’s calculation of non-GAAP operating income, also called “non-GAAP operating profit” in this press release and today’s earnings conference call, excludes the following items: impairment of intangibles and goodwill, amortization of intangibles, stock option expenses, severance- related expenses. This press release includes a table which reconciles GAAP operating income to the calculation of non-GAAP operating income. Non-GAAP operating income is not required by, or presented in accordance with, generally accepted accounting principles in 
the United States of America (“GAAP”). This information should be considered as supplemental in nature and should not be considered in isolation or as a substitute for the financial information prepared in accordance with GAAP. In addition, these non-GAAP financial measures may not be the same as similarly titled measures reported by other companies.

Looking Ahead
We currently see a trend of recovery of our revenue. We have been able to reduce our operating expenses significantly. As a result of recovery of revenue and substantially lower operating expenses, we currently expect to achieve for Q1 a result close to break-even or a profit.

Conference Call
Travelzoo will host a conference call to discuss fourth quarter results today at 
11:00 a.m. ET. Please visit http://ir.travelzoo.com/events-presentations to

  • download the management presentation (PDF format) to be discussed in the conference call,
  • and access the webcast.

About Travelzoo
Travelzoo® provides our 30 million members insider deals and one-of-a-kind experiences personally reviewed by one of our deal experts around the globe. We have our finger on the pulse of outstanding travel, entertainment, and lifestyle experiences. For over 20 years we have worked in partnership with more than 5,000 top travel suppliers—our long-standing relationships give 
Travelzoo members access to irresistible deals.

Certain statements contained in this press release that are not historical facts may be forward-looking statements within the meaning of Section 27A of the Securities Act of 1933 and Section 21E of the Securities and Exchange Act of 1934. These forward-looking statements may include, but are not limited to, statements about our plans, objectives, expectations, prospects and intentions, markets in which we participate and other statements contained in this press release that are not historical facts. When used in this press release, the words “expect”, “predict”, “project”, “anticipate”, “believe”, “estimate”, “intend”, “plan”, “seek” and similar expressions are generally intended to identify forward-looking statements. Because these forward-looking statements involve risks and uncertainties, there are important factors that could cause actual results to differ materially from those expressed or implied by these forward-looking statements, including changes in our plans, objectives, expectations, prospects and intentions and other factors discussed in our filings with the 
SEC. We cannot guarantee any future levels of activity, performance or achievements. 
Travelzoo undertakes no obligation to update forward-looking statements to reflect events or circumstances occurring after the date of this press release.

Travelzoo and Top 20 are registered trademarks of 
Travelzoo.

 
Travelzoo
Condensed Consolidated Statements of Operations
       
(Unaudited) Three months ended   Twelve months ended
(In thousands, except per share amounts) December 31,   December 31,
  2020   2019   2020   2019
Revenues $ 12,483     $ 25,326     $ 53,601     $ 104,925  
Cost of revenues 2,795     3,046     10,563     11,435  
Gross profit 9,688     22,280     43,038     93,490  
Operating expenses:              
Sales and marketing 6,305     12,737     30,616     51,342  
Product development 495     1,853     3,081     6,709  
General and administrative 3,785     4,764     20,494     18,398  
Impairment of intangible asset and goodwill         2,920      
Total operating expenses 10,585     19,354     57,111     76,449  
Operating income (loss) (897 )   2,926     (14,073 )   17,041  
Other income (loss), net 677     (90 )   455     (42 )
Income (loss) from continuing operations before income taxes (220 )   2,836     (13,618 )   16,999  
Income tax expense (benefit) (368 )   1,116     (2,438 )   4,712  
Income (loss) from continuing operations 148     1,720     (11,180 )   12,287  
Income (loss) from discontinued operations, net of tax 554     (2,319 )   (3,390 )   (8,132 )
Net income (loss) 702     (599 )   (14,570 )   4,155  
Net income (loss) attributable to non-controlling interest (25 )       (1,147 )    
Net income (loss) attributable to 
Travelzoo
$ 727     $ (599 )   $ (13,423 )   $ 4,155  
               
Net income (loss) attributable to Travelzoo—
continuing operations
$ 173     $ 1,720     $ (10,033 )   $ 12,287  
Net income (loss) attributable to Travelzoo—
discontinued operations
$ 554     $ (2,319 )   $ (3,390 )   $ (8,132 )
               
Income (loss) per share—basic              
Continuing operations $ 0.02     $ 0.15     $ (0.88 )   $ 1.04  
Discontinued operations $ 0.05     $ (0.20 )   $ (0.30 )   $ (0.69 )
Net income (loss) per share —basic $ 0.06     $ 0.05     $ (1.18 )   $ 0.35  
               
Income (loss) per share—diluted              
Continuing operations $ 0.01     $ 0.15     $ (0.88 )   $ 1.02  
Discontinued operations $ 0.04     $ (0.20 )   $ (0.30 )   $ (0.69 )
Net income (loss) per share—diluted $ 0.06     $ 0.05     $ (1.18 )   $ 0.35  
Shares used in per share calculation from continuing operations—basic 11,315     11,559     11,344     11,809  
Shares used in per share calculation from discontinued operations—basic 11,315     11,559     11,344     11,809  
Shares used in per share calculation from continuing operations—diluted 12,605     11,691     11,344     12,035  
Shares used in per share calculation from discontinued operations—diluted 12,605     11,559     11,344     11,809  


Travelzoo
Condensed Consolidated Balance Sheets
       
(Unaudited)
(In thousands)
December 31,
2020
  December 31,
2019
Assets      
Current assets:      
Cash and cash equivalents $ 63,061     $ 18,743  
Accounts receivable, net 4,519     11,209  
Prepaid income taxes 931     989  
Deposits 137     105  
Prepaid expenses and other 1,166     2,288  
Assets from discontinued operations 230     3,961  
Total current assets 70,044     37,295  
Deposits and other 745     572  
Deferred tax assets 5,067     2,051  
Restricted cash 1,178     1,135  
Investment in WeGo     2,484  
Operating lease right-of-use assets 8,541     8,140  
Property and equipment, net 1,347     2,861  
Intangible assets, net 4,534      
Goodwill 10,944      
Total assets $ 102,400     $ 54,538  
Liabilities and Stockholders’ Equity      
Current liabilities:      
Accounts payable $ 6,996     $ 6,382  
Merchant payables 57,104     12,967  
Accrued expenses and other 8,649     6,281  
Deferred revenue 2,688     786  
Operating lease liabilities 3,587     4,847  
PPP notes payable (current portion) 2,849      
Income tax payable 326     914  
Liabilities from discontinued operations 671     3,135  
Total current liabilities 82,870     35,312  
PPP notes payable 814      
Deferred tax liabilities 357      
Long-term operating lease liabilities 10,774     7,920  
Other long-term liabilities 1,085     443  
Total liabilities 95,900     43,675  
Non-controlling interest 4,608      
Common stock 114     115  
Additional paid-in capital 6,240      
Retained earnings (accumulated deficit) (406 )   14,200  
Accumulated other comprehensive loss (4,056 )   (3,452 )
Total stockholders’ equity 1,892     10,863  
Total liabilities and stockholders’ equity $ 102,400     $ 54,538  


Travelzoo
Condensed Consolidated Statements of Cash Flows
       
(Unaudited) Three months ended   Twelve months ended
(In thousands) December 31,   December 31,
  2020   2019   2020   2019
Cash flows from operating activities:                              
Net income (loss) $ 702     $ (599 )   $ (14,570 )   $ 4,155  
Adjustments to reconcile net income (loss) to net cash provided by (used in) operating activities:              
Depreciation and amortization 508     319     2,314     1,318  
Stock-based compensation 958     117     6,201     993  
Deferred income tax (813 )   (173 )   (2,560 )   258  
Impairment of intangible assets and goodwill         2,920      
Gain on notes payable settlement         (1,500 )    
Net gain on disposal of long-lived assets (822 )       (385 )    
Loss on equity investment in WeGo     210     474     821  
Gain on sale of equity investment in WeGo (468 )       (468 )    
Net foreign currency effects (143 )   21     (685 )   80  
Provision of loss on accounts receivable and other 1,452     193     5,375     325  
Changes in operating assets and liabilities, net of acquisitions:              
Accounts receivable (50 )   (601 )   6,196     (728 )
Income tax receivable (610 )   (59 )   75     (600 )
Prepaid expenses and other (443 )   (623 )   1,183     (626 )
Accounts payable (5,234 )   410     (748 )   1,104  
Merchant payables 15,381     6,622     44,136     1,957  
Accrued expenses and other (931 )   200     (2,312 )   (242 )
Income tax payable (61 )   409     (540 )   373  
Other liabilities (193 )   2,864     1,711     2,048  
Net cash provided by operating activities 9,233     9,310     46,817     11,236  
Cash flows from investing activities:              
Acquisition of business, net of cash acquired         (679 )   (673 )
Other investment         (430 )    
Proceeds from sale of investment in WeGo 2,607         2,607      
Purchases of property and equipment (1 )   (124 )   (253 )   (474 )
Proceeds from sale of fixed assets 822         822      
Net cash provided by (used in) investing activities 2,606     (124 )   1,245     (1,147 )
Cash flows from financing activities:              
Repurchase of common stock     (2,048 )   (1,205 )   (10,816 )
Payment of promissory notes (1,700 )       (9,500 )    
Proceeds from notes payable         3,663      
Proceeds from exercise of stock options, net of taxes for net share settlement 262         262     1,710  
Net cash used in financing activities (1,438 )   (2,048 )   (6,780 )   (9,106 )
Effect of exchange rate on cash, cash equivalents and restricted cash 1,178     659     1,571     266  
Net increase in cash, cash equivalents and restricted cash 12,401     7,797     43,675     1,249  
Cash, cash equivalents and restricted cash at beginning of period 51,984     12,913     20,710     19,461  
Cash, cash equivalents and restricted cash at end of period 64,385     20,710     64,385     20,710  


Travelzoo
Segment Information from Continuing Operations
(Unaudited)
(In thousands)

Three months ended
December 31, 2020
Travelzoo North
America
  Travelzoo Europe   Jack’s Flight Club   Elimination   Consolidated
Revenue from unaffiliated customers $ 8,858     $ 2,703     $ 922     $     $ 12,483  
Intersegment revenue 12     (12 )            
Total net revenues 8,870     2,691     922         12,483  
Operating income (loss) $ 1,318     $ (2,414 )   $ 199     $     $ (897 )
                   
Three months ended
December 31, 2019
Travelzoo North
America
  Travelzoo Europe   Jack’s Flight Club   Elimination   Consolidated
Revenue from unaffiliated customers $ 15,381     $ 9,937     $     $ 8     $ 25,326  
Intersegment revenue 796     (788 )       (8 )    
Total net revenues 16,177     9,149             25,326  
Operating income $ 1,993     $ 925     $     $ 8     $ 2,926  


Twelve months ended
December 31, 2020
Travelzoo North
America
  Travelzoo Europe   Jack’s Flight Club   Elimination   Consolidated
Revenue from unaffiliated customers $ 34,663     $ 15,409     $ 3,537     $ (8 )   $ 53,601  
Intersegment revenue 249     (257 )       8      
Total net revenues 34,912     15,152     3,537         53,601  
Operating loss $ (5,056 )   $ (6,195 )   $ (2,814 )   $ (8 )   $ (14,073 )
                   
Twelve months ended
December 31, 2019
Travelzoo North
America
  Travelzoo Europe   Jack’s Flight Club   Elimination   Consolidated
Revenue from unaffiliated customers $ 65,455     $ 39,556     $     $ (86 )   $ 104,925  
Intersegment revenue 2,572     (2,658 )       86      
Total net revenues 68,027     36,898             104,925  
Operating income $ 12,666     $ 4,461     $     $ (86 )   $ 17,041  


Travelzoo
Reconciliation of GAAP to Non-GAAP Information
(Unaudited)
(In thousands, except per share amounts)
       
  Three months ended   Twelve months ended
  December 31,   December 31,
  2020   2019   2020   2019
GAAP operating expense $ 10,585     $ 19,354     $ 57,111     $ 76,449  
Non-GAAP adjustments:              
Impairment of intangible and goodwill (A)         2,920      
Amortization of intangibles (B) 333         1,277      
Stock option expenses (C) 958     117     6,201     993  
Severance-related expenses (D) 153     63     1,292     148  
Non-GAAP operating expense 9,141     19,174     45,421     75,308  
               
GAAP operating income (loss) (897 )   2,926     (14,073 )   17,041  
Non-GAAP adjustments (A through D) 1,444     180     11,690     1,141  
Non-GAAP operating income (loss) 547     3,106     (2,383 )   18,182  
               

Investor Relations: Almira Puschir@travelzoo.com

SOURCE: Travelzoo

Pangaea Logistics Solutions Ltd. (PANL) – Solid Finish to 2020 and New Year Starting on Good Note

Wednesday, March 17, 2021

Pangaea Logistics Solutions Ltd. (PANL)
Solid Finish to 2020 and New Year Starting on Good Note

Pangaea Logistics Solutions Ltd and its subsidiaries provide seaborne drybulk transportation services. It transports drybulk cargos including grains, coal, iron, ore, pig, iron, hot briquetted iron, bauxite, alumina, cement clinker, dolomite and limestone. The firm’s services include cargo loading, cargo discharge, vessel chartering, voyage planning and technical vessel management. The company derives all of its revenues from contracts of affreightment, voyage charters and time charters. Its strategy depends on focusing on increasing strategic contracts of affreightment, expanding capacity and flexibility by increasing its owned fleet and increasing backhaul focus and fleet efficiency.

Poe Fratt, Senior Research Analyst, Noble Capital Markets, Inc.

Refer to the full report for the price target, fundamental analysis, and rating.

    4Q2020 results above expectations and a solid finish to a challenging year.  Unique and consistent business model delivered high TCE rate outperformance of more than $4.4k/day, and adjusted 4Q2020 EBITDA of $12.9 million was above expectations of $12.0 million. While down from $15.1 million in 3Q2020 and $13.5 million in 4Q2019, quarterly results were positive since there is typically a seasonal falloff and shipping days were 7% lower versus last year.

    Revising 2021 EBITDA estimate to $53.5 million based on TCE rates of $15,812/day and total shipping days of 19,260.  Looking into this year, we believe that the prospects look very good for the dry bulk market, with recovering demand, lower trade tension and muted supply growth. The fleet renewal program should also have a positive impact and help capture upside potential …


This Company Sponsored Research is provided by Noble Capital Markets, Inc., a FINRA and S.E.C. registered broker-dealer (B/D).

*Analyst certification and important disclosures included in the full report. NOTE: investment decisions should not be based upon the content of this research summary.  Proper due diligence is required before making any investment decision. 

Townsquare Media Inc (TSQ) – Leaning In With A Digital First Strategy

Wednesday, March 17, 2021

Townsquare Media Inc (TSQ)
Leaning In With A Digital First Strategy

Townsquare Media Inc is an entertainment and media company offering digital marketing solutions in the United States and Canada. It owns and operates radio stations, social media properties focusing the small and mid-cap companies. Services offered to the clients include live events, local advertising, digital advertising, e-commerce offerings, few others. The segments through which the company operates its businesses are classified into Local marketing solutions and Entertainment segments. Revenues are generated from commercials through broadcasts and sale of internet based advertisements.

Michael Kupinski, Director of Research, Noble Capital Markets, Inc.

Refer to the full report for the price target, fundamental analysis, and rating.

    Solid Q4 results. Revenues sequentially improved from Q3, with revenues down a modest 3.2% to $108.5 million, in line with our $107.6 million estimate. Operating margins substantially improved from 18.4% in Q3 to 24.9%, in line with our estimates. The solid results reflected favorable growth in its Digital businesses, with its Interactive revenues up a strong 16.3%.

    Closing in on 2019 revenue levels.  Q1 2021 revenue guidance of $87.0 million to $88.0 million was better than our $86.3 million estimate. In addition, Adjusted EBITDA guidance of $18 million to $19 million was better than our $13 million estimate. The company appears to be well on way toward its revenue recovery and toward prior pandemic revenue levels …


This Company Sponsored Research is provided by Noble Capital Markets, Inc., a FINRA and S.E.C. registered broker-dealer (B/D).

*Analyst certification and important disclosures included in the full report. NOTE: investment decisions should not be based upon the content of this research summary.  Proper due diligence is required before making any investment decision.