Tribune Publishing Company (TPCO) – Alden Bucks Up

Wednesday, February 17, 2021

Tribune Publishing Company (TPCO)
Alden Bucks Up

Tribune Publishing Co is a print and online media company that publishes various newspapers and websites. It creates and distribute content across its media portfolio, offering integrated marketing, media, and business services to consumers and advertisers, including digital solutions and advertising opportunities. The company manages its business as two distinct segments, M and X. Segment M is comprised of the company’s media groups excluding their digital revenues and related digital expenses, except digital subscription revenues when bundled with a print subscription. Segment X includes the company’s digital revenues and related digital expenses from local Tribune websites, third party websites, mobile applications, digital only subscriptions, Tribune Content Agency and BestReviews.

Michael Kupinski, Director of Research, Noble Capital Markets, Inc.

Refer to the full report for the price target, fundamental analysis, and rating.

    Alden Group increased its offer. The Alden Group agreed to purchase Tribune in an all cash price of $17.25 per share for the remaining shares it does not currently own. The offer is substantially better, over 20% than the original $14.25 per share offer and a price considered to be reasonable.

    Board approved.  Tribune’s board approved the transaction following the recommendation of its special, independent committee. The transaction is expected to close in the second quarter 2021 …


This Company Sponsored Research is provided by Noble Capital Markets, Inc., a FINRA and S.E.C. registered broker-dealer (B/D).

*Analyst certification and important disclosures included in the full report. NOTE: investment decisions should not be based upon the content of this research summary.  Proper due diligence is required before making any investment decision. 

The GEO Group, Inc. (GEO) – Better Than Expected 4Q

Wednesday, February 17, 2021

The GEO Group, Inc. (GEO)
Better Than Expected 4Q

With over 94,000 beds owned, leased or managed across its business lines and serving over 260,000 people daily, GEO is a leading provider of mission critical real estate to its governmental partners. The Company is the first fully integrated equity REIT specializing in the design, financing, development, and operation of secure facilities, processing centers, and community reentry centers in the U.S., Australia, South Africa, and the U.K.

Joe Gomes, Senior Research Analyst, Noble Capital Markets, Inc.

Refer to the full report for the price target, fundamental analysis, and rating.

    4Q Results. GEO posted better than expected results for the fourth quarter, exceeding our projections and guidance. Revenue for the quarter was $578.1 million, compared to $621.7 million in 4Q19. Reported net income was $11.9 million, or $0.09 per share, versus $38.1 million, or $0.32 per share last year. Adjusted EPS was $0.33 per share compared to $0.38 last year. NFFO was $0.48 per share compared to $0.53 per share and AFFO was $0.62 per share versus $0.66 last year. We had projected revenue of $575 million, EPS of $0.25, NFFO of $0.45, and AFFO of $0.57. Management had guided to EPS of $0.23-$0.25 and AFFO of $0.55-$0.57.

    What Drove Performance? Better than anticipated expense control as well as higher occupancy levels in some facilities accounted for the guidance beat.  The overall occupancy level rose to 85.2% from 84.9% in the third quarter. While Secure Services occupancy declined to 87% from 91% a year ago, it was up from 85% in the third quarter of 2020. Reported net income was impacted by a number of items …


This Company Sponsored Research is provided by Noble Capital Markets, Inc., a FINRA and S.E.C. registered broker-dealer (B/D).

*Analyst certification and important disclosures included in the full report. NOTE: investment decisions should not be based upon the content of this research summary.  Proper due diligence is required before making any investment decision. 

Esports Entertainment Group, Inc. (GMBL) – Putting The Pieces Together

Wednesday, February 17, 2021

Esports Entertainment Group, Inc. (GMBL)
Putting The Pieces Together

Esports Entertainment Group Inc is a development-stage online gambling company focused purely on esports. The company’s principal business operations include design, develop and test wagering systems.

Michael Kupinski, Director of Research, Noble Capital Markets, Inc.

Refer to the full report for the price target, fundamental analysis, and rating.

    Fiscal Q2 in line. Total revenues of $2.36 million was in line with out estimate of $2.2 million. Adjusted EBITDA of a loss of $3.4 million was slightly better than our $3.8 million loss estimate. The quarter had a lot of noise with a significant amount of professional fees related to recent acquisitions and funding.

    Raise fiscal 2021 revenue estimate.  The company plans to close on the Lucky Dino acquisition in late February. As such, it increased full year fiscal 2021 revenue guidance from $13 million to $18 million. Notably, we believe that there is upside surprise potential to that guidance. We are maintaining our fiscal 2022 revenue estimate of $70 million, which is in line with management’s guidance …


This Company Sponsored Research is provided by Noble Capital Markets, Inc., a FINRA and S.E.C. registered broker-dealer (B/D).

*Analyst certification and important disclosures included in the full report. NOTE: investment decisions should not be based upon the content of this research summary.  Proper due diligence is required before making any investment decision. 

ACCO Brands Corporation (ACCO) – Fourth Quarter Results In-line with Estimates

Wednesday, February 17, 2021

ACCO Brands Corporation (ACCO)
Fourth Quarter Results In-line with Estimates

ACCO Brands Corporation designs, manufactures, sources, markets, and sells office products, academic supplies, and calendar products primarily in the United States, Canada, Northern Europe, Brazil, Australia, and Mexico. It operates through three segments: ACCO Brands North America, ACCO Brands EMEA, and ACCO Brands International. The company offers office products, such as stapling, binding and laminating equipment, and related consumable supplies, as well as shredders and whiteboards; and academic products, including notebooks, folders, decorative calendars, and stationery products. It also provides private label products, as well as business machine maintenance and repair services. The company offers its business, academic, and calendar product lines under the Artline, AT-A-GLANCE, Derwent, Esselte, Five Star, GBC, Hilroy, Leitz, Marbig, Mead, NOBO, Quartet, Rapid, Rexel, Swingline, Tilibra, Wilson Jones, and other brand names. In addition, it designs, sources, distributes, markets, and sells accessories for laptop and desktop computers, and tablets comprising security products; input devices, such as presenters, mice, and trackballs; ergonomic aids, including foot and wrist rests; docking stations; and other personal computers and tablet accessories under the Kensington, Microsaver, and ClickSafe brand names. The company sells its products to consumers and commercial end-users primarily through resellers, including traditional office supply resellers, wholesalers, mass merchandisers, and retailers, as well as directly to consumers through on-line and direct mail. ACCO Brands Corporation is headquartered in Lake Zurich, Illinois.

Joe Gomes, Senior Research Analyst, Noble Capital Markets, Inc.

Refer to the full report for the price target, fundamental analysis, and rating.

    4Q20 Results. ACCO Brands reported fourth quarter revenue of $460 million, down 14% y-o-y. EPS totaled $0.31 versus $0.44 a year ago. Adjusted EPS was $0.32 compared to $0.46 in 4Q19. We had forecast revenue of $456 million, EPS of $0.30 and adjusted EPS of $0.28. For the full year, ACCO reported revenue of $1.66 billion, down 15%, EPS of $0.65 versus $1.06, and adjusted EPS of $0.70 versus $1.20 in 2019. PowerA added $8 million to revenue for the year.

    EMEA 4Q Driving Force.  EMEA posted a strong 4Q with net sales of $171.7 million, up 6%, although down 1% on a comparable basis. Since the 2Q20 nadir, EMEA has posted strong sequential top line growth with revenues rising from $88.3 million in 2Q to $136.4 million in Q3 to $171.7 million in Q4. Sell through of computer accessories, shredders, air purifiers, and DIY tools drove the improved …


This Company Sponsored Research is provided by Noble Capital Markets, Inc., a FINRA and S.E.C. registered broker-dealer (B/D).

*Analyst certification and important disclosures included in the full report. NOTE: investment decisions should not be based upon the content of this research summary.  Proper due diligence is required before making any investment decision. 

Can Mining be Green and Sustainable?


Small-Cap Mining Companies Offer Innovative Environmental Solutions


Are ESG principles being adopted by mining companies? Extractive industries are vital to providing the raw materials that fuel global economies and improve living standards. Compared to past decades, today’s industry operates much more cleanly and efficiently in part because of advancements in technology, corporate governance, and operating practices. While the mining industry has not always gotten high marks due to high-profile accidents such as Vale’s (NYSE: VALE) 2019 tailings dam collapse in Brazil, ESG principles have generally long been incorporated into corporate policies and practices.

With the move toward a greener and more sustainable future, renewable energy sources, including solar and wind, and the electrification of vehicles will require growing supplies of metals, including cobalt, copper, lithium, nickel, and silver. The mining industry has demonstrated an admirable track record of weathering challenges such as the COVID-19 pandemic to supply growing global demand in a sustainable and environmentally responsible manner. Even so, companies are looking for ways to shrink their environmental footprint, reduce, reuse, and recycle materials, along with renewing the environment through reclamation efforts. Below are just a few examples of innovation and action taking place among companies in Noble Capital Markets’ coverage universe to promote a cleaner and more sustainable future while at the same time doing so profitably.

Mercury remediation. Comstock Mining Inc. (NYSE American: LODE) and its partners, including Mercury Clean-Up, LLC (MCU), are deploying proprietary processes and technology to remediate mercury from contaminated sites. MCU’s mercury remediation equipment is currently deployed in the Philippines, with processing operations commencing this month. Comstock’s joint venture partners are collaborating to begin removing mercury while efficiently extracting gold from contaminated and abandoned mining sites in the United States and abroad.


Figure 1: MCU Plant Undergoing Pilot Testing in the United States

Source: Comstock Mining Inc.

Uranium recycling. Energy Fuels Inc. (NYSE American: UUUU) recycles materials for the recovery of uranium and vanadium. Recycling conserves resources, reduces the need to mine additional resources and helps limit carbon emissions. According to the company’s corporate presentation, Energy Fuels’ recycling program at its White Mesa Mill has recovered 6 million pounds of uranium. If converted to nuclear fuel, Energy Fuel’s recycled uranium would eliminate over 85 million tons of carbon dioxide emissions compared to coal, produce as much electricity as 24,500 wind turbines, and avoid the annual emissions from 18 million passenger cars. According to the company, the White Mesa Mill has recycled enough vanadium for the steel needed to build 4.5 Golden Gate bridges. Additionally, the company is well positioned to help clean up abandoned uranium mines and is participating in a pilot-scale project on Navajo Nation and supporting reclamation efforts of a private mine in Mexico. White Mesa can receive uranium-bearing material from these cleanups and thus recycle the contained uranium while at the same time permanently disposing of the cleanup materials using its licensed tailing management system. Many of the company’s efforts to promote environmental and social responsibility may be referenced in its 2020 Sustainability Report found here.

Strategic metals recovery and recycling. Comstock Mining has targeted new development projects that efficiently reprocess and renew silver and other strategic metals. Material may be sourced from tailings, leach pads and other mining waste. The company is also exploring opportunities to utilize existing processing facilities and infrastructure to reprocess material for silver and gold and expand into metals processing and recycling to recover strategic metals, including cobalt, lithium, nickel and/or other battery metals.

Non-invasive mineral extraction. Group 11 Technologies Inc. is a private company that is advancing non-invasive extraction technology and environmentally friendly liquids to recover gold and other metals. Group 11 offers a product for In-Situ Recovery (ISR) and an environmentally safe solution that is water-based and only includes ingredients approved by the FDA for human consumption. ISR is an environmentally friendly process to extract precious metals with minimal disturbance to the surface environment and without the use of harmful chemicals such as cyanide. It utilizes a series of drilled wells to inject and recover water-based solutions that selectively dissolve metals such as copper, uranium, and gold so they can be separated and recovered. Group 11 is owned by: 1) EnviroLeach Technologies Inc. (OTCQB: EVLLF), 2) Encore Energy Corp. (OTCQX: ENCUF), and 3) Golden Predator Mining Corp. (OTCQX: NTGSF).

Figure 2: In-Situ Gold Recovery Process

Source: Group 11 Technologies

Take-Away

Investors interested in the innovations in ESG mining and their implementation can find more information from some of the corporate presentations available here from the NobleCon17 investor conference. Innovation is often birthed by micro and small-cap companies nimble enough to identify and capitalize on opportunity, and as a means for developing a competitive advantage or edge. The last hundred years had been rough on the planet. If necessity is the mother of invention, then one can expect more innovation and resources aimed at conserving and renewing the earth’s resources. As a result of decades of neglect, a significant market opportunity awaits those with the right solutions.

Suggested Reading:

Can Oil Prices Keep Climbing?

GEVO Update on FEED Engineering

Can Small Investors Compete With Wall Street?


Sources:

Brazil State Eyes at Least $5.3 Billion Vale Deal After Dam Burst, Official Says, Reuters, Luciano Costa, January 6, 2021.

Comstock Focuses on Climate Smart Mining; Develops Existing and New Precious Metals
Projects to Fuel Clean Energy Transition
, Press Release, Comstock Mining Inc., February 4, 2021.

Energy
Fuels Form 10 Q
, United States Securities and Exchange Commission, For the Quarterly Period Ended September 30, 2020.

Corporate Presentation, EnCore Energy Corp., January 2021.

Corporate Presentation, Group 11 Technologies, September 2020.

Corporate Presentation, Energy Fuels Inc., January 2021.

Sustainability Report, Energy Fuels Inc., December 2020.


Photo: Geiger Lookout, Melfoody  –  Some rights reserved


Stay up to date. Follow us:


Release – Idaho Champion Gold Mines Canada (GLDRF) – Reports Results of 2020 Core Drilling at Champagne Project Idaho


Idaho Champion Reports Results of 2020 Core Drilling at Champagne Project, Idaho including 1.04 g/t Gold Equivalent over 42.98 Metres


Toronto, ON – February 16, 2021 – Idaho Champion Gold Mines Canada Inc. (CSE: ITKO; OTCQB: GLDRF; FSE: 1QB1)(“Idaho Champion” or the “Company“) is pleased to report the results from its 2020 diamond core (“Core“) drilling campaign at its 100% controlled Champagne Gold Project (“Champagne“) near the city of Arco, Butte County, Idaho.

2020 Champagne Drilling Highlights:

  • Drill hole DDH-CC-20-02 intersected 1.04 g/t gold equivalent (“AuEq”) for the interval 123.14-166.12 m (42.98 m core length), including 1.22 g/t AuEq for the interval 123.14-157.06 m (31.93 m core length).
  • Drill hole DDH-CC-20-02 was collared at Mine Hill in the approximate center of the unmined 300 m interval between the North and South Pits (Bema Gold c. 1989-90).
  • This mineralized interval is associated with shallow induced polarization anomalies in chargeability and resistivity as reported in the Idaho Champion press release dated Feb 2, 2021.

“Core drilling and results of our IP survey have provided data to better formulate a conceptual geologic model for the Champagne District,” stated President and CEO, Jonathan Buick. “The promising mineralization from the program demonstrates there is gold in the system below the historic mined pits where we are confident that we can identify additional resources. Our evolving geologic model indicates that the base, or roots, of a larger system that may have been the feeder for all mining in this district lies off to the west. This large body of anomalous chargeability will be drill tested in 2021.”

Champagne Drilling Technical Summary

The 2020 core drilling program consisted of seven (7) diamond drill holes totaling 2,818 Metres (Fig. 1). Five core holes (DDH-CC-20-01 through DDH-CC-20-05) were positioned on Mine Hill in the vicinity of the North and South Pits and two core holes (DDH-CC-20-06 and DDH-CC-20-07) were located further north near the Ella Mine breccia vein.

Three holes (DDH-CC-20-01, -02, -07) intersected promising precious metals mineralization, with the strongest presence of gold and silver intersected in DDH-CC-20-02. The spatial relationships of these three holes to results of the recently completed induced polarization (IP) survey are represented in Figs. 2-3 (see also Idaho Champion press release of February 2, 2021). An inferred low-angle detachment fault represented in Fig. 2 is interpreted to have displaced the shallow IP anomaly at Mine Hill from a larger and deeper anomaly 800 m west of Mine Hill.

Figure 1: Champagne Gold Project 2020 Exploration Drill Hole Locations

Figure 2: Cross sections showing downhole AuEq intervals (red disks) plotted on 3D IP chargeability model. High AuEq values are associated with chargeability highs. The large, buried IP chargeability high is currently interpreted to be the center of the mineralizing system. Details about the recently competed IP survey at Champagne can be found in Idaho Champion’s news release dated 2 February 2021.

Figure 3: 2020 Idaho Champion Core and Reverse Circulation Drill Holes and 2020 3D IP Chargeability Model

DDH-CC-20-01 (Fig. 4) was inclined westward beneath the central part of the North Pit across a series of mineralized and altered breccia and fractured intervals. The intervals represent a sheeted pyritiferous breccia zone, the upper oxidized portion of which was mined for gold and silver in the North Pit. Below the pit floor, the breccia intervals in the intercept were found to be separated by intervals of less-altered andesite. DDH-CC-20-01 is interpreted to have progressed from the very top of the hydrothermal mineralizing system down into increasingly gold-bearing parts of the system. This gradient of increasing gold with depth also correlates to intervals of increased levels of anomalous pathfinder metals (principally As, Hg, Sb, and Bi).

Figure 4: Champagne Gold Project Drill Section and AuEq Results: DDH-CC-20-01

DDH-CC-20-02 (Fig. 5) was sited to test the projected trace of the Last Chance Zone, which had historically been exploited for oxide-silver (Horn Silver Mine) and deeper lead-zinc-silver sulfide mineralization. The reported common occurrence of accessory famatinite (copper-antimony sulfosalt) and aikinite (copper-bismuth sulfosalt) with the sulfide ore is also of exploration interest. The Last Chance Zone was intersected between drilling depths of 123.14 to 166.12 Metres and is comprised of strongly pyritized breccia and brecciated andesite with sulfide intervals approaching semi-massive character.

The results show that the zinc and lead values appear to be tapering off down hole, but anomalous gold content continues to depth, as does silver and copper. The pathfinder metal mercury reaches very high levels with scattered intervals of strong arsenic and scattered intervals of anomalous antimony and bismuth. A fault that is interpreted as a low-angle detachment structure was encountered below the intersection of the Last Chance Zone.

Figure 5. Drill Section and AuEq Results: DDH-CC-20-02

DH-CC-20-07 (Fig. 6) was designed to test the Ella Mine breccia vein but is interpreted to have instead pierced the detachment fault at shallow depth. The hole was advanced through propylitically altered footwall ash-fall and crystal tuff units in an effort to penetrate the eastern edge of the IP anomaly on Lines 4 and 5. Strong sericite-silica alteration and well-developed mosaic brecciation was intersected beginning at a depth of 340 m. The pyrite content increased to 3 – 8% with the sericite and silica alteration and is accompanied by anomalous silver, zinc, lead and arsenic (as well as weakly anomalous gold values). At depths of 441.96 to 452.63 Metres, anomalous silver (up to 42.3 g/t), copper (up to 0.22%), and anomalous gold (up to 0.107 g/t) occur within a brecciated interval. Zinc, lead, and arsenic are also anomalous within this interval. At a depth of 475 m, the hole returned to dominantly propylitic alteration with diminished pyrite content. The direction and angle of the hole suggests that only the outer-most edge of the IP anomaly was intersected.

Quality Assurance/Quality Control Procedure

Idaho Champion Gold adheres strictly to a regimented drill core handling and processing procedure. Core from the drill rig(s) is logged for lithology, mineralization, structure, alteration, and veining. During the logging process 1 to 2 meter samples are delineated by company geologists. Core is then photographed and sawn in half. Following sawing, individual samples are extracted from core boxes and inserted into individual sacks with a unique waterproof sample number tag and sealed. The remaining half-core is left in core boxes for post-cut photographing and storage. Sacks containing samples are kept indoors on site until they are transported to the assay lab.

Quality control (QC) samples are inserted into the sample stream such that there is one QC sample for every ten drill core samples. These QC samples consist of certified standards (known metallic content) and blanks (known barren of metals). Two styles of blank material were used: a coarse blank and a pulverized blank. QC sample insertions alternate between standard and blank.

The first sample shipment was delivered to ALS Geochemistry’s facility in Elko, NV. All subsequent sample shipments were delivered to American Assay Labs (AAL) in Sparks, NV. ALS and AAL conform to ISO 17025 requirements. All drill samples and coarse blanks are crushed to 70% passing 2mm at the assay lab, and 1 kg material is split and pulverized to 85% passing 75 micron. All samples are processed by 30 gram fire assay- Inductively coupled plasma optical emission spectrometry (ICP-OES). Samples are additionally analyzed for 35, 36, or 61 multi-element analysis by ICP-OES and/or inductively coupled plasma mass spectrometry (ICP-MS). Samples containing Au or Ag above detection limits by ICP-OES analysis are automatically re-analyzed by fire assay with a gravimetric finish.

All drill intervals reported in this release are calculated using a 0.10 g/t gold cut-off grade and a maximum of 3 Metres consecutive waste.

About the Champagne Project

The Champagne Mine* was operated by Bema Gold as a heap leach operation on an epithermal gold-silver system that occurs in volcanic rocks. Bema Gold drilled 72 shallow reverse circulation holes on the project, which complement drilling and trenching from other previous operators. The property has had no deep drilling or significant modern exploration since the mine closure in early 1992. The Champagne Deposit contains epigenetic style gold and silver mineralization that occurs in strongly altered Tertiary volcanic tuffs and flows of acid to intermediate composition. Champagne has a near surface cap of gold-silver mineralization emplaced by deep-seated structures that acted as conduits for precious metal rich hydrothermal fluids. Higher grade zones in the Champagne Deposit appear to be related to such feeder zones.

* The Company cautions that the information about the past-producing mine may not be indicative of mineralization on Champion’s property, and if mineralization does occur, that it will occur in sufficient quantity or grade that would result in an economic extraction scenario. The historic data were simply used to evaluate the prospective nature of the property. The Company has not yet conducted sufficient exploration to ascertain if a mineral resource is present on the property.

Qualified Person

The technical information in this press release has been reviewed and approved by Peter Karelse P.Geo., a consultant to the Company, who is a Qualified Person as defined by NI 43-101. Mr. Karelse has more than 30 years of experience in exploration and development.

About Idaho Champion

Idaho Champion is a discovery-focused gold exploration company that is committed to advancing its 100% owned highly prospective mineral properties located in Idaho, United States. The Company’s shares trade on the CSE under the trading symbol “ITKO”, on the OTCQB under the trading symbol “GLDRF”, and on the Frankfurt Stock Exchange under the symbol “1QB1”. Idaho Champion is vested in Idaho with the Baner Project in Idaho County, the Champagne Project located in Butte County near Arco, and four cobalt properties in Lemhi County in the Idaho Cobalt Belt. Idaho Champion strives to be a responsible environmental steward, stakeholder and a contributing citizen to the local communities where it operates. Idaho Champion takes its social license seriously, employing local community members and service providers at its operations whenever possible.

For further information, please visit the Company’s SEDAR profile at www.sedar.com or the Company’s corporate website at www.idahochamp.com.

Cautionary Statements

Neither the Canadian Securities Exchange nor its regulation services provider has reviewed or accepted responsibility for the adequacy or accuracy of this press release

This press release may include forward-looking information within the meaning of Canadian securities legislation, concerning the business of the Company. Forward-looking information is based on certain key expectations and assumptions made by the management of the Company. Although the Company believes that the expectations and assumptions on which such forward-looking information is based on are reasonable, undue reliance should not be placed on the forward-looking information because the Company can give no assurance that they will prove to be correct. Forward-looking statements contained in this press release are made as of the date of this press release. The Company disclaims any intent or obligation to update publicly any forward-looking information, whether as a result of new information, future events or results or otherwise, other than as required by applicable securities laws.

Investor Contacts

Nicholas Konkin
Marketing and Communications
Phone: 416-567-9087
Email address: nkonkin@idahochamp.com

Source: Idaho Champion

Release – Sierra Metals Inc. (SMT:CA)(SMTS) – Reports Q4-2020 Financial Results At Its Sociedad Minera Corona Subsidiary In Peru


Sierra Metals Reports Q4-2020 Financial Results At Its Sociedad Minera Corona Subsidiary In Peru


Consolidated Financial Results for Sierra Metals to Be Released on March 18, 2021

(All metal prices and amounts reported in USD)

TORONTO–(BUSINESS WIRE)– Sierra Metals Inc. (TSX:SMT, BVL:SMT, NYSE AMERICAN:SMTS) (“Sierra Metals” or the “Company”) announces the filing of Sociedad Minera Corona S.A.’s (“Corona”) unaudited Financial Statements and the Management Discussion and Analysis (“MD&A”) for the fourth quarter of 2020 (“Q4 2020”).

This press release features multimedia. View the full release here: https://www.businesswire.com/news/home/20210216005467/en/

The Company holds an 81.8% interest in Corona. All amounts are presented in US dollars unless otherwise stated and have not been adjusted for the 18.2% non-controlling interest.

Corona’s Highlights for the Three Months Ended December 31, 2020

  • Revenues of US$45.2 million vs. US$42.2 million in Q42019
  • Adjusted EBITDA of US$22.5 million vs. US$17.9 million in Q4 2019
  • Total tonnes processed decreased by 3% to 311,946 vs. 321,701 in Q4 2019
  • Net production revenue per tonne of ore milled increased by 8% to US$148.13
  • Cash cost per copper equivalent payable pound decreased by 1% at US$1.16 in Q4 2020
  • All-in sustaining cost (“AISC”) per copper equivalent payable increased 17% to US$2.47 in Q4 2020
  • Copper equivalent production of 18.4 million pounds vs. 23.1 million pounds in Q4 2019
  • US$65.0 million of cash and cash equivalents as at December 31, 2020
  • US$92.0 million of working capital as at December 31,2020

Annual throughput of 1,117,860 was in line with the 2019 annual production, despite the impact of COVID-19 related shutdowns faced in Q2 2020 and other COVID-19 related challenges throughout the year. Throughput for Q4 2020 decreased by 3% as compared to Q4 2019, as a result of operational downtimes and minor production disruptions. Copper and zinc equivalent metal production in Q4 2020 decreased by 20% and 14%, respectively, due to lower throughput and lower head grades. Additionally, lower workforce availability continued to impact mine development, leading to lower ore contribution from the high-grade cuerpos chicos zones. Year over year, copper equivalent production decreased 4% in 2020 compared to the prior year. During 2020, zinc and gold’s annual production increased 1% and 3%, respectively, while copper and lead annual production decreased by 2% and 9%. Silver production for 2020 was in line with the 2019 annual silver production.

Q4 2020 revenues increased by 7% compared to Q4 2019 as a result of higher metal prices realized. Annual revenues were 6% lower due to the impact of a 66% increase in the treatment and refining costs. Adjusted EBITDA increased by 25% and 4% during Q4 2020 and the year respectively compared to the same periods of 2019, as operating costs excluding COVID-19 costs were lower than the prior year.

Cash and cash equivalents increased by $30 million during the year due to a combined result of a 27% increase in operating cash flows and a decrease of 26% in cash used in investing activities, as some capital expenditures were deferred considering the uncertainties related to the impacts of COVID-19. Cash costs per copper equivalent payable pound for 2020 decreased by 10% due to lower operating costs per tonne. AISC per copper equivalent payable pound for 2020 increased 10% primarily due to a 66% increase in treatment and refining costs partially offset by lower cash costs.

Luis Marchese,CEO of Sierra Metals,commented, “I am pleased with Yauricocha’s performance in the fourth quarter of 2020, which saw increases in revenue and adjusted EBITDA compared to the same quarter in 2019. The Company also realized increased EBITDA but lower revenue on a year over year basis primarily due to lower incomes resulting from significant increases to the treatment and refining charges. Overall, the Company performed well and produced solid results, given the challenging year we had due to the effects of dealing with the COVID-19 pandemic. I want to thank all employees for their efforts to help the Company achieve these results.”

He continued, “Looking ahead, 2021 is an exciting time for the Company as we continue advancing important projects, operational improvements, and exploration at Yauricocha. We also look forward to receiving the necessary permits at Yauricocha to increase throughput by 20% to the 3,600 tonne per day level. Furthermore, we recently completed and published a Preliminary Economic Assessment at Yauricocha with favourable economics to examine increasing throughput to 5,500 tonnes per day starting in 2024. We look forward to releasing a Preliminary Feasibility Study in the coming months to support that expansion further.”

He concluded, “Corona continues to have a solid balance sheet and strong liquidity. Management remains optimistic that continued operational efficiencies can be obtained at the Yauricocha Mine as well as capitalizing on further operational and resource growth opportunities.”

The following table displays selected financial information for the three months and year ended December 31, 2020:

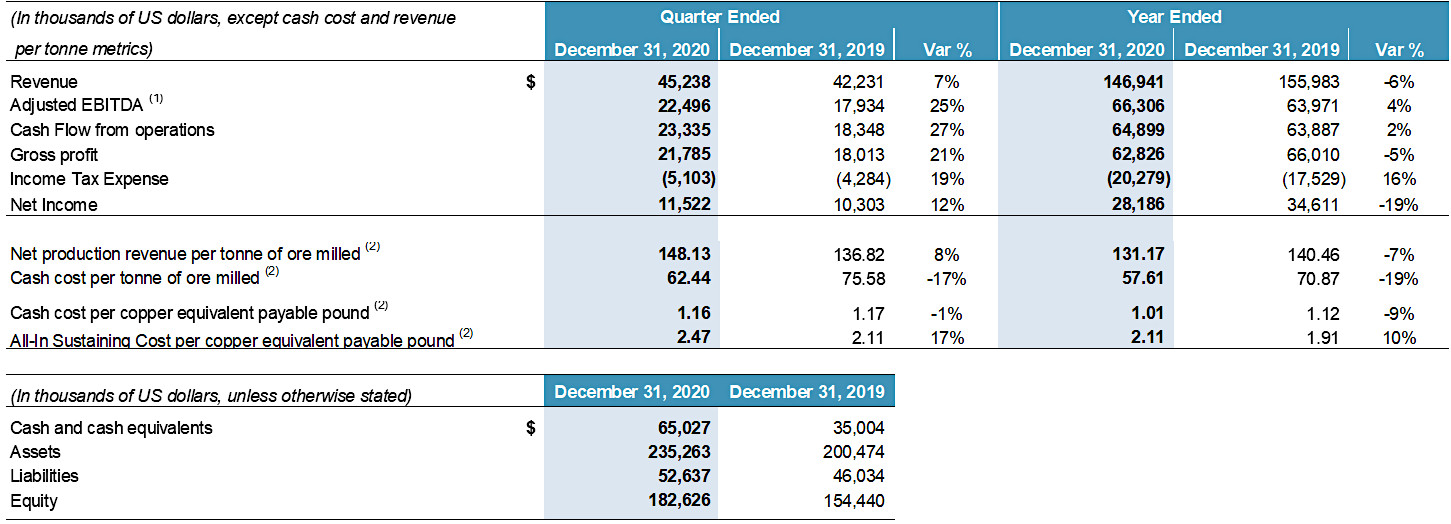
1 Adjusted EBITDA includes adjustments for depletion and depreciation, interest expense and other financing costs, interest income, share-based compensation, Foreign Exchange (gain) loss and income taxes; see non-IFRS Performance Measures section of the Company’s MD&A.
2 All-In Sustaining Cost per copper equivalent pound sold are non-IFRS performance measures and include cost of sales, treatment and refining charges, sustaining capital expenditures, general and administrative expense, and selling expense, and exclude workers’ profit sharing, depreciation, and other non-cash provisions; Cash cost per copper equivalent pound sold, net production revenue per tonne of ore milled, and cash cost per tonne of ore milled are non- IFRS performance measures; see non-IFRS Performance Measures section of the Company’s MD&A.

Corona’s Financial Highlights for the Three Months and Year Ended December 31, 2020

  • Revenues of $45.2 million for Q4 2020 compared to $42.2 million in Q4 2019 and revenues of $146.9 million for the year ended December 31, 2020, compared to $156.0 million for the same period in 2018. The increase in revenues during Q4 2020 compared to Q4 2019 was primarily driven by higher realized prices for all metals except lead. Revenues were higher for the quarter despite significant increases in the treatment and refining charges and lower metal sales resulting from lower throughput and grades. Revenues for the year ended December 31, 2020, were 6% lower than the same period in 2019 due to the 66% increase in treatment and refining charges offset by the increase in the average realized sale price for gold (9%) and zinc (4%). Average realized prices in 2020 were higher for copper (3%), silver (26%) and gold (26%), but lower for zinc (10%) and lead (9%) as compared to the average realized prices in 2019.
  • Cash cost per copper equivalent pound sold at the Yauricocha Mine of $1.16 for Q4 2020 compared to $1.17 for Q4 2019; and $1.01 for the year ended December 31, 2020, compared to $1.12 for the same period in 2019. All-in sustaining cost (“AISC”) per copper equivalent pound sold of $2.47 for Q4 2020 compared to $2.11 for Q4 2019 and $2.11 for the year ended December 31, 2020, comparedto $1.91 for the same period in 2019. The increase in the AISC per copper equivalent payable pound for Q4 2020 and full year 2020 comparedto the same periods in 2019 was a combined result of higher treatment and refining charges and lower copper equivalent payable pounds sold.
  • Adjusted EBITDA of $22.5 million for Q4 2020 compared to $17.9 million for Q4 2019 and $66.3 million for the year ended December 31, 2020, comparedto $64.0 million for the same period in 2019.
  • Operating cash flows before movements in working capital was $23.3 million for Q4 2020, compared to US$18.3 million for Q4 2019, and $65.0 million for the year ended December 31, 2020, compared to $63.9 million for the same period in 2019. An increase in operating cash flows resulted from an increase in gross margins compared to 2019, mainly due to lower workforce and contractor costs.
  • Cash and cash equivalents of $65.0 million as at December 31, 2020, compared to $35.0 million as at December 31, 2018. The increase in cash and cash equivalents was driven largely by operating cash flows of $48.6 million (after movement in working capital) offset by capital expenditures of $19.2 million.
  • Net income of $11.5 million, or $0.32 per share for Q4 2019, compared to net income of $10.3 million, or $0.29 per share for Q4 2019. Net income of $28.2 million, or $0.78 per share, for the year ended December 31, 2020, compared to $34.6 million, or $0.96 per share, for the same period in 2019.

Corona’s Operational Highlights for the Three Months and Year Ended December 31, 2020

The following table displays the production results for the three months and year ended December 31, 2020, for further production details please refer the Company’s Q4 production press release dated January 18, 2021:

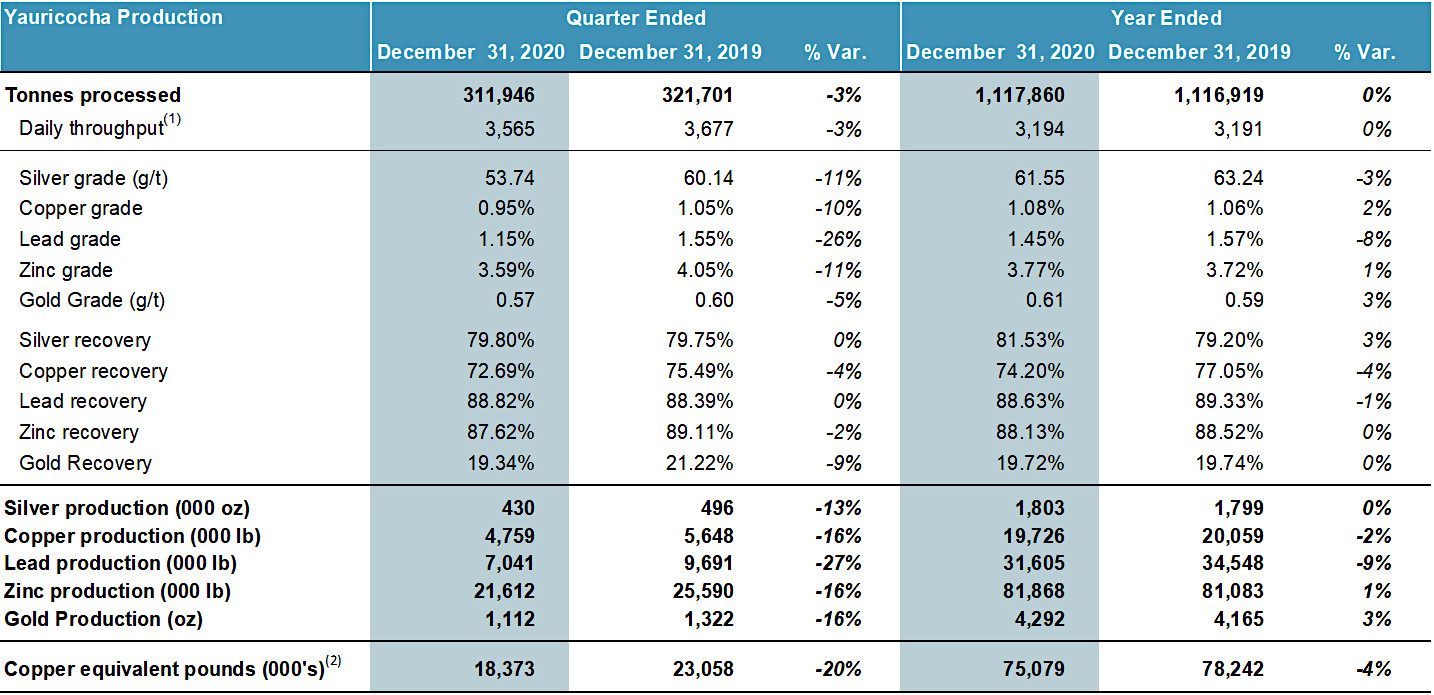
1 Daily throughput is calculated using 350 operating days for the year.
2 Copper equivalent pounds were calculated using the following realized prices: for Q4 2020 – $24.30/oz Ag, $3.32/lb Cu, $1.22/lb Zn, $0.89/lb Pb, $1,859/oz Au, for Q4 2019 – $17.42/oz Ag, $2.69/lb Cu, $1.07/lb Zn, $0.92/lb Pb, $1,506/oz Au, for full year 2020 – $20.59/oz Ag, $2.80/lb Cu, $1.03/lb Zn, $0.83/lb Pb, $1,771/oz Au, for full year 2019 – $16.29/oz Ag, $2.73/lb Cu, $/1.14lb Zn, $0.91/lb Pb, $1,404/oz Au.

Sierra Metals to release Q4/YE 2020 Financial Results on March 18, 2021

The Company will release Q4-2020 financial results on Thursday March 18, 2021, after the Market close. Senior Management will also host a webcast and conference call on Friday March 19, 2021, at 10:30am EDT. Details of the Conference Call and Webcast are as follows:

Via Webcast:

A live audio webcast of the meeting will be available on the Company’s website:

https://event.on24.com/wcc/r/2947459/6CFF80ECA94506BA22260486A6292C76

The webcast, along with presentation slides, will be archived for 180 days on www.sierrametals.com.

Via phone:

To register for this conference call, please use the link provided below. A confirmation will be sent through email, including dial-in details and unique conference call codes for entry after registering.

Registration is open throughout the live call; however, to ensure you are connected for the entire call, we suggest registering a day in advance or at minimum 10 minutes before the start of the call.

Conference Call Registration Link:

http://www.directeventreg.com/registration/event/4514269

Quality Control

All technical data contained in this news release has been reviewed and approved by:

Américo Zuzunaga, FAusIMM CP (Mining Engineer) and Vice President of Corporate Planning is a Qualified Person under National Instrument 43-101 – Standards of Disclosure for Mineral Projects.

Augusto Chung, FAusIMM CP (Metallurgist) and Vice President of Metallurgy and Projects to Sierra Metals is a Qualified Person under National Instrument 43-101 – Standards of Disclosure for Mineral Projects.

About Sierra Metals

Sierra Metals Inc. is a diversified Canadian mining company focused on the production and development of precious and base metals from its polymetallic Yauricocha Mine in Peru, and Bolivar and Cusi Mines in Mexico. The Company is focused on increasing production volume and growing mineral resources. Sierra Metals has recently had several new key discoveries and still has many more exciting brownfield exploration opportunities at all three Mines in Peru and Mexico that are within close proximity to the existing mines. Additionally, the Company also has large land packages at all three mines with several prospective regional targets providing longer-term exploration upside and mineral resource growth potential.

The Company’s Common Shares trade on the Bolsa de Valores de Lima and on the Toronto Stock Exchange under the symbol “SMT” and on the NYSE American Exchange under the symbol “SMTS”.

For further information regarding Sierra Metals, please visit www.sierrametals.com or contact:

Continue to Follow, Like and Watch our progress:

Web: www.sierrametals.com | Twitter: sierrametals | Facebook: SierraMetalsInc | LinkedIn: Sierra Metals Inc

Forward-Looking Statements

This press release contains “forward-looking information” and “forward-looking statements” within the meaning of Canadian and U.S. securities laws (collectively, “forward-looking information”). Forward-looking information includes, but is not limited to, statements with respect to the date of the 2020 Shareholders’ Meeting and the anticipated filing of the Compensation Disclosure. Any statements that express or involve discussions with respect to predictions, expectations, beliefs, plans, projections, objectives, assumptions or future events or performance (often, but not always, using words or phrases such as “expects”, “anticipates”, “plans”, “projects”, “estimates”, “assumes”, “intends”, “strategy”, “goals”, “objectives”, “potential” or variations thereof, or stating that certain actions, events or results “may”, “could”, “would”, “might” or “will” be taken, occur or be achieved, or the negative of any of these terms and similar expressions) are not statements of historical fact and may be forward-looking information.

Forward-looking information is subject to a variety of risks and uncertainties, which could cause actual events or results to differ from those reflected in the forward-looking information, including, without limitation, the risks described under the heading “Risk Factors” in the Company’s annual information form dated March 30, 2020 for its fiscal year ended December 31, 2019 and other risks identified in the Company’s filings with Canadian securities regulators and the United States Securities and Exchange Commission, which filings are available at www.sedar.com and www.sec.gov, respectively.

The risk factors referred to above are not an exhaustive list of the factors that may affect any of the Company’s forward-looking information. Forward-looking information includes statements about the future and is inherently uncertain, and the Company’s actual achievements or other future events or conditions may differ materially from those reflected in the forward-looking information due to a variety of risks, uncertainties and other factors. The Company’s statements containing forward-looking information are based on the beliefs, expectations and opinions of management on the date the statements are made, and the Company does not assume any obligation to update such forward-looking information if circumstances or management’s beliefs, expectations or opinions should change, other than as required by applicable law. For the reasons set forth above, one should not place undue reliance on forward-looking information.

Mike McAllister
Vice President, Investor Relations
Sierra Metals Inc.
Tel: +1 (416) 366-7777
Email: info@sierrametals.com

Luis Marchese
CEO

Sierra Metals Inc.
Tel: +1 (416) 366-7777

Source: Sierra Metals Inc.

Chakana Copper Corp (CHKKF)(PERU:CA) – Drilling Activity to Accelerate in 2021

Tuesday, February 16, 2021

Chakana Copper Corp (CHKKF)(PERU:CA)
Drilling Activity to Accelerate in 2021

Noble Capital Markets research on Chakana Copper Corp is published under ticker symbols CHKKF and PERU:CA. The price target is in USD and based on ticker symbol CHKKF. Chakana Copper Corp. is a Canada-based mineral exploration company currently advancing the gold-copper-silver Soledad Project near Aija, in the Ancash region of the Miocene mineral belt of Peru. The Soledad Project consists of high-grade gold-copper-silver mineralization hosted in tourmaline breccia pipes. The company’s shares are listed on the TSX Venture Exchange under the symbol “PERU” and trade over the counter under the ticker “CHKKF.”

Mark Reichman, Senior Research Analyst of Natural Resources, Noble Capital Markets, Inc.

Refer to the full report for the price target, fundamental analysis, and rating.

    Additional outstanding drill results. Chakana recently released results for two additional drill holes with the highest-grade intercepts reported to date from the Huancarama Breccia Complex. These are in addition to results from the initial ten holes previously released. Chakana will provide an update during the VID III virtual investor conference hosted by Follow the Money Investor Group and IR.INC Capital Markets Advisory on February 17th at 11:30 am ET. Investors may register here.

    Drilling program for calendar year 2021.  Based on the outstanding drill results thus far, Chakana’s board approved a calendar year 2021 drilling program that will entail 26,000 meters of drilling. Roughly 16,000 meters is expected to be dedicated for infill drilling on new discoveries, while 10,000 meters would be dedicated to scout drilling. This would bring the Phase 3b drilling program, which …


This Company Sponsored Research is provided by Noble Capital Markets, Inc., a FINRA and S.E.C. registered broker-dealer (B/D).

*Analyst certification and important disclosures included in the full report. NOTE: investment decisions should not be based upon the content of this research summary.  Proper due diligence is required before making any investment decision. 

Great Lakes Dredge & Dock (GLDD) – Quarterly Call Will Reinforce January NobleCon17 Appearance

Tuesday, February 16, 2021

Great Lakes Dredge & Dock (GLDD)
Quarterly Call Will Reinforce January NobleCon17 Appearance

Great Lakes Dredge & Dock Corp is a provider of dredging services in the United States. The company only’s operating segments is Dredging. Dredging involves the enhancement or preservation of navigability of waterways or the protection of shorelines through the removal or replenishment of soil, sand or rock. Its projects portfolio includes Coastal Restoration, Coastal Protection, Port expansion, and others.

Poe Fratt, Senior Research Analyst, Noble Capital Markets, Inc.

Refer to the full report for the price target, fundamental analysis, and rating.

    4Q2020 Results out tomorrow morning and call at 10am EST. Number is 877-377-7553 and ID is 4967097. Our 4Q2020 EBITDA estimate is $33.5 million with gross margin of 21.0%. We will be looking for color in the following areas: 2021 bid market outlook; Tone of bidding activity and visibility of projects; Impact of competition; Margin direction; Update on newbuild Hopper Barge One; Timing of FID and capex on newbuild Hopper Barge Two; Timing of FID and capex on newbuild rock dumper barge; Progress completing $75 million buyback program; Refinancing plan with bonds callable at par in May; and Timing and cost of corporate relocation to Houston.

    Quarter call should reinforce positive outlook offered in NobleCon17 presentation in January.  CEO Lasse Petterson and CFO Mark Marinko offered a solid case for GLDD in a presentation in late January. Go to Channelchek: https://www.channelchek.com/news-channel/NobleCon17_Rebroadcast for replay info …


This Company Sponsored Research is provided by Noble Capital Markets, Inc., a FINRA and S.E.C. registered broker-dealer (B/D).

*Analyst certification and important disclosures included in the full report. NOTE: investment decisions should not be based upon the content of this research summary.  Proper due diligence is required before making any investment decision. 

Ely Gold Royalties (ELYGF)(ELY:CA) – Ely Gold Reveals Rare Earths Potential of its El Campo Property in California

Tuesday, February 16, 2021

Ely Gold Royalties (ELYGF)(ELY:CA)
Ely Gold Reveals Rare Earths Potential of its El Campo Property in California

As of April 24, 2020, Noble Capital Markets research on Ely Gold Royalties is published under ticker symbols (ELYGF and ELY:CA). The price target is in USD and based on ticker symbol ELYGF. Research reports dated prior to April 24, 2020 may not follow these guidelines and could account for a variance in the price target. Ely Gold Royalties Inc is an emerging royalty company with producing and development assets focused in Nevada and the Western US. It offers shareholders a low-risk leverage to the current price of gold and low-cost access to long-term gold royalties.

Mark Reichman, Senior Research Analyst of Natural Resources, Noble Capital Markets, Inc.

Refer to the full report for the price target, fundamental analysis, and rating.

    Rare earths at El Campo. Ely Gold Royalties announced that nine assayed samples at its El Campo property in San Bernardino County, California returned up to 8.60% total rare earth oxides, including Cerium (Ce), Lanthanum (La), Samarium (Sm), and high value magnet metals Neodymium (Nd) and Praseodymium (Pr) which are used in electric vehicles and wind turbines. All nine of the samples returned rare earth oxide values of 4% or greater.

    Available for sale.  The El Campo property, which Ely Gold acquired through staking, encompasses five contiguous unpatented mining claims that are adjacent to mining claims held by MP Materials (NYSE: MP, Not Rated), the largest producer of rare earth materials in the United States, that encompass the Mountain Pass Mine. El Campo is currently in Ely Gold Royalties’ “Available for Sale” portfolio and …


This Company Sponsored Research is provided by Noble Capital Markets, Inc., a FINRA and S.E.C. registered broker-dealer (B/D).

*Analyst certification and important disclosures included in the full report. NOTE: investment decisions should not be based upon the content of this research summary.  Proper due diligence is required before making any investment decision. 

How did the Stock Market Perform Under Each President?


The Stock Market Measured in Four-Year Presidential Terms


The Presidents that President’s Day honors can all be said to have sacrificed quite a bit to serve their country. The role for most would be the epitome of a stressful job. Over time history judges them on their many accomplishments and becomes more tolerant of what was perceived as failings. Part of this Presidential history and measure of success are the statistics compiled during their time in office. Statistics are not necessarily the fairest measure of success with economic growth, the pressure to go to war, civil unrest, and all the other issues they are confronted with. After all, their office is only fractionally in control of anything. Still, there is some meaning in the data. Studying stock market history can better help us recognize trends should they begin to recur. With this in mind, let us look back at the citizens that we chose to sit in the oval office and review the returns of the S&P 500 under their watch.

The S&P 500 began providing measurements to the public back in 1957, with data provided back to earlier in the decade. So our review begins in 1953, on the day President Eisenhower was inaugurated.


President Eisenhower (Ike) Served as President for two terms; during the first four-year term, investors saw the market shoot up by 70.7%. During the second term, investors were treated to an increase of 34.4%. This growth masks the three recessions Eisenhower faced during his two terms in office. The recessions of 1953 and 1958 were in large part tied to more restrictive monetary policy from the Federal Reserve, while another recession began in 1960 after the Fed had doubled interest rates over two years.


President Kennedy (Jack)   Inaugurated in 1961 and assassinated in November of 1963; the combined return during his time in office and Vice President Johnson’s completion of the second term was a 44.3% increase. Kennedy ran on the slogans “Getting America Moving Again” and “A Time For Greatness.” However, the economy remained sluggish, and unemployment remained high at 6.8% when he took office. The only bear market under his term is said to have been triggered by his doing battle with U.S. Steel over prices. Wall Street rarely approves of the government dictating what private companies can do.


President Johnson (LBJ) was sworn in following Kennedy’s assassination. During his reelection term, the country enjoyed a rise in the S&P 500 of 17.4%. When LBJ took office, he quickly passed tax cuts proposed by Kennedy.   There was a lot of speculation and probably overvaluation during his term.  Johnson held a “guns and butter” policy that held the notion the taxpayer could pay for both the Vietnam War, along with “Great Society” social programs.  


President Nixon (Dick) was in the oval office as the country experienced 16.8% growth during his first four years. He was reelected but resigned two and a half years into his second term.  Nixon remains one of the most “progressive” Presidents in U.S. history based on the use of government directly controlling business.  The economy experienced high unemployment and a high inflation rate (stagflation) along with sluggish growth during the ’70s. Because of this, in 1970, Nixon took the unusual step of using an executive order and imposed a freeze on wages and prices with hopes that declaring increasing prices illegal would help. A year later, he protected the faltering dollar’s value by taking the currency off the gold standard. The short-term result of the economic meddling was a stock market crash that halved the value of the S&P 500 between January 1973 and October 1974.


President Ford (Gerry) presided over the last two years of Nixon’s second term. He inherited many of the economic problems started by LBJ and compounded by Nixon’s actions. Stagflation continued, but the stock market began trending up again in 1975.


President Carter (Jimmy) The ‘70s were not a good time economically. Although the market rose 27.9%, The Feds easy money policies used to aid high employment resulted in skyrocketing prices. Under Carter, the country was handed the painful “medicine” it needed to regain health. The Fed tightened monetary policy and pushed interest rates all the way up to 20%. Interest-sensitive sectors saw sales plummet.  Industries, such as housing and cars, were crippled by the increase in interest rates to double-digits. However, the circumstance halted any pricing power (inflation). These steps helped lead to Carter’s failed reelection bid while also setting the stage for some of the better economic times during the next decade.


President Reagan (The Gipper) The first years of the new decade produced one of the longest recessions in the post-war period; that downturn served to break the vicious cycle of inflation. The U.S. came out of recession in November of 1982. Weary businesses then expected inflation to return, the steady hand of the Fed helped keep those risks at bay. Reagan, who had majored in economics, took the policy reins and implemented his version of supply-side economics (the theory that growth can be created by reduced taxes minimum lower regulations). During Reagan’s first term stocks moved up 30.1 % and continued another 67.3% during his second. The stage was set for the U.S. to lead economically for years to follow.


President Bush (Poppy) The Fed continued to have moderate growth and tame inflation as its goal and target. If given a choice of one over the other, keeping inflation down was their priority. Although the stock market rose 51.2% during Bush’s four years, the Fed had been applying the economic brake pedal by raising rates to counter inflation. The economy responded by slowing toward the end of Bush’s term.


President Clinton (Bubba) stepped in as positive economic conditions all converged. The markets rose 79.2% during his first term and 72.9% during his second four years. Inflation fell to less than 3%, and the U.S. experienced the first decade-long expansion in history. The peacetime economy freed up some of the brightest minds that might otherwise have found employment designing weaponry. Instead, they graduated college and created technology benefitting the masses and fostering productivity. These tech companies and the potential they held led the stock market to a record high. Fed Chairman Alan Greenspan dubbed the period of high growth and low inflation the “Goldilocks Economy” suggesting that it was a fairy tale existence. He also warned of “irrational exuberance.”


President Bush (Dubya) is the only President since 1953 to have a four-year term with a negative stock market return. He had two of them. Stocks fell 12.5% during his first term and 13.5% during his second. A speculative bubble had formed around tech and dot-com companies during the ‘90s which unwound during his time in office. Toward the end of Bush’s second term, with interest rates above 5%, the Fed began slashing rates dramatically. The low rates set the stage for a housing bubble.


President Obama (Barry) the great recession which began in the financial sector under Bush had already had the “kitchen sink” thrown at it in terms of stimulus characterized by massive monetary injections and unprecedented corporate bailouts.  The Fed kept its foot on the gas pedal, this caused U.S. debt levels to increase a massive $8.6 trillion. The lengthy debt-fueled expansion under Obama’s two terms also saw a surge in technological innovation, earnings, and extremely low-interest rates that left many investors no choice but to put their savings in the rising equities markets.


President Trump (The Donald)  The United States was already eight years into the longest economic recovery in history when President Trump was elected. The market jumped immediately after he won the 2016 election.  From the time he was inaugurated as the 45th President, it climbed another 67.4% (four years). Trump’s policies incentivized companies to repatriate back to the U.S. over one trillion in profits they were sheltering overseas from high U.S. taxes. Lower corporate taxes and more investible cash on U.S. soil pushed profits higher as the economy experienced some of its strongest numbers recorded. During the last year of his term, there was an intentional reduction in commerce as a reaction to a pandemic seeking to reduce the risk of workers infecting each other. Easy money and confidence in the future still provided for a double-digit year despite the pandemic.


Take-Away

The factors that move stocks within any period are many. They include; available financial capital, human capital, the global economic pace, taxes, natural disasters, war, national confidence, and prior economic momentum. The person sitting in the oval office can only influence a few of these. Often, that influence has a lag effect that has more impact years down the line. The above timeline includes over 70 years; with it, one can see how the policies of one presidency impacted the next. However, there is rarely a straight line of policy and result. Attributing one administration’s S&P 500 return to a prior administration is made even more cloudy by the market’s tendency to be forward-looking. The Federal Reserve Bank’s job is to maintain a sound banking system. The Fed reports to Congress and may have an agenda that conflicts with the executive branch in D.C..  The two could actually undermine the other. There are also immeasurables with great impact; these include trust. The forward-looking market doesn’t do well if it doesn’t trust that governmental policy won’t make unexpected changes that impact business and clouds investors ’ already faulty crystal ball. 

Paul Hoffman

Managing Editor, Channelchek


Suggested Reading:

The Limits of Government Tinkering

Workcations Add a New Class of  Traveler

Corporate Americas Fair Share of Taxes


Stay up to date. Follow us:


E.W. Scripps Company (SSP) – Insights On the Upcoming Quarter Raising Price Target

Friday, February 12, 2021

E.W. Scripps Company (SSP)
Insights On the Upcoming Quarter; Raising Price Target

The E.W. Scripps Co. (www.scripps.com) serves audiences and businesses through a growing portfolio of television, print and digital media brands. After approval of its acquisition of two Granite Broadcasting stations later this year, Scripps will own 21 local television stations as well as daily newspapers in 13 markets across the United States. It also runs an expanding collection of local and national digital journalism and information businesses including digital video news service Newsy. Scripps also produces television programming, runs an award-winning investigative reporting newsroom in Washington, D.C., and serves as the longtime steward of one of the nation’s largest, most successful and longest-running educational programs, Scripps National Spelling Bee. Founded in 1879, Scripps is focused on the stories of tomorrow.

Michael Kupinski, Director of Research, Noble Capital Markets, Inc.

Refer to the full report for the price target, fundamental analysis, and rating.

    Highlights from NobleCon 17.  Jason Combs, VP, Planning, Budgeting & Forecasting, and Carolyn Pione Micheli, VP, Communications & Investor Relations, provide current advertising insights at Noble’s 17th annual equity conference. A replay of the presentation and Q&A may be obtain by clicking here. Based on the presentation and Q&A, we have increased our Q4 revenue and cash flow estimates.

    Exceeds original Q4 guidance.  Management indicated that Q4 core advertising is better than its November guidance in both core advertising and in its National Media segment. Local core is better than its guidance of down mid teens and National Media exceeded its guidance of low double digit revenue growth. Revenue momentum continues into the first quarter …


This research is provided by Noble Capital Markets, Inc., a FINRA and S.E.C. registered broker-dealer (B/D).

*Analyst certification and important disclosures included in the full report. NOTE: investment decisions should not be based upon the content of this research summary.  Proper due diligence is required before making any investment decision. 

Eagle Bulk Shipping (EGLE) – Fleet Renewal Program Twists Toward Growth

Friday, February 12, 2021

Eagle Bulk Shipping (EGLE)
Fleet Renewal Program Twists Toward Growth

Eagle Bulk Shipping Inc. is a US-based drybulk owner-operator focused on the Supramax/Ultramax mid-size asset class, which ranges from 50,000 and 65,000 deadweight tons in size; these vessels are equipped with onboard cranes allowing for the self-loading and unloading of cargoes, a feature which distinguishes them from the larger classes of drybulk vessels and provides for greatly enhanced flexibility and versatility- both with respect to cargo diversity and port accessibility. The Company transports a broad range of major and minor bulk cargoes around the world, including coal, grain, ore, pet coke, cement, and fertilizer. Eagle operates out of three offices, Stamford (headquarters), Singapore, and Hamburg, and performs all aspects of vessel management in-house including: commercial, operational, technical, and strategic.

Poe Fratt, Senior Research Analyst, Noble Capital Markets, Inc.

Refer to the full report for the price target, fundamental analysis, and rating.

    Fleet renewal program takes a twist. Three 2011-built Supramaxes will be acquired for ~$30 million. This move represents a shift to growth after the sales of five older Supramaxes (average age of 18 years) since mid-2020. There is a neutral impact on the age profile and fuel consumption. The pro forma fleet will total 52 vessels with an average age below nine years.

    Thesis intact.  While the past two years were negatively impacted by extreme factors, the supply/demand fundamentals appear favorable and the year has started on a better-than-expected note. The order book and supply growth remain historically low due to rate volatility, regulatory uncertainty and declining capital availability, while demand should rebound on the back of global stimulus packages and …


This research is provided by Noble Capital Markets, Inc., a FINRA and S.E.C. registered broker-dealer (B/D).

*Analyst certification and important disclosures included in the full report. NOTE: investment decisions should not be based upon the content of this research summary.  Proper due diligence is required before making any investment decision.