Will the US Continue to Subsidize Renewable Energy Projects?


Renewable Projects Surge Following Subsidy Extension


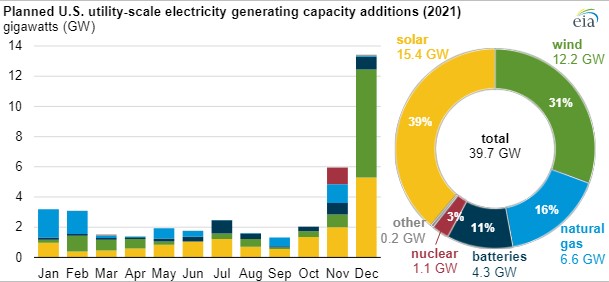
Every month, the U.S. Energy Information Administration (EIA) surveys electric utilities to monitor planned generation projects. Over the last two months, there has been a surge in generation project announcements, with most of the projects being renewable energy. It is not unusual to see an uptick in the announcement of renewable projects at year-end, and the graph below had a similar look to the one twelve months ago. The year-end increase may represent management’s window dressing their generation plans. It is worth noting, however, that the announcements were accompanied by a renewal of tax subsidiaries for both wind and solar power last month. Wind production tax credits (PTCs) were extended twelve months for projects where construction has begun by December 31, 2021, and a new 30% investment tax credit has been created for offshore wind projects that start construction through 2025. A two-year extension for solar power PTCs was also passed at the same time. The shift towards renewable generation projects may also reflect rising natural gas and oil prices in recent months making traditional fossil fuel plant investments less attractive.


Renewable generation is growing in importance

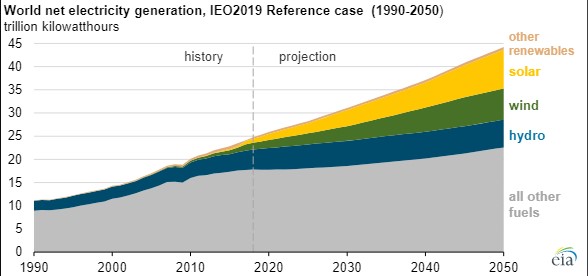
Renewable generation represents only 11% of the nation’s generation load. However, that percent is growing rapidly, with renewable generation accounting for 70% of all new generation. The EIA projects that renewable energy will double to 22% of generation by 2030 and represent half of the nation’s generation load by 2050. The growth of renewable generations comes despite an expected sunsetting of subsidies.


Renewable generation costs are declining rapidly and are competitive without subsidies

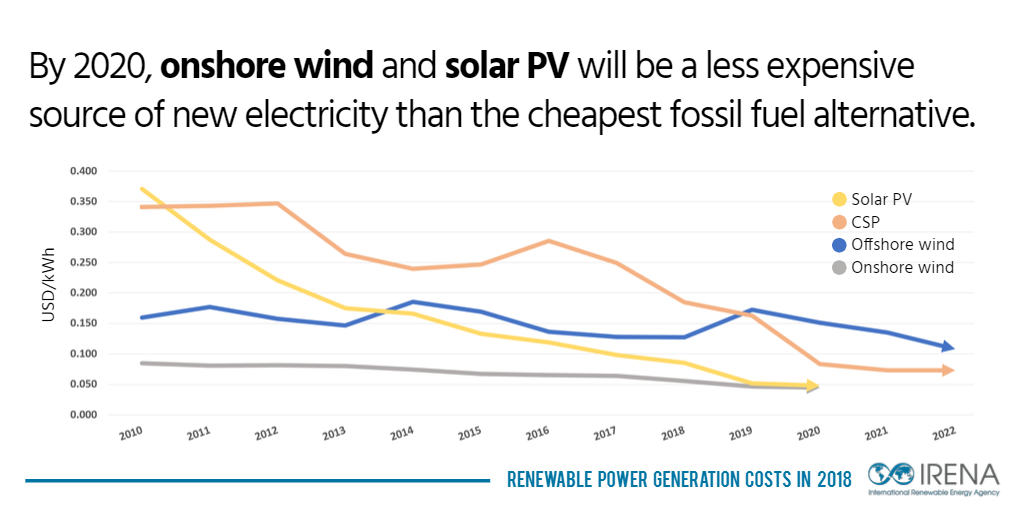
The shift towards renewable generation follows a trend that we have seen in recent years as renewable generation costs declined. The International Renewable Energy Agency (IRENA) notes that solar photovoltaic prices have fallen 82% since 2010, while concentrated solar power has dropped 47%. Wind power costs have also decreased, albeit not as much.  Onshore wind costs have fallen 39%, while offshore wind costs have fallen 29%. The cost declines mean that wind and solar power have become a cheaper form of power generation than traditional fossil fuels.


Take-Away:

A debate regarding the government’s role in subsidizing production is a subject that can be debated. However, it is beyond the scope of this report. However, the result is the same – the subsidies given to renewable energy have allowed them to achieve the economies of scale needed to compete with fossil fuels. This will be true even if subsidies are removed.


Suggested Reading:

Energy 2020-4Q Review and Outlook -Dtd January 5, 2021

Is the Price for Uranium Rising?

Mergers Within the energy Industry are Heating Up


Sources:

https://www.greentechmedia.com/articles/read/solar-and-wind-tax-credit-extensions-energy-rd-package-in-spending-bill-before-congress#:~:text=The%20U.S.%20Congress%20on%20Monday,through%202025%20for%20offshore%20wind, Jeff St. John, GTM, December 22, 2020

https://www.windpowerengineering.com/ptc-extended-by-one-year-new-offshore-wind-tax-credit-inserted-in-congress-bill/#:~:text=The%20wind%20production%20tax%20credit,of%20its%20investment%20tax%20credit., WPED Staff, WPED, December 22, 2020

https://www.irena.org/newsroom/pressreleases/2019/May/Falling-Renewable-Power-Costs-Open-Door-to-Greater-Climate-Ambition, International Renewable Energy Agency, May 29, 2019


Release – Prophase Labs (PRPH) – To Present at the NobleCon17 Annual Small and Microcap Investor Conference


ProPhase Labs to Present at the NobleCon17 Annual Small & Microcap Investor Conference on Tuesday, January 19, 2021 at 12:45 p.m. Eastern Time


Company Exceeding Near Term Goals & Expands 2021 Testing Capacity
Surpasses Targeted $30 Net Profit Margin Per COVID-19 Test

GARDEN CITY, NY, January 11, 2021 — ProPhase Labs, Inc. (NASDAQ: PRPH) (“ProPhase Labs”), a diversified medical science and technology company, today announced that management will present at the NobleCon17 Annual Small & Microcap Investor Conference taking place January 19th – 20th, 2021.

ProPhase Labs CEO Ted Karkus is scheduled to host a virtual presentation during the conference and will also participate in one-on-one meetings throughout the day. Management will highlight its newly formed subsidiary, ProPhase Diagnostics, which operates a Clinical Laboratory Improvement Amendments (“CLIA”) accredited laboratory in Old Bridge, New Jersey, and recently entered into a lease for a new 25,000 square foot COVID-19 testing facility in Garden City, New York.

Ted Karkus, CEO of ProPhase Labs, stated: “I am excited to report new testing metrics at NobleCon17 with our anticipated launch of additional COVID-19 testing services from our newly acquired lab in Garden City, New York later this month. Interest and demand for our lab processing services has been high, motivating us to build our second lab with capacity to be able to process up to 50,000 COVID-19 tests per day by next month. This capacity is in addition to our successful ramp up of our first lab in New Jersey. We look forward to sharing more on our developing story during our formal presentation and with new investors throughout the conference,” concluded Karkus.

NobleCon17 Annual Small & Microcap Investor Conference

Date: Tuesday, January 19, 2021
Time: 12:45 p.m. EST, 9:45 a.m. PST
Webcast: https://www.nobleconference.com/register/investor-guest – Track 1
Replay: https://noble.mediasite.com/Mediasite/Play/0ea17b2d55f043578d885999a363abf21d – Track 1
Location: Virtual


A replay of the webcast will be available at the replay link above approximately 24 hours following the live presentation and will also be available in the company’s new investor relations section here.

For more information or to schedule a one-on-one meeting with ProPhase Labs management, please contact your conference representative or you may also email your request to PRPH@mzgroup.us or call Chris Tyson at (949) 491-8235.

About Noble Capital Markets, Inc.

Noble Capital Markets (“Noble”) is a research driven boutique investment bank that has supported small & microcap companies since 1984. As a FINRA and SEC licensed and registered broker-dealer Noble provides institutional-quality equity research, merchant and investment banking, wealth management and order execution services. In 2005, Noble established NobleCon, an investor conference that has grown substantially over the last decade+. In 2018 Noble launched channelchek.vercel.app – an investment community dedicated exclusively to small and micro-cap companies and their industries. Channelchek is tailored to meet the needs of self-directed investors and financial professionals and is the first service to offer institutional-quality research to the public, for FREE at every level without a subscription. More than 6,000 emerging growth companies are listed on the site, with growing content including webcasts, industry sector reports, advanced market data and balanced news.

About ProPhase Labs

ProPhase Labs (NASDAQ: PRPH) is a diversified medical science and technology company with deep experience with OTC consumer healthcare products and dietary supplements. Its dietary supplement line of products, TK Supplements, has extensive distribution in major FDM (Food, Drug and Mass) retailers including Walmart, Walgreens, CVS and RITE-AID. The Company’s recently formed wholly-owned subsidiary, ProPhase Diagnostics, Inc., is a rapidly developing CLIA laboratory business that offers COVID-19 and other Respiratory Pathogen Panel (RPP) testing services. ProPhase Labs is dedicated to creating sustainable value for shareholders over the long-term through growth of its existing businesses. It is also continuing to explore strategic investments and additional acquisition opportunities. For more information visit us at www.ProPhaselabs.com.

Investor Contact:
Chris Tyson
Managing Director
MZ Group – MZ North America
949-491-8235

PRPH@mzgroup.us
www.mzgroup.us

Source: ProPhase Labs, Inc.

Onconova Therapeutics (ONTX) Scheduled To Present at NobleCon17


Join Onconova Therapeutics (ONTX) CEO Steven Fruchtman at NobleCon17 – Noble Capital Markets 17th Annual Small & Microcap Investor Conference – January 19&20, 2021. Following a formal presentation, a seasoned Wall Street research analyst will join Steven to moderate a LIVE Q&A session. If you want to be added to the roster of presenters… or if you would like to join the virtual audience of investors, at no cost, go to nobleconference.com.

NobleCon 17 Complete Presenting Company Schedule

Industry Report – Digital, Media and Entertainment Industry – Are We There Yet?

Tuesday, January 12, 2020

Digital, Media & Entertainment Industry Report
Are We There Yet?

Michael Kupinski, DOR, Senior Research Analyst, Noble Capital Markets, Inc.

Refer to end of report for Analyst Certification & Disclosures

Overview. Optimism grows as core advertising, which excludes Political advertising, seems stronger than what many analysts anticipated for the fourth quarter. We believe that analysts are getting ahead of their skis. 2021 will be a long and somewhat bumpy ride. In our view, there is a lot of noise around core advertising given the unprecedented amount of Political advertising. As such, we are not as sanguine as many about the advertising recovery. In our view, core advertising is not expected to recover to 2019 levels until 2022.

Television: Did the M&A market open earlier than expected? We believe that the TV stocks will be buoyed by the M&A market. But, we anticipate that 2021 will be bumpy. As the year 2021 closes, investors likely will focus on 2022 and the prospect of another banner Political year. Our favorite picks for 2021 focuses on two companies that have the financial flexibility to pursue acquisition fueled growth.

Radio: Why this is among our favorite sectors for 2021? Based on our estimates, the industry appears poised to outperform revenue growth across most media sectors in 2021. Furthermore, the average Radio stock is trading at roughly 9 times enterprise value to depressed 2021 cash flow estimates. While the multiple may appear high based on most recent trading multiples over the past five years (excluding 2020), the valuations appear to be compelling considering the strong double digit cash flow growth that is expected in an advertising recovery.

Publishing: Will there be fewer public publishers? Publishing stocks increased a strong 42.3% in the fourth quarter, outperforming the general market The takeover offer for Tribune came in on New Year’s Eve and, as such, the recent rise in the stock price was not reflective in the Q4 performance for the group.

Digital: The Pandemic had a varying impact. Surprising was the rapidity with which Digital advertising declined in 2Q and how quickly it recovered in 3Q (and into 4Q). In addition, there was a notable acceleration in the move toward ecommerce. We highlight one of our favorites, 1800FLOWERS.com. In addition, the esports industry went mainstream as broadcast networks sought content. We highlight one of recent recommendations, eSports Entertainment.

Overview

Are We There Yet?

Most investors are happy to see 2020 in the rearview mirror. The pandemic hit the industry hard, both in terms of fundamentals and stock prices. In terms of fundamentals, the media industry performed slightly better in the second half than the dire predictions made in the midst of the pandemic. Revenues rebounded from the disastrous second quarter, fueled by record breaking Political advertising. Many companies raised revenue and cash flow guidance in the third and fourth quarters due to the heavy Political advertising spend. But, even factoring out the huge influx of Political, advertising trends seemed to have improved. We caution investors, however, not to get over their skis on optimism. Political advertising, especially the level at which Political came in, created a substantial amount of noise around core advertising. The perceived momentum currently may not be as robust into 2021. The general economy is still reeling from store and restaurant closures and other restrictions. While a vaccine offers hope that there will be a return to “normalcy”, we remain cautious about the issues that will need to be addressed post pandemic. As such, investors who are optimistic that 2021 advertising returns to 2019 levels, may be like children on a long road trip asking “are we there yet?”

For instance, there appears to be a large number of potential bank foreclosures and forced evictions as Covid restrictions on evictions are relaxed. In addition, there appears to be little Congressional interest in additional financial support to families. This could disrupt consumer behavior in coming months. Furthermore, while everyone is hopeful of returning to 2019 revenue levels, we believe that a large number of businesses are not likely to return quickly and many may be permanently closed. Finally, there is a looming issue of what the government will do to help pay for the increased Pandemic-related expenses, implying tax hikes may be coming. There is a 96% correlation to advertising and discretionary spending. As such, tax hikes could potentially cut into consumer’s appetite to spend and, subsequently, advertising. While we anticipate continued improved revenue trends, we are not as sanguine about the advertising recovery in 2021, which we discuss later in this report.

On the stock front, for investors that were fortunate enough to buy media stocks during the midst of the pandemic, the returns were very strong. In the fourth quarter, particularly, media stocks increased on average 40%. Even with the strong performance in the second half of the year, most media stocks did not overcome the shortfall earlier in the year as Figure #1 illustrates. For the most part, media stocks are down modestly in the single digit percentages for the year, except for the Radio industry. There, despite the 33.5% increase in stock prices for the fourth quarter, the Radio stocks are still down a whopping 37%. Within the traditional media sectors, the publishing stocks performed the best, up nearly 34% for the year. This group benefited from the larger cap stocks in the industry, New York Times and News Corp. Both benefited from strong digital audience growth and digital revenue growth. 

As we look forward toward 2021, Radio stocks appear to offer the best value and the most upside appreciation potential, assuming a continued advertising recovery. But, this industry is not without risks. Many of the Radio companies have heavy debt burdens, which may be tricky if the advertising recovery does not continue. For investors looking for a balance of leveraged returns in a return toward “normalcy”, our favorites are Gray Television, Entravision, and Travelzoo. For more risk tolerant investors, we encourage investors to take a look at eSports Entertainment, one of the few compelling growth segments of the media industry, focused on the gaming space.

Figure #1


Television Broadcast

Will M&A Buoy The Group In 2021? 

The fundamentals of the television industry substantially improved in the fourth quarter, fueled by an extraordinary and unprecedented influx of Political advertising. Many companies raised Q4 guidance to reflect the strong Political advertising. To put the Political advertising numbers into perspective, for most broadcasters, Political advertising accounted for nearly 30% of total Q4 broadcast revenues. Comparatively, in 2016, Political advertising accounted for roughly 11% of total Q4 broadcast revenue. What makes the numbers so extraordinary is that Retransmission revenues in Q4 2016 were roughly 25% of total broadcast revenues and in Q4 2020 represented about 32%. In total, Political and Retransmission revenue accounted for roughly 62% of total television broadcast revenue. Cash flow margins, as measured by adjusted EBITDA, is expected to average in the high 30s percent range. The robust margins are expected to reflect the high margin Political advertising and the significant cost reduction efforts by companies striving to maintain cash flow during the Pandemic.  

Some investors and analysts appear to be sanguine about the outlook for the TV fundamentals heading into 2021. We are not as optimistic. Some analysts point to the relatively healthy advertising environment, excluding Political. Given the large influx of Political, we believe that there is a lot of noise in the those core advertising numbers. We believe that key advertising categories, such as Auto, appear to be recovering nicely, with some broadcasters indicating that it was down a modest 3% to 8% in the fourth quarter. To put this into perspective, Auto was down as much as 75% in the second quarter. But, some large local advertising categories, such as restaurants, travel, and retail will take longer to return to 2019 levels, in our view. In addition, as we look forward toward the first quarter 2021, there will be some tough year earlier comps from the large influx of Political advertising from the Democratic primaries. Recall the unprecedented amount the Michael Bloomberg spent on the primaries? In January 2020, it was reported that he spent $300 million and $500 million in February. 

Q1 and full year 2021 outlook

Consensus revenue estimates for the first quarter anticipate TV industry revenues falling 3.6% on average, which we believe to be optimistic. In our view, the estimates do not appear to fully reflect the absence of Political advertising, nor the lingering local economic impact from the pandemic. Our revenue estimate anticipates that the average TV company will report revenue declines in the range of 9.2%. The second quarter should reflect much stronger revenue trends given the easy comparable a year earlier, the midst of the economic shutdowns from the Covid pandemic. While we anticipate strong second quarter revenue, we do not believe that the recovering core advertising trends will be enough to offset the absence of Political advertising. As such, we anticipate that full year television advertising revenue on average will decline 7.3%. Our estimate is below that of consensus estimates that anticipate modest full year 2021 revenue decline on average 1%.

The deal market opens. 

While television fundamentals appear to be still affected by the economic fallout from the Covid pandemic, the deal activity in the industry has picked up. This follows the surprising offer from E.W. Scripps to buy Ion Media on September 24. Ion Media was on the market prior to the development of the Covid pandemic early in 2020, but was pulled when economies were closed and Covid mitigation efforts unfolded. Scripps made a gutsy move to buy Ion in the midst of the pandemic and in spite of the lack of visibility on the economic and advertising recovery. More recently, the M&A environment seems to remain healthy given that Quincy Broadcasting and Meredith announced plans to sell TV stations. Investors turn their attention to the likely buyers, Gray Television and private equity firm, Apollo Capital. In our view, the sale of television stations will support public market valuations in the TV group.

Where do TV stocks go from here?

The Television stocks outperformed the general market in the fourth quarter with the Noble TV index up 39%, significantly outpacing that of the general market, as measured by the S&P 500 Index, up 10.8%. Unfortunately, the strong year end performance did not offset the weak performance earlier in the year. For the year, TV stocks are down 8.7% versus a 15.4% gain for the general market. The only stock that outperformed the group in both the fourth quarter and full year performance was Entravision. The EVC shares were up a significant 82.9% in the fourth quarter and 6.1% for the full year. 

Despite challenges with the anticipated pace of the advertising recovery and the tough year earlier comparisons, we remain constructive on the television stocks. We believe that the TV stocks will be buoyed by the M&A market. But, we anticipate that 2021 will be bumpy. As the year 2021 closes, we believe that investors will once again focus on 2022 and the prospect of another banner Political year. The TV stocks typically do better the year prior to an election year, up an average 22%. Although, this was not the case in the last two elections. While many TV companies will focus on debt reduction given recent acquisitions, we believe that those with flexible balance sheets will turn toward M&A to enhance longer term growth potential. As Figure #2 illustrates, there are several companies with relatively low leverage, including Gray Television and Entravision that appear poised for accelerated growth through acquisitions. As such, our current favorites are Entravision and Gray Television.  


Figure #2 


Radio Broadcast 

Why this is one of our favorite sectors for 2021? 

Based on consensus estimates, fourth quarter revenues are expected to show substantial sequential quarterly improvement from the third quarter, down roughly 12% versus an average 22% decline in the third quarter. The improvement is expected to reflect a sizable boost from Political advertising, although Television gets the lion share of Political dollars. Broadcasters that have digital, podcasting, and diversified operations, likely will perform better than those industry averages. Digital, which for many radio broadcasters includes podcasting, appears to be growing revenues in the double digits. Overall, the industry revenue decline for 2020 is likely to be among the weakest in the media space. The stock prices likely reflect this reality (which is discussed later in this report). 

Looking forward toward 2021, Radio may have one of the best revenue recoveries in the media space. This is largely due to the fact that the industry does not have as difficult Political comps as others. Even though Political was at record levels for Radio in 2020, it still accounted for only 4% of total 2020 Radio revenues. While this is up from roughly 3% in the past, it is not a large nut to overcome given the prospects of a rebound in advertising. To put this into perspective, Political advertising for Television accounted for as much as 30% of total revenues. We do believe that consensus revenue estimates for 2021 may be a little high. The average consensus revenue growth is expected to be 13.5%, a revenue growth estimate that does not anticipate that the industry revenue in 2021 achieves that of 2019. Our 2021 Radio revenue estimate is 7.3%. Nonetheless, we believe that the revenue trends appear favorable.  But, revenue will be lumpy. The strongest revenue growth quarter will be the second quarter, which will be up against the easy comps from the year earlier depth of the pandemic. Q2 2020 revenues were down in the range of 55% to 65%. 

The improving revenue and, subsequently, cash flow trends will be a welcome relief to many Radio companies with stretched balance sheets. 2021 cash flow is expected to have strong double digit growth, in excess of 20%. As Figure #3 illustrates, the average debt to trailing cash flow for the industry is an historically high 11.1 times. Many companies managed through the pandemic either with government loans or concessions on debt covenants. Yet, there were some Radio companies that were able to manage through without tripping covenants. We believe that most companies will be able to quickly pare down debt and debt to cash flow levels will drop to be an average 6 times by the end of 2022. The industry has managed with the relatively high 6 times handle before. 

Will Radio stocks recover? 

As Figure #5 illustrates, the Radio stocks had a strong rebound in the fourth quarter, up 33.5%, as measured by the Noble Radio Index. But this strong performance was below that of many media sectors including TV, up 39%, and Publishing, up 42.3%. Nonetheless, some of the strongest performers in the industry in the fourth quarter were the larger radio groups including Cumulus Media, up 62.9%; iHeart Media, up 57.5%; and, Entercom, up 52.2%. Townsquare Media increased a strong 43.1%. These companies outperformed the Radio Index and many companies across the media spectrum. The remaining publicly traded stocks traded below the Noble Radio Index. 

As illustrated in our Radio comp table, the average Radio stock is trading at roughly 9 times enterprise value to depressed 2021 cash flow estimates. While the multiple may appear high based on most recent trading multiples over the past five years (excluding 2020), the valuations appear to be compelling considering the strong double digit cash flow growth that is expected in an advertising recovery. As such, the Radio stocks represent among our favorite sector for 2021. 


Figure #3


Publishing

Will there be fewer public Publishers?

The fundamentals of the Publishing industry varies by company and depends upon which side of the Digital divide the company is on. Some companies, like The New York Times, have transitioned well toward a Digital driven model. Nonetheless, the Publishing industry’s transition toward Digital accelerated during the Pandemic. Unique visitors and Digital subscriptions accelerated as travel-restricted consumers sought news and information about Covid and the Presidential elections. Despite the double digit revenue growth for Digital advertising and subscriptions for some Publishers, total revenues are expected to decline in the range of 20%. National publishers, however, may see modest single digit declines in revenues. 

Importantly, many in the industry are reengineering cost structures. While the Pandemic caught many media companies flatfooted without cost mitigation strategies to maintain cash flow, many Publishing companies simply accelerated cost reduction plans already in place. The Pandemic allowed many companies to reduce the office footprint or renegotiate office leases at much lower rates. As a result, many Publishers have actually exceeded cash flow expectations. Tribune Publishing is a good example of this. The company recently raised fourth quarter and full year 2021 cash flow guidance. As we look toward 2021, we anticipate that revenue trends will significantly moderate, especially since Digital revenues represent almost 50% of revenues for many Publishers. Cash flow for the industry should improve as cost mitigation efforts flow through to a full year of operations. 

Investors are focused on the recent offer by the Alden Group for the remaining 68% of the shares of Tribune Publishing that it does not own. The $14.25 per share offer follows the company’s closing on the sale of BestReviews, which bolstered the company’s already strong cash position. Based on our estimates, Tribune is expected to end 2020 with as much as $220 million in cash and virtually no debt. We wonder how serious the Alden Group is about acquiring Tribune. We believe that it is likely that independent board members will reject the low ball offer. The question will be whether the Alden Group will increase its offer to levels that reflect the intrinsic value of the company. Given that the company raised cash flow expectations, we have raised our price target to $20.75. In our view, a value representing a 10% to 15% discount to our price target would be a reasonable take-out valuation. 

The takeover offer for Tribune came in on New Year’s Eve and, as such, the recent rise in the stock price was not reflective in the Q4 performance for the group. Nonetheless, Publishing stocks increased a strong 42.3% in the fourth quarter, boosted by a 145.4% increase in the stock price of Gannett in the quarter. The GCI shares began the upward trend following the company’s 10Q filing on November 2, as investors concerns over the company’s high debt leverage were assuaged. In addition, the company significantly reduced headcount through a large employee buyout in November.  

As we look forward toward 2021, we view the shares of Tribune as among our favorite plays. In our view, the company has a large cash position to fund accretive acquisitions. We place the probability of the Alden Group raising its offer to a range we believe would be reasonable as low. The TPCO shares currently trade at less than 3 times Enterprise Value to cash flow, as measured by adjusted EBITDA. This valuation varies from the multiple listed in Figure #4, a valuation that reflects only EBITDA. We believe that the TPCO shares stand on its own with significant cash flow and a large cash position. 


 Figure #4

Figure #5 


Digital Media & Technology

Digital Advertising Recovers Quickly; Gaming and Podcast M&A Ramp Up

A year ago we wrote that over the previous decade online advertising as a share of all advertising had more than tripled to 50%, up from just 15% of advertising at the start of the decade.  Our expectation was that this trend would continue.  What we could not foresee then was that a global pandemic that would redefine how we went about our everyday life.  Businesses were required to close offices and shut down brick and mortar outlets and find ways to conduct business virtually.  The pandemic forced people to work from home and businesses to accelerate their digital transformation.  Ecommerce provided a much needed source of revenues to offset the loss of in-store sales, and, after a 2Q pause in online advertising, businesses increased their use of digital media to promote and drive traffic to their own ecommerce operations.   

If 2020 surprised us in two ways, it was 1) the rapidity with which advertising declined in 2Q, and 2) how quickly it recovered in 3Q (and into 4Q).  While traditional advertising mediums such as TV (-35%), radio (-48%), outdoor (-37%) and newspaper (-44%) advertising really struggled in 2Q 2020 (just after the pandemic started), online advertising (-3%) held up remarkably well.  Within online advertising, it was a bifurcated market:  Advertising revenues at Google (-8%) and Facebook’s (+11%) decreased by 2% on a combined basis while revenues from all other publicly traded online advertising companies decreased by a combined 16%.  Advertising results in 3Q were encouraging, particularly as those trends continued into 4Q.  At traditional media companies, revenues moderated substantially, while at online advertising companies, revenues returned to mid-teens growth (+13%).  Again, the online advertising marketplace was bifurcated, with online advertising at Google (+10%) and Facebook (+22%) growing a combined +14%, while online advertising from all others increased by 7%.  If there is a silver lining to the advertising struggles of 2020, it is that we foresee the “mother of all easy comparisons” in 2Q 2021 combined with the benefits of vaccine distribution which should enable the beginnings of an economic recovery. 

Two Trends to Watch in 2021:   Connected TV Advertising and Retail Media

The pandemic accelerated a number of technology trends, from the use of online groceries to the consumption of multiplatform gaming services to increased viewing on streaming services.  Viewing habits have been evolving for years, but online video platforms greatly benefited from work at home requirements. Over the last 4 years, nearly 19 million fewer homes now receive pay television services, according to Leichtmann Research Group, which tracks quarterly changes to subscriber counts.  The biggest declines have come from satellite TV providers (11.9 million fewer homes).  These declines have been offset somewhat by virtual MVPDs (multi-channel video providers) such as Hulu, Sling TV, and FuboTV. 

Connected TV (CTV): Forced to stay at home, consumers have migrated to subscription video on demand (SVOD) platforms such as Netflix and Disney+.  Fortunately for advertisers, advertising on demand (AVOD) services have also benefited from a migration of consumers to their platforms.  AVOD combines the premium viewing environment of television with data-driven targeting of online advertising.  AVOD service providers include TubiTV, PlutoTV, Vudu, Crackle, Peacock, as well as connected TV device makers such as Roku and Samsung.  AVOD doesn’t begin to replace linear TV viewing and advertising, but it acts as a strong complement by providing incremental reach as linear TV’s reach continues to erode. 

Connected TV (or CTV) advertising is relatively small, but its future is bright.  During its third quarter conference call, The Trade Desk (TTD) noted that “our CTV spend grew more than 100% year-over-year in the third quarter as advertisers follow consumers to streaming platforms.  eMarketer forecasts that connected TV advertising grew by 27% to $8.1 billion in 2020 and will grow by another 40% to $11.4 billion in 2021.  

Retail Media:  The pandemic related surge in ecommerce sales has also led to accelerated growth in retail media (also known as ecommerce channel advertising).  Retail media is display or search ads that appear on retailer platforms and direct users to products available for purchase there.  Amazon is the best situated company in this sector and is the main supplier of retailer media outside of China (where retailer media is already well established). 

Following in the footsteps of Amazon’s fast growing advertising business are retailers like Walmart, Target, eBay and Kroger, all of whom are looking outside their core business for growth and have found it in digital advertising.  Each of these companies has the requisite scale to compete for advertising dollars, as well as first-party customer data.  Most are now building the technology in-house to further expand profit margins in this sector.  Sponsored product advertising is the most prevalent form of retail media advertising, and it is estimated that Amazon has a 75% share of this market. 

eMarketer projects that marketers will spend $17.4 billion on advertising on ecommerce sites in 2020, a 38% increase over 2019.  While this type of advertising benefited from the pandemic, it is also being driven by the “cookie-less” online advertising future in which it becomes harder to track users.  Ecommerce sites have the advantage of first party shopping and intent data plus attribution capabilities for measurement and optimization.  Expect to hear more from this sector in the future.

Another Year of Strong Stock Price Returns in the Internet and Digital Media Sectors

Earlier we noted the upcoming easy comparisons in 2Q 2021, which could help explain why advertising related stocks continued to bounce back in the fourth quarter.  All three segments of Noble’s Internet and Digital Media sectors, where advertising is the primary revenue stream, performed well in 4Q 2020.  Noble’s Ad Tech (+63%) and Digital Media (+18%) significantly outperformed the S&P 500 (+12%), while Social Media (+9%) performed slightly below. Only the non-advertising related stocks, those in the MarTech space, underperformed (+0%). 

One of the companies that we follow,1800FLOWERS.com, significantly benefited from the surge in ecommerce and gifting in the midst of the pandemic. In its fiscal first quarter end September, revenues surged 51.6%. In our view, the spike in activity will be long lasting as it has significantly enhanced the company’s customer acquisition. The FLWS shares increased 5.6% in the fourth quarter, contributing to 12 month performance of an astonishing 84.5% gain. While revenue and earnings comparisons will be difficult against the Pandemic spurred growth, we believe that contributions from its recent acquisition of Personalizationmall.com will enhance the company’s long term growth. In addition, the strong fundamentals over the past several quarters have significantly improved its financial position, which should allow the company to make future revenue growth investments. We continue to view the FLWS shares among our favorites in the ecommerce space. 

On the opposite end of the spectrum, Travelzoo was negatively affected by the Pandemic and the subsequent travel restrictions. TZOO is a online media company that offers entertainment and travel deals. The company’s swift decision to focus on travel vouchers allowed it to significantly improve its financial position and avert a devastating travel marketplace. The vouchers allow the consumer to cancel or change travel plans without fees and were a big hit. As a result, the company’s cash position has surged and could be as much as $70 million, or nearly $5 per share, at year end December 2020. We believe that there is pent up demand for consumers to travel post Pandemic and Travelzoo appears well positioned to capitalize on that prospect. The TZOO shares are down modestly for the year. But, for investors fortunate enough to buy the shares during the depths of the travel restrictions in March 2020, the shares have nearly tripled from a low of $3.65. We view the TZOO shares as a compelling play on a return toward “normalcy” as the Covid vaccines open economies and travel restrictions are lessened. In addition, as Figure #6 illustrates, the company compares favorably on Enterprise Value to Revenue relative to its peers.

Yet another beneficiary of travel restrictions and stay at home mandates was the esports industry. The industry gained mainstream attention as traditional sports content was constrained during the economic shutdown. As such, broadcast networks turned toward esports to fill the programming void. Viewers of esports platforms tend to stay on the platform for longer periods than traditional sports or other computer applications making the sites ripe for advertising revenues. Furthermore, we believe that the esports will follow the trajectory of traditional sports into sports betting. The GMBL shares increased a strong 55% since our initiation on October 28th. The company recently made a series of acquisitions and announcements that strengthen its ability to be one of the leading companies in this space. As such, we view GMBL as among our favorites in 2021. 

Finally, one of our favorites for 2021 is a marketing services company, Harte Hanks (HRTH). The company is in a turnaround mode and should swing toward significant cash flow generation in 2021. As Figure #7 illustrates, the company compares favorably to its Marketing Services peer group on the basis of Enterprise Value to Revenues and EV to EBITDA. 


Figure #6


Figure #7


Companies mentioned in this report:

Harte Hanks (view report)

1800FLOWERS.COM (view report)

eSports Entertainment (view report)

Entravision Communications (view report)

The E.W. Scripps Company (view report)

Gray Television (view report)

Salem Media Group (view report)

Travelzoo (view report)

Tribune Publishing (view report

Cumulus Media (view report)

GENERAL DISCLAIMERS

All statements or opinions contained herein that include the words “we”, “us”, or “our” are solely the responsibility of Noble Capital Markets, Inc.(“Noble”) and do not necessarily reflect statements or opinions expressed by any person or party affiliated with the company mentioned in this report. Any opinions expressed herein are subject to change without notice. All information provided herein is based on public and non-public information believed to be accurate and reliable, but is not necessarily complete and cannot be guaranteed. No judgment is hereby expressed or should be implied as to the suitability of any security described herein for any specific investor or any specific investment portfolio. The decision to undertake any investment regarding the security mentioned herein should be made by each reader of this publication based on its own appraisal of the implications and risks of such decision.

This publication is intended for information purposes only and shall not constitute an offer to buy/sell or the solicitation of an offer to buy/sell any security mentioned in this report, nor shall there be any sale of the security herein in any state or domicile in which said offer, solicitation or sale would be unlawful prior to registration or qualification under the securities laws of any such state or domicile. This publication and all information, comments, statements or opinions contained or expressed herein are applicable only as of the date of this publication and subject to change without prior notice. Past performance is not indicative of future results. Noble accepts no liability for loss arising from the use of the material in this report, except that this exclusion of liability does not apply to the extent that such liability arises under specific statutes or regulations applicable to Noble. This report is not to be relied upon as a substitute for the exercising of independent judgement. Noble may have published, and may in the future publish, other research reports that are inconsistent with, and reach different conclusions from, the information provided in this report. Noble is under no obligation to bring to the attention of any recipient of this report, any past or future reports. Investors should only consider this report as single factor in making an investment decision.

IMPORTANT DISCLOSURES

This publication is confidential for the information of the addressee only and may not be reproduced in whole or in part, copies circulated, or discussed to another party, without the written consent of Noble Capital Markets, Inc. (“Noble”). Noble seeks to update its research as appropriate, but may be unable to do so based upon various regulatory constraints. Research reports are not published at regular intervals; publication times and dates are based upon the analyst’s judgement. Noble professionals including traders, salespeople and investment bankers may provide written or oral market commentary, or discuss trading strategies to Noble clients and the Noble proprietary trading desk that reflect opinions that are contrary to the opinions expressed in this research report.
The majority of companies that Noble follows are emerging growth companies. Securities in these companies involve a higher degree of risk and more volatility than the securities of more established companies. The securities discussed in Noble research reports may not be suitable for some investors and as such, investors must take extra care and make their own determination of the appropriateness of an investment based upon risk tolerance, investment objectives and financial status.

Company Specific Disclosures

The following disclosures relate to relationships between Noble and the company (the “Company”) covered by the Noble Research Division and referred to in this research report.
Noble is not a market maker in any of the companies mentioned in this report. Noble intends to seek compensation for investment banking services and non-investment banking services (securities and non-securities related) with any or all of the companies mentioned in this report within the next 3 months

ANALYST CREDENTIALS, PROFESSIONAL DESIGNATIONS, AND EXPERIENCE

Senior Equity Analyst focusing on Basic Materials & Mining. 20 years of experience in equity research. BA in Business Administration from Westminster College. MBA with a Finance concentration from the University of Missouri. MA in International Affairs from Washington University in St. Louis.
Named WSJ ‘Best on the Street’ Analyst and Forbes/StarMine’s “Best Brokerage Analyst.”
FINRA licenses 7, 24, 63, 87

WARNING

This report is intended to provide general securities advice, and does not purport to make any recommendation that any securities transaction is appropriate for any recipient particular investment objectives, financial situation or particular needs. Prior to making any investment decision, recipients should assess, or seek advice from their advisors, on whether any relevant part of this report is appropriate to their individual circumstances. If a recipient was referred to Noble Capital Markets, Inc. by an investment advisor, that advisor may receive a benefit in respect of
transactions effected on the recipients behalf, details of which will be available on request in regard to a transaction that involves a personalized securities recommendation. Additional risks associated with the security mentioned in this report that might impede achievement of the target can be found in its initial report issued by Noble Capital Markets, Inc.. This report may not be reproduced, distributed or published for any purpose unless authorized by Noble Capital Markets, Inc..

RESEARCH ANALYST CERTIFICATION

Independence Of View
All views expressed in this report accurately reflect my personal views about the subject securities or issuers.

Receipt of Compensation
No part of my compensation was, is, or will be directly or indirectly related to any specific recommendations or views expressed in the public
appearance and/or research report.

Ownership and Material Conflicts of Interest
Neither I nor anybody in my household has a financial interest in the securities of the subject company or any other company mentioned in this report.

NOBLE RATINGS DEFINITIONS % OF SECURITIES COVERED % IB CLIENTS
Outperform: potential return is >15% above the current price 78% 33%
Market Perform: potential return is -15% to 15% of the current price 5% 1%
Underperform: potential return is >15% below the current price 0% 0%

NOTE: On August 20, 2018, Noble Capital Markets, Inc. changed the terminology of its ratings (as shown above) from “Buy” to “Outperform”, from “Hold” to “Market Perform” and from “Sell” to “Underperform.” The percentage relationships, as compared to current price (definitions), have remained the same. Additional information is available upon request. Any recipient of this report that wishes further information regarding the subject company or the disclosure information mentioned herein, should contact Noble Capital Markets, Inc. by mail or phone.

Noble Capital Markets, Inc.
225 NE Mizner Blvd. Suite 150
Boca Raton, FL 33432
561-994-1191

Noble Capital Markets, Inc. is a FINRA (Financial Industry Regulatory Authority) registered broker/dealer.
Noble Capital Markets, Inc. is an MSRB (Municipal Securities Rulemaking Board) registered broker/dealer.
Member – SIPC (Securities Investor Protection Corporation)
Report ID: 11744

Endeavour Silver (EXK)(EDR:CA) – Increasing Estimates Based on Improved Mine Performance

Tuesday, January 12, 2021

Endeavour Silver (EXK)(EDR:CA)
Increasing Estimates Based on Improved Mine Performance

As of April 24, 2020, Noble Capital Markets research on Endeavour Silver is published under ticker symbols (EXK and EDR:CA). The price target is in USD and based on ticker symbol EXK. Research reports dated prior to April 24, 2020 may not follow these guidelines and could account for a variance in the price target.

Endeavour Silver Corp is a precious metal mining company. The company is primarily engaged in silver mining and owns three high-grade, underground, silver-gold mines in Mexico. Its other business activities include acquisition, exploration, development, extraction, processing, refining and reclamation. The company is organized into four operating mining segments, Guanacevi, Bolanitos, El Cubo, and El Compas, which are located in Mexico as well as Exploration and Corporate segments. Its Exploration segment consists of projects in the exploration and evaluation phases in Mexico and Chile.

Mark Reichman, Senior Research Analyst of Natural Resources, Noble Capital Markets, Inc.

Refer to the full report for the price target, fundamental analysis, and rating.

    EXK reports fourth quarter 2020 production results. Compared to the prior year period, fourth quarter silver and gold production increased 18.9% and 31.4% to 1,117,289 ounces and 12,586 ounces, respectively. Sequentially, fourth quarter silver and gold production increased 18.6% and 22.7%, respectively. On a full year basis, silver, and gold production in 2020 declined 12.6% and 4.5%, respectively, versus 2019.

    Updating estimates.  We are narrowing our 2020 loss estimate to $(0.07) from $(0.10) and increasing our 2021 EPS estimate to $0.20 from $0.16. The improvement in our estimates reflects operational improvements at Guanacevi and Bolanitos, partially offset by weaker performance at El Compas in the second half of the year …


This research is provided by Noble Capital Markets, Inc., a FINRA and S.E.C. registered broker-dealer (B/D).

*Analyst certification and important disclosures included in the full report. NOTE: investment decisions should not be based upon the content of this research summary.  Proper due diligence is required before making any investment decision. 

Information Services (III) – Raising PT As Share Price Continues Upward Trajectory

Tuesday, January 12, 2021

Information Services (III)
Raising PT As Share Price Continues Upward Trajectory

ISG (Information Services Group) (Nasdaq: III) is a leading global technology research and advisory firm. A trusted business partner to more than 700 clients, including more than 70 of the top 100 enterprises in the world, ISG is committed to helping corporations, public sector organizations, and service and technology providers achieve operational excellence and faster growth. The firm specializes in digital transformation services, including automation, cloud and data analytics; sourcing advisory; managed governance and risk services; network carrier services; strategy and operations design; change management; market intelligence and technology research and analysis. Founded in 2006, and based in Stamford, Conn., ISG employs more than 1,300 digital-ready professionals operating in more than 20 countries—a global team known for its innovative thinking, market influence, deep industry and technology expertise, and world-class research and analytical capabilities based on the industry’s most comprehensive marketplace data. For more information, visit www.isg-one.com

Joe Gomes, Senior Research Analyst, Noble Capital Markets, Inc.

Refer to the full report for the price target, fundamental analysis, and rating.

    Increasing PT. We are raising our 12-month price target on ISG shares. ISG shares have shown strong momentum since the beginning of November, nearly doubling in price. At our increased PT, ISG shares would trade at an EV/S multiple of 1.2x our projected 2021 revenues and 10.8x on an EV/EBITDA multiple on our 2021 EBITDA projection. These multiples remain at a discount to the peer group which trades at an EV/S multiple of 2.0x and an EV/EBITDA multiple of 14.2x based on consensus 2021 estimates.

    WFH Trends to Provide Boost.  The pandemic will end at some point, hopefully soon, but we anticipate a number of changes in how we work to stick, to varying degrees. We believe a number of these trends will favor the services offered by Information Services, which will bode well for the Company’s future operating results. Digital is the future and the best way to improve efficiency, reach customers …


This Company Sponsored Research is provided by Noble Capital Markets, Inc., a FINRA and S.E.C. registered broker-dealer (B/D).

*Analyst certification and important disclosures included in the full report. NOTE: investment decisions should not be based upon the content of this research summary.  Proper due diligence is required before making any investment decision. 

Sierra Metals (SMTS)(SMT:CA) – Sierra Metals Puts Itself in Play Updating Estimates

Tuesday, January 12, 2021

Sierra Metals (SMTS)(SMT:CA)
Sierra Metals Puts Itself in Play; Updating Estimates

As of April 24, 2020, Noble Capital Markets research on Sierra Metals is published under ticker symbols (SMTS and SMT:CA). The price target is in USD and based on ticker symbol SMTS. Research reports dated prior to April 24, 2020 may not follow these guidelines and could account for a variance in the price target.

Sierra Metals Inc is a precious and base metals producer in Latin America. The company acquires, explores, extracts, and produces mineral concentrates consisting of silver, copper, lead, zinc and gold in Mexico and Peru. Its activity includes the operation of the Yauricocha Mine in Peru, and the Bolivar and Cusi mines in Mexico. Yauricocha is an underground polymetallic mine using the sublevel block caving and cut-and-fill mining methods. Bolivar is a copper-silver-zinc-gold underground mine using room-and-pillar mining method. The majority of the revenue is earned by selling of the mineral concentrates to its customers in Peru.

Mark Reichman, Senior Research Analyst of Natural Resources, Noble Capital Markets, Inc.

Refer to the full report for the price target, fundamental analysis, and rating.

    Evaluating strategic alternatives. Sierra Metals Inc. announced that its Board of Directors has hired an investment bank to explore and evaluate potential strategic alternatives focused on maximizing shareholder value. These alternatives could include, among other things, the sale of part or all the company, a merger or other business combination, or other strategic transactions.

    Likely Outcomes.  In our view, the environment for mergers and acquisitions is favorable and we would not be surprised if the company has already been approached by potential suitors interested in the Cusi silver mine and/or a larger scale acquisition where a buyer would purchase the entire company and subsequently sell non-core assets. Under such a scenario, a large base-metals oriented producer …


This Company Sponsored Research is provided by Noble Capital Markets, Inc., a FINRA and S.E.C. registered broker-dealer (B/D).

*Analyst certification and important disclosures included in the full report. NOTE: investment decisions should not be based upon the content of this research summary.  Proper due diligence is required before making any investment decision. 

Great Lakes Dredge and Dock (GLDD) – New Awards of $61 Million – Increasing Price Target

Tuesday, January 12, 2021

Great Lakes Dredge & Dock (GLDD)
New Awards of $61 Million – Increasing Price Target

Great Lakes Dredge & Dock Corp is a provider of dredging services in the United States. The company only’s operating segments is Dredging. Dredging involves the enhancement or preservation of navigability of waterways or the protection of shorelines through the removal or replenishment of soil, sand or rock. Its projects portfolio includes Coastal Restoration, Coastal Protection, Port expansion, and others.

Poe Fratt, Senior Research Analyst, Noble Capital Markets, Inc.

Refer to the full report for the price target, fundamental analysis, and rating.

    Four awards for $60.9 million to be included in year-end 2020 backlog. The four awards (three maintenance and one coastal protection) include a total work of $60.9 million in Florida and Georgia. Three of the four awards should be completed in 1Q2021 and the fourth extending out into 3Q2021.

    Dredging market outlook remains solid and potential infrastructure spending creates tailwind.  The awards are positive signals after the loss on the Spanish Ridge work in Louisiana in December. Other positives include stronger global LNG prices that could help move the NextDecade (NEXT) LNG project to FID and the potential higher infrastructure spending in fiscal stimulus plans …


This Company Sponsored Research is provided by Noble Capital Markets, Inc., a FINRA and S.E.C. registered broker-dealer (B/D).

*Analyst certification and important disclosures included in the full report. NOTE: investment decisions should not be based upon the content of this research summary.  Proper due diligence is required before making any investment decision. 

Release – Jaguar Mining (JAGGF)(JAG:CA) – Reports Fourth Quarter Production With 22532 Gold Ounces


Jaguar Mining Reports Fourth Quarter Production With 22,532 Gold Ounces


Turnaround Year with 23% Year-Over-Year Production Increase Within Upper Half of the 2020 Production Guidance Exploration Program Started at Corrego Brandão

Toronto, January 12, 2021 – Jaguar Mining Inc. (“Jaguar” or the “Company”) (TSX: JAG) today announced Production results for the three months (“Q4 2020”) and twelve months ended December 31, 2020 (“FY 2020”). All figures are in US Dollars, unless otherwise expressed.

FY 2020 Annual and Q4 2020 Operating Results Summary

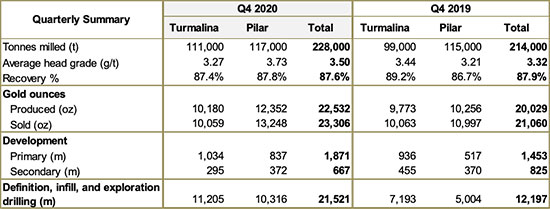
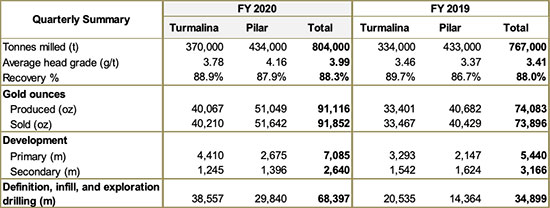
  • Annual consolidated gold production for 2020 increased 23% with 91,116 ounces compared to 2019 production of 74,083 ounces; in the upper half of the 2020 production guidance of 84,000 to 94,000 ounces of gold despite a tumultuous year dominated by the COVID-19 pandemic. Both mines saw significant improvement from 2019 production levels with Pilar up 25% and Turmalina up 20%. Q4 2020 consolidated gold production increased 12% to 22,532 ounces, compared to Q4 2019 production of 20,029 ounces.
  • Annual consolidated tonnage for 2020 processed was 804,000 tonnes at 3.99 grams per tonne (g/t), an increase of 5% in tonnes and an increase of 17% in grade from 2019´s 767,000 tonnes processed at 3.41 g/t. Q4 2020 consolidated tonnage processed was 228,000 tonnes at 3.50 g/t; increases of 7% from the fourth quarter of 2019 with 214,000 tonnes at 3.32 g/t.
  • Annual 2020 development of 7,085 primary and 2,640 secondary metres for a total of 9,725 metres, which is an increase of 13% on FY 2019 total metres developed of 8,606. Q4 2020 primary metres of 1,871 metres and secondary metres of 667, totalling 2,538 metres which is an 11% increase on Q4 2019 development of 2,278 metres. These development rates provide sustainable progress on the ramp and ore development.
  • Diamond Drill metres for FY 2020 increased 96% to 68,397 metres from 34,899 metres in FY 2019. Q4 2020 metres were at 21,521 a 76% increase from Q4 2019 drilling of 12,197 metres.
  • Treasury position as of December 31, 2020, with cash of $39 million compared to cash of $11 million on December 31, 2019 and $39 million on September 30, 2020, demonstrating continued generation of free cash flow. During Q4 2020 the Company also,
    • Invested total capital expenditures of $11 million (sustaining capital $9 million and growth capital $2 million), compared to $9 million total capital expenditures in prior period in 2019;
    • Spent $6.7M on returns to shareholders including a quarterly dividend of $4.4 million and purchased $2.3 million of shares through the Normal Course Issuer Bid program.

Vern Baker, President and CEO of Jaguar Mining stated: “The results for the year demonstrate an exceptional turn around for Jaguar implemented by our mining teams in Brazil. In 2021 we expect to make further strides and reach our target of 100,000 sustainable ounces produced per year. Year over year, Jaguar saw an increase of 23% in production ounces, made up of a 25% improvement at Pilar and a 20% improvement at Turmalina. This coincided with a year-over-year increase in primary metres developed by 30%, an increase in Diamond Drill metres by 96%, and reduction of lost time injuries by 70% while seeing an increase in man-hours of 20%. The quarterly results continue strong for Pilar, while Turmalina´s fourth quarter gold production was below our expectations.

The Pilar Mine continued showing consistent performance with a quarterly production of 12,352 ounces which led to an annual production of 51,049 gold ounces. The primary development performance at Pilar was also strong with 837 metres completed for an annual total of 2,675 primary development metres showing a 25% increase over 2019. Diamond drilling at Pilar also increased for the quarter and the year with 10,316 metres in the quarter for an annual total of 29,840 metres an 108% increase over 2019. Additional investment in the future continued with projects at both the plant and mine designed to strengthen infrastructure in Q4.

The Turmalina Mine produced 10,180 gold ounces in Q4 for an annual total of 40,067 ounces for the year an increase of 20% over 2019. Turmalina´s primary development was 1,034 metres for the quarter and reached 4,410 metres for the year, an increase of 34% year-over-year. Diamond drilling within the mine was 11,205 metres for the quarter leading to an annual total of 38,557 for an 88% increase over 2019. A number of projects to strengthen the mine and plant infrastructure were initiated in the fourth quarter.

Turmalina production was negatively impacted by COVID-19 Cases in both Q3 and Q4. The highest December rainfall in 9 years also impacted production due to grid power outages; and underground water pumping stoppages to control surface pond levels. Discussions with the power provider are ongoing to strengthen the mine´s access to consistent power. Turmalina has developed the working areas to sustain production at 50,000 ounces per year. Turmalina has also modified the mine design in Orebody C to reduce waste development; modified the mine plan in Orebody A to increase use of cemented paste backfill to improve stope sequencing and reliability; and increased the percentage of Orebody C production which is closer to surface. These changes provide the pathway to consistent production of 50,000 ounces per year.

Vern added, “Our exploration programs are moving ahead with the increased diamond drill metres in the undergrounds continuing to expand known mineralized areas. Exploration efforts have been growing through the year but have been hampered by the slow returns of assays from the outside laboratories. Samples from the Faina deposit are currently going through an extensive metallurgical program to help us develop our next steps on this deposit which is within 1 kilometres of our Turmalina workings. Work on the Zona Basal property continues with both oxide and sulphide intercepts being evaluated. We are pleased that the drilling of the Corrego Brandão (CB) exploration project was initiated in December. We believe that CB is an outstanding target and are excited about getting drilling started. We expect to be putting out exploration releases as assay results are received.”

2021 Production Guidance

Our guidance for production performance for FY 2021 is 95,000-105,000 ounces. We expect the All-in-Sustaining-Costs for 2021 to be within the range of $975 to $1,125 per ounce, utilizing a foreign exchange rate of R$5.2 for the Brazilian Real versus the US dollar.

Cash Position and Use of Funds

  • Treasury position as of December 31, 2020, with cash of $39 million compared to cash of $39 million on September 30, 2020, and $11M cash on December 31, 2019, demonstrating an year of continued generation of free cash flow.
  • The Company also invested total capital expenditures of $11 million (sustaining capital of $9M and growth capital of $2M, approximately) being the highest total capital spend in a quarter in the past 7 years.
    • In FY 2021, total capital (sustaining and growth) expenditures of $11-13 million per quarter are expected to continue, with new projects including Pilar’s new ventilation system, expenditures on the Caeté filter press, dry stack tailings project at Turmalina to extend life of the tailings, purchase of new mining equipment, purchase of new diamond drill rigs to advance exploration activities, and capitalization of diamond drilling converting resources to reserves.
  • During the quarter, the Company also spent $7 million on financing activities including:
    • A quarterly dividend of $4.4 million,
    • Purchase of $2.3 million of shares through the Normal Course Issuer Bid program, and
    • Debt and interest payments of $0.3 million.

Q4 2020 Detailed Operating Results

FY 2020 Detailed Operating Results

Qualified Persons

Scientific and technical information contained in this press release has been reviewed and approved by Jonathan Victor Hill, BSc (Hons) (Economic Geology – UCT), FAUSIMM, Senior Expert Advisor Geology and Exploration to the Jaguar Mining Management Committee, who is also an employee of Jaguar Mining Inc., and is a “qualified person” as defined by National Instrument 43-101 – Standards of Disclosure for Mineral Projects (“NI 43-101”).

The Iron Quadrangle

The Iron Quadrangle has been an area of mineral exploration dating back to the 17th century. The discovery in 1699–1701 of gold contaminated with iron and platinum-group metals in the southeastern corner of the Iron Quadrangle gave rise to the name of the town Ouro Preto (Black Gold). The Iron Quadrangle contains world-class multi-million-ounce gold deposits such as Morro Velho, Cuiabá, and São Bento. Jaguar holds a prospective land position in the Iron Quadrangle of over 35,000 hectares plus over 27,000 hectares under JV with IAMGOLD.

About Jaguar Mining Inc.

Jaguar Mining Inc. is a Canadian-listed junior gold mining, development, and exploration company operating in Brazil with two gold mining complexes and a large land package with significant upside exploration potential from mineral claims covering an area of approximately 102,000 hectares. The Company’s principal operating assets are located in the Iron Quadrangle, a prolific greenstone belt in the state of Minas Gerais and include the Turmalina Gold Mine Complex and Caeté Mining Complex (Pilar Mine and Caeté Plant). The Company also owns the Paciência Gold Mine Complex, which has been on care and maintenance since 2012. The Roça Grande Mine has been on care and maintenance since April 2018. Additional information is available on the Company’s website at www.jaguarmining.com.

For further information please contact:

Vernon Baker
Chief Executive Officer
Jaguar Mining Inc.
vernon.baker@jaguarmining.com

416-847-1854

Hashim Ahmed
Chief Financial Officer
Jaguar Mining Inc.
hashim.ahmed@jaguarmining.com

416-847-1854

Forward-Looking Statements

Certain statements in this news release constitute “forward-looking information” within the meaning of applicable Canadian securities legislation. Forward-looking statements and information are provided for the purpose of providing information about management’s expectations and plans relating to the future. All of the forward-looking information made in this news release is qualified by the cautionary statements below and those made in our other filings with the securities regulators in Canada. Forward-looking information contained in forward-looking statements can be identified by the use of words such as “are expected,” “is forecast,” “is targeted,” “approximately,” “plans,” “anticipates,” “projects,” “anticipates,” “continue,” “estimate,” “believe” or variations of such words and phrases or statements that certain actions, events or results “may,” “could,” “would,” “might,” or “will” be taken, occur or be achieved. All statements, other than statements of historical fact, may be considered to be or include forward-looking information. This news release contains forward-looking information regarding, among other things, expected sales, production statistics, ore grades, tonnes milled, recovery rates, cash operating costs, definition/delineation drilling, the timing and amount of estimated future production, costs of production, capital expenditures, costs and timing of the development of projects and new deposits, success of exploration, development and mining activities, currency fluctuations, capital requirements, project studies, mine life extensions, restarting suspended or disrupted operations, continuous improvement initiatives, and resolution of pending litigation. The Company has made numerous assumptions with respect to forward-looking information contained herein, including, among other things, assumptions about the estimated timeline for the development of its mineral properties; the supply and demand for, and the level and volatility of the price of, gold; the accuracy of reserve and resource estimates and the assumptions on which the reserve and resource estimates are based; the receipt of necessary permits; market competition; ongoing relations with employees and impacted communities; political and legal developments in any jurisdiction in which the Company operates being consistent with its current expectations including, without limitation, the impact of any potential power rationing, tailings facility regulation, exploration and mine operating licenses and permits being obtained and renewed and/or there being adverse amendments to mining or other laws in Brazil and any changes to general business and economic conditions. Forward-looking information involves a number of known and unknown risks and uncertainties, including among others: the risk of Jaguar not meeting the forecast plans regarding its operations and financial performance; uncertainties with respect to the price of gold, labour disruptions, mechanical failures, increase in costs, environmental compliance and change in environmental legislation and regulation, weather delays and increased costs or production delays due to natural disasters, power disruptions, procurement and delivery of parts and supplies to the operations; uncertainties inherent to capital markets in general (including the sometimes volatile valuation of securities and an uncertain ability to raise new capital) and other risks inherent to the gold exploration, development and production industry, which, if incorrect, may cause actual results to differ materially from those anticipated by the Company and described herein. In addition, there are risks and hazards associated with the business of gold exploration, development, mining and production, including environmental hazards, tailings dam failures, industrial accidents and workplace safety problems, unusual or unexpected geological formations, pressures, cave-ins, flooding, chemical spills, procurement fraud and gold bullion thefts and losses (and the risk of inadequate insurance, or the inability to obtain insurance, to cover these risks). In addition, the Company’s principal operations and mineral properties are located in Brazil and there are additional business and financial risks inherent in doing business in Brazil as compared to the United States or Canada. In Brazil, corruption represents a challenge requiring extra attention by those who conduct business there. Corruption does not only occur with the misuse of public, government or regulatory powers, it also can occur in a business’s supplies, inputs and procurement functions (such as illicit rebates, kickbacks and dubious vendor relationships) as well as the inventory and product sales functions (such as inventory shrinkage or skimming). Employees as well as external parties (such as suppliers, distributors and contractors) have opportunities to commit theft, procurement fraud and other wrongs against the Company. While corruption, bribery and fraud and theft risks can never be fully eliminated, the Company reviews and implements controls to reduce the likelihood of these events occurring. The Company’s present and future business operations face these risks. Accordingly, for all of the reasons above, readers should not place undue reliance on forward-looking information.

For additional information with respect to these and other factors and assumptions underlying the forward-looking information made in this news release, see the Company’s most recent Annual Information Form and Management’s Discussion and Analysis, as well as other public disclosure documents that can be accessed under the issuer profile of “Jaguar Mining Inc.” on SEDAR at www.sedar.com. The forward-looking information set forth herein reflects the Company’s reasonable expectations as at the date of this news release and is subject to change after such date. The Company disclaims any intention or obligation to update or revise any forward-looking information, whether as a result of new information, future events or otherwise, other than as required by law. The forward-looking information contained in this news release is expressly qualified by this cautionary statement.

SOURCE: Jaguar Mining

Release – Chakana (CHKKF)(PERU:CA) – Has resumed its 15000m drill program at the Soledad Project in Ancash Peru


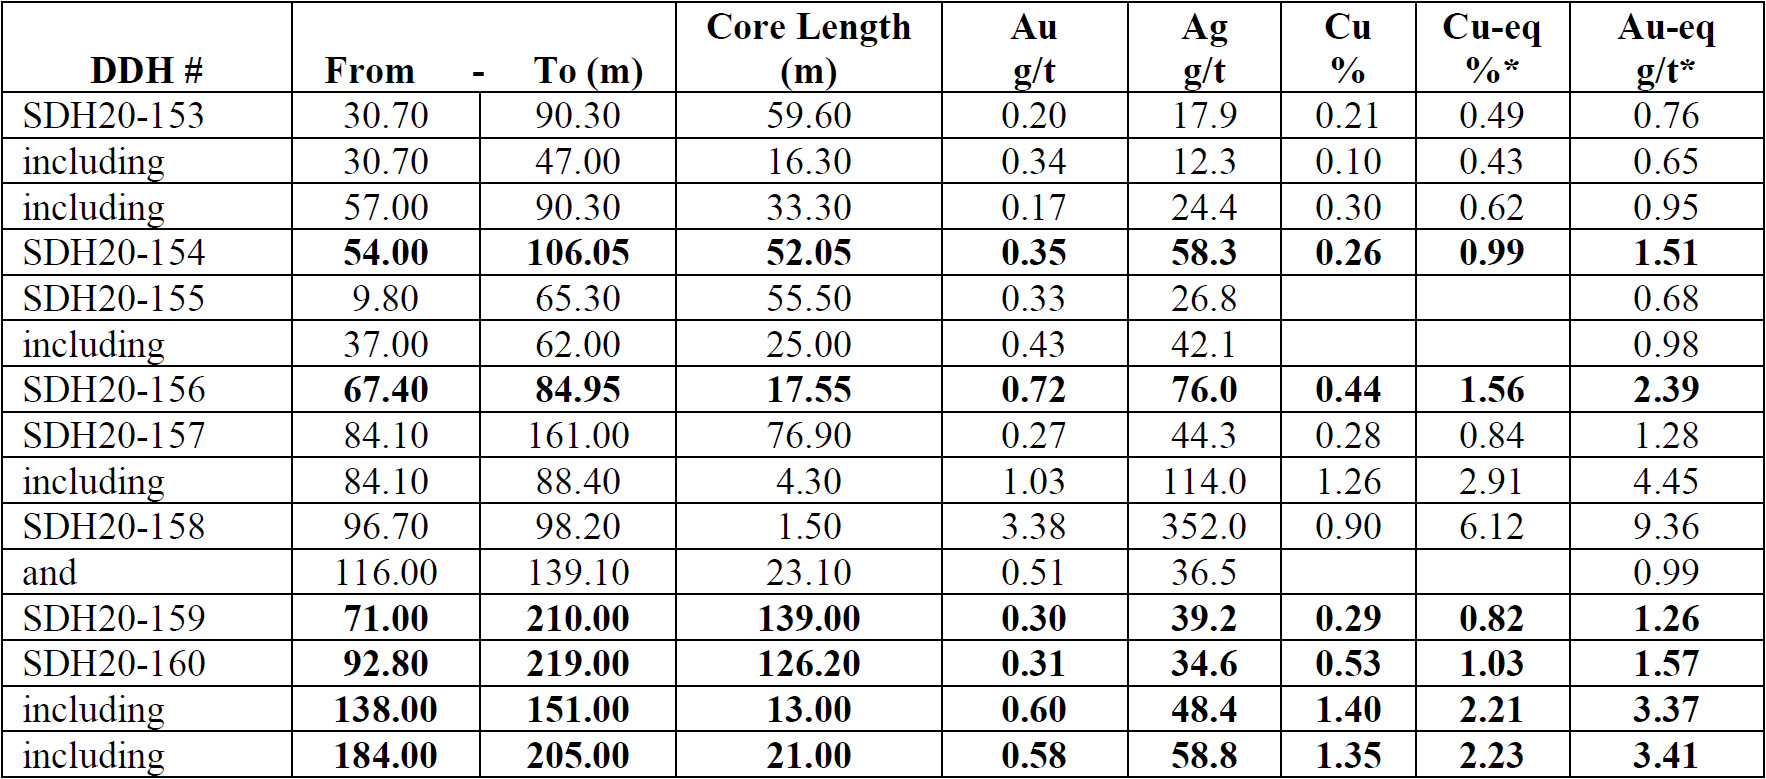
Chakana Copper Intersects 126.2m of 0.31 g/t Au, 0.53% Cu, and 34.6 g/t Ag (1.03% Cu-Eq; 1.57 g/t Au-Eq) from 92.8m at Huancarama, Soledad Project, Peru


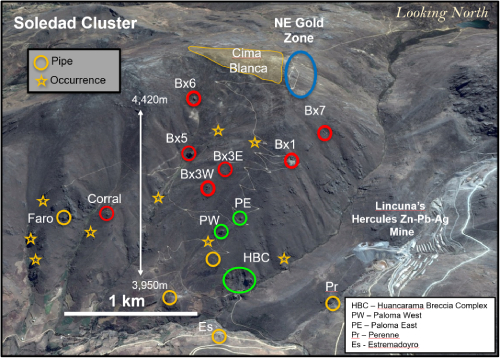
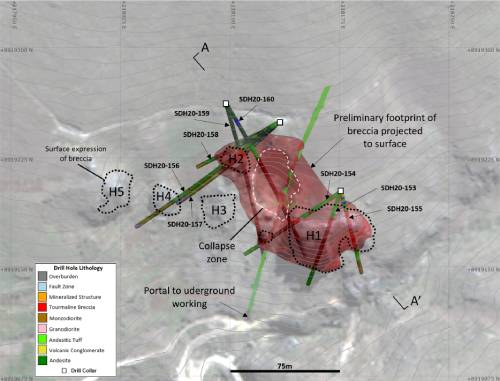
Vancouver, B.C., January 12, 2021 – Chakana Copper Corp. (TSX-V: PERU; OTCQB: CHKKF; FRA: 1ZX) (the “Company” or “Chakana”), has resumed its 15,000m drill program at the Soledad Project in Ancash, Peru. Prior to taking a short holiday break in late December, field crews had completed thirty-four drill holes for 6,634 metres at three high priority targets: Paloma East, Paloma West, and the Huancarama Breccia Complex (Fig. 1). The Company is now pleased to release additional positive results from the initial eight drill holes from the eastern portion of the Huancarama Breccia Complex, having previously reported on the new discoveries at Paloma East and Paloma West.

Mineralized intervals from initial holes at Huancarama include:

* Cu_eq and Au_eq values were calculated using copper, gold, and silver. Metal prices utilized for the calculations are Cu – US$2.90/lb, Au – US$1,300/oz, and Ag – US$17/oz. No adjustments were made for recovery as the project is an early stage exploration project and metallurgical data to allow for estimation of recoveries are not yet available. The formulas utilized to calculate equivalent values are Cu_eq (%) = Cu% + (Au g/t * 0.6556) + (Ag g/t * 0.00857) and Au_eq (g/t) = Au g/t + (Cu% * 1.5296) + (Ag g/t * 0.01307).

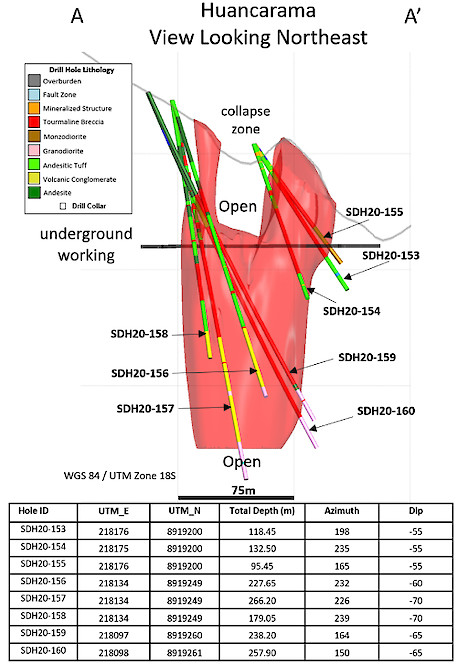
In addition to summary information reported here readers are also referred to figures 2 and 3 (included):

  • Holes SDH20-153 to SDH20-155 are shallow holes drilled across the H1 breccia outcrop aiming to the south and southwest. All three holes intersected mineralized breccia; the best intercept is in hole SDH20-154 with 52.05m of 0.35 g/t Au, 0.26% Cu, and 58.3 g/t Ag (1.51 g/t Au-eq) starting at 54m depth.
  • Holes SDH20-156 to SDH20-158 were drilled to the southwest across the H2 breccia. All three holes intersected mineralized breccia and a conglomerate that marks the base of the Calipuy volcanic section with holes SDH20-156 and SDH20-157 ending in pre-breccia granodiorite. At higher levels the breccia appears to be a neck-like body that is expanding at depth. Hole SDH20-156 intersected 17.66m with 0.72 g/t Au, 0.44% Cu, and 76.0 g/t Ag (2.39 g/t Au-eq) starting at 67.4m depth; hole SDH20-157 intersected 76.90m with 0.27 g/t Au, 0.28% Cu, and 44.3 g/t Ag (1.28 g/t Au-eq) from 84.10m depth.
  • Holes SDH20-159 and SDH20-160 were drilled to the southeast from north of H2. Both holes intersected continuous mineralized breccia connecting H2 and H1 and confirming a large lateral extent of breccia. Hole SDH20-159 intersected 139m with 0.30 g/t Au, 0.29% Cu, and 39.2 g/t Ag (1.26 g/t Au-eq) starting at 71m; hole SDH20-160, drilled directly beneath the collapse zone, encountered 126.2m with 0.31 g/t Au, 0.53% Cu, and 34.6 g/t Ag (1.57 g/t Au-eq) from 92.8m depth. Notably, two high grade zones occur within this interval: 13m with 0.60 g/t Au, 1.40% Cu, and 48.4 g/t Ag (3.37 g/t Au-eq) from 138m; and 21m with 0.58 g/t Au, 1.35% Cu, and 58.8 g/t Ag (3.41 g/t Au-eq) starting at 184m depth.

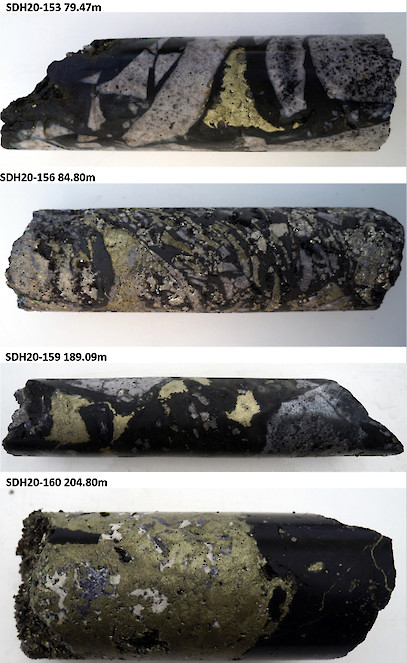
Examples of mineralized drill core from these holes are shown in Figure 4.

David Kelley, President and CEO commented, “results from the initial scout drilling on the eastern half of the Huancarama Breccia Complex have confirmed a large, mineralized breccia with approximate dimensions of 100m by 50m. Holes SDH20-159 and SDH20-160 are particularly important as they demonstrate long runs of continuous mineralization with some impressive zones of high-grade encountered in SDH20-160. The breccia remains open at depth and the western half of the breccia complex is currently untested. The near surface mineralization encountered thus far may have bulk mineable potential. We are continuing additional scout drilling at Huancarama to further expand the area of mineralization, and we look forward to reporting additional drill results in the near future.”

Huancarama Target Area and the Phase 3b Drill Program

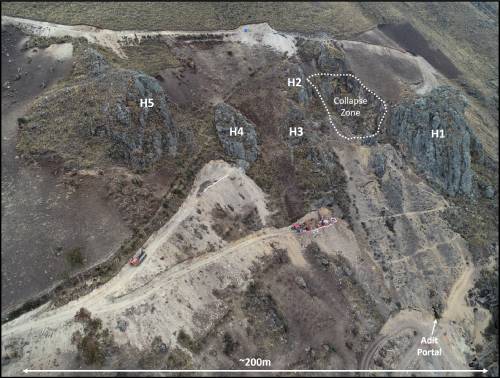
The Huancarama Breccia Complex is located 300m south of and 400m above the deepest breccia intercept at Paloma. Within the complex there are five principal breccia bodies exposed at surface over approximately 200m (Fig. 5). There is a distinctive feature believed to be a collapse zone with dimensions of 50m by 30m. Unverified reports suggest that this may be a mine collapse, but it may also be a natural feature. The largest breccia body in the complex is H1 (approximately 60m in diameter). Two historic adits are in the complex, one trending north-northeast for 170m along the western side of H1, and a second shorter adit of 21m at H2. Surface sampling from the breccia bodies and channel sampling of the adits yielded strongly anomalous gold results (see news release dated November 19, 2019). In addition to several targets within the complex, numerous targets exist between Huancarama and Paloma.

Results reported here are part of the ongoing Phase 3b drill program, which is fully funded from the Company’s current treasury and is anticipated to see 15,000 metres completed. Phase 3b is testing a cluster of high-grade, gold-enriched tourmaline breccia pipe targets within the Paloma and Huancarama target areas. Twenty-eight holes have now been reported from the Phase 3b program; twenty-six of the holes have reportable intercepts.

About Chakana Copper

Chakana Copper Corp is a Canadian-based minerals exploration company that is currently advancing the high-grade gold-copper-silver Soledad Project located in the Ancash region of Peru, a highly favorable mining jurisdiction with supportive communities. The Soledad Project consists of high-grade gold-copper-silver mineralization hosted in tourmaline breccia pipes. A total of 33,353 metres of drilling has been completed to-date, testing nine (9) of twenty-three (23) confirmed breccia pipes with more than 92 total targets. Chakana’s investors are uniquely positioned as the Soledad Project provides exposure to several metals including copper, gold, and silver. For more information on the Soledad project, please visit the website a www.chakanacopper.com.

Sampling and Analytical Procedures

Chakana follows rigorous sampling and analytical protocols that meet or exceed industry standards. Core samples are stored in a secured area until transport in batches to the ALS facility in Callao, Lima, Peru. Sample batches include certified reference materials, blank, and duplicate samples that are then processed under the control of ALS. All samples are analyzed using the ME-MS41 (ICP technique that provides a comprehensive multi-element overview of the rock geochemistry), while gold is analyzed by AA24 and GRA22 when values exceed 10 g/t by AA24. Over limit silver, copper, lead and zinc are analyzed using the OG-46 procedure. Soil samples are analyzed by 4-acid (ME-MS61) and for gold by Fire Assay on a 30g sample (Au-ICP21).

Results of previous drilling and additional information concerning the Project, including a technical report prepared in accordance with National Instrument 43-101, are made available on Chakana’s SEDAR profile at www.sedar.com.

Qualified Person

David Kelley, an officer and a director of Chakana, and a Qualified Person as defined by NI 43-101, reviewed and approved the technical information in this news release.

ON BEHALF OF THE BOARD
(signed) “David Kelley”
David Kelley
President and CEO

For further information contact:
Joanne Jobin, Investor Relations Officer
Phone: 647 964 0292
Email: jjobin@chakanacopper.com

Neither TSX Venture Exchange nor its Regulation Services Provider (as that term is defined in the policies of the Exchange) accepts responsibility for the adequacy or accuracy of this release.

Forward-looking Statement Advisory: This release may contain forward-looking statements. Forward-looking statements involve known and unknown risks, uncertainties, and other factors which may cause the actual results, performance, or achievements of Chakana to be materially different from any future results, performance, or achievements expressed or implied by the forward looking statements. Forward looking statements or information relates to, among other things, the interpretation of the nature of the mineralization at the Soledad copper-gold-silver project (the “Project”), the potential to expand the mineralization, and to develop and grow a resource within the Project, the planning for further exploration work, the ability to de-risk the potential exploration targets, and our belief in the potential for mineralization within unexplored parts of the Project. These forward-looking statements are based on management’s current expectations and beliefs but given the uncertainties, assumptions and risks, readers are cautioned not to place undue reliance on such forward- looking statements or information. The Company disclaims any obligation to update, or to publicly announce, any such statements, events or developments except as required by law.

Figure 1 – View looking north showing breccia pipes and occurrences within the northern Soledad cluster. Pipes that have been drilled in previous campaigns are shown in red. Targets shown in green are the focus on this 15,000m drill campaign. Other pipes and occurrences remain to be tested by drilling. Additional breccia pipes occur on the south half of the property and are not shown here.

Figure 2 – Map of the Huancarama Breccia Complex and drill hole lithology in holes completed to date. Red represents tourmaline breccia based on the first eight holes and lithology mapped in the underground tunnel. Black dotted outlines show surface expression of mapped breccias; white dashed line shows collapse zone. Location of section line for Figure 3 indicated.

Figure 3 – Section looking northeast highlighting the drill holes at Huancarama reported in this release. Light red 3D shape shows preliminary shape of breccia based on the first eight holes and lithology mapped in the underground tunnel.

Figure 5 – Drone image looking northeast at the Huancarama Breccia Complex showing the five principal tourmaline breccia bodies exposed at surface (H1-H5), historic adit portal, and drill platforms. Note drill rig in center of image.

SOURCE: Chakana Copper

Release – Comstock Mining (LODE) – CEO Corrado DeGasperis to Present at NobleCon17


Comstock Mining CEO Corrado DeGasperis to Present at NobleCon17


Virginia City, NV (January 12, 2021) Comstock Mining Inc. (the “Company”) (NYSE American: LODE) today announced that Mr. Corrado DeGasperis, Executive Chairman and CEO of the Company, will present at NobleCon17 – Noble Capital Markets’ Seventeenth Annual Investor Conference on Wednesday, January 20, 2021 at 10:30 A.M. Eastern Standard Time. The conference is virtual, with no cost, obligation or restrictions to attend: www.nobleconference.com

A high-definition, video webcast of the presentation will be available the following day on the Company’s website: https://www.comstockmining.com/investor-library/, and as part of a complete catalog of presentations to be rebroadcast on Channelchek channelchek.vercel.app next month.

About Noble Capital Markets, Inc.

Noble Capital Markets (“Noble”) is a research driven boutique investment bank that has supported small & microcap companies since 1984. As a FINRA and SEC licensed and registered broker-dealer Noble provides institutional-quality equity research, merchant and investment banking, wealth management and order execution services. In 2005, Noble established NobleCon, an investor conference that has grown substantially over the last decade+. In 2018 Noble launched channelchek.vercel.app – an investment community dedicated exclusively to small and micro-cap companies and their industries. Channelchek is tailored to meet the needs of self-directed investors and financial professionals and is the first service to offer institutional-quality research to the public, for FREE at every level without a subscription. More than 6,000 emerging growth companies are listed on the site, with growing content including webcasts, industry sector reports, advanced market data and balanced news.

About Comstock Mining Inc.

Comstock Mining Inc. is a Nevada-based, precious and strategic metal-based exploration, economic resource development, mineral production and metal processing business with a strategic focus on high-value, cash-generating, environmentally friendly, and economically enhancing mining and processing technologies and businesses. The Company has extensive, contiguous property in the historic Comstock and Silver City mining districts (collectively, the “Comstock District”), is an emerging leader in sustainable, responsible mining and processing, and is currently commercializing environment-enhancing, metal-based technologies, products, and processes for precious and strategic metals recovery.

Forward-Looking Statements

This press release and any related calls or discussions may include forward-looking statements within the meaning of Section 27A of the Securities Act of 1933, as amended, and Section 21E of the Securities Exchange Act of 1934, as amended. All statements, other than statements of historical facts, are forward-looking statements. The words “believe,” “expect,” “anticipate,” “estimate,” “project,” “plan,” “should,” “intend,” “may,” “will,” “would,” “potential” and similar expressions identify forward-looking statements, but are not the exclusive means of doing so. Forward-looking statements include statements about matters such as: consummation of all pending transactions; project, asset or Company valuations; future industry market conditions; future explorations, acquisitions, investments and asset sales; future performance of and closings under various agreements; future changes in our exploration activities; future estimated mineral resources; future prices and sales of, and demand for, our products; future impacts of land entitlements and uses; future permitting activities and needs therefor; future production capacity and operations; future operating and overhead costs; future capital expenditures and their impact on us; future impacts of operational and management changes (including changes in the board of directors); future changes in business strategies, planning and tactics and impacts of recent or future changes; future employment and contributions of personnel, including consultants; future land sales, investments, acquisitions, joint ventures, strategic alliances, business combinations, operational, tax, financial and restructuring initiatives; the nature and timing of and accounting for restructuring charges and derivative liabilities and the impact thereof; contingencies; future environmental compliance and changes in the regulatory environment; future offerings of equity or debt securities; asset sales and associated costs; future working capital, costs, revenues, business opportunities, debt levels, cash flows, margins, earnings and growth.

These statements are based on assumptions and assessments made by our management in light of their experience and their perception of historical and current trends, current conditions, possible future developments and other factors they believe to be appropriate. Forward-looking statements are not guarantees, representations or warranties and are subject to risks and uncertainties, many of which are unforeseeable and beyond our control and could cause actual results, developments and business decisions to differ materially from those contemplated by such forward-looking statements. Some of those risks and uncertainties include the risk factors set forth in our filings with the SEC and the following: counterparty risks; capital markets’ valuation and pricing risks; adverse effects of climate changes or natural disasters; global economic and capital market uncertainties; the speculative nature of gold or mineral exploration, including risks of diminishing quantities or grades of qualified resources; operational or technical difficulties in connection with exploration or mining activities; contests over title to properties; potential dilution to our stockholders from our stock issuances and recapitalization and balance sheet restructuring activities; potential inability to comply with applicable government regulations or law; adoption of or changes in legislation or regulations adversely affecting businesses; permitting constraints or delays; decisions regarding business opportunities that may be presented to, or pursued by, us or others; the impact of, or the non-performance by parties under agreements relating to, acquisitions, joint ventures, strategic alliances, business combinations, asset sales, leases, options and investments to which we may be party; changes in the United States or other monetary or fiscal policies or regulations; interruptions in production capabilities due to capital constraints; equipment failures; fluctuation of prices for gold or certain other commodities (such as silver, zinc, cyanide, water, diesel fuel and electricity); changes in generally accepted accounting principles; adverse effects of terrorism and geopolitical events; potential inability to implement business strategies; potential inability to grow revenues; potential inability to attract and retain key personnel; interruptions in delivery of critical supplies, equipment and raw materials due to credit or other limitations imposed by vendors or others; assertion of claims, lawsuits and proceedings; potential inability to satisfy debt and lease obligations; potential inability to maintain an effective system of internal controls over financial reporting; potential inability or failure to timely file periodic reports with the SEC; potential inability to list our securities on any securities exchange or market; inability to maintain the listing of our securities; and work stoppages or other labor difficulties. Occurrence of such events or circumstances could have a material adverse effect on our business, financial condition, results of operations or cash flows or the market price of our securities. All subsequent written and oral forward-looking statements by or attributable to us or persons acting on our behalf are expressly qualified in their entirety by these factors. Except as may be required by securities or other law, we undertake no obligation to publicly update or revise any forward-looking statements, whether as a result of new information, future events, or otherwise.

Neither this press release nor any related calls or discussions constitutes an offer to sell, the solicitation of an offer to buy or a recommendation with respect to any securities of the Company, the fund or any other issuer.

Contact information for

Comstock Mining Inc.
117 American Flat Rd
PO Box 1118
Virginia City, NV 89440
http://www.comstockmining.com

Corrado De Gasperis
Executive Chairman & CEO
Tel (775) 847-4755
degasperis@comstockmining.com

Zach Spencer
Director of External Relations
Tel (775) 847-5272 ext.151
questions@comstockmining.com

Source: Comstock Mining

Jaguar Health (JAGX) Scheduled To Present at NobleCon17


Join Jaguar Health (JAGX) CEO Lisa Conte at NobleCon17 – Noble Capital Markets 17th Annual Small & Microcap Investor Conference – January 19&20, 2021. Following a formal presentation, a seasoned Wall Street research analyst will join Lisa to moderate a LIVE Q&A session. If you want to be added to the roster of presenters… or if you would like to join the virtual audience of investors, at no cost, go to nobleconference.com.

NobleCon 17 Complete Presenting Company Schedule

Information Services Group (III) Scheduled To Present at NobleCon17


Join Information Services Group (III) CFO David Berger & CEO Michael Conners at NobleCon17 – Noble Capital Markets 17th Annual Small & Microcap Investor Conference – January 19&20, 2021. Following a formal presentation, a seasoned Wall Street research analyst will join David and Michael to moderate a LIVE Q&A session. If you want to be added to the roster of presenters… or if you would like to join the virtual audience of investors, at no cost, go to nobleconference.com.

NobleCon 17 Complete Presenting Company Schedule