Ely Gold Royalties (ELYGF)(ELY:CA) – Executes Option Agreement to Sell Aurora West Property to Goldcliff Resources

Friday, October 09, 2020

Ely Gold Royalties (ELYGF)(ELY:CA)

Executes Option Agreement to Sell Aurora West Property to Goldcliff Resources

As of April 24, 2020, Noble Capital Markets research on Ely Gold Royalties is published under ticker symbols (ELYGF and ELY:CA). The price target is in USD and based on ticker symbol ELYGF. Research reports dated prior to April 24, 2020 may not follow these guidelines and could account for a variance in the price target. Ely Gold Royalties Inc is an emerging royalty company with producing and development assets focused in Nevada and the Western US. It offers shareholders a low-risk leverage to the current price of gold and low-cost access to long-term gold royalties.

Mark Reichman, Senior Research Analyst of Natural Resources, Noble Capital Markets, Inc.

Refer to the full report for the price target, fundamental analysis, and rating.

    Option agreement to sell Aurora West. Ely Gold Royalties, through its Nevada Select subsidiary, executed an option agreement for Goldcliff Resource Corporation (OTCBB, GCFFF, Not Rated) to acquire the Aurora West Property located in Mineral County, Nevada. Ely will retain a 2% net smelter return (NSR) royalty. Nevada Select is currently optioning the property from a third-party private company. Aurora West includes 51 claims and is contiguous with claims held by Hecla Mining Company (NYSE, HL, Not Rated).

    Terms of the transaction.  Goldcliff will acquire the property for US$425 thousand, including the following payments: 1) US$25 thousand to Nevada Select at closing; 2) US$50 thousand to the private company on September 23, 2021; 3) US$135 thousand to the private company on September 23, 2022 at which point Nevada Select will take possession of the Aurora West Property; 4) US$200 thousand to Nevada …


This Company Sponsored Research is provided by Noble Capital Markets, Inc., a FINRA and S.E.C. registered broker-dealer (B/D).

*Analyst certification and important disclosures included in the full report. NOTE: investment decisions should not be based upon the content of this research summary.  Proper due diligence is required before making any investment decision. 

Comstock Mining (LODE) – Mercury Remediation Pilot Program Commences at American Flat

Friday, October 09, 2020

Comstock Mining (LODE)

Mercury Remediation Pilot Program Commences at American Flat

Comstock Mining Inc is a mining company with a focus on gold and silver deposits in the Comstock and Silver City mining districts in Nevada. Its operations are divided into two segments, namely mining and real estate. Its mining projects include The Lucerne Resource area, the Dayton Resource area, the Spring Valley exploration target, the Northern Extension, Northern Targets and Occidental areas. The Real Estate segment involves land, real estate rental properties and a hotel, restaurant & bar provided by the Gold Hill Hotel located in Gold Hill, Nevada just south of Virginia City and the Daney Ranch, located just south of Silver City. The majority revenues are generated from the real estate segment.

Mark Reichman, Senior Research Analyst of Natural Resources, Noble Capital Markets, Inc.

Refer to the full report for the price target, fundamental analysis, and rating.

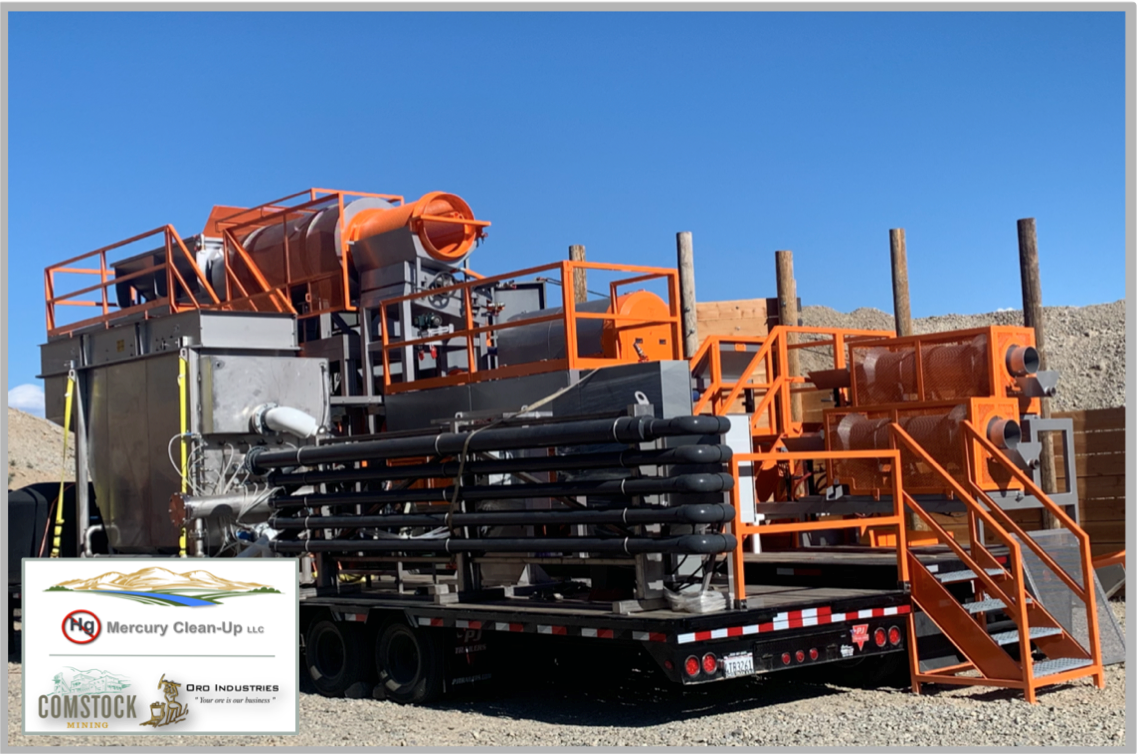
    Mercury remediation pilot project. With the approval of the Nevada Division of Environmental Protection, Comstock Mining, its subsidiary Comstock Processing, and Mercury Clean Up LLC (MCU), of which LODE owns an interest, started a pilot program targeting mercury contaminated waste dumps located at the historic American Flat site in the Comstock District in Nevada. The unit has the capacity to process up to 25 tonnes per hour but will start at 2 to 6 tonnes per hour and ramp up over time. The goal is to prove that with each step up in scale, the unit is effectively remediating mercury and recovering gold. Over time, the companies seek to commercialize the technology which we believe represents significant value creation potential.

    Second unit shipped to MCU Philippines.  A second unit has been shipped to MCU Philippines Inc. (MCU-P), a 50-50 joint venture between LODE and MCU. MCU-P and Clean Ore Solutions have joint ventured to establish Clean Mineral Recovery Technologies for the remediation and rehabilitation of the mercury contaminated Naboc River in the Philippines …


This Company Sponsored Research is provided by Noble Capital Markets, Inc., a FINRA and S.E.C. registered broker-dealer (B/D).

*Analyst certification and important disclosures included in the full report. NOTE: investment decisions should not be based upon the content of this research summary.  Proper due diligence is required before making any investment decision. 

Release – Comstock (LODE) – Mercury Clean Up Pilot Project Commences in Nevada; MCU’s Second Unit Shipped To Philippines


Mercury Clean Up Pilot Project Commences in Nevada; MCU’s Second Unit Shipped To Philippines


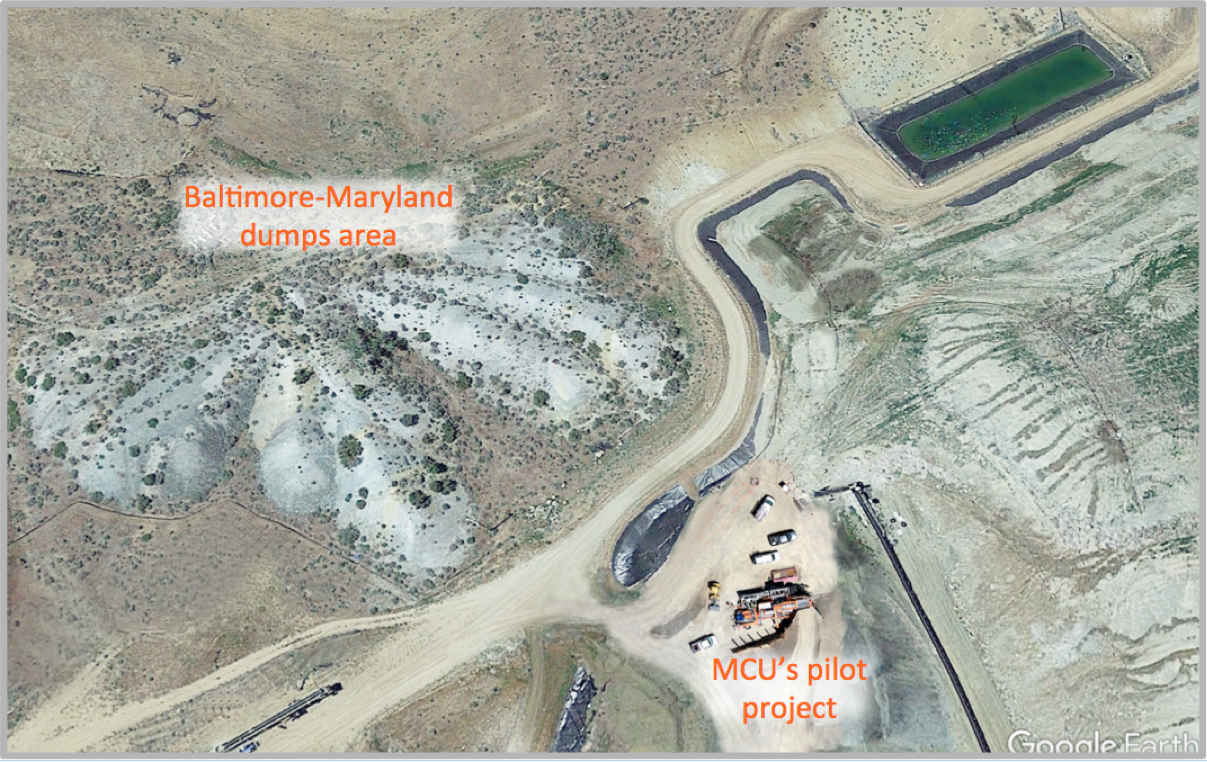
Virginia City, NV (October 8, 2020) Comstock Mining Inc. (NYSE American: LODE) and its wholly-owned subsidiary, Comstock Processing LLC (collectively, the “Company” or “Comstock”) and partner Mercury Clean Up LLC (“MCU”), a strategic investee, announced today, that it has commenced its Mercury Clean Up Pilot Study targeting the old Baltimore-Maryland waste dumps located on American Flat, in immediate proximity of MCU’s mercury remediation technology and system. This follows approval from the Nevada Division of Environmental Protection (“NDEP”) that granted a final Engineering Design Change (“EDC”) associated with an As-Built Report for the Mercury Clean Up Pilot operating within Comstock’s existing Water Pollution Control Permit – NEV2000109, including the application of process solution and within its fully contained, double-lined platform.


Mr. Paul Clift, MCU CEO stated, “Our setup of the MCU process plant and DAF components is now complete, including all connections on the recycle pump to the DAF unit and the ‘Bag Filtration’ unit and the landing and installation of our operating, on-site containerized Lab. With NDEP’s approval now in hand, we are ready to start test processing mercury contaminated materials and proving our efficacy.”


The Baltimore-Maryland dumps area to the left, near MCU’s Comstock Mercury Remediation System Pilot Project


Oro Industries has also manufactured a second unit, a state-of-the-art mercury remediation system, scheduled to arrive into Davao City on October 12, 2020 (pictured below as it was being prepared for and loaded into the shipping container), for our newly created entity, MCU Philippines Inc (“MCU-P”). Comstock previously announced that it had formed MCU-P, a new 50-50 joint venture between the Company and MCU, and has invested its first $1 million into this venture. MCU-P, in a joint venture with Clean Ore Solutions (“COS”), have joint ventured to establish Clean Mineral Recovery Technologies (“CMRT”) for the remediation and rehabilitation of the mercury contaminated Naboc River on Mt. Diwata, in Davao D’Oro, Philippines. CMRT will work in direct collaboration with the Philippine Department of Environment and Natural Resources (DENR) and the provincial government of Davao D’Oro for accelerated rehabilitation of this mine-waste contaminated river.


Mr. Corrado De Gasperis, Executive Chairman and CEO stated, “The MCU team has the Comstock system installed and ready for operation while the second system is en route to Davao. We expect the arrival of the second system into Davao City next week and we are coordinating start up activities with our joint venture partner. We are excited to commence operations, remediate mercury, prove efficacy, and generate sustained growth and positive cash flows.”

About Comstock Mining Inc.

Comstock Mining Inc. is a Nevada-based, gold and silver mining company with extensive, contiguous property in the Comstock District and is an emerging leader in sustainable, responsible mining that is currently commercializing environment-enhancing, precious-metal-based technologies, products and processes for precious metal recovery. The Company began acquiring properties in the Comstock District in 2003. Since then, the Company has consolidated a significant portion of the Comstock District, amassed the single largest known repository of historical and current geological data on the Comstock region, secured permits, built an infrastructure and completed its first phase of production. The Company continues evaluating and acquiring properties inside and outside the district expanding its footprint and exploring all of our existing and prospective opportunities for further exploration, development and mining. The Company’s goal is to grow per-share value by commercializing environment-enhancing, precious-metal-based products and processes that generate predictable cash flow (throughput) and increase the long-term enterprise value of our northern Nevada based platform.

Forward-Looking Statements

This press release and any related calls or discussions may include forward-looking statements within the meaning of Section 27A of the Securities Act of 1933, as amended, and Section 21E of the Securities Exchange Act of 1934, as amended. All statements, other than statements of historical facts, are forward-looking statements. The words “believe,” “expect,” “anticipate,” “estimate,” “project,” “plan,” “should,” “intend,” “may,” “will,” “would,” “potential” and similar expressions identify forward-looking statements, but are not the exclusive means of doing so. Forward-looking statements include statements about matters such as: consummation of all pending transactions; project, asset or Company valuations; future industry market conditions; future explorations, acquisitions, investments and asset sales; future performance of and closings under various agreements; future changes in our exploration activities; future estimated mineral resources; future prices and sales of, and demand for, our products; future impacts of land entitlements and uses; future permitting activities and needs therefor; future production capacity and operations; future operating and overhead costs; future capital expenditures and their impact on us; future impacts of operational and management changes (including changes in the board of directors); future changes in business strategies, planning and tactics and impacts of recent or future changes; future employment and contributions of personnel, including consultants; future land sales, investments, acquisitions, joint ventures, strategic alliances, business combinations, operational, tax, financial and restructuring initiatives; the nature and timing of and accounting for restructuring charges and derivative liabilities and the impact thereof; contingencies; future environmental compliance and changes in the regulatory environment; future offerings of equity or debt securities; the possible redemption of debentures and associated costs; future working capital, costs, revenues, business opportunities, debt levels, cash flows, margins, earnings and growth.

These statements are based on assumptions and assessments made by our management in light of their experience and their perception of historical and current trends, current conditions, possible future developments and other factors they believe to be appropriate. Forward-looking statements are not guarantees, representations or warranties and are subject to risks and uncertainties, many of which are unforeseeable and beyond our control and could cause actual results, developments and business decisions to differ materially from those contemplated by such forward-looking statements. Some of those risks and uncertainties include the risk factors set forth in our filings with the SEC and the following: counterparty risks; capital markets’ valuation and pricing risks; adverse effects of climate changes or natural disasters; global economic and capital market uncertainties; the speculative nature of gold or mineral exploration, including risks of diminishing quantities or grades of qualified resources; operational or technical difficulties in connection with exploration or mining activities; contests over title to properties; potential dilution to our stockholders from our stock issuances and recapitalization and balance sheet restructuring activities; potential inability to comply with applicable government regulations or law; adoption of or changes in legislation or regulations adversely affecting businesses; permitting constraints or delays; decisions regarding business opportunities that may be presented to, or pursued by, us or others; the impact of, or the non-performance by parties under agreements relating to, acquisitions, joint ventures, strategic alliances, business combinations, asset sales, leases, options and investments to which we may be party; changes in the United States or other monetary or fiscal policies or regulations; interruptions in production capabilities due to capital constraints; equipment failures; fluctuation of prices for gold or certain other commodities (such as silver, zinc, cyanide, water, diesel fuel and electricity); changes in generally accepted accounting principles; adverse effects of terrorism and geopolitical events; potential inability to implement business strategies; potential inability to grow revenues; potential inability to attract and retain key personnel; interruptions in delivery of critical supplies, equipment and raw materials due to credit or other limitations imposed by vendors or others; assertion of claims, lawsuits and proceedings; potential inability to satisfy debt and lease obligations; potential inability to maintain an effective system of internal controls over financial reporting; potential inability or failure to timely file periodic reports with the SEC; potential inability to list our securities on any securities exchange or market; inability to maintain the listing of our securities; and work stoppages or other labor difficulties. Occurrence of such events or circumstances could have a material adverse effect on our business, financial condition, results of operations or cash flows or the market price of our securities. All subsequent written and oral forward-looking statements by or attributable to us or persons acting on our behalf are expressly qualified in their entirety by these factors. Except as may be required by securities or other law, we undertake no obligation to publicly update or revise any forward-looking statements, whether as a result of new information, future events, or otherwise.

Neither this press release nor any related calls or discussions constitutes an offer to sell, the solicitation of an offer to buy or a recommendation with respect to any securities of the Company, the fund or any other issuer.


Contact information

Comstock Mining Inc.
1200 American Flat Rd
PO Box 1118
Virginia City, NV 89440
http://www.comstockmining.com

Corrado De Gasperis
Executive Chairman & CEO
Tel (775) 847-4755
degasperis@comstockmining.com

Zach Spencer
Director of External Relations
Tel (775) 847-5272 ext.151
questions@comstockmining.com

Release – Ely Gold Royalties Options the Aurora West Property, Nevada to Goldcliff Resources

Ely Gold Royalties (TSX-V:ELY, OTCQX:ELYGF) Options the Aurora West Property, Nevada to Goldcliff Resources

Historic District Includes Operating Mill


Vancouver, British Columbia, Canada, October 8, 2020. Ely Gold Royalties Inc. (TSX-V:ELY, OTCQX:ELYGF) (“Ely Gold” or the “Company”) through its wholly owned subsidiary, Nevada Select Royalty, Inc. (“Nevada Select”), has entered into an option agreement with Goldcliff Resource (US) Inc., a wholly owned subsidiary of Goldcliff Resource Corporation (collectively “Goldcliff”) (TSX-V:GCN, OTCBB:GCFFF) whereby Goldcliff will have the option to acquire a 100% interest in the Aurora West Property located in Mineral County, Nevada (the “Option Agreement”). The Option Agreement was executed on October 7, 2020 (“the “Closing”) and does not require any additional approvals. Nevada Select will retain a two percent (2%) net smelter return royalty (“NSR”)

The Option Agreement

  1. paying Nevada Select US$25,000 at Closing;
  2. paying the Third-Party US$50,000 on September 23, 2021;
  3. paying the Third-Party US$135,000 on September 23, 2021 (at which point Nevada Select will take possession of the Aurora West Property from the Third-Party)
  4. making a final payment of US$200,000 to Nevada Select on the fourth anniversary of Closing.

In addition, Goldcliff will reimburse Nevada Select US$9,039 for 2020 claim fees at Closing.

The Third-Party will retain a 1% NSR. The private company royalty may be bought down by 0.5% at any time by payment of US$1,000,000. Nevada Select will retain a 2% NSR with no buydowns. The Option Agreement will include a one (1) mile area of interest. There are no work commitments associated with the Option Agreement.

The Aurora West Property

The Aurora West property consists of 51 claims and is contiguous with the northwest portion of the main Aurora district claims held by Hecla Mining Company. Nevada Select is currently optioning the Aurora West Property from a private company (the “Third-Party”). Hecla’s holdings include a fully permitted, recently operated 350 TPD mill.

The Aurora district has historically produced gold from low sulfidation, quartz-adularia bonanza veins. Bonanza grades were mined where these north-east structures were intersected by north-south structures. On the Aurora West claims, the Sawtooth Ridge target is located immediately northwest of the northernmost bonanza vein deposits in the Aurora district. The target consists of a large 1.5 square mile area of highlevel opaline, chalcedonic silica and argillic alteration, hosted by rhyolitic tuffs, flows and shallow intrusive domes. A series of northeast and north trending faults transect the area.

Qualified Person

Stephen Kenwood, P. Geo, is director of the Company and a Qualified Person as defined by NI 43-101. Mr. Kenwood has reviewed and approved the technical information in this press release.

About Ely Gold Royalties Inc.

Ely Gold Royalties Inc. is a Nevada focused gold royalty company. Its current portfolio includes royalties at Jerritt Canyon, Goldstrike and Marigold, three of Nevada’s largest gold mines, as well as the Fenelon mine in Quebec, operated by Wallbridge Mining. The Company continues to actively seek opportunities to purchase producing or nearterm producing royalties. Ely Gold also generates development royalties through property sales on projects that are located at or near producing mines. Management believes that due to the Company’s ability to locate and purchase third-party royalties, its strategy of organically creating royalties and its gold focus, Ely Gold offers shareholders a favourable leverage to gold prices and low-cost access to long-term gold royalties in safe mining jurisdictions.

On Behalf of the Board of Directors
Signed “Trey Wasser”
Trey Wasser, President & CEO

For further information, please contact:

Trey Wasser, President & CEO
trey@elygoldinc.com
972-803-3087

Joanne Jobin, Investor Relations Officer
jjobin@elygoldinc.com
647-964-0292

FORWARD-LOOKING CAUTIONS: This press release contains certain “forward-looking statements” within the meaning of Canadian securities legislation, including, but not limited to, statements regarding completion of the Transaction. Forward-looking statements are statements that are not historical facts; they are generally, but not always, identified by the words “expects,” “plans,” “anticipates,” “believes,” “intends,” “estimates,” “projects,” “aims,” “potential,” “goal,” “objective,” “prospective,” and similar expressions, or that events or conditions “will,” “would,” “may,” “can,” “could” or “should” occur, or are those statements, which, by their nature, refer to future events. The Company cautions that forward-looking statements are based on the beliefs, estimates and opinions of the Company’s management on the date the statements are made and they involve a number of risks and uncertainties. Consequently, there can be no assurances that such statements will prove to be accurate and actual results and future events could differ materially from those anticipated in such statements. Except to the extent required by applicable securities laws and the policies of the TSX Venture Exchange, the Company undertakes no obligation to update these forward-looking statements if management’s beliefs, estimates or opinions, or other factors, should change. Factors that could cause future results to differ materially from those anticipated in these forward-looking statements include the Company’s inability to control whether the buy-down right will ever be exercised, and whether the right of first refusal will ever be triggered, uncertainty as to whether any mining will occur on the property covered by the Probe Royalty such that the Company will receive any payment therefrom, and the general risks and uncertainties relating to the mineral exploration, development and production business. The reader is urged to refer to the Company’s reports, publicly available through the Canadian Securities Administrators’ System for Electronic Document Analysis and Retrieval (SEDAR) at www.sedar.com for a more complete discussion of such risk factors and their potential effect.

Neither the TSX Venture Exchange nor its Regulation Services Provider accepts responsibility for the adequacy or accuracy of this release.

Oil to Gas Price Ratio: Which Direction is it Headed?


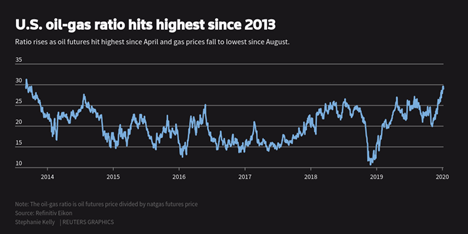
The Highest Ratio in 7 Years Between Oil and Gas Prices


A barrel of oil consists of 42 gallons and provides 5,712,000 BTUs of energy.  An MCF (thousand cubic feet) of natural gas provides 1,037,000 BTUs of energy. Both measurements depend on prevailing temperature, pressure, and fuel content. Still, the idea that a barrel of oil provides the equivalent of roughly six times the energy of natural gas is a long-accepted principle.  Management from the Energy industry and analysts often convert oil to natural gas equivalent volumes by multiplying by six or convert natural gas volumes to oil equivalent volumes by dividing by six.

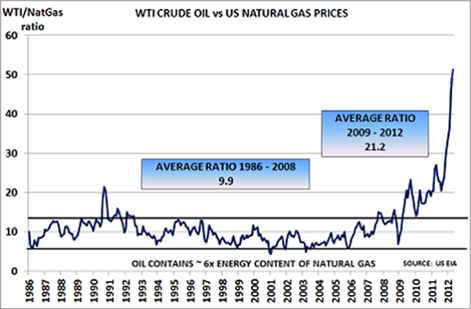
If oil and gas were interchangeable fuels, it stands to reason that consumers would buy oil when it was less than six times the price of natural gas and buy natural gas when it was less than one-sixth the price of oil.  The ratio between oil and gas prices, then, would generally remain somewhere near that six to one ratio.  Historically, that has been the case. It has only been within the last ten years that oil has started trading at levels above 15 times natural gas prices.


Oil and natural gas are not true substitutes.  Oil is used predominately as a source for gasoline, and natural gas is used mainly for heating homes and businesses. Consequently, it is not unusual for the oil-to-gas price ratio to vacillate away from a six times ratio. Such was the case in 2011-2012 when the ratio reached 50 times, and such was the case in 2020 when the ratio reached 30 times. 


The pandemic and resulting global economic slowdown have caused both oil and gas prices to fall.  Oil prices have been hit especially hard, even dropping into the negative territory during April. Today, the ratio between oil and gas spot prices and that of the forward-twelve-month strip is closer to 15 times, near the low end of the last decade’s trading range.

So, is the current ratio the new norm? Or, Will the oil-to-gas price ratio rise back up to pre-pandemic levels near 30 times? Or, will the oil-to-gas price ratio revert back to historic levels below ten times and more in line with the ratio implied by the energy content of the fuels.


The Case for the Oil-to-Gas Ratio to Fall

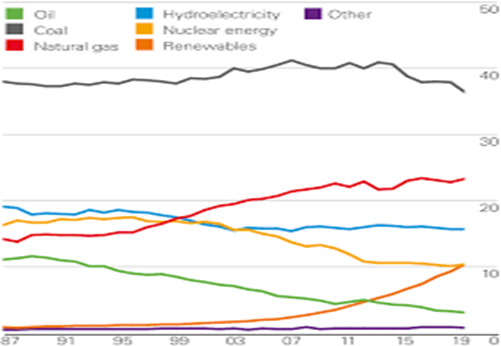
The demand for oil for power generation is declining. The only area where oil and gas compete directly on the margin has been for electric generation load. That was, to say, until around the turn of the century. With the growth of renewable fuels as a source of generation, natural gas has become the fossil fuel of choice for power generation.  There are reasons for that.  Natural gas generally fuels smaller turbine power loads that can be powered up or down more efficiently than oil or coal.  Flexible power generation is a better compliment to renewable-fuel generation that is not always consistent.


Source: BP Amoco

The demand for oil for gasoline may decline. Electric vehicles are coming.  About 5% of the cars sold are electric, and that percentage is rising a few base points each year with growth rates accelerating.  California has mandated that all new passenger trucks sold in the state must be emission-free by 2035. Corporate Average Fuel Economy (CAFÉ) standards continue to rise. The result will be a decreased demand for oil to supply gasoline.

The pandemic is altering how people work and play. As people work and spend more time at home, there has been a surge in house sales and new home construction.  People want better and bigger houses. That could lead to an increase in natural gas demand and, thus, prices.  At the same time, people are commuting to work less often and spending less time driving to recreational events. This has reduced the demand for oil. The resulting decrease in demand for oil relative to gas could mean a lower oil-to-gas price ratio.


The Case for the Oil-to-Gas Price Ratio is Rising

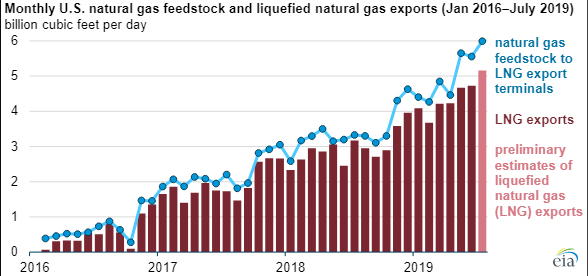
Natural gas is becoming a more global fuel. Historically, oil prices were set by the global market, while natural gas prices were set by domestic supply and demand.  In recent years, natural gas has become a more global product with the growth of liquified natural gas (LNG) export terminals. The United States now exports more natural gas than it imports.  The chart below shows the rapid growth of U.S. LNG exports in recent years.


OPEC Has Gained Power to Set Oil Prices OPEC, led by Saudi Arabia, has become more active in controlling output levels and maintaining oil prices.  Should it continue to do so, it may support oil prices near current levels, even as natural gas prices continue to fall with production technological advances.  The result would be a higher oil-to-gas price ratio.


Conclusion

The historical ratio between oil and gas prices has been broken in recent years as the fuels are used less outside their primary markets. It is unreasonable to expect the ratio to return to six times just because the relative energy content says that what the ratio should be.  On the other hand, the long term outlook for oil demand relative to gas demand argues for the ratio declining from its current level.


Suggested Reading:

Have Wind and Solar Made Hydro-Power Irrelevant?

Mergers Within The Energy Industry are Heating Up

Exploration and Production: 2020-3Q Review and Outlook


Enjoy Premium Channelchek Content at No Cost


Each event in our popular Virtual Road Shows Series has maximum capacity of 100 investors online. To take part, listen to and perhaps get your questions answered, see which virtual investor meeting intrigues you here.


Sources:

https://en.wikipedia.org/wiki/Corporate_average_fuel_economy#:~:text=The%20Corporate%20Average%20Fuel%20Economy,sale%20in%20the%20United%20States, Wikipedia

https://www.cnn.com/2020/10/03/cars/california-2035-zev-mandate/index.html, Peter Valdes-Dapena, CNN, October 3, 2020

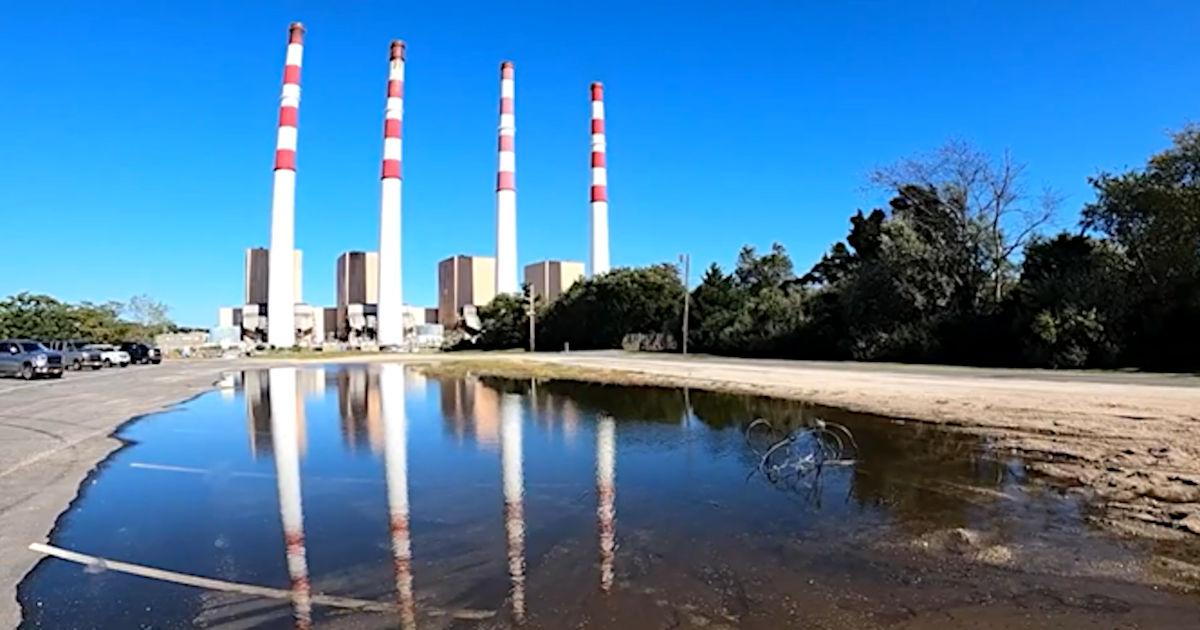
Photo: A natural gas and conventional oil electric power generating station located on the north shore of Long Island (Northport).

Troilus Discovers New Goldfield Boulder Zone 36 Km from Troilus Mine

Troilus Discovers New Goldfield Boulder Zone 36 Km from Troilus Mine with Samples up to 26.2 g/t Gold and 27.8 g/t Silver


October 8, 2020, Toronto, Ontario – Troilus Gold Corp. (TSX: TLG) (OTCQB: CHXMF) (“Troilus” or the “Company”) is pleased to announce the latest results from its summer 2020 regional exploration program on its 100%-owned Troilus Project, located within the Frôtet-Evans Greenstone Belt of northern Quebec. The program focused on identifying high priority targets within the extensive land package Troilus acquired and staked earlier in the year (the “Troilus-Frôtet Property”) (see press releases dated April 28, 2020 and July 21, 2020). Initial results collected 28 km southwest of the recently announced Beyan Gold Zone Discovery (see press release dated September 30, 2020), have outlined another new zone of mineralization: the Goldfield Boulder Zone (“Goldfield”). Gold bearing boulders and outcrop can be traced and defined in situ over a minimum strike length of 4 km. Goldfield is accessible from the Route du Nord highway.

Highlights from the New Goldfield Zone:

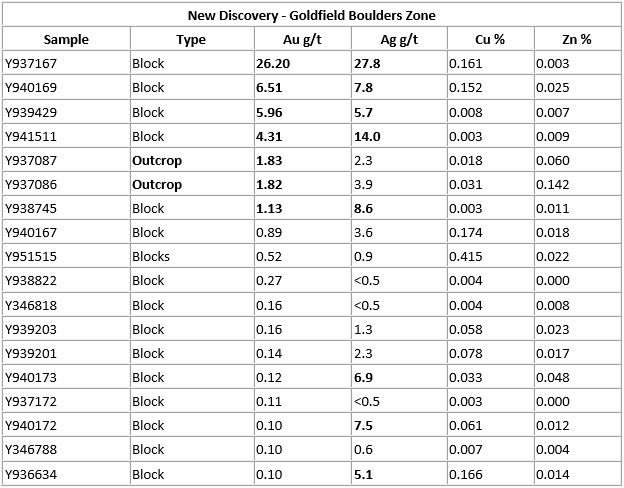
  • Grab samples returned up to 26.2 g/t gold and 27.8 g/t silver in outcrop
  • Other sample highlights include: 6.51 g/t Au, 5.96 g/t Au, 4.31 g/t Au; 14.0 g/t Ag, 8.6 g/t Ag (see full results in Table 1)
  • Many geological characteristics linking Goldfield to the main mineralized zones over 36 km away

“The discovery of the Goldfield Zone this summer marks an exciting moment for Troilus,” said Justin Reid, CEO of Troilus. “Earlier this year we had the opportunity to significantly increase our land holdings through a combination of acquisition and staking. The addition of the Troilus-Frôtet Property increased our land holdings from 16,000 hectares to over 107,000 hectares. Our evolving geologic model, developed over the last couple of years through drilling and exploration around the main ore bodies of Z87, the J Zones and more recently the Southwest Zone, led us to believe that the region could have district scale potential and we believed that expanding our claim area had the potential to add significant value for shareholders via discovery. The Goldfield Zone, located on the western side of the Troilus-Frôtet Property, marks the furthest afield exploration conducted to date. We are thrilled to report newly discovered, near-surface gold occurrences with samples ranging up to 26.2 g/t gold and 27.8 g/t silver, 36 km from the main mineralized zones at the Troilus property. The Goldfield Zone results, combined with the recent Beyan Zone results, suggest that gold mineralization within the Frôtet-Evans Greenstone Belt is prolific and not constrained geographically as historically thought. We await further results from locations across the Troilus-Frotêt Property collected during the summer and believe that these showings could just be the beginning of what the district could host.”

During this initial bedrock mapping and boulder tracing, the Troilus Geological team located several mineralized boulders on the main Tortigny block assaying up to 26 g/t Au with the best results highighted in the Table 1 below. The Tortigny deposit (see Figure 2), now 100% owned by Troilus, was discovered by Noranda in 1994 with an initial mineral resource estimate prepared in 1997. The latest NI 43-101 compliant mineral resource completed by Beaufield Resources in 2014, estimates measured and indicated resources of 1.1 million tonnes grading 1.8% Cu, 3.65% Zn, 48.51 g/t Ag and 0.35 g/t Au and inferred mineral resources of 99,000 tonnes grading 1.19% Cu, 1.23% Zn, 12.45 g/t Ag and <0.1 g/t Au. The Tortigny mineral resource includes 135 drill holes (34,581 metres) and covers a distance of approximately 600 metres. (The Technical Report for the Tortigny deposit titled: “TECHNICAL REPORT FOR THE TORTIGNY POLYMETALLIC PROJECT SOUTHERN JAMES BAY MUNICIPALITY QUEBEC, CANADA” and effective June 2, 2014, was completed by Micon International Limited and can be found on Beaufield Resources SEDAR profile at www.sedar.com). A qualified person has not done sufficient work to classify the historical estimates as a current mineral resource estimate. Troilus is not treating the historical estimates as current estimates and the historical estimates should not be relied upon as current mineral resource estimates. Further drilling would be required to verify the historical estimate.

Several of these boulders are large (up to 3m in length) and sub-angular, indicating a possible nearby source. These blocks were collected over a distance of 4 km from north to south. There is denser vegetation in this area so outcrops are not as exposed. Nevertheless, one nearby outcrop, located 200m north of the Goldfield Zone ran 1.8 g/t Au, suggesting further exploration is warranted beyond the current boundaries of this new zone. Mafic intrusive and felsic volcanic rocks are the main lithologies hosting these gold and silver gold showings. These units are strongly deformed and altered.

Results for approximately 85 samples are still pending from a total 440 samples that were collected in the vicinity of the Goldfield showing. The Troilus Geological team shipped over 1000 soil samples (B-Horizon) to the lab and results for these are also pending.

Troilus remains underexplored and highly prospective. Extensive field exploration work undertaken this summer across the +107,000 hectare Troilus property is currently being compiled to identify new prospective targets. Further assays of samples collected in the field are pending and will be updated in due course.

Figure 1 – Troilus Property, Regional Geology and Location of the New Goldfield Zone
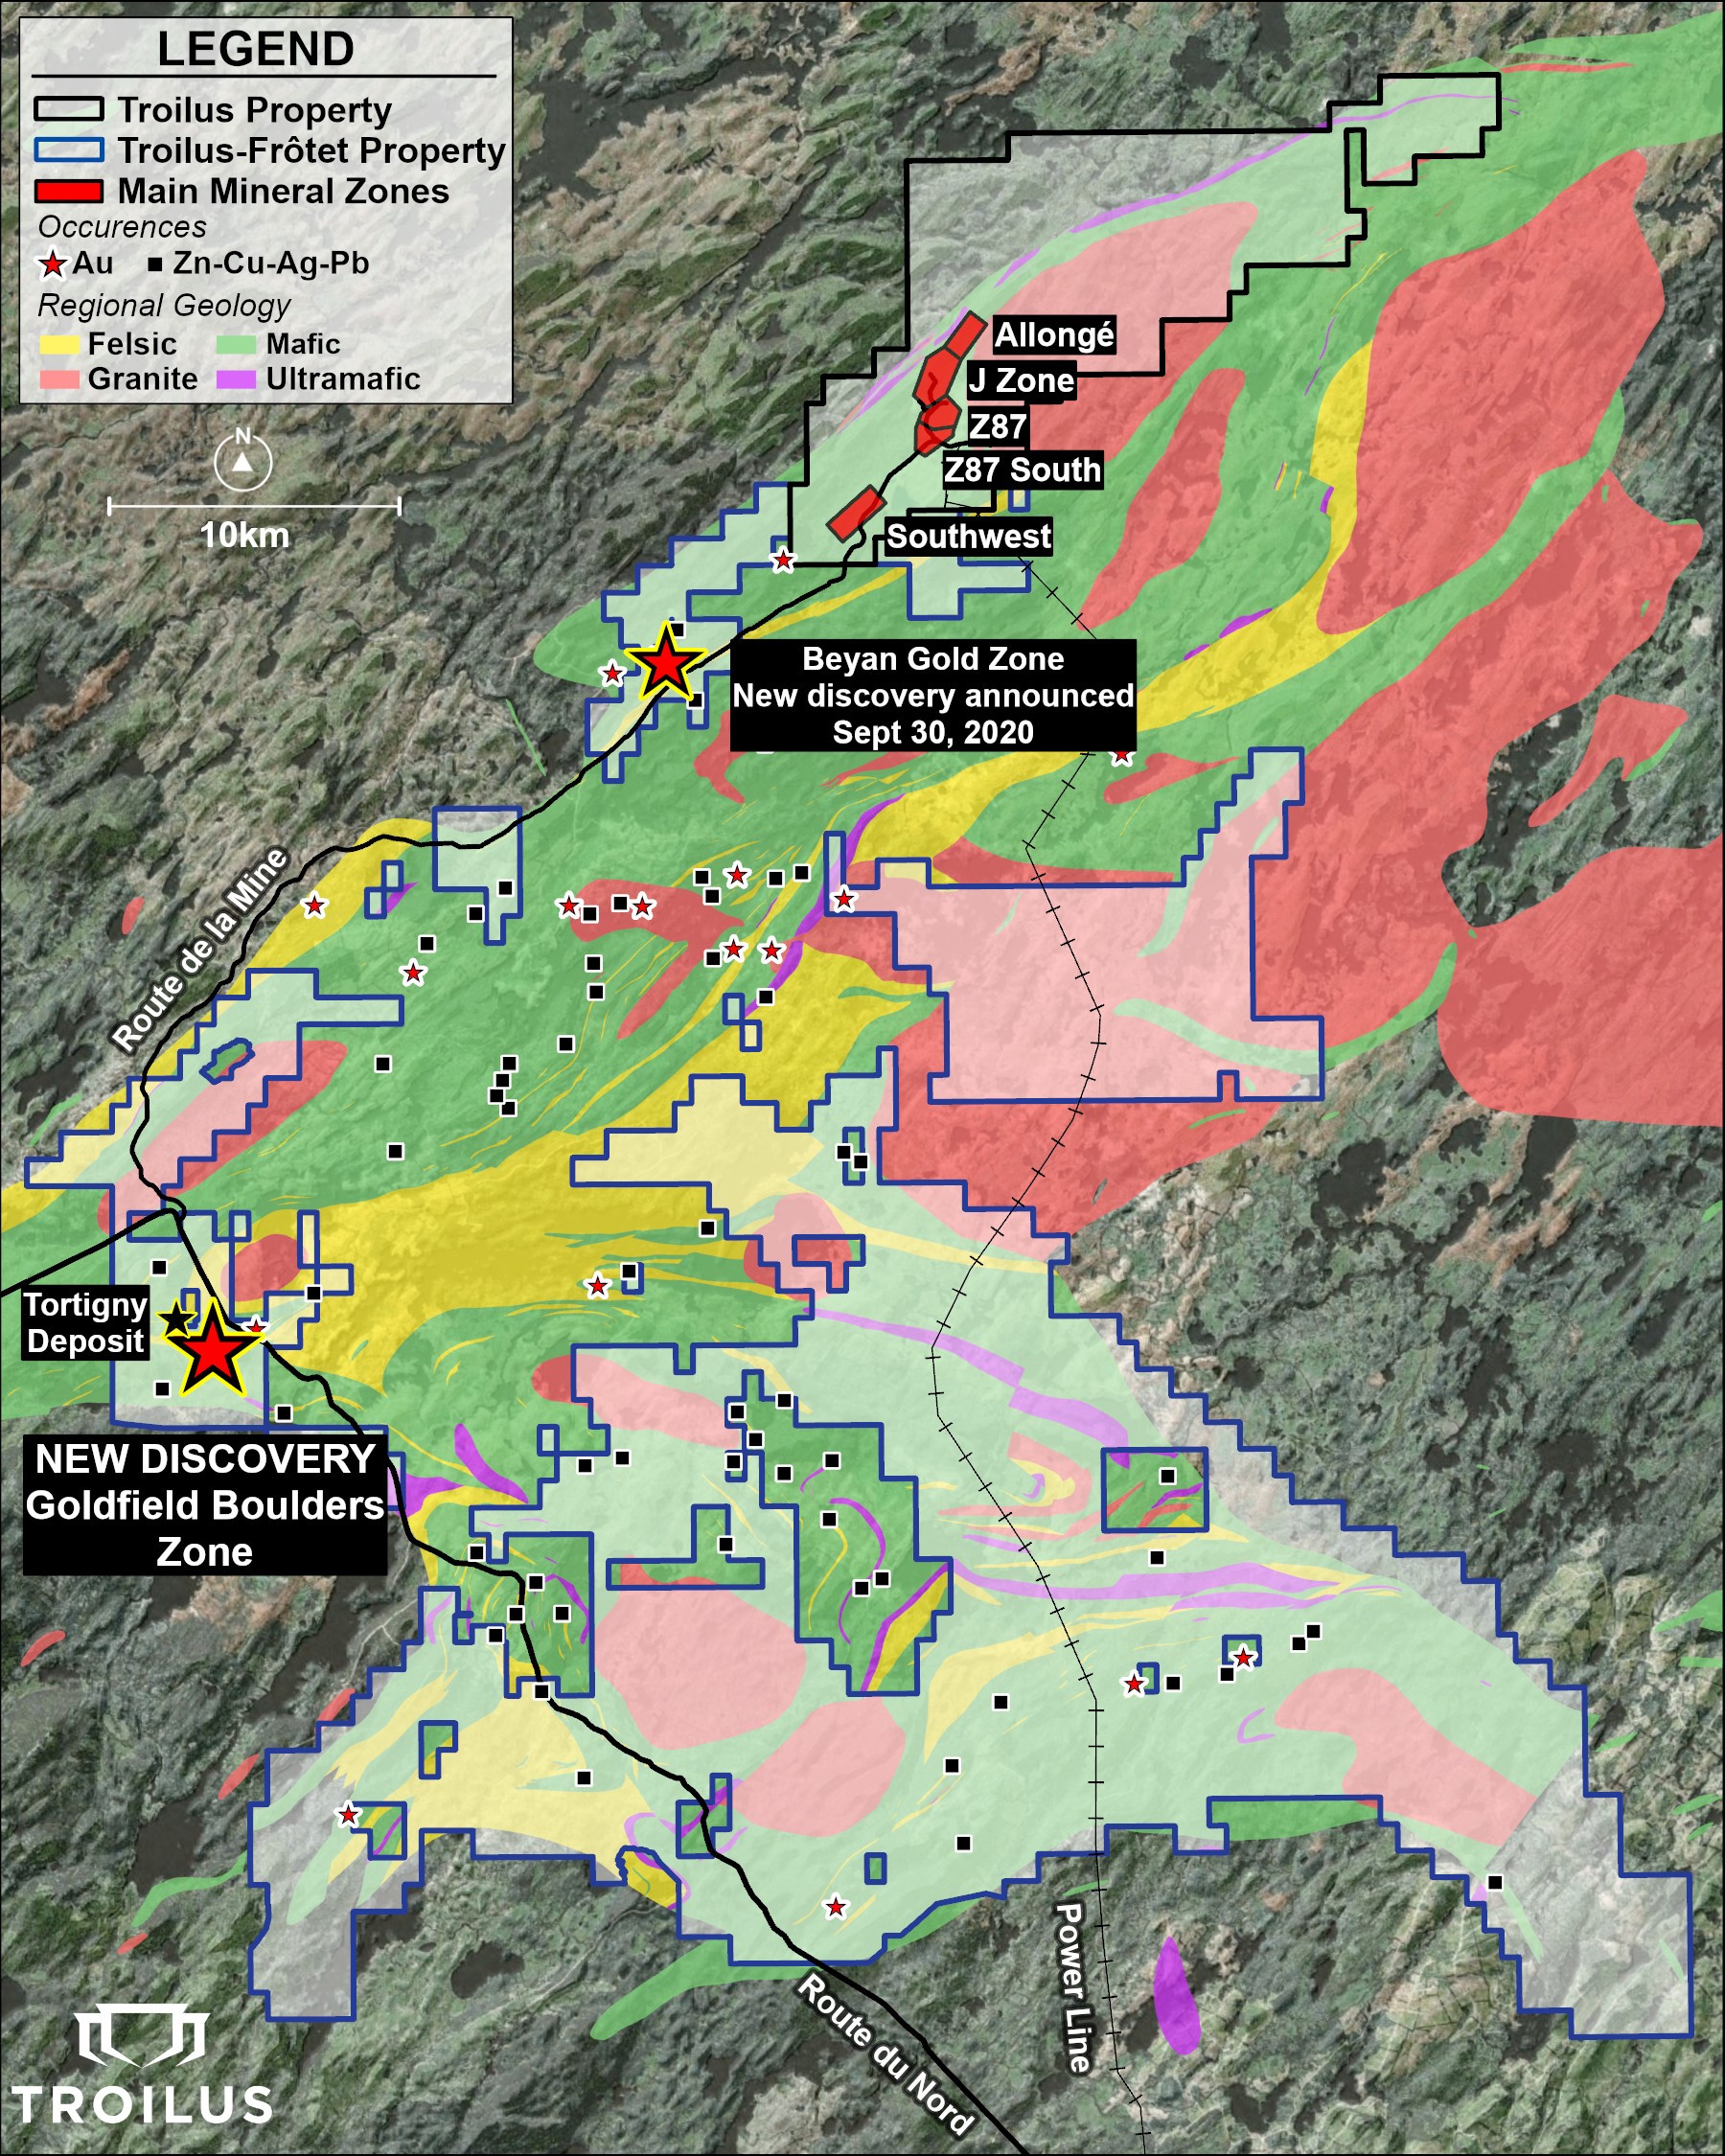
 

Figure 2 – Close-up of the Goldfield Boulder Zone
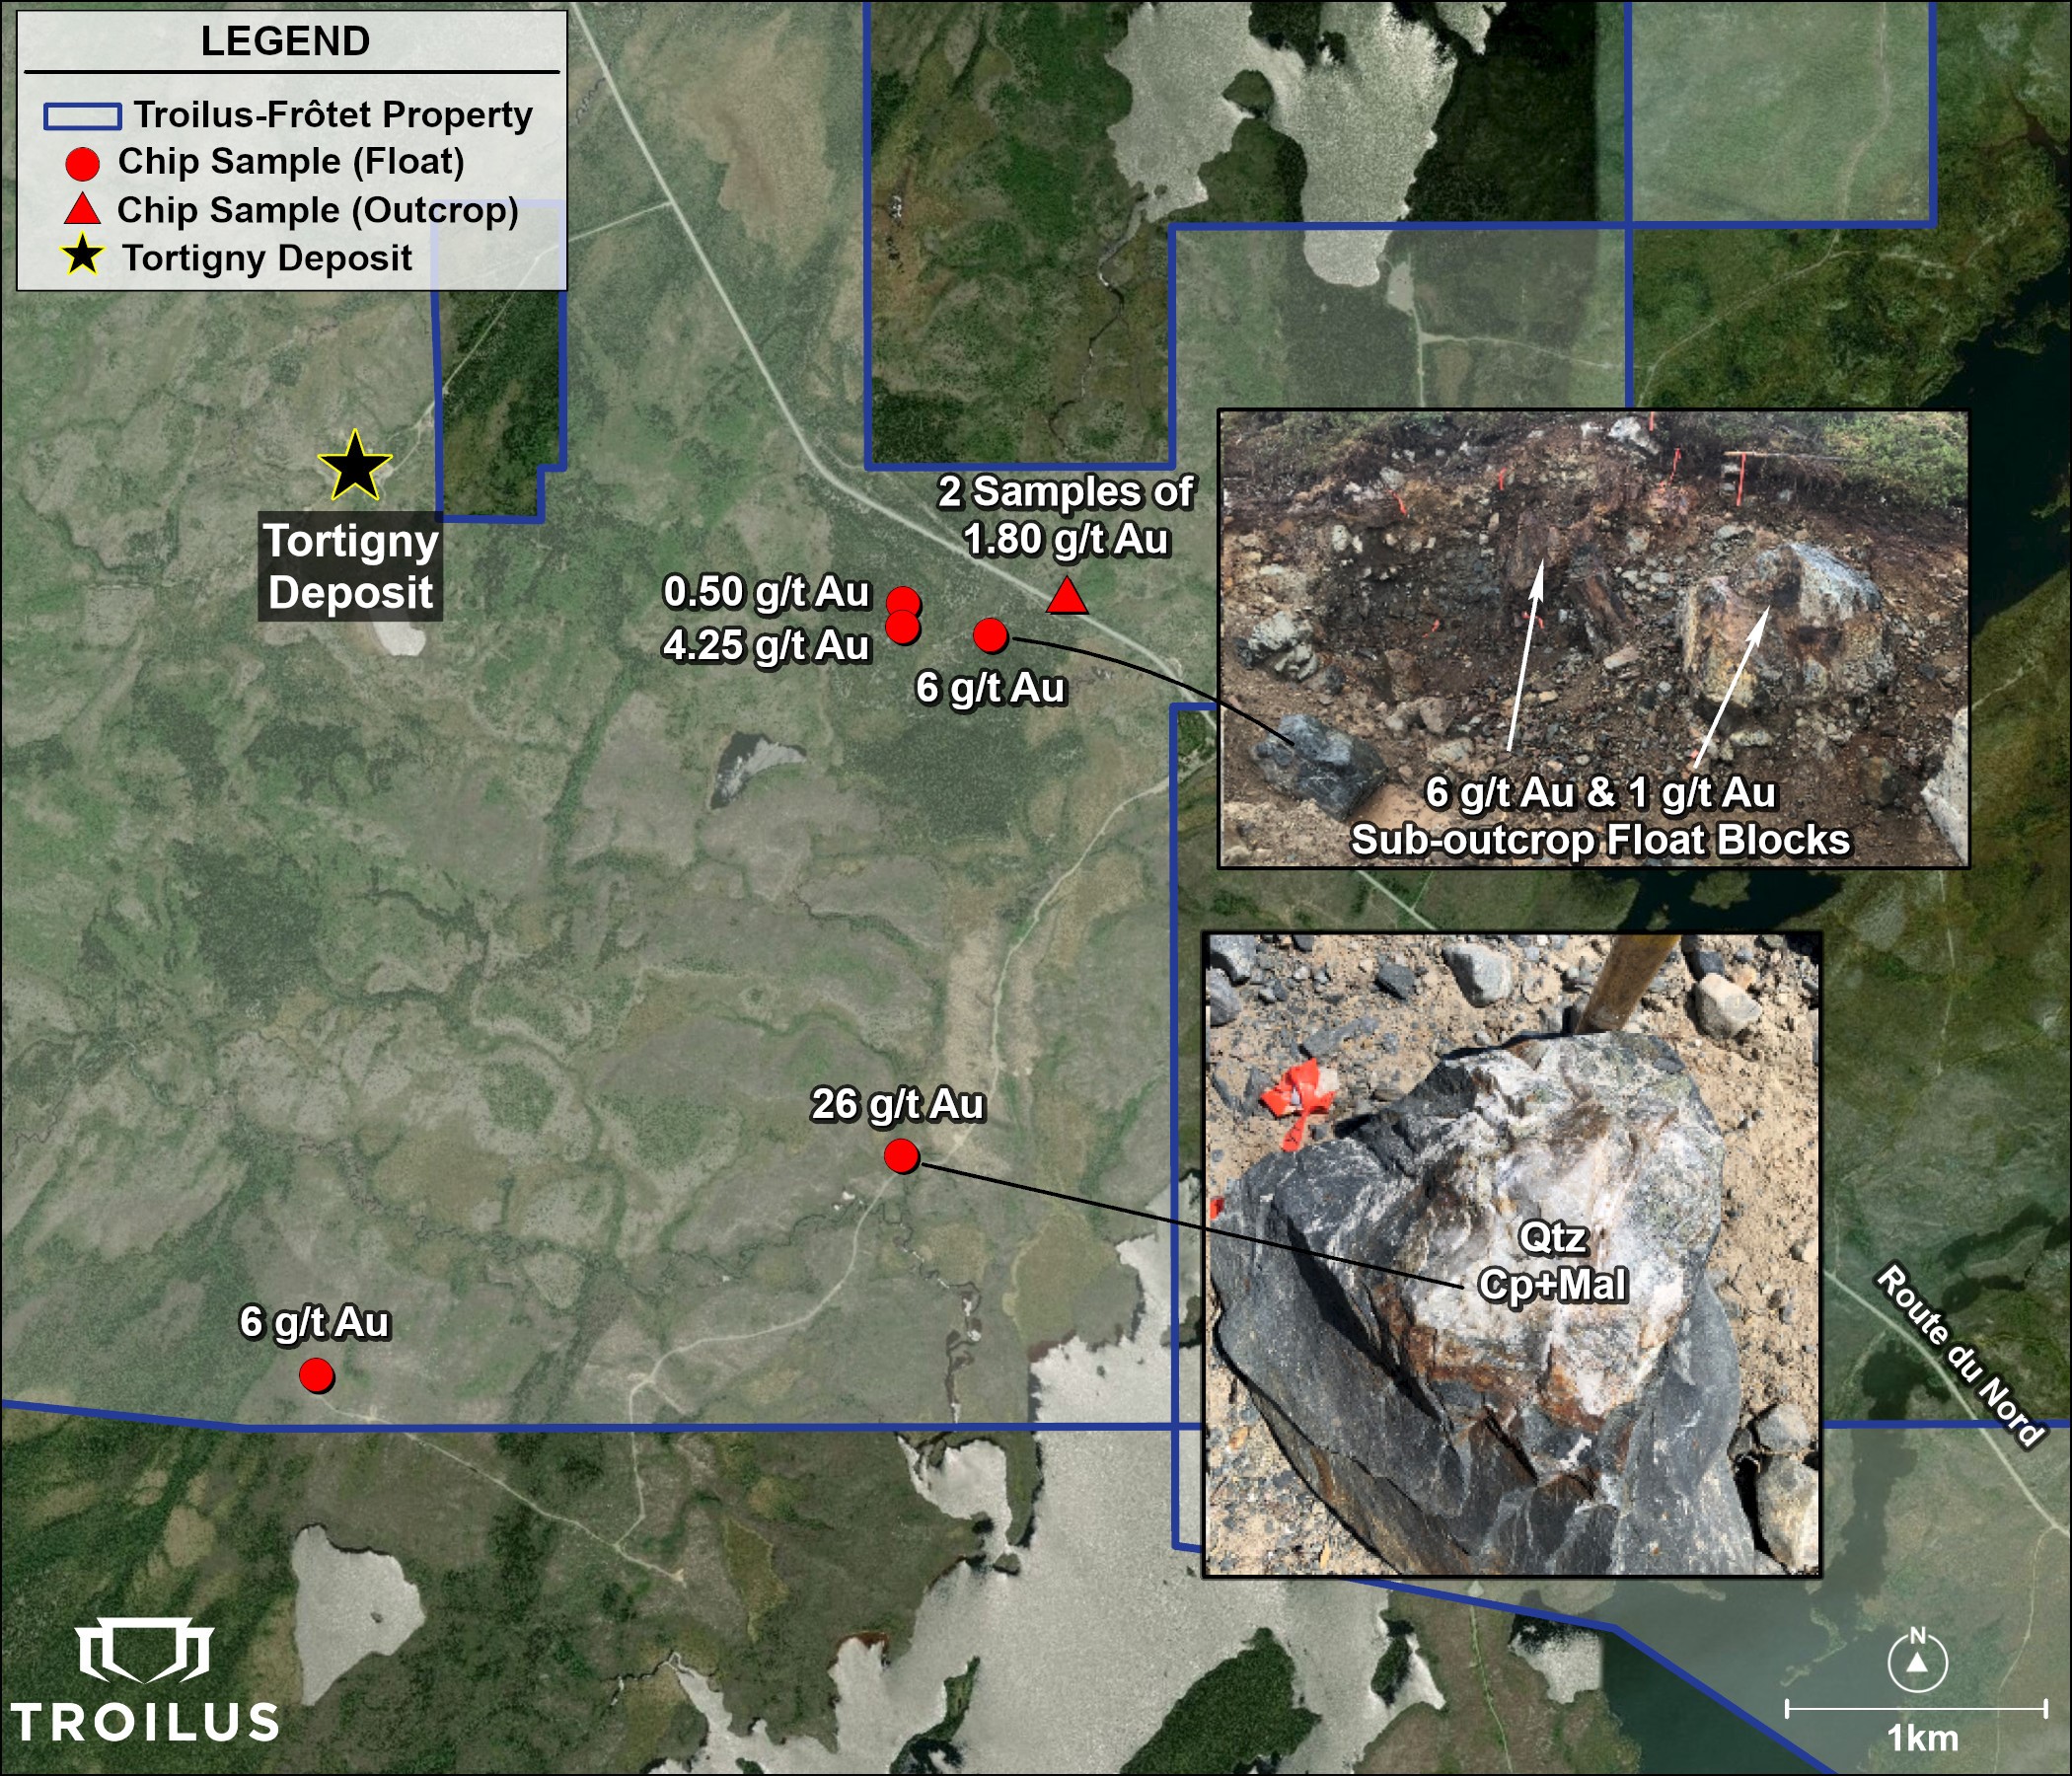
 

Table 1 – New Beyan Gold Zone Initial Surface Sample Results
 

Quality Assurance and Control

All grab and ship samples were collected by hand and were located by hand-held GPS, bagged and sealed, and sent for assaying at ALS Laboratory, a certified commercial laboratory. Every sample was processed with standard crushing to 85% passing 75 microns on 500 g splits. Samples were assayed by one-AT (30 g) fire assay with an AA finish and if results were higher than 3.5 g/t Au, assays were redone with a gravimetric finish. In addition to gold, ALS carried out multi-element analysis for ME-ICP61 analysis of 33 elements four acid ICP-AES.

Qualified Person

All technical and scientific information, in this press release has been reviewed and approved by Bertrand Brassard, M.Sc., P.Geo., Chief Geologist, who is a Qualified Person as defined by NI 43-101. Mr. Brassard is an employee of Troilus and is not independent of the Company under NI 43-101.

About Troilus Gold Corp.

Troilus is a Toronto-based, Quebec focused, advanced stage exploration and early-development company focused on the mineral expansion and potential mine re-start of the former gold and copper Troilus mine. The 107,326 hectare Troilus property is located within the Frotêt-Evans Greenstone Belt in Quebec, Canada. From 1996 to 2010, Inmet Mining Corporation operated the Troilus project as an open pit mine, producing more than 2,000,000 ounces of gold and nearly 70,000 tonnes of copper.

For more information:

Justin Reid
Chief Executive Officer
+1 (647) 276-0050 x 1305
Justin.reid@troilusgold.com

Paul Pint
President
+1 (416) 602-1050
paul.pint@troilusgold.com

Cautionary Note Regarding Forward-Looking Statements and Information

Mineral Resources that are not Mineral Reserves do not have demonstrated economic viability; the estimate of Mineral Resources in the updated Mineral Resource statement may be materially affected by environmental, permitting, legal, title, taxation, socio-political, marketing, or other relevant issues. There is no certainty that the Indicated Mineral Resources will be converted to the Probable Mineral Reserve category, and there is no certainty that the updated Mineral Resource statement will be realized.

This press release contains “forward-looking statements” within the meaning of applicable Canadian securities legislation. Forward-looking statements include, but are not limited to, statements regarding the impact of the planned drill program and results on the Company, the reliability of historical estimates and the likelihood that they will be updated to current mineral resource estimates, the possible economics of the project, the Company’s understanding of the project; the development potential and timetable of the project; the estimation of mineral resources; realization of mineral resource estimates; the timing and amount of estimated future exploration; the anticipated results of the Company’s 2020 drill program and their possible impact on the potential size of the mineral resource estimate; the impact of the novel coronavirus (COVID-19) and the considerable uncertainties about the geographic, social and economic impact on the Company of its continuing global spread costs of future activities; capital and operating expenditures; success of exploration activities; the anticipated ability of investors to continue benefiting from the Company’s low discovery costs, technical expertise and support from local communities.. Generally, forward-looking statements can be identified by the use of forward-looking terminology such as “plans”, “expects” or “does not expect”, “is expected”, “budget”, “scheduled”, “estimates”, “forecasts”, “intends”, “continue”, “anticipates” or “does not anticipate”, or “believes”, or variations of such words and phrases or statements that certain actions, events or results “may”, “could”, “would”, “will”, “might” or “will be taken”, “occur” or “be achieved”. Forward-looking statements are made based upon certain assumptions and other important facts that, if untrue, could cause the actual results, performances or achievements of Troilus to be materially different from future results, performances or achievements expressed or implied by such statements. Such statements and information are based on numerous assumptions regarding present and future business strategies and the environment in which Troilus will operate in the future. Certain important factors that could cause actual results, performances or achievements to differ materially from those in the forward-looking statements include, amongst others, currency fluctuations, the global economic climate, dilution, share price volatility and competition. Forward-looking statements are subject to known and unknown risks, uncertainties and other important factors that may cause the actual results, level of activity, performance or achievements of Troilus to be materially different from those expressed or implied by such forward-looking statements, including but not limited to: the impact the COVID 19 pandemic may have on the Company’s activities (including without limitation on its employees and suppliers) and the economy in general; the impact of the recovery post COVID 19 pandemic and its impact on gold and other metals; there being no assurance that the exploration program or programs of the Company will result in expanded mineral resources; risks and uncertainties inherent to mineral resource estimates; the high degree of uncertainties inherent to preliminary economic assessments and other mining and economic studies which are based to a significant extent on various assumptions; variations in gold prices and other precious metals, exchange rate fluctuations; variations in cost of supplies and labour; receipt of necessary approvals; general business, economic, competitive, political and social uncertainties; future gold and other metal prices; accidents, labour disputes and shortages; environmental and other risks of the mining industry, including without limitation, risks and uncertainties discussed in the Technical Report to be filed and in other continuous disclosure documents of the Company available under the Company’s profile at www.sedar.com. Although Troilus has attempted to identify important factors that could cause actual results to differ materially from those contained in forward-looking statements, there may be other factors that cause results not to be as anticipated, estimated or intended. There can be no assurance that such statements will prove to be accurate, as actual results and future events could differ materially from those anticipated in such statements. Accordingly, readers should not place undue reliance on forward-looking statements. Troilus does not undertake to update any forward-looking statements, except in accordance with applicable securities laws.

Troilus Gold Corp.
36 Lombard Street, Floor 4
Toronto, Ontario
M5C 2X3
Canada

Tel: +1 647.276.0050
Email: info@troilusgold.com

Release – Canada Nickel – Final Three Infill Holes Confirm and Extend Higher Grade Mineralization at Crawford Nickel-Cobalt Sulphide Project

Canada Nickel’s Final Three Infill Holes Confirm and Extend Higher Grade Mineralization at Crawford Nickel-Cobalt Sulphide Project


Highlights

  • Final three infill holes in easternmost end of the Main Zone continue to confirm and extend higher grade mineralization

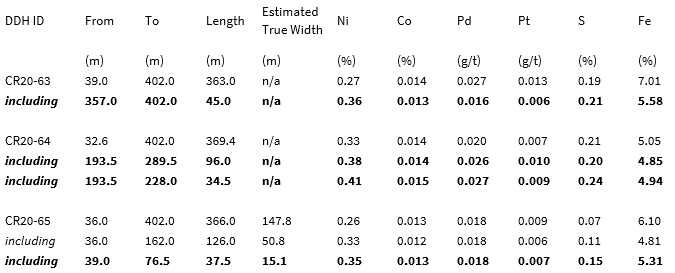
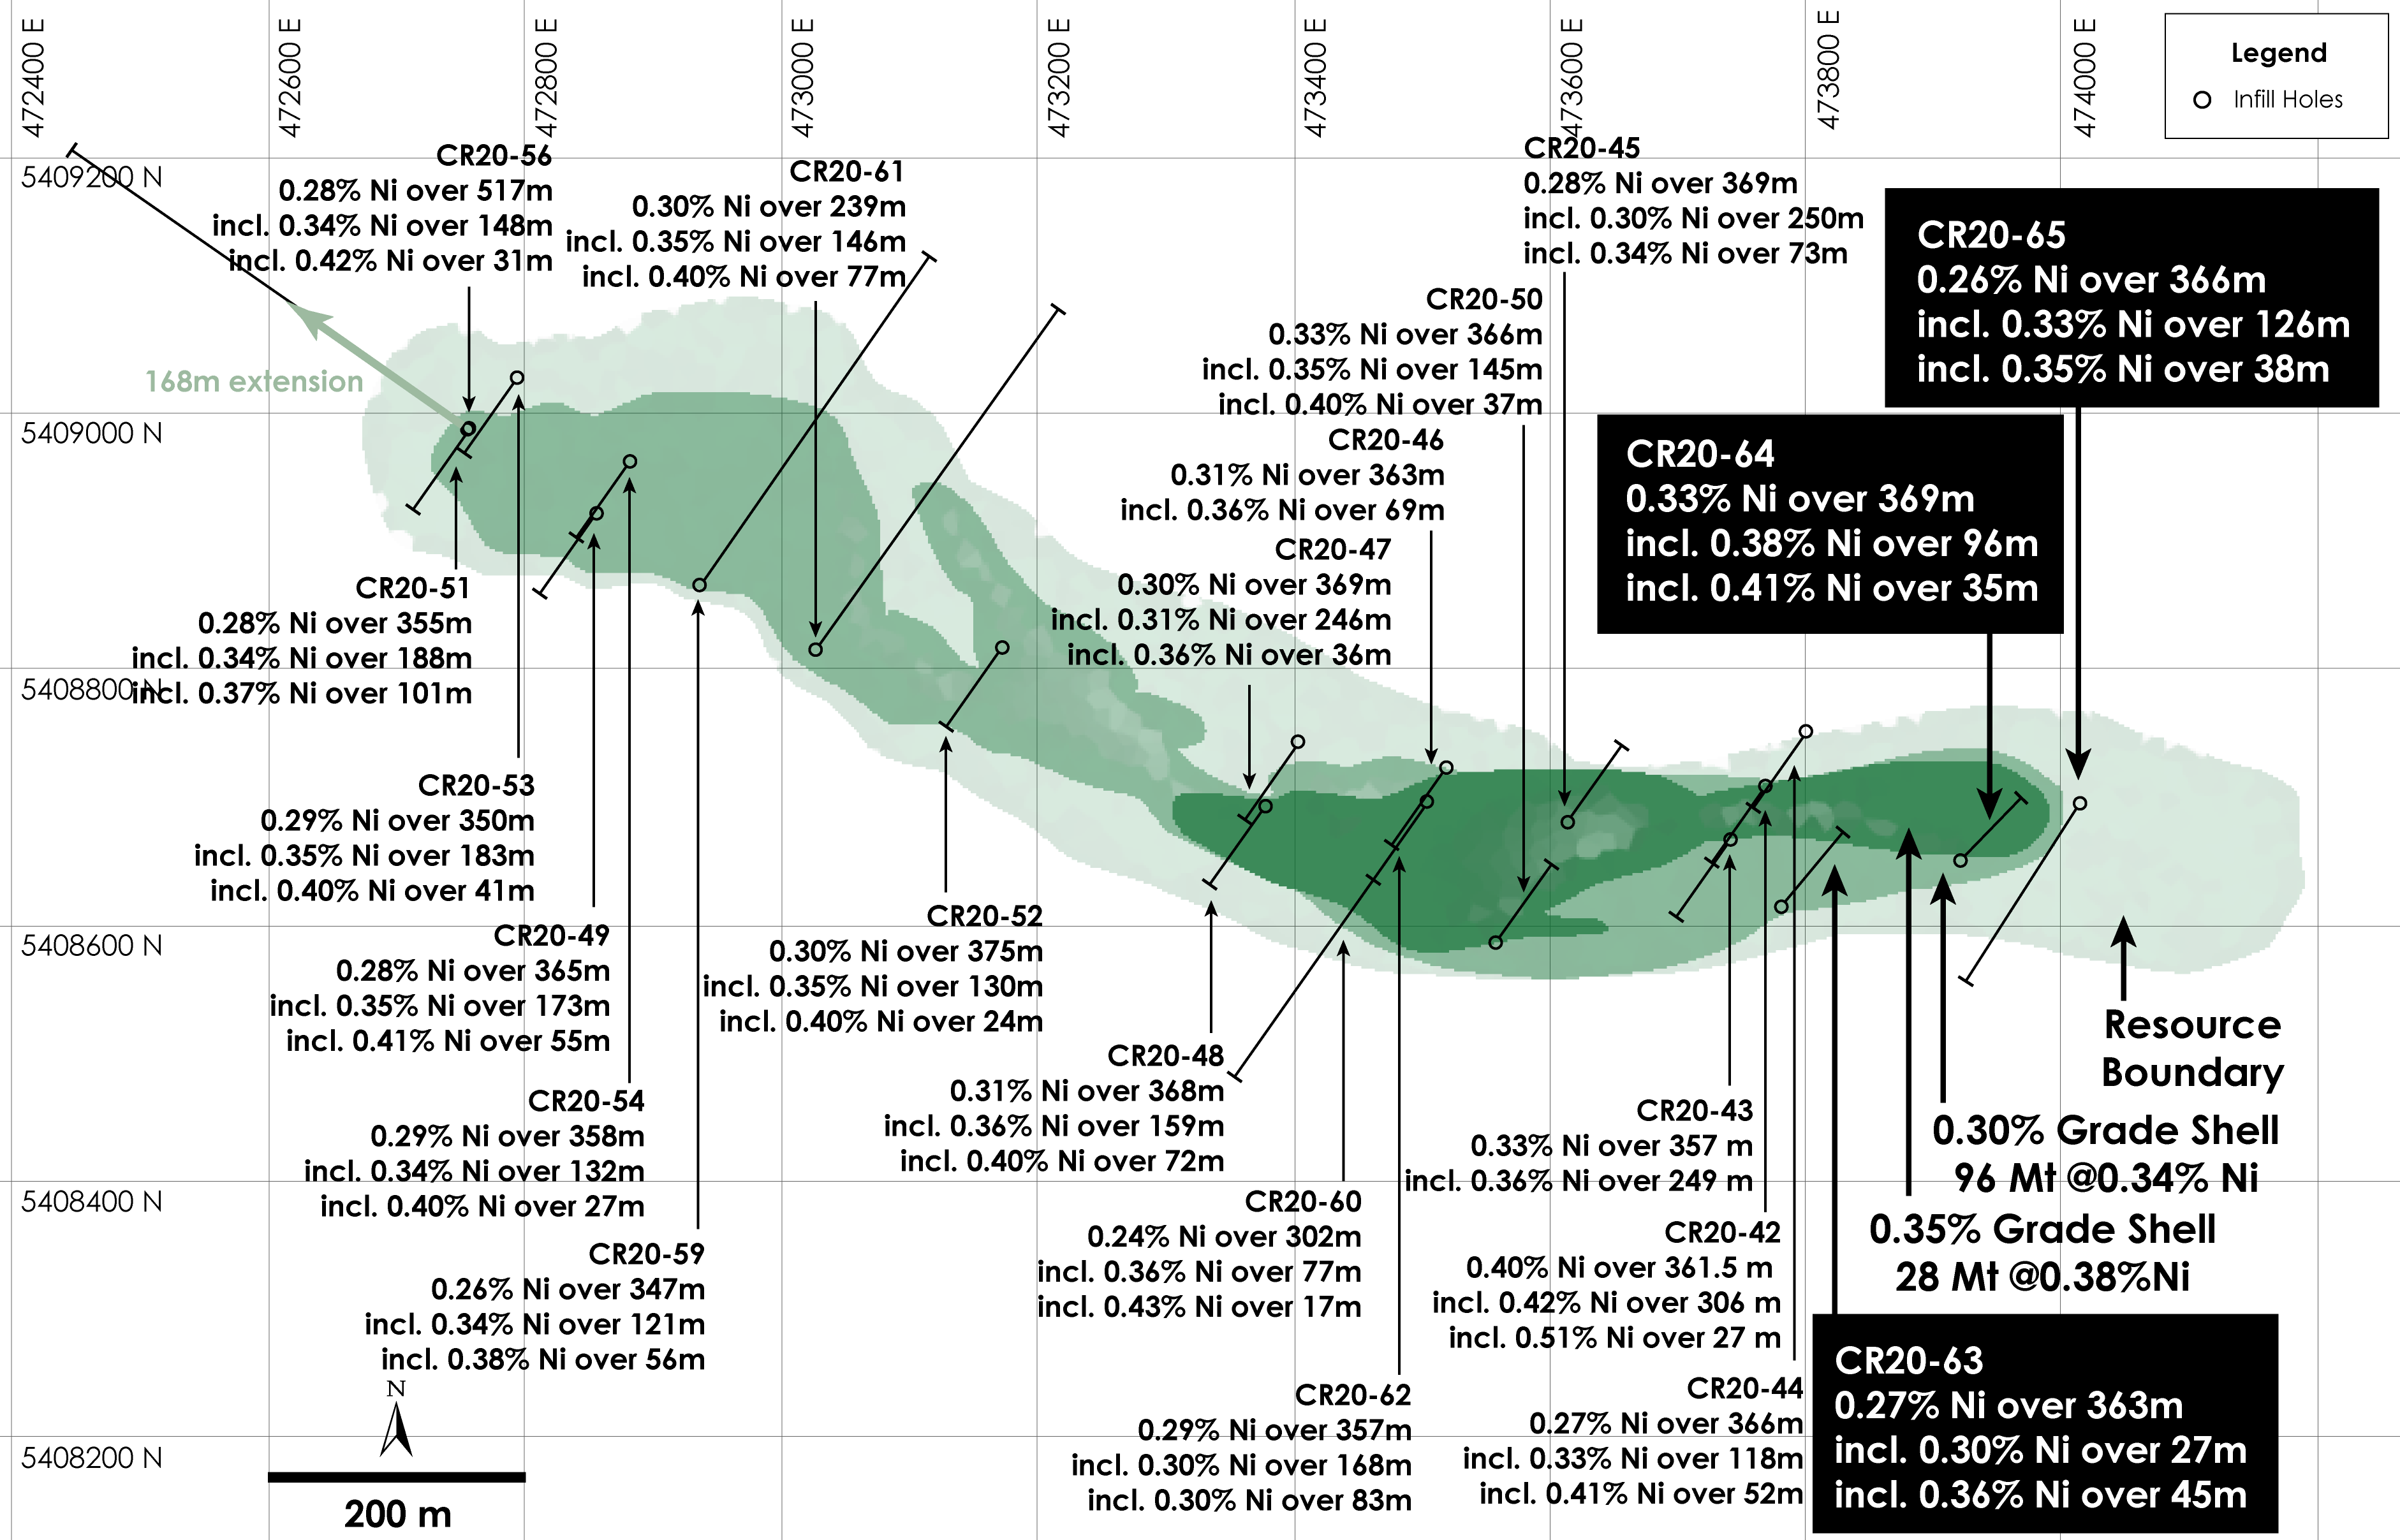
    • Hole CR20-64 intersected 0.33% nickel across entire core length of 369 metres including 0.38% nickel across core length of 96 metres within the steeply dipping higher-grade core which varies in true thickness from 40 to 160 m
    • Easternmost infill hole CR20-65 collared in higher grade mineralization and intersected 0.33% nickel across core length of 126 metres (estimated true width of 51 metres). Hole CR20-63 confirmed depth extension on south side of higher grade mineralization with final core length of 45 metres grading 0.36% nickel ending at a depth of 400 metres.


TORONTO, October 8, 2020 – Canada Nickel Company Inc. (TSX-V:CNC) (“Canada Nickel” or the “Company“) today announced the final results from infill drilling on the Main Zone at its Crawford Nickel-Cobalt Sulphide project.

“These excellent results conclude our infill program which will be incorporated into our resource update expected to be released in two weeks. With yet another set of promising results, we are looking forward to issuing the updated resource particularly given our ability to substantially extend the higher grade core of the mineralization along strike and at depth.” said Mark Selby, Chair and CEO of Canada Nickel.

“Additionally, we are expecting a steady series of assay results from drilling currently underway on prospective geophysical nickel targets on the several kilometres of the Crawford structure including the three follow-up holes on the previously reported PGM results from hole CR20-32 (which yielded three separate intersections including 2.6 g/t PGM over 7.5 metres). Canada Nickel looks forward to continue delivering regular and notable updates through the balance of 2020. We remain on track to deliver a Preliminary Economic Assessment by year-end.”

The Crawford Nickel-Cobalt Sulphide Project is located in the heart of the prolific Timmins-Cochrane mining camp in Ontario, Canada, and is adjacent to well-established, major infrastructure associated with over 100 years of regional mining activity.

Main Zone Infill Results

Infill drilling on the Main Zone continued to focus on more clearly defining and upgrading the Higher-Grade Core resource, which was previously defined as part of the resource estimate and dips steeply within the ultramafic unit and having a previously reported true thickness that varies from 40 m to 160 m. These results are from the final three in-fill holes to be utilized in the updated resource expected to be released in two weeks. See Table 1 and Figure 1 for results.

Table 1 – Main Zone Nickel – Drilling Results, Crawford Nickel-Cobalt Sulphide Project, Ontario

These holes were drilled at steep angles of -80 degrees almost entirely within the higher-grade core to better determine grade, or -66.2 degrees to help better define northern or southern boundaries of the higher-grade core. See Table 3. The estimated true width of this zone has been determined from previous drilling to vary from 40 to 160 m depending on location of the section.

Figure 1 – Plan View of Main Zone Nickel Resource, Crawford Nickel-Cobalt Sulphide Project, Ontario.

Next Steps

All drill results to date will be incorporated into an updated resource expected in two weeks. Drilling has begun on other prospective geophysical targets on the several kilometres of the Crawford structure, including those which were previously untested on the west side of the highway. An airborne geophysical survey on regional option properties has been completed and interpretation work now underway will inform a regional drilling program expected to be completed this winter.

Table 3 – Drill Hole Orientation, Crawford Nickel-Cobalt Sulphide Project, Ontario

Neither TSX Venture Exchange nor its Regulation Services Provider (as that term is defined in policies of the TSX Venture Exchange) accepts responsibility for the adequacy or accuracy of this release.


Assays, Quality Assurance/Quality Control and Drilling and Assay Procedures

William E. MacRae, MSc, P.Geo., a “qualified person” as defined by NI 43-101, is responsible for the on-going drilling and sampling program, including quality assurance (QA) and quality control (QC). The core is collected from the drill in sealed core trays and transported to the core logging facility. The core is marked and sampled at 1.5 metre lengths and cut with a diamond blade saw. Samples are bagged with QA/QC samples inserted in batches of 35 samples per lot. Samples are transported in secure bags directly from the Canada Nickel core shack to Actlabs Timmins, an ISO/IEC 17025 accredited lab. Analysis for precious metals (gold, platinum and palladium) are completed by Fire Assay while analysis for nickel, cobalt, sulphur and 17 other elements are performed using a peroxide fusion and ICP-OES analysis. Certified standards and blanks are inserted at a rate of one QA/QC sample per 32 core samples making a batch of 35 samples that are submitted for analysis.

Qualified Person and Data Verification

Stephen J. Balch P.Geo. (ON), VP Exploration of Canada Nickel and a “qualified person” as such term is defined by National Instrument 43-101, has verified the data disclosed in this news release, and has otherwise reviewed and approved the technical information in this news release on behalf of Canada Nickel Company Inc.

About Canada Nickel Company

Canada Nickel Company Inc. is advancing the next generation of nickel-cobalt sulphide projects to deliver nickel and cobalt required to feed the high growth electric vehicle and stainless steel markets. Canada Nickel Company has applied in multiple jurisdictions to trademark the terms NetZero NickelTM, NetZero CobaltTM, NetZero IronTM and is pursuing the development of processes to allow the production of net zero carbon nickel, cobalt, and iron products. Canada Nickel provides investors with leverage to nickel and cobalt in low political risk jurisdictions. Canada Nickel is currently anchored by its 100% owned flagship Crawford Nickel-Cobalt Sulphide Project in the heart of the prolific Timmins-Cochrane mining camp.

Cautionary Statement Concerning Forward-Looking Statements

This press release contains certain information that may constitute “forward-looking information” under applicable Canadian securities legislation. Forward looking information includes, but is not limited to, drill results relating to the Crawford Nickel-Cobalt Sulphide Project, the potential of the Crawford Nickel-Cobalt Sulphide Project, timing of economic studies and resource estimates, strategic plans, including future exploration and development results, and corporate and technical objectives. Forward-looking information is necessarily based upon a number of assumptions that, while considered reasonable, are subject to known and unknown risks, uncertainties, and other factors which may cause the actual results and future events to differ materially from those expressed or implied by such forward-looking information. Factors that could affect the outcome include, among others: future prices and the supply of metals, the future demand for metals, the results of drilling, inability to raise the money necessary to incur the expenditures required to retain and advance the property, environmental liabilities (known and unknown), general business, economic, competitive, political and social uncertainties, results of exploration programs, timing of the updated resource estimate, risks of the mining industry, delays in obtaining governmental approvals, and failure to obtain regulatory or shareholder approvals. There can be no assurance that such information will prove to be accurate, as actual results and future events could differ materially from those anticipated in such information. Accordingly, readers should not place undue reliance on forward-looking information. All forward-looking information contained in this press release is given as of the date hereof and is based upon the opinions and estimates of management and information available to management as at the date hereof. Canada Nickel disclaims any intention or obligation to update or revise any forward-looking information, whether as a result of new information, future events or otherwise, except as required by law.

For further information, please contact:

Mark Selby, Chair and CEO
Phone: 647-256-1954
Email: info@canadanickel.com

Release – Troilus Discovers New Goldfield Boulder Zone 36 Km from Troilus Mine

Troilus Discovers New Goldfield Boulder Zone 36 Km from Troilus Mine with Samples up to 26.2 g/t Gold and 27.8 g/t Silver


October 8, 2020, Toronto, Ontario – Troilus Gold Corp. (TSX: TLG) (OTCQB: CHXMF) (“Troilus” or the “Company”) is pleased to announce the latest results from its summer 2020 regional exploration program on its 100%-owned Troilus Project, located within the Frôtet-Evans Greenstone Belt of northern Quebec. The program focused on identifying high priority targets within the extensive land package Troilus acquired and staked earlier in the year (the “Troilus-Frôtet Property”) (see press releases dated April 28, 2020 and July 21, 2020). Initial results collected 28 km southwest of the recently announced Beyan Gold Zone Discovery (see press release dated September 30, 2020), have outlined another new zone of mineralization: the Goldfield Boulder Zone (“Goldfield”). Gold bearing boulders and outcrop can be traced and defined in situ over a minimum strike length of 4 km. Goldfield is accessible from the Route du Nord highway.

Highlights from the New Goldfield Zone:

  • Grab samples returned up to 26.2 g/t gold and 27.8 g/t silver in outcrop
  • Other sample highlights include: 6.51 g/t Au, 5.96 g/t Au, 4.31 g/t Au; 14.0 g/t Ag, 8.6 g/t Ag (see full results in Table 1)
  • Many geological characteristics linking Goldfield to the main mineralized zones over 36 km away

“The discovery of the Goldfield Zone this summer marks an exciting moment for Troilus,” said Justin Reid, CEO of Troilus. “Earlier this year we had the opportunity to significantly increase our land holdings through a combination of acquisition and staking. The addition of the Troilus-Frôtet Property increased our land holdings from 16,000 hectares to over 107,000 hectares. Our evolving geologic model, developed over the last couple of years through drilling and exploration around the main ore bodies of Z87, the J Zones and more recently the Southwest Zone, led us to believe that the region could have district scale potential and we believed that expanding our claim area had the potential to add significant value for shareholders via discovery. The Goldfield Zone, located on the western side of the Troilus-Frôtet Property, marks the furthest afield exploration conducted to date. We are thrilled to report newly discovered, near-surface gold occurrences with samples ranging up to 26.2 g/t gold and 27.8 g/t silver, 36 km from the main mineralized zones at the Troilus property. The Goldfield Zone results, combined with the recent Beyan Zone results, suggest that gold mineralization within the Frôtet-Evans Greenstone Belt is prolific and not constrained geographically as historically thought. We await further results from locations across the Troilus-Frotêt Property collected during the summer and believe that these showings could just be the beginning of what the district could host.”

During this initial bedrock mapping and boulder tracing, the Troilus Geological team located several mineralized boulders on the main Tortigny block assaying up to 26 g/t Au with the best results highighted in the Table 1 below. The Tortigny deposit (see Figure 2), now 100% owned by Troilus, was discovered by Noranda in 1994 with an initial mineral resource estimate prepared in 1997. The latest NI 43-101 compliant mineral resource completed by Beaufield Resources in 2014, estimates measured and indicated resources of 1.1 million tonnes grading 1.8% Cu, 3.65% Zn, 48.51 g/t Ag and 0.35 g/t Au and inferred mineral resources of 99,000 tonnes grading 1.19% Cu, 1.23% Zn, 12.45 g/t Ag and <0.1 g/t Au. The Tortigny mineral resource includes 135 drill holes (34,581 metres) and covers a distance of approximately 600 metres. (The Technical Report for the Tortigny deposit titled: “TECHNICAL REPORT FOR THE TORTIGNY POLYMETALLIC PROJECT SOUTHERN JAMES BAY MUNICIPALITY QUEBEC, CANADA” and effective June 2, 2014, was completed by Micon International Limited and can be found on Beaufield Resources SEDAR profile at www.sedar.com). A qualified person has not done sufficient work to classify the historical estimates as a current mineral resource estimate. Troilus is not treating the historical estimates as current estimates and the historical estimates should not be relied upon as current mineral resource estimates. Further drilling would be required to verify the historical estimate.

Several of these boulders are large (up to 3m in length) and sub-angular, indicating a possible nearby source. These blocks were collected over a distance of 4 km from north to south. There is denser vegetation in this area so outcrops are not as exposed. Nevertheless, one nearby outcrop, located 200m north of the Goldfield Zone ran 1.8 g/t Au, suggesting further exploration is warranted beyond the current boundaries of this new zone. Mafic intrusive and felsic volcanic rocks are the main lithologies hosting these gold and silver gold showings. These units are strongly deformed and altered.

Results for approximately 85 samples are still pending from a total 440 samples that were collected in the vicinity of the Goldfield showing. The Troilus Geological team shipped over 1000 soil samples (B-Horizon) to the lab and results for these are also pending.

Troilus remains underexplored and highly prospective. Extensive field exploration work undertaken this summer across the +107,000 hectare Troilus property is currently being compiled to identify new prospective targets. Further assays of samples collected in the field are pending and will be updated in due course.

Figure 1 – Troilus Property, Regional Geology and Location of the New Goldfield Zone


Figure 2 – Close-up of the Goldfield Boulder Zone


Table 1 – New Beyan Gold Zone Initial Surface Sample Results


Quality Assurance and Control

All grab and ship samples were collected by hand and were located by hand-held GPS, bagged and sealed, and sent for assaying at ALS Laboratory, a certified commercial laboratory. Every sample was processed with standard crushing to 85% passing 75 microns on 500 g splits. Samples were assayed by one-AT (30 g) fire assay with an AA finish and if results were higher than 3.5 g/t Au, assays were redone with a gravimetric finish. In addition to gold, ALS carried out multi-element analysis for ME-ICP61 analysis of 33 elements four acid ICP-AES.

Qualified Person

All technical and scientific information, in this press release has been reviewed and approved by Bertrand Brassard, M.Sc., P.Geo., Chief Geologist, who is a Qualified Person as defined by NI 43-101. Mr. Brassard is an employee of Troilus and is not independent of the Company under NI 43-101.

About Troilus Gold Corp.

Troilus is a Toronto-based, Quebec focused, advanced stage exploration and early-development company focused on the mineral expansion and potential mine re-start of the former gold and copper Troilus mine. The 107,326 hectare Troilus property is located within the Frotêt-Evans Greenstone Belt in Quebec, Canada. From 1996 to 2010, Inmet Mining Corporation operated the Troilus project as an open pit mine, producing more than 2,000,000 ounces of gold and nearly 70,000 tonnes of copper.

For more information:

Justin Reid
Chief Executive Officer
+1 (647) 276-0050 x 1305
Justin.reid@troilusgold.com

Paul Pint
President
+1 (416) 602-1050
paul.pint@troilusgold.com

Cautionary Note Regarding Forward-Looking Statements and Information

Mineral Resources that are not Mineral Reserves do not have demonstrated economic viability; the estimate of Mineral Resources in the updated Mineral Resource statement may be materially affected by environmental, permitting, legal, title, taxation, socio-political, marketing, or other relevant issues. There is no certainty that the Indicated Mineral Resources will be converted to the Probable Mineral Reserve category, and there is no certainty that the updated Mineral Resource statement will be realized.

This press release contains “forward-looking statements” within the meaning of applicable Canadian securities legislation. Forward-looking statements include, but are not limited to, statements regarding the impact of the planned drill program and results on the Company, the reliability of historical estimates and the likelihood that they will be updated to current mineral resource estimates, the possible economics of the project, the Company’s understanding of the project; the development potential and timetable of the project; the estimation of mineral resources; realization of mineral resource estimates; the timing and amount of estimated future exploration; the anticipated results of the Company’s 2020 drill program and their possible impact on the potential size of the mineral resource estimate; the impact of the novel coronavirus (COVID-19) and the considerable uncertainties about the geographic, social and economic impact on the Company of its continuing global spread costs of future activities; capital and operating expenditures; success of exploration activities; the anticipated ability of investors to continue benefiting from the Company’s low discovery costs, technical expertise and support from local communities.. Generally, forward-looking statements can be identified by the use of forward-looking terminology such as “plans”, “expects” or “does not expect”, “is expected”, “budget”, “scheduled”, “estimates”, “forecasts”, “intends”, “continue”, “anticipates” or “does not anticipate”, or “believes”, or variations of such words and phrases or statements that certain actions, events or results “may”, “could”, “would”, “will”, “might” or “will be taken”, “occur” or “be achieved”. Forward-looking statements are made based upon certain assumptions and other important facts that, if untrue, could cause the actual results, performances or achievements of Troilus to be materially different from future results, performances or achievements expressed or implied by such statements. Such statements and information are based on numerous assumptions regarding present and future business strategies and the environment in which Troilus will operate in the future. Certain important factors that could cause actual results, performances or achievements to differ materially from those in the forward-looking statements include, amongst others, currency fluctuations, the global economic climate, dilution, share price volatility and competition. Forward-looking statements are subject to known and unknown risks, uncertainties and other important factors that may cause the actual results, level of activity, performance or achievements of Troilus to be materially different from those expressed or implied by such forward-looking statements, including but not limited to: the impact the COVID 19 pandemic may have on the Company’s activities (including without limitation on its employees and suppliers) and the economy in general; the impact of the recovery post COVID 19 pandemic and its impact on gold and other metals; there being no assurance that the exploration program or programs of the Company will result in expanded mineral resources; risks and uncertainties inherent to mineral resource estimates; the high degree of uncertainties inherent to preliminary economic assessments and other mining and economic studies which are based to a significant extent on various assumptions; variations in gold prices and other precious metals, exchange rate fluctuations; variations in cost of supplies and labour; receipt of necessary approvals; general business, economic, competitive, political and social uncertainties; future gold and other metal prices; accidents, labour disputes and shortages; environmental and other risks of the mining industry, including without limitation, risks and uncertainties discussed in the Technical Report to be filed and in other continuous disclosure documents of the Company available under the Company’s profile at www.sedar.com. Although Troilus has attempted to identify important factors that could cause actual results to differ materially from those contained in forward-looking statements, there may be other factors that cause results not to be as anticipated, estimated or intended. There can be no assurance that such statements will prove to be accurate, as actual results and future events could differ materially from those anticipated in such statements. Accordingly, readers should not place undue reliance on forward-looking statements. Troilus does not undertake to update any forward-looking statements, except in accordance with applicable securities laws.

Troilus Gold Corp.
36 Lombard Street, Floor 4
Toronto, Ontario
M5C 2X3
Canada

Tel: +1 647.276.0050
Email: info@troilusgold.com

Release – Chakana Provides Surface Channel Sampling Results

Chakana Provides Surface Channel Sampling Results For Breccia Pipe 1 & Breccia Pipe 6 – Soledad Project, Peru

Bx 1: 17.0 metres with 9.98 g/t gold and 234.6 g/t silver, including 5.0 metres with 17.99 g/t gold and 624.0 g/t silver


Vancouver, B.C., October 8, 2020 – Chakana Copper Corp. (TSX-V: PERU; OTCQB: CHKKF; FRA: 1ZX) (the “Company” or “Chakana”), is pleased to release surface channel sampling results for two (2) previously drilled tourmaline breccia pipes at its expanded Soledad project in Ancash, Peru. The sampling program is in support of an initial resource estimate for the property anticipated in 2021. This sampling program is being carried out at the same time as a 15,000m fully funded drill program that started August 15, 2020 (see recent results reported on September 17 and August 28, 2020). Chakana has previously completed 30,273m of drilling on the property on multiple mineralized breccia pipes.

Channel Sampling Results

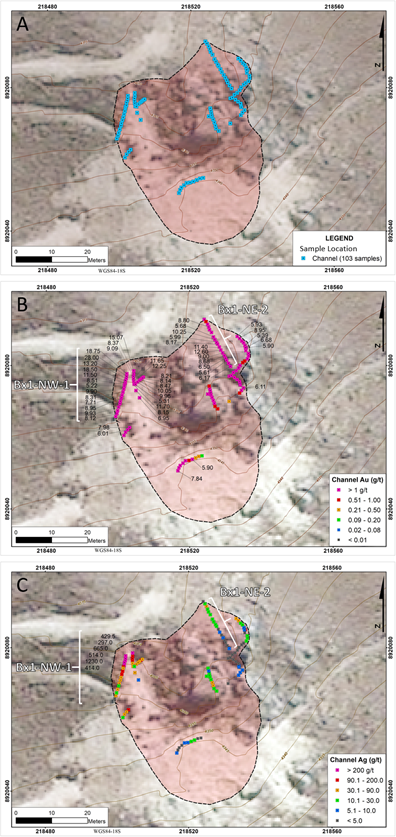
Assay results for channel samples collected from Bx 1 (n=103) and Bx 6 (n=60) are listed in the table below:

  • Within Bx 1, two continuous channel samples assayed 1) 9.98 g/t gold and 234.6 g/t silver over 17.0 metres, including 17.99 g/t gold and 624.0 g/t silver over 5.0 metres; and 2) 7.56 g/t gold and 11.92 g/t silver over 17.9 metres (Fig. 1).
  • All Bx 1 channel samples average 5.61 g/t gold and 62.2 g/t silver with maximum grades of 28.0 g/t gold and 1,230 g/t silver. Copper averages 0.12%; copper grades are generally low at surface due to oxidation and leaching.
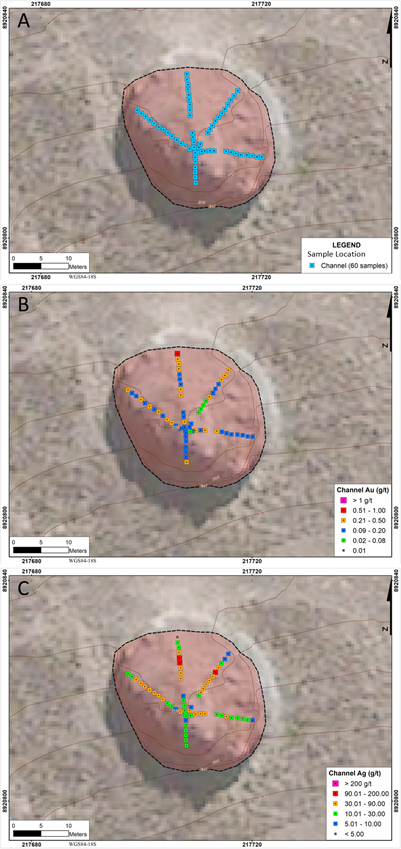
  • All Bx 6 channel samples average 0.19 g/t gold and 34.6 g/t silver with maximum grades of 0.57 g/t gold and 132 g/t silver.


* A gap of 40 cm within this continuous channel sample was included and treated as zero value for average metal value calculations.

The distribution of channel samples and gold and silver is shown in Figures 1 and 2 for Bx 1 and Bx 6, respectively. Gold in channel samples from Bx 1 shows strong enrichment near the margins of the breccia: samples near the northwest margin of the breccia pipe average 8.95 g/t gold and 155.5 g/t silver (n=35); samples on the northeast margin average 4.85 g/t gold and 15.1 g/t silver (n=46). By comparison, two groups of samples in the interior of the breccia pipe collectively average 1.91 g/t gold and 12.9 g/t silver (n=22).

These results are consistent with the comprehensive review of the metal distribution and gold-rich nature of mineralization at Bx 1 (see news release dated May 19, 2020). Based on drill results, gold is relatively enriched in the top 70 metres of the breccia pipe, with assay intervals averaging 4.76 g/t gold from surface to 4,275m elevation. Assay intervals located from the edge of the breccia pipe toward the interior of the pipe, show increasing concentrations to 7 metres, averaging 2.61 g/t gold. Samples located from 7 to 15 metres average 1.65g/t gold, and then drop below 0.5 g/t gold for samples located in the inner-most part of the pipe.

Bx 6 shows consistent but lower concentrations of gold and silver in surface channel samples. Although a comprehensive review of metal distribution has not been completed on Bx 6, higher values of gold and silver are noted in previously reported drill holes (see news releases dated February 7, 2019; April 2, 2019; and September 10, 2019). For example, drill hole SDH19-107 intercepted 90 metres of 0.88 g/t Au and 84.7 g/t Ag from 10 metres depth. The lower values in the channel samples likely reflects vertical grade variation within the breccia pipe.

“These results are additional confirmation of the precious metal-rich nature of Bx 1. We interpret the higher grades at the margin to reflect high permeability within the breccia along these zones. Our drilling has shown grade variations within and between breccia pipes,” said President and CEO David Kelley. “This channel sampling program will help augment our drilling results, making the anticipated resource estimate more robust. We look forward to releasing additional results from other breccia pipes as the channel sampling program progresses,” added Kelley.

Surface Channel Sampling Protocol and Program

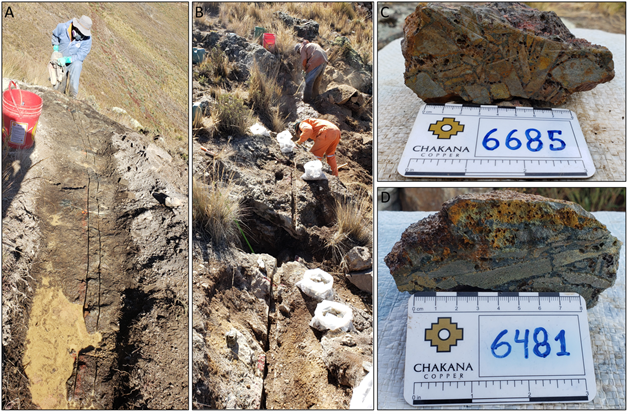
In anticipation of a resource estimate for the expanded Soledad project, a surface channel sampling program has been initiated on several mineralized tourmaline breccia pipes. The surface channel samples compliment the drill samples, providing greater certainty of the grade in the upper part of the breccia pipes. Samples are taken from continuous segments of outcrop after cutting a channel 7.5 cm wide, then chiseling the rock from within the limits of the channel (Fig. 3). For Bx 1, one hundred and three (103) samples were collected from breccia with sample lengths ranging from 0.7 – 1.7 metres and averaging 1.0 metre. At Bx 6, sixty (60) samples 1.0 metre in length were collected. Average values for gold, silver, and copper reported in this news release are based on length-weighted averages. Sample volumes and weights are similar to those collected from drill core, averaging 5.3 kg per sample for Bx 1, and 4.5 kg per sample for Bx 6. Sample location is limited by surface topography exposure, and surface disturbance. In some instances, steep outcrop faces prevent sampling due to safety concerns. In other instances, outcrop is obscured by colluvium or soil.

Sampling and Analytical Procedures

Chakana follows rigorous sampling and analytical protocols that meet or exceed industry standards. Channel samples are stored in a secured area until transport in batches to the ALS facility in Callao, Lima, Peru. Sample batches include certified reference materials, blank, and duplicate samples that are then processed under the control of ALS. All samples are analyzed using the ME-MS41 (ICP technique that provides a comprehensive multi-element overview of the rock geochemistry), while gold is analyzed by AA24 and GRA22 when values exceed 10 g/t. Over limit silver, copper, lead and zinc are analyzed using the OG-46 procedure. Results of previous drilling and additional information concerning the Project, including a technical report prepared in accordance with National Instrument 43-101, are made available on Chakana’s SEDAR profile at www.sedar.com.

About Chakana Copper

Chakana Copper Corp is a Canadian-based minerals exploration company that is currently advancing the high-grade gold-copper-silver Soledad Project located in the Ancash region of Peru, a highly favorable mining jurisdiction with supportive communities. The Soledad Project consists of high-grade gold-copper-silver mineralization hosted in tourmaline breccia pipes. A total of 31,641 metres of drilling has been completed to-date, testing eight (8) of twenty-three (23) confirmed breccia pipes with more than 92 total targets. Chakana’s investors are uniquely positioned as the Soledad Project provides exposure to several metals including copper, gold, and silver. For more information on the Soledad project, please visit the website at www.chakanacopper.com.

Qualified Person

David Kelley, an officer and a director of Chakana, and a Qualified Person as defined by NI 43-101, reviewed and approved the technical information in this news release.

ON BEHALF OF THE BOARD

(signed) “David Kelley”
David Kelley
President and CEO

For further information contact:
Joanne Jobin, Investor Relations Officer
Phone: 647 964 0292
Email: jjobin@chakanacopper.com

Neither TSX Venture Exchange nor its Regulation Services Provider (as that term is defined in the policies of the Exchange) accepts responsibility for the adequacy or accuracy of this release.

Forward-looking Statement Advisory: This release may contain forward-looking statements. Forward-looking statements involve known and unknown risks, uncertainties, and other factors which may cause the actual results, performance, or achievements of Chakana to be materially different from any future results, performance, or achievements expressed or implied by the forward-looking statements. Forward looking statements or information relates to, among other things, the interpretation of the nature of the mineralization at the Soledad copper-gold-silver project (the “Project”), the potential to expand the mineralization, and to develop and grow a resource within the Project, the planning for further exploration work, the ability to de-risk the potential exploration targets, and our belief in the potential for mineralization within unexplored parts of the Project. These forward-looking statements are based on management’s current expectations and beliefs but given the uncertainties, assumptions and risks, readers are cautioned not to place undue reliance on such forward- looking statements or information. The Company disclaims any obligation to update, or to publicly announce, any such statements, events or developments except as required by law.


Figure 1 – Maps for Bx1 showing A) channel sample locations, B) gold distribution (samples >5.00 g/t Au labeled), and C) silver distribution (samples >200.0 g/t Ag labeled). Dashed outline shows approximate limit of breccia outcrop (red shaded area). Two longer continuous channel samples highlighted (Bx1-NW-1 and Bx1-NE-1).


Figure 2 – Maps for Bx6 showing A) channel sample locations, B) gold distribution, and C) silver distribution. Dashed outline shows approximate limit of breccia outcrop (red shaded area).


Figure 3 – photos showing channel sampling technique and examples of channel samples: A) channel cut into outcrop with diamond saw, channel width is 7.5 cm; B) channel samples are chiseled from outcrop and transferred to sample bags for each specified sample interval; C-D) examples of breccia samples from channel sampling program.


Release – Discover the potential scale of Kaukua South


Discover the potential scale of Kaukua South


Explore Palladium One’s major discovery at Kaukua South in this new webinar with CEO Derrick Weyrauch and VP of Exploration Neil Pettigrew.

They’ll explain how the mineralized strike length has increased six-fold from 600 meters to 4 kilometers, and touch on Hole LK20-014, which returned a core zone of 72.0 m at 1.96 g/t palladium equivalent (Pd_Eq) within a wider zone of 145.5 m at 1.28 g/t Pd_Eq.

You’ll also learn more about the fundamentals of the palladium market, and why palladium is more valuable than gold. That’s why palladium-dominant PGE projects in low risk, first class jurisdictions — like Palladium One’s LK Project in Finland — have lots of potential.

”The Kaukua South strike extension is exceptionally significant because it has shallow disseminated sulfide mineralization the same as Kaukua and points to the footprint of a large-scale mineral system,” said Dr. Peter C. Lightfoot, one of Palladium One Mining’s directors and a globally recognized expert in magmatic precious metal and nickel-copper-cobalt sulphide ore deposits. “LK is shaping up to potentially be the largest palladium dominant open pit project in a best in class mining jurisdiction, globally.”


About Palladium One

Palladium One Mining Inc. is an exploration company targeting district scale, platinum-group-element (PGE)-coppernickel deposits in Finland and Canada. Its flagship project is the Läntinen Koillismaa or LK Project, a palladiumdominant platinum group element-copper-nickel project in north-central Finland, ranked by the Fraser Institute as one of the world’s top countries for mineral exploration and development. Exploration at LK is focused on targeting disseminated sulfides along 38 kilometers of favorable basal contact and building on an established NI 43-101 open pit resource.

Palladium One Mining is listed on the TSX Venture Exchange under the symbol PDM.

The Timing of a COVID Vaccine


Does it Matter if the President and FDA Disagree on What’s Best?

Vaccines and therapeutics typically require years, even decades, of research and laboratory testing before being elevated to clinical trials.  Today, pharmaceutical companies, with support from the government, are racing to produce an effective SARS-CoV-2 vaccine by year-end 2020.  Researchers are now evaluating for safety and efficacy 44 vaccines in clinical trials on humans, 91 preclinical vaccines are at an earlier stage where they are being tested in animals.

This is a rampant pace. Work began deciphering the COVID-19 genome as early as January. The first human vaccine safety trials began just a few months later; by any measure, this is a fast track pace, fraught with uncertainty as short-term and long-term results are unknowable.

Role of the FDA

The Food and Drug Administration (FDA) regulates vaccines and other medications. After a rigorous review of laboratory and clinical results to ensure safety, benefits, and side effects, a product may be approved to be used for a specific illness. There are currently no vaccines available for the prevention of COVID-19. An approval cycle that typically takes years is being expedited. In the case of the 2020 pandemic, the FDA  has shortened standard testing periods and is providing timely advice and closer than normal interactions with vaccine developers. The FDA is also supporting product development and scaling up of manufacturing capacity for high-priority vaccines to be used against COVID-19.

Can You Rush Success?

Some things cannot be known with any vaccine or therapeutic without years of study. Certainty only comes with approved use in the broader population over time. The FDA has allowed an emergency pace for the development of treatment and preventatives to the novel coronavirus, and first-generation treatments are in the final phase of testing. The results and approved products are expected to become available in the coming months. The FDA guidelines related to COVID-19 allow a fast pace by any measure; however, the White House believes the country would be served better if the rollout was accelerated even quicker.

Are the White House and the FDA at Odds?

The FDA’s instructions are that vaccine developers follow test-case patients for at least two months to rule out safety issues before they seek emergency approval. This requirement does not sit well with the White House as they believe there is “no clinical or medical reason” for the additional requirement. They have taken steps to “overrule” this two-month step.

On the FDA side, Commissioner Stephen Hahn has been acting to shore up public confidence in the FDA’s vaccine fast pace review for weeks. He has vowed not to be swayed by any political agenda to get a cure or preventative out sooner than prudence would dictate. He believes career scientists, not politicians, are best suited to decide if a new product is safe and effective for mass vaccination.

President Trump has insisted that a vaccine could be authorized before Election Day; his motivations are based more on returning the country to a pre-COVID state as soon as humanly possible. Scientists involved at the FDA are not as comfortable ignoring cautionary protocols.

Actual Impact of White House Impatience

Beyond the strained relationship and perception of overruling the Food and Drug Administration, the impact of the White House action to block current vaccine guidelines may be inconsequential.

Only one drug maker, Pfizer (PFE) has suggested it meets all the criteria and could provide data on the safety and effectiveness of its vaccine before November. Afterward, the FDA would need to closely review the scientific studies and approve or reject their product. This would take time. Pfizer’s competitors Moderna (MRNA), AstraZeneca (AZN), and Johnson & Johnson (JNJ) are working on longer researcher timelines.

It is not out of the question that therapeutics currently under study will reach the approval process sooner than a vaccine. Any vaccine approval may be followed by more effective options later on by companies working on a longer timeline.


Suggested Videos:

Genprex Virtual Road Show

PDS Biotechnology C-Suite Series

Dyadic Int’l C-Suite Series


Dyadic International (DYAI)

Wednesday October 14 1:00pm EDT

Virtual Meeting With:

Mark Emalfarb – President & CEO

Register Now


Sources:

White House nixes updated FDA guidelines on vaccine approval

Everything you need to know about what it would take for the FDA to approve a COVID-19 vaccine

Coronavirus Vaccine Tracker

When Will You Be Able to Get a Coronavirus Vaccine?

White House Takes Issue With FDA’s Plans for Authorizing a Covid-19 Vaccine

Photo: Jernej Furman,  Vaccine Syringes With Flag of the United States of America (Changes made to height)

PDS Biotechnology Corp (PDSB) – PDS’s Diverse Portfolio in Broad Therapeutic Areas Is Highly Appealing

Tuesday, October 06, 2020

PDS Biotechnology Corp (PDSB)

PDS’s Diverse Portfolio in Broad Therapeutic Areas Is Highly Appealing

PDS Biotechnology Corp operates as a clinical stage biotechnology company, principally involved in drug discovery in the United States. It is primarily engaged in the treatment of various early-stage and late-stage cancers, including head and neck cancer, prostate cancer, breast cancer, cervical cancer, anal cancer, and other cancers. Its products are based on the proprietary Versamune platform technology, which activates and directs the human immune system to unleash a powerful and targeted attack against cancer cells.

Ahu Demir, Ph. D., Biotechnology Research Analyst, Noble Capital Markets, Inc.

Refer to the full report for the price target, fundamental analysis, and rating.

    What do we like? The applicability of the platform technology. In our view, PDS remains under the Street’s radar with a clinical pipeline as well as a versatile technology platform enabling growth in new directions. As we look forward, we believe that both oncology and infectious disease portfolios may provide dynamic catalysts for the medium term, while the technology platform with multiple Phase 2 clinical trials provides fundamental depth to future value.

    Portfolio diversification is utmost in the near-term.  The value-generating catalyst in the near-tear is predominantly based on the commencement of two Phase 2 clinical trials in Q4 2020 – PDS0101 for the treatment of i) recurrent/metastatic head and neck cancer (HNC) and ii) advanced cervical cancers. The company also broadened infectious disease programs to include the development of vaccines for …


This Company Sponsored Research is provided by Noble Capital Markets, Inc., a FINRA and S.E.C. registered broker-dealer (B/D).

*Analyst certification and important disclosures included in the full report. NOTE: investment decisions should not be based upon the content of this research summary.  Proper due diligence is required before making any investment decision. 

Release – Comstock Mining Monetizes Preferred Share Holdings; Reduces Debt by $2 million


Comstock Mining Monetizes Preferred Share Holdings; Reduces Debt by $2 million


Virginia City, NV (October 6, 2020) Comstock Mining Inc. (the “Company” or “Comstock”) (NYSE American: LODE) announced today, the receipt of over $4 million in cash proceeds from the monetization of preferred stock. Under the terms of the Lucerne mine sale with Tonogold, Comstock Mining received $6.1 million in Convertible Preferred Stock (“CPS”) issued by Tonogold. Through 9/30/2020, the Company had converted $3.920 million CPS in exchange for 21,777,778 common shares of Tonogold. On October 2, 2020, Tonogold redeemed the remaining $2.18 million CPS for cash proceeds of $2.616 million, representing 120% of the CPS face value. This transaction allowed the Company to reduce its promissory notes, from $4.475 million to $2.5 million, reducing interest expense.

The Company has also realized approximately $1.386 million in cash proceeds from the sale of 3,587,833 common shares at an average price of approximately $0.40 per share and continues to hold 18,189,945 common shares with a current estimated value of $7.1 million and holds a $4.475 million 12% Convertible Secured Note Receivable, due September 20, 2021. The Company retains 1.5% NSR royalties on all of Tonogold’s exploration and development properties and a 25% portion of a 4% NSR of certain Comstock Lode mineral claims.

Mr. De Gasperis, Executive Chairman and CEO stated, “Our liquidity has been strengthened and our debt obligations are within striking distance of being fully paid off as we work directly and collaboratively with Tonogold and focus on our own precious-metal developments in the both the Dayton resource and the Spring Valley exploration target areas as well as the commercialization of MCU’s mercury remediation technology and systems.”

About Comstock Mining Inc.

Comstock Mining Inc. is a Nevada-based, gold and silver mining company with extensive, contiguous property in the Comstock District and is an emerging leader in sustainable, responsible mining that is currently commercializing environment-enhancing, precious-metal-based technologies, products and processes for precious metal recovery. The Company began acquiring properties in the Comstock District in 2003. Since then, the Company has consolidated a significant portion of the Comstock District, amassed the single largest known repository of historical and current geological data on the Comstock region, secured permits, built an infrastructure and completed its first phase of production. The Company continues evaluating and acquiring properties inside and outside the district expanding its footprint and exploring all of our existing and prospective opportunities for further exploration, development and mining. The Company’s goal is to grow per-share value by commercializing environment-enhancing, precious-metal-based products and processes that generate predictable cash flow (throughput) and increase the long-term enterprise value of our northern Nevada based platform.

Forward-Looking Statements

This press release and any related calls or discussions may include forward-looking statements within the meaning of Section 27A of the Securities Act of 1933, as amended, and Section 21E of the Securities Exchange Act of 1934, as amended. All statements, other than statements of historical facts, are forward-looking statements. The words “believe,” “expect,” “anticipate,” “estimate,” “project,” “plan,” “should,” “intend,” “may,” “will,” “would,” “potential” and similar expressions identify forward-looking statements, but are not the exclusive means of doing so. Forward-looking statements include statements about matters such as: consummation of all pending transactions; project, asset or Company valuations; future industry market conditions; future explorations, acquisitions, investments and asset sales; future performance of and closings under various agreements; future changes in our exploration activities; future estimated mineral resources; future prices and sales of, and demand for, our products; future impacts of land entitlements and uses; future permitting activities and needs therefor; future production capacity and operations; future operating and overhead costs; future capital expenditures and their impact on us; future impacts of operational and management changes (including changes in the board of directors); future changes in business strategies, planning and tactics and impacts of recent or future changes; future employment and contributions of personnel, including consultants; future land sales, investments, acquisitions, joint ventures, strategic alliances, business combinations, operational, tax, financial and restructuring initiatives; the nature and timing of and accounting for restructuring charges and derivative liabilities and the impact thereof; contingencies; future environmental compliance and changes in the regulatory environment; future offerings of equity or debt securities; the possible redemption of debentures and associated costs; future working capital, costs, revenues, business opportunities, debt levels, cash flows, margins, earnings and growth.

These statements are based on assumptions and assessments made by our management in light of their experience and their perception of historical and current trends, current conditions, possible future developments and other factors they believe to be appropriate. Forward-looking statements are not guarantees, representations or warranties and are subject to risks and uncertainties, many of which are unforeseeable and beyond our control and could cause actual results, developments and business decisions to differ materially from those contemplated by such forward-looking statements. Some of those risks and uncertainties include the risk factors set forth in our filings with the SEC and the following: counterparty risks; capital markets’ valuation and pricing risks; adverse effects of climate changes or natural disasters; global economic and capital market uncertainties; the speculative nature of gold or mineral exploration, including risks of diminishing quantities or grades of qualified resources; operational or technical difficulties in connection with exploration or mining activities; contests over title to properties; potential dilution to our stockholders from our stock issuances and recapitalization and balance sheet restructuring activities; potential inability to comply with applicable government regulations or law; adoption of or changes in legislation or regulations adversely affecting businesses; permitting constraints or delays; decisions regarding business opportunities that may be presented to, or pursued by, us or others; the impact of, or the non-performance by parties under agreements relating to, acquisitions, joint ventures, strategic alliances, business combinations, asset sales, leases, options and investments to which we may be party; changes in the United States or other monetary or fiscal policies or regulations; interruptions in production capabilities due to capital constraints; equipment failures; fluctuation of prices for gold or certain other commodities (such as silver, zinc, cyanide, water, diesel fuel and electricity); changes in generally accepted accounting principles; adverse effects of terrorism and geopolitical events; potential inability to implement business strategies; potential inability to grow revenues; potential inability to attract and retain key personnel; interruptions in delivery of critical supplies, equipment and raw materials due to credit or other limitations imposed by vendors or others; assertion of claims, lawsuits and proceedings; potential inability to satisfy debt and lease obligations; potential inability to maintain an effective system of internal controls over financial reporting; potential inability or failure to timely file periodic reports with the SEC; potential inability to list our securities on any securities exchange or market; inability to maintain the listing of our securities; and work stoppages or other labor difficulties. Occurrence of such events or circumstances could have a material adverse effect on our business, financial condition, results of operations or cash flows or the market price of our securities. All subsequent written and oral forward-looking statements by or attributable to us or persons acting on our behalf are expressly qualified in their entirety by these factors. Except as may be required by securities or other law, we undertake no obligation to publicly update or revise any forward-looking statements, whether as a result of new information, future events, or otherwise.

Neither this press release nor any related calls or discussions constitutes an offer to sell, the solicitation of an offer to buy or a recommendation with respect to any securities of the Company, the fund or any other issuer.


Contact information

Corrado De Gasperis
Executive Chairman & CEO
Tel (775) 847-4755
degasperis@comstockmining.com

Comstock Mining Inc.
1200 American Flat Rd
PO Box 1118
Virginia City, NV 89440
http://www.comstockmining.com

Zach Spencer
Director of External Relations
Tel (775) 847-5272 ext.151
questions@comstockmining.com