Endeavour Silver (EXK)(EDR:CA) – Making Good Progress

Wednesday, October 14, 2020

Endeavour Silver (EXK)(EDR:CA)

Making Good Progress

As of April 24, 2020, Noble Capital Markets research on Endeavour Silver is published under ticker symbols (EXK and EDR:CA). The price target is in USD and based on ticker symbol EXK. Research reports dated prior to April 24, 2020 may not follow these guidelines and could account for a variance in the price target.

Endeavour Silver Corp is a precious metal mining company. The company is primarily engaged in silver mining and owns three high-grade, underground, silver-gold mines in Mexico. Its other business activities include acquisition, exploration, development, extraction, processing, refining and reclamation. The company is organized into four operating mining segments, Guanacevi, Bolanitos, El Cubo, and El Compas, which are located in Mexico as well as Exploration and Corporate segments. Its Exploration segment consists of projects in the exploration and evaluation phases in Mexico and Chile.

Mark Reichman, Senior Research Analyst of Natural Resources, Noble Capital Markets, Inc.

Refer to the full report for the price target, fundamental analysis, and rating.

    Third quarter production results. Compared to the prior year period, third quarter silver production declined 0.7% to 942,274 ounces while gold production increased 5.6% to 10,260 ounces. While silver production was below our expectations, gold production modestly exceeded our estimate. Fourth quarter throughput at Guanacevi is expected to reach 1,200 tonnes per day compared with 911 tonnes per day during the third quarter. Additionally, Bolanitos mine performance is expected to benefit from grade improvement. EXK sold 741,263 ounces of silver and 8,998 ounces of gold and ended the quarter with 412,913 ounces of silver and 1,963 ounces of gold bullion in inventory.

    Maintaining EPS estimates.  We are maintaining our 2020 loss estimate of $(0.08) per share which reflects earnings per share of $0.02 and $0.03 in the third and fourth quarters, respectively. Our 2021 EPS estimate remains $0.16. Our 2020 and 2021 EBITDA estimates did move up modestly to $19.9 million and $70.1 million from $19.5 million and $68.6 million, respectively …


This research is provided by Noble Capital Markets, Inc., a FINRA and S.E.C. registered broker-dealer (B/D).

*Analyst certification and important disclosures included in the full report. NOTE: investment decisions should not be based upon the content of this research summary.  Proper due diligence is required before making any investment decision. 

Ely Gold Royalties (ELYGF)(ELY:CA) – Deliberate Addition to ELY’s Growing Nevada Royalty Portfolio

Wednesday, October 14, 2020

Ely Gold Royalties (ELYGF)(ELY:CA)

Deliberate Addition to ELY’s Growing Nevada Royalty Portfolio

As of April 24, 2020, Noble Capital Markets research on Ely Gold Royalties is published under ticker symbols (ELYGF and ELY:CA). The price target is in USD and based on ticker symbol ELYGF. Research reports dated prior to April 24, 2020 may not follow these guidelines and could account for a variance in the price target. Ely Gold Royalties Inc is an emerging royalty company with producing and development assets focused in Nevada and the Western US. It offers shareholders a low-risk leverage to the current price of gold and low-cost access to long-term gold royalties.

Mark Reichman, Senior Research Analyst of Natural Resources, Noble Capital Markets, Inc.

Refer to the full report for the price target, fundamental analysis, and rating.

    Trenton Canyon royalty acquisition. Ely Gold Royalties, through its wholly owned subsidiary Nevada Select Royalty, agreed to purchase a 0.3% net smelter returns royalty from a private individual. The Trenton Canyon royalty covers 52 unpatented mining claims located on the Battle Mountain-Eureka Trend in Nevada, which is included in a drilling program by SSR Mining (NASDAQ, SSRM, Not Rated). In a May 14th update, SSR indicated that exploration drilling on the Trenton Canyon property yielded high-grade gold results from newly discovered sulphide mineralization, while confirmation drilling for oxide mineralization also yielded gold intercepts.

    Terms of the transaction.  Ely will pay total consideration of US$300 thousand, comprised of US$150 thousand in cash payable immediately and US$150 thousand in cash on January 15, 2021. Ely Gold will issue one million common stock warrants which have a two-year term with an exercise price of C$1.36. The transaction is expected to close on December 1, 2020 …


This Company Sponsored Research is provided by Noble Capital Markets, Inc., a FINRA and S.E.C. registered broker-dealer (B/D).

*Analyst certification and important disclosures included in the full report. NOTE: investment decisions should not be based upon the content of this research summary.  Proper due diligence is required before making any investment decision. 

Release – Newrange Gold (NRGOF) Drills at Pamlico

Newrange Drills 14.85 g/t Gold Over 9.15 Meters at Pamlico, Including 34.11 g/t Au Over 3.05 Meters


VANCOUVER, BRITISH COLUMBIA, October 13, 2020 (TSXV: NRG, US: NRGOF, Frankfurt: X6C) – Newrange Gold Corp. (“Newrange” or the “Company”) is pleased to announce that hole P20-82 in the Merritt Zone of the Pamlico Project intersected near surface oxide gold mineralization averaging 14.85 grams gold per metric tonne (g/t Au) and 3.57 grams silver per metric tonne (g/t Ag) over the 9.15 meter interval from 53.35 to 62.50 meters. This mineralized zone contained a high-grade core returning 34.11 g/t Au and 7.64 g/t Ag and lies within a larger 32.01 meter interval assaying 4.74 g/t Au and 2.25 g/t Ag from 44.21 to 76.22 meters.

Hole P20-82 also intersected a shallower zone of mineralization averaging 1.10 g/t Au and 3.67 g/t Ag over the 9.15 meter interval from 22.86 to 32.01 meters. A second hole, P20-83, expanded this oxide gold mineralization to the southeast with an intercept from 4.57 to 10.67 meters averaging 0.484 g/t Au and 4.57 g/t Ag. Hole P20-82, in particular, expands the footprint of high-grade mineralization by filling in an important gap between adjacent holes P17-03, 18 and 32. The table below summarizes these drill results and a map of hole locations can be found here.

These mineralized intercepts are thoroughly oxidized and focused in and near contact zones between the rhyolite and latite volcanic rocks that have been intensely sheared and brecciated due to the competency contrast of these two rock types.

The Company is expanding the drill pattern in this and other areas of the property including step outs on hole P17-10, the highest grade hole in the Company’s 2017 program that contained multiple high-grade intercepts including 6.1 meters averaging 97.94 g/t Au as announced June 19, 2017. Road construction will commence shortly to drill test the upper Good Hope Mine at a similar rhyolite / latite contact zone where underground channel sampling has identified consistent high grade results including 40 meters averaging 13.89 g/t Au and 71.19 g/t Ag in the 5690 level of the mine as announced May 14, 2020. The Company is also conducting follow-up drilling of hole P20-65 that returned 4.6 meters of 0.535 gram gold from surface with additional highly anomalous gold mineralization at depth in Gold Box Canyon as discussed in the Company’s press release of September 20, 2020. Similar rhyolite / latite contact zones are exposed throughout the canyon and have been heavily prospected by artisanal miners in the past with production evident in three separate series of mine workings.

Quality Assurance/Quality Control

Mr. Robert G. Carrington, P. Geo, a Qualified Person as defined by National Instrument 43-101, the President and Chairman of the Company, has reviewed, verified and approved for disclosure the technical information contained in this news release. All drilling was conducted by Reverse Circulation (RC) methods using a five-inch diameter center return bit. All drilling was supervised by professional geologists. Samples were collected on 1.5 meter (5 foot) intervals. Drill cuttings were captured in a vacuum augmented, closed system cyclone, then riffle split in a three-tiered Jones-type splitter. Samples were then securely stored and delivered to Paragon Geochemical Laboratories in Sparks, Nevada for sample preparation and analysis. Samples were dried then stage crushed to 80% passing 10 mesh. A 300 gram sub-sample was then split out and pulverized to 90% passing 140 mesh from which 1 Assay Ton, approximately 30 gram samples were split for analysis by fire assay (FA) with an OES finish. Samples assaying in excess of 5 g/t Au were re-assayed by fire assay with a gravimetric finish. Silver was determined by fire assay with an atomic absorption finish. In addition to the QA – QC conducted by the laboratory, the Company inserts blanks, standards and certified reference material (CRM) at a rate of not less than 1 in 20. Duplicate samples are collected for all drill samples and are submitted at a rate of 1 in 40.

About Pamlico

Located 12 miles southeast of Hawthorne, Nevada, along US Highway 95, the project enjoys excellent access and infrastructure, a mild, year-round operating climate and strong political support from Mineral County, one of the most pro-mining counties in the pro-mining state of Nevada. The Pamlico project covers the historic Pamlico group of mines, as well as the nearby Good Hope, Gold Bar and Sunset mines.

Discovered in 1884, the district rapidly gained a reputation as being one of Nevada’s highest-grade districts. Held by private interests for most of its history, the property remains underexplored in terms of modern exploration.

About Newrange Gold Corp.

Newrange is a precious metals exploration and development company focused on near to intermediate term production opportunities in favorable jurisdictions including Nevada, Ontario and Colorado. With numerous drill intercepts of near surface oxide gold mineralization to 340 grams gold per metric tonne, the Company’s flagship Pamlico Project is poised to become a significant new Nevada discovery. Focused on developing shareholder value through exploration and development of key projects, the Company is committed to building sustainable value for all stakeholders. Further information can be found on our website at www.newrangegold.com.

Signed: “Robert Archer” CEO & Director

For further information contact:
Sharon Fleming
Corporate Communications
Phone: 760-898-9129
Email: info@newrangegold.com

Dave Cross
Chief Financial Officer and Corporate Secretary
Phone: 604-669-0868
Email: dcross@crossdavis.com

Website: www.newrangegold.com

Neither the TSX Venture Exchange nor the Investment Industry Regulatory Organization of Canada accepts responsibility for the adequacy or accuracy of this release.

Forward-Looking Statement: Some of the statements in this news release contain forward-looking information that involves inherent risk and uncertainty affecting the business of Newrange Gold Corp. Actual results may differ materially from those currently anticipated in such statements.

Release – Avivagen (VIVXF) Announces Record Four Tonne Order from UNAHCO

Avivagen Announces Record Four Tonne Order from UNAHCO


  • Four tonne order is the largest one-time purchase in Avivagen’s history, and follows UNAHCO’s three tonne order in April of this year, a previous record order
  • Order comprised of two separate two tonne shipments that demonstrate UNAHCO’S expanded use of OxC-betaTM throughout the region.

Ottawa, ON / Business Wire/ October 13, 2020 / – Avivagen Inc. (TSXV:VIV, OTCQB:VIVXF) (“Avivagen”), a life sciences corporation focused on developing and commercializing products for livestock, companion animal and human applications that safely enhance and support immune function, thereby supporting general health and performance, is pleased to announce a four tonne order from UNAHCO, its largest purchase to date.

“UNAHCO has adopted and scaled an increasing use of our product, as is demonstrated by this record order and UNAHCO’s recent expansion of OxC-beta™ for use in poultry as well as swine,” said Kym Anthony, Avivagen’s CEO. “UNAHCO and their customers continue to see the benefits of using OxC-betaTM in their livestock feed, while our unique relationship with UNAHCO has served as a successful case study on how to test, adopt and scale as a business model with mutual benefit – for Avivagen and its customers – and we look forward to continuing to grow this important relationship.”

Avivagen is working diligently with its procurement partner on this order and is uncertain whether the entire order will be fulfilled and the related revenue included in its current fiscal quarter, ending October 31, 2020.

The Philippines continues to be an important and growing feed market for Avivagen, with an estimated annual feed production of 18.2 million metric tonnes for 2020, up dramatically from 11.75 million metric tonnes in 2016.

About Avivagen

Avivagen is a life sciences corporation focused on developing and commercializing products for livestock, companion animal and human applications. By unlocking an overlooked facet of ?- carotene activity, a path has been opened to safely and economically support immune function, thereby promoting general health and performance in animals. Avivagen is a public corporation traded on the TSX Venture Exchange under the symbol VIV and on the OTCQB Exchange in the U.S. under the symbol VIVXF, and is headquartered in Ottawa, Canada, based in partnership facilities of the National Research Council of Canada and Charlottetown, Prince Edward Island. For more information, visit www.avivagen.com. The contents of the website are expressly not incorporated by reference in this press release.

About OxC-beta™ Technology and OxC-beta™ Livestock

Avivagen’s OxC-beta™ technology is derived from Avivagen discoveries about ?-carotene and other carotenoids, compounds that give certain fruits and vegetables their bright colours. Through support of immune function the technology provides a non-antibiotic means of promoting health and growth. OxC-beta™ Livestock is a proprietary product shown to be an effective and economic alternative to the antibiotics commonly added to livestock feeds. The product is currently available for sale in the United States, Philippines, Taiwan, New Zealand, Thailand, Mexico, Brazil, Australia and Malaysia.

Avivagen’s OxC-beta™ Livestock product is safe, effective and could fulfill the global mandate to remove all in-feed antibiotics as growth promoters. Numerous international livestock trials with poultry and swine using OxC-beta™ Livestock have proven that the product performs as well as, and, sometimes, in some aspects, better than in-feed antibiotics.

Forward Looking Statements

This news release includes certain forward-looking statements that are based upon the current
expectations of management. Forward-looking statements involve risks and uncertainties
associated with the business of Avivagen Inc. and the environment in which the business
operates. Any statements contained herein that are not statements of historical facts may be
deemed to be forward-looking, including those identified by the expressions “aim”, “anticipate”,
“appear”, “believe”, “consider”, “could”, “estimate”, “expect”, “if”, “intend”, “goal”, “hope”,
“likely”, “may”, “plan”, “possibly”, “potentially”, “pursue”, “seem”, “should”, “whether”, “will”,
“would” and similar expressions. Statements set out in this news release relating to the future
plans of Avivagen’s customers and the potential for additional and/or increased orders from such
customers, Avivagen’s expectations as to growth of its branding in certain jurisdictions,
continued distribution and acceptance of Avivagen’s technology, anticipated growth in demand
for Avivagen’s products, the potential for Avivgen’s products to be commercialized in human
applications, the anticipated date of fulfillment for the order described, the possibility for OxCbeta
™ Livestock to replace antibiotics in livestock feeds as well as fill a critical need for health
support in certain livestock applications where antibiotics are precluded and the size of market
opportunities are all forward-looking statements. These forward-looking statements are subject
to a number of risks and uncertainties that could cause actual results or events to differ
materially from current expectations. For instance, the order described may not result in new
orders for Avivagen’s products, the customer plans may change due to many reasons, demand
for Avivagen’s products may not continue to grow and could decline, Avivagen’s brand
recognition may not increase as anticipated or could be impacted by negative events, Avivagen’s
products may not gain market acceptance or regulatory approval in new jurisdictions or for new
applications, including human applications, and may not be widely accepted as a replacement
for antibiotics in livestock feeds, new market access may not occur in the timeline or manner
expected by Avivagen, timing of fulfillment of the order may be delayed beyond current
expectation for a number of reasons which would push fulfillment and recognition of revenues
for this order into a future quarter and the market opportunities may not be as large as Avivagen
anticipates, in each case due to many factors, many of which are outside of Avivagen’s control.
Readers are referred to the risk factors associated with the business of Avivagen set out in
Avivagen’s most recent management’s discussion and analysis of financial condition available at
www.SEDAR.com. Except as required by law, Avivagen assumes no obligation to update the forward-looking statements, or to update the reasons why actual results could differ from those reflected in the forward-looking statements.

Neither TSX Venture Exchange nor its Regulation Services Provider (as that term is defined in the
policies of the TSX Venture Exchange) accepts responsibility for the adequacy or accuracy of this
release.

For more information:
Avivagen Inc.
Drew Basek
Director of Investor Relations
100 Sussex Drive, Ottawa, Ontario, Canada K1A 0R6
Phone: 416-540-0733
E-mail: d.basek@avivagen.com

Kym Anthony
Chief Executive Officer
100 Sussex Drive, Ottawa, Ontario, Canada K1A 0R6
Head Office Phone: 613-949-8164
Website: www.avivagen.com

Oil Demand to Return Soon


When Does OPEC Expect Oil Demand to Plateau?


The Organization of the Petroleum Exporting Countries released its 2020 World Oil Outlook in which it forecasted that world oil demand will rise to 107.2 million barrels per day (bpd) from the current level of 90.7 million bpd. The increase largely reflects the recovery of lost demand due to a global economic slowdown.  At the same time, OPEC expressed concern that global oil demand may plateau after 2030 due to shift away from commuting, efficiency improvements, and a shift to electric cars.

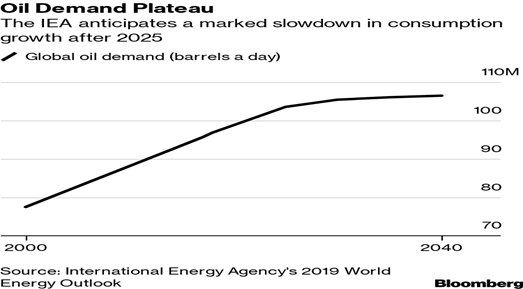
OPEC is not alone in predicting that oil demand will peak soon.  Royal Dutch Shell sees oil demand beginning to decline in the early 2030s.  The U.S. Energy Information Administration expects oil demand to slow down after 2025.  BP Amoco thinks the demand for oil may have peaked last year, noting the demand may never recover from the impact of the coronavirus.


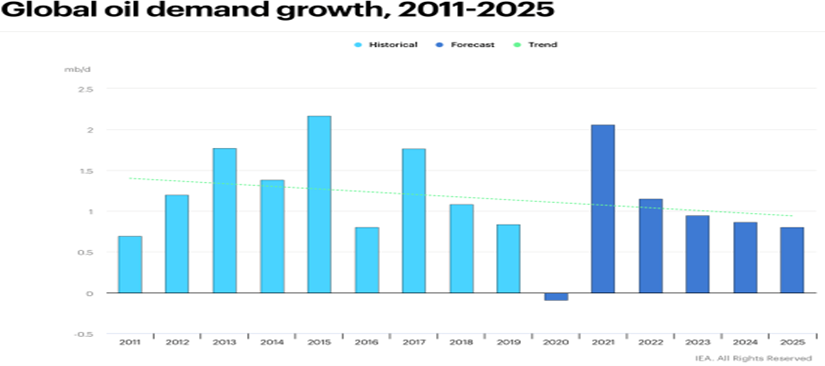
OPEC also indicated that even with a sharp rebound in 2021, global oil demand would remain below previous projections due to the lingering effects of COVID-19. The pandemic is only part of the story behind slowing demand growth.  Demand growth had been slowing well before the impact of COVIC-19.  The figure below shows that growth rates peaked in 2015 at 2.2% and then trended lower during the next four years.  This year growth rates are expected to turn negative because of the pandemic.


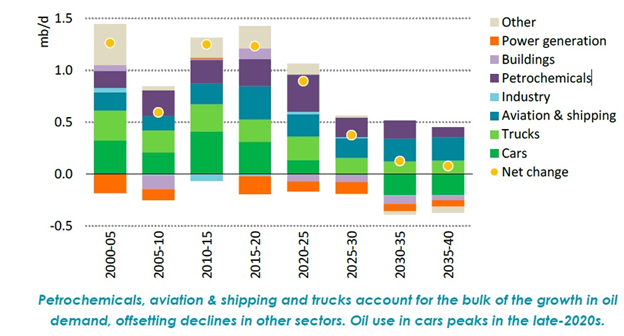
The Independent Commodity Intelligence Services (ICIS) breaks down the impact various components of demand are having on overall oil demand growth.  The chart below shows that power generation has resulted in less oil demand in the last 20 years. This reflects a growth in wind and solar power.  The chart also shows decreasing use of oil for space heating as buildings become more efficient.  The biggest change, however, comes from cars, which has been contributing about one-third of oil demand growth in recent decades but is expected to result in reduced oil consumption beginning as soon as 2030.


Source: Independent Commodity Intelligence Services (ICIS), November 13, 2019


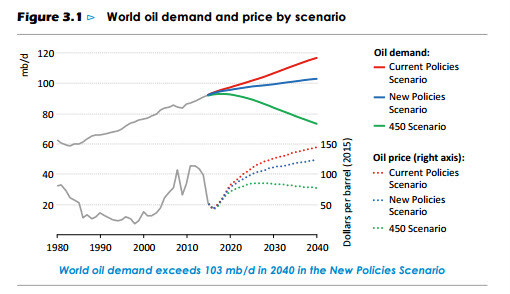
All these scenarios assume that governments maintain their current or stated policies towards carbon emission.  But what would happen if governments enact and achieve a carbon-neutral strategy?  Sixteen developed countries, including Brazil, France, Germany, and Mexico, have pledged to become carbon neutral by 2050. Many states, cities, and corporations have also made such a declaration to limit the average global temperature increase to 1.5 degrees Celsius.


The IEA’s 450 Scenario describes a pathway with a goal of limiting the average global temperature increase by seeking to limit the concentration of greenhouse gas in the atmosphere to around 450 parts per million of CO2 equivalent.  The 450 Scenario is aligned with the goals of the Paris Accord although it only limits the rise in temperature to 2 degrees Celsius. As the chart above shows, the EIA believes implementation of the 450 Scenario would not only halt the growth of global oil demand but significantly reduce the demand by 2040.


Suggested Reading:

Exploration and Production: 2020-3Q Review and Outlook

Mergers Within the Energy Industry are Heating Up

Energy Stock Prices Have Led to Higher Dividend Yields

Subscribe to Channelchek’s YouTube Channel

Each event in our popular Virtual Road Shows Series has a maximum capacity of 100 investors online. To take part, listen to and perhaps get your questions answered, see which virtual investor meeting intrigues you here.


Sources:

https://www.opec.org/opec_web/flipbook/WOO2017/WOO2017/assets/common/downloads/WOO%202017.pdf, OPEC, October 2020

https://www.reuters.com/article/us-oil-opec-outlook/opec-in-major-shift-says-oil-demand-to-plateau-in-late-2030s-idUSKBN26T24C, Alex Lawler, Reuters, October 8, 2020

https://www.offshore-energy.biz/opec-oil-demand-to-decline-after-plateauing-in-late-2030s/, Bojan Lepic, Offshore Energy, October 9, 2020

https://www.icis.com/explore/resources/news/2019/11/13/10443245/petchems-demand-for-crude-oil-set-to-boom-despite-rising-recycling-rates-iea, Jonathan Lopez, ICIS, November 13, 2019

https://www.aljazeera.com/economy/2020/10/8/to-pump-or-not-to-pump-opec-sees-rise-then-fall-in-oil-demand, Aljazeera, October 8, 2020

http://priceofoil.org/2018/10/31/explainer-iea-scenarios-and-the-paris-goals/, Greg Muttitt, OilChange International, October 31, 2018


Release – Ely Gold Royalties (ELYGF) Purchases Trenton Canyon Royalty, Nevada

Ely Gold Royalties (TSXV:ELY, OTCQX:ELYGF) Purchases Trenton Canyon Royalty, Nevada

Property Currently Being Drilled by SSR Mining


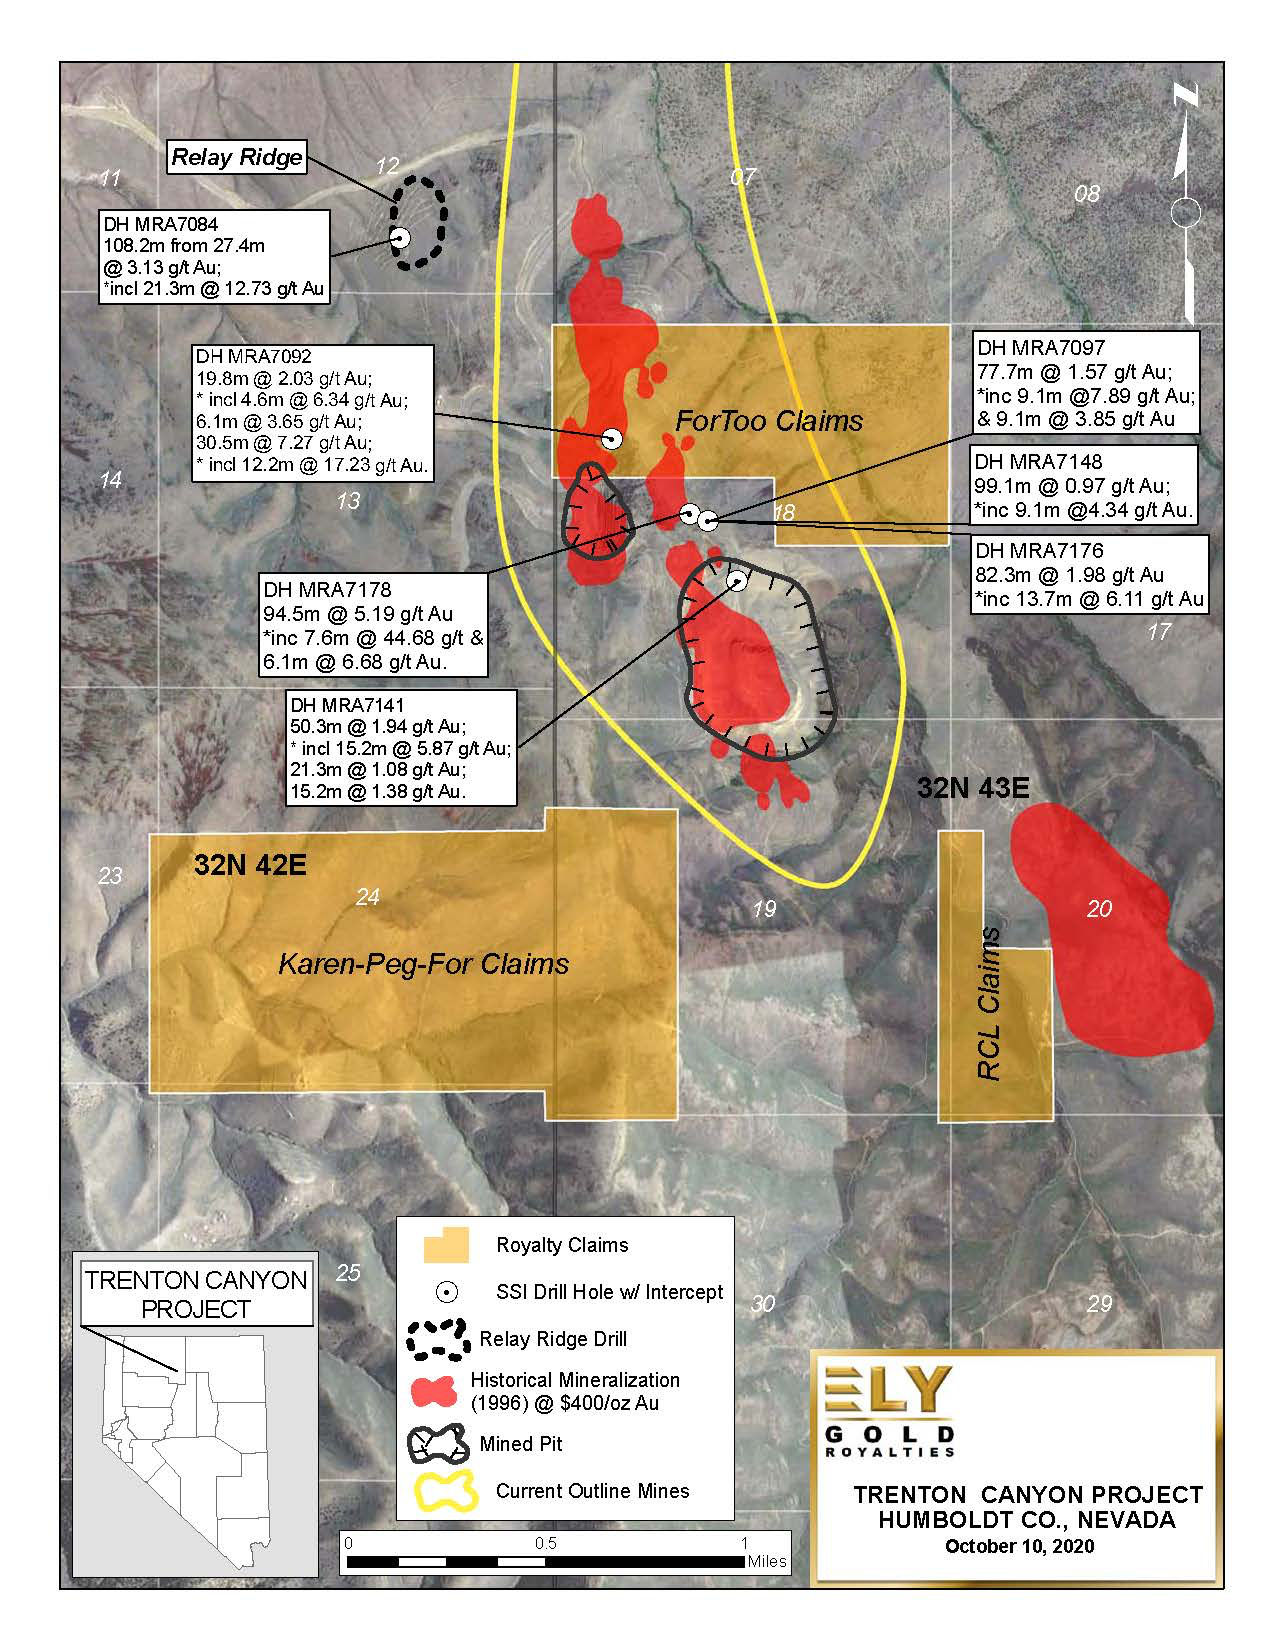
Vancouver, British Columbia, Canada, October 13, 2020. Ely Gold Royalties Inc. (TSXV:ELY, OTCQX:ELYGF) (“Ely Gold” or the “Company”) through its wholly owned subsidiary, Nevada Select Royalty, Inc. (“Nevada Select”) has agreed to purchase, a 0.3% net smelter returns royalty (“NSR”) from a private individual (the “Trenton Canyon Royalty”). The Trenton Canyon Royalty covers 52 unpatented mining claims (the “Royalty Claims”) located on the Battle Mountain-Eureka trend, Nevada, which is currently being drilled by SSR Mining (NASDAQ: SSRM, TSX:SSRM) (“SSR”). (see Figure 1). The transaction is subject to the approval of the Toronto Venture Exchange (“TSXV”) and is expected to close on December 1, 2020 (the “Closing”).

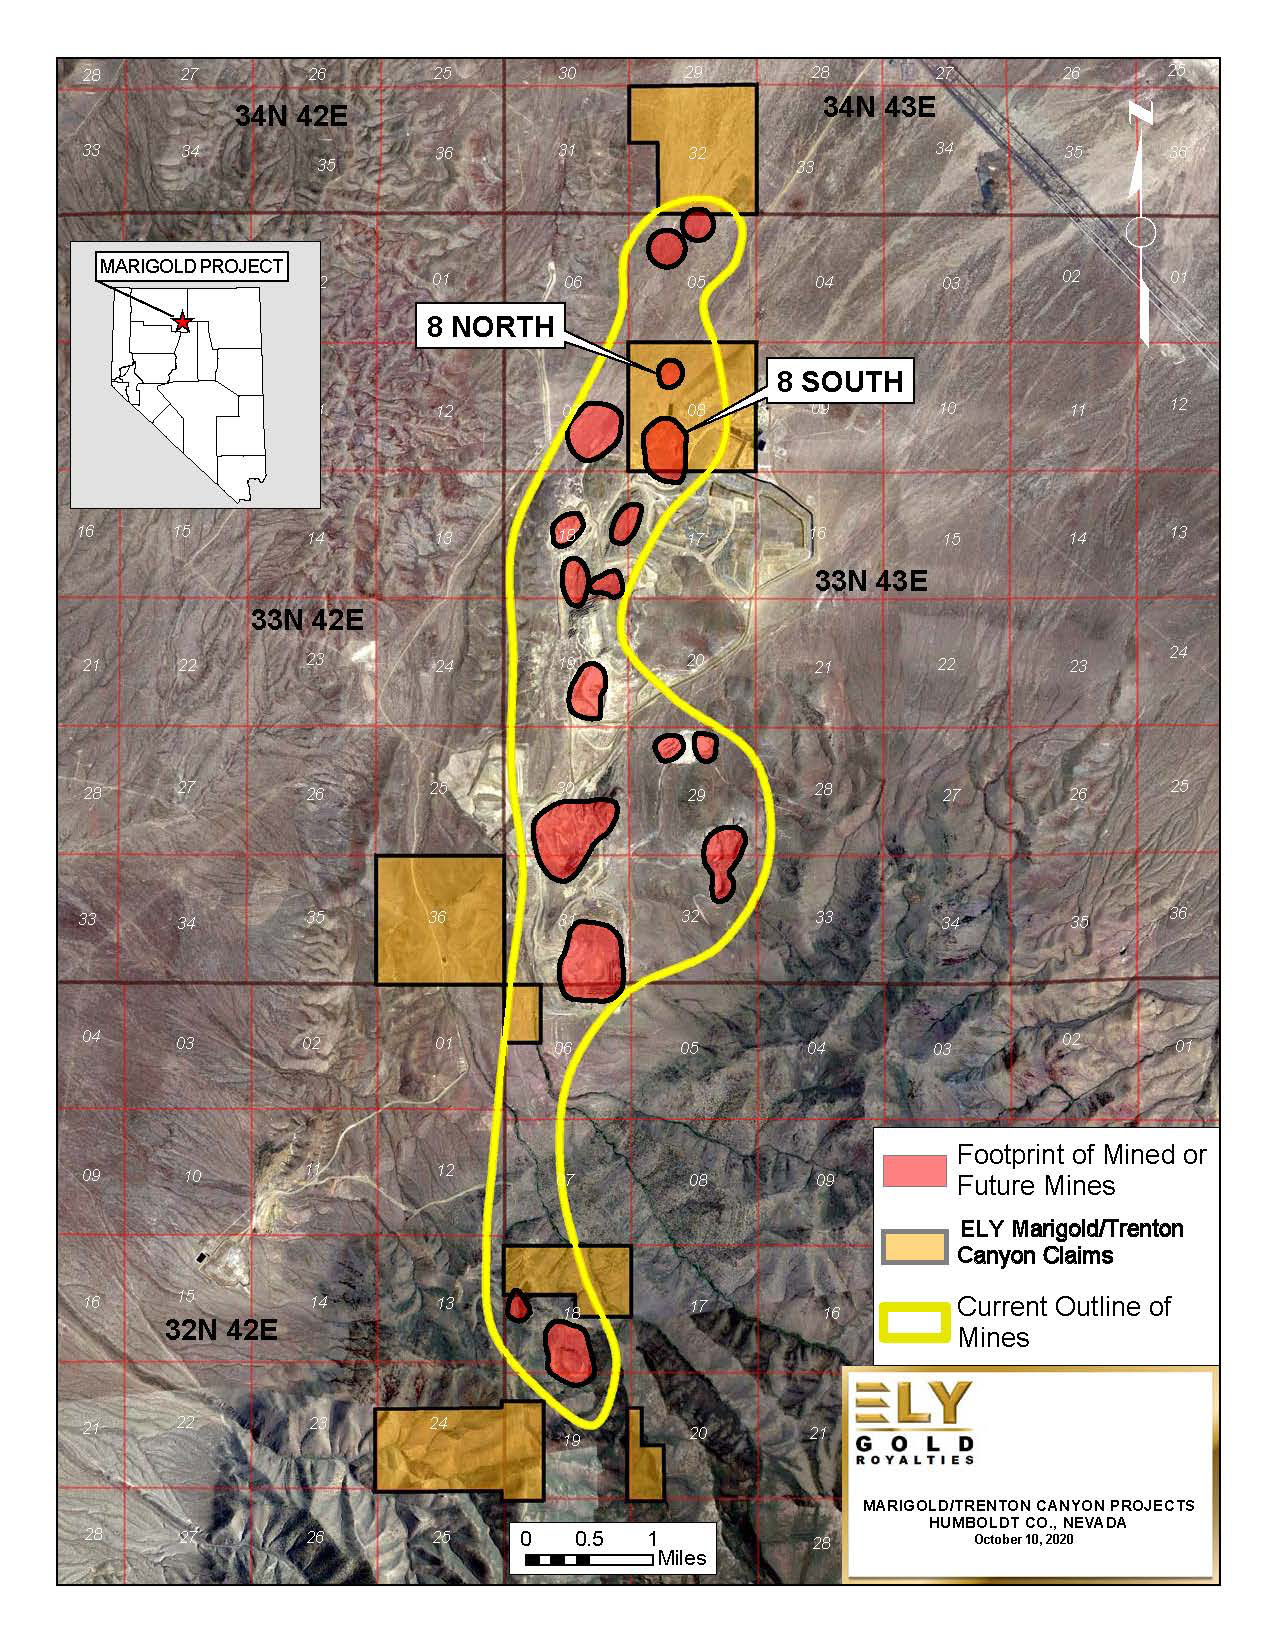
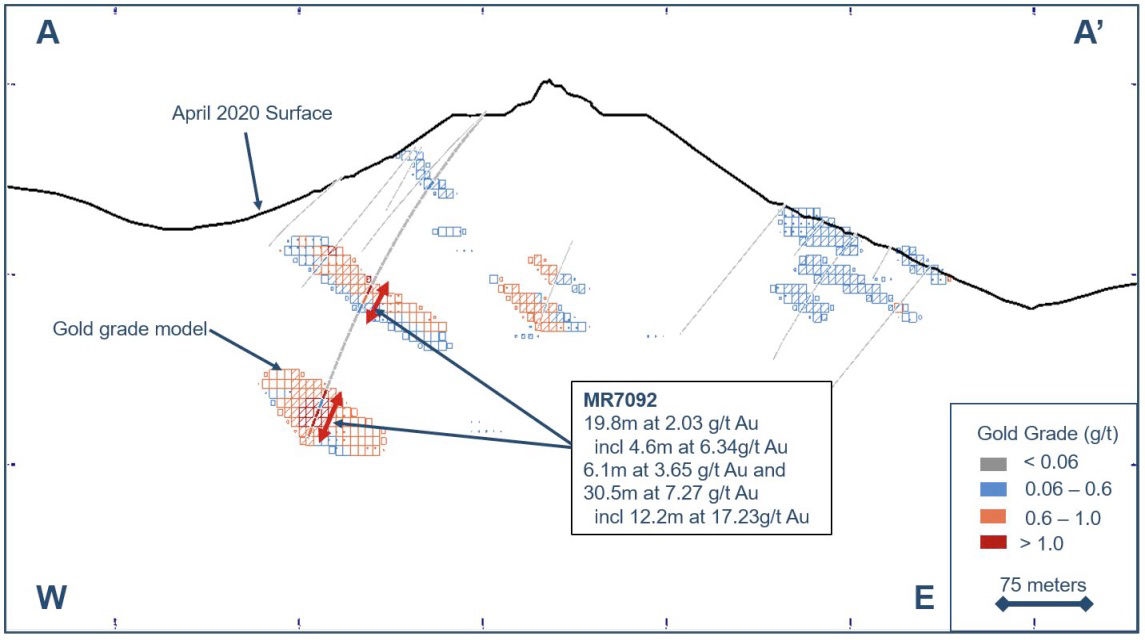
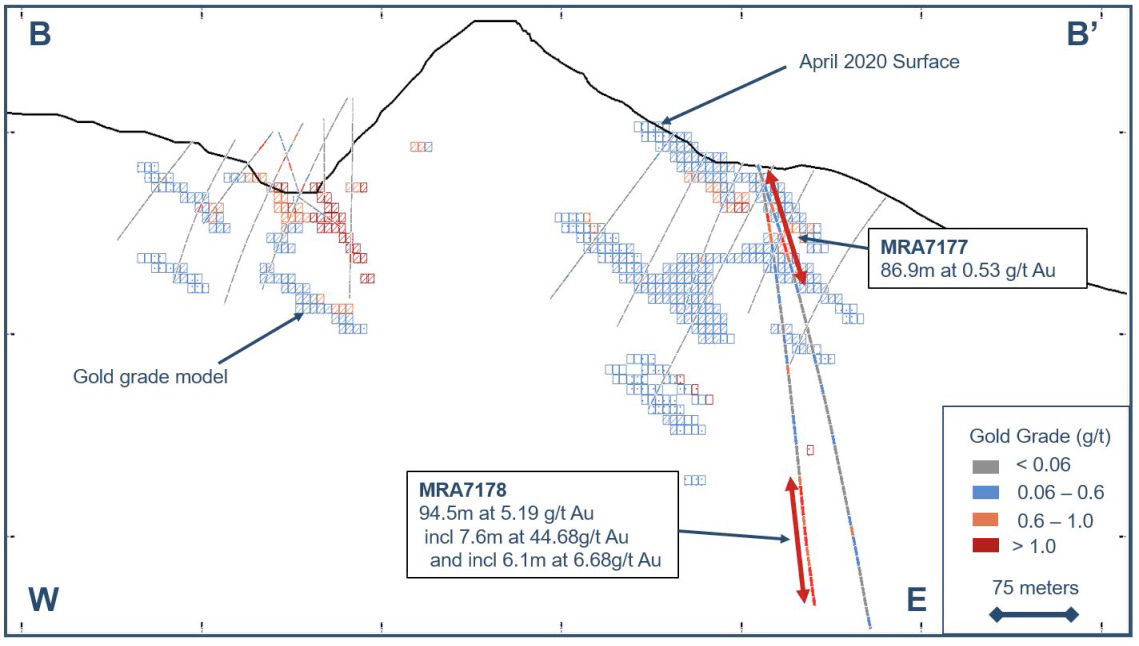
The Trenton Canyon property consists of 7,350 hectares located immediately south and along the mineralized trend from SSR’s Marigold mine where Ely Gold also has a 0.75%. (see figure 2). The property was previously operated as an open-pit run-of-mine heap leach operation from 1996 to 2001 by Newmont Corporation. SSR purchased Trenton Canyon from Newmont in June 2019. Recent drilling by SSR (see news release May 14, 2020), on the Royalty Claims, returned 7.27 g/t gold over 30.5 meters, including 12.2 meters of 17.23 g/t gold, leading to the discovery of gold mineralization that is transitional oxide in drillhole MRA7092. Two additional mineralized intercepts in the MRA7092 returned 19.8 meters of 2.03 g/t gold and 6.1 meters of 3.65 g/t gold. (see figure 3). Numerous other drill holes immediately south of the Royalty Claims returned significant results in multiple zones. These include MRA7178 which assayed 94.5 meters of 5.19 g/t gold including 7.6 meters of 44.68 g/t gold (see figure 3).

The Transaction

Ely Gold will pay total consideration of US$300,000 to be comprised of US$150,000 in cash payable now and US$150,000 in cash to be paid on January 15, 2021(the “Deferred Payment”). Ely Gold will also issue 1,000,000 common stock warrants (the “Ely Warrants”). The Ely Warrants have a two-year term and will have an exercise price of CDN$1.36. Securities issued under the Ely Warrants will be subject to a four-month hold period. The deferred payment will accrue simple interest at 5%.

Trey Wasser, President & CEO of Ely Gold commented, “Once again our relationships in Nevada have provided
us with an excellent royalty opportunity. SSR is generating exploration excitement at Trenton Canyon and this
royalty purchase places us right in the middle of that action. It also fits our strategy of adding to our portfolio of existing royalty positions in Nevada.”

Jerry Baughman, President of Nevada commented, “The Trenton Canyon Royalty is located on the Battle Mountain-
Eureka trend and with its close proximity to infrastructure and a strong operating partner in SSR Mining, provides an excellent royalty value to Ely Gold. This asset is yet another example of our strategy of acquiring or generating royalties that are at or near producing mines. This transaction is a testament to our ability to make third-party royalty purchases due to our long-standing relationships throughout Nevada.”

Trenton Canyon Royalty

Figure 1

Ely Gold Marigold Royalty Claims

Figure 2

SSR Mining Cross Sections

Figure 3

Figure 4

Drill results and Figures 3 & 4 see SSR Mining press release dated May 14, 2020

Qualified Person

Stephen Kenwood, P. Geo, is director of the Company and a Qualified Person as defined by NI 43-101. Mr. Kenwood has reviewed and approved the technical information in this press release.

About Ely Gold Royalties Inc.

Ely Gold Royalties Inc. is a Nevada focused gold royalty company. Its current portfolio includes royalties at Jerritt Canyon, Goldstrike and Marigold, three of Nevada’s largest gold mines, as well as the Fenelon mine in Quebec, operated by Wallbridge Mining. The Company continues to actively seek opportunities to purchase producing or near-term producing royalties. Ely Gold also generates development royalties through property sales on projects that are located at or near producing mines. Management believes that due to the Company’s ability to locate and purchase third-party royalties, its strategy of organically creating royalties and its gold focus, Ely Gold offers shareholders a favourable leverage to gold prices and low-cost access to long-term gold royalties in safe mining jurisdictions.

On Behalf of the Board of Directors
Signed “Trey Wasser”
Trey Wasser, President & CEO

For further information, please contact:

Trey Wasser, President & CEO
trey@elygoldinc.com

972-803-3087

Joanne Jobin, Investor Relations Officer
jjobin@elygoldinc.com

647 964 0292

FORWARD-LOOKING CAUTIONS: This press release contains certain “forward-looking statements” within the meaning of Canadian securities legislation, including, but not limited to, statements regarding completion of the Transaction. Forwardlooking statements are statements that are not historical facts; they are generally, but not always, identified by the words “expects,” “plans,” “anticipates,” “believes,” “intends,” “estimates,” “projects,” “aims,” “potential,” “goal,” “objective,” “prospective,” and similar expressions, or that events or conditions “will,” “would,” “may,” “can,” “could” or “should” occur, or are those statements, which, by their nature, refer to future events. The Company cautions that forward-looking statements are based on the beliefs, estimates and opinions of the Company’s management on the date the statements are made and they involve a number of risks and uncertainties. Consequently, there can be no assurances that such statements will prove to be accurate and actual results and future events could differ materially from those anticipated in such statements. Except to the extent required by applicable securities laws and the policies of the TSX Venture Exchange, the Company undertakes no obligation to update these forward-looking statements if management’s beliefs, estimates or opinions, or other factors, should change. Factors that could cause future results to differ materially from those anticipated in these forward-looking statements include the Company’s inability to control whether the buy-down right will ever be exercised, and whether the right of first refusal will ever be triggered, uncertainty as to whether any mining will occur on the property covered by the Probe Royalty such that the Company will receive any payment therefrom, and the general risks and uncertainties relating to the mineral exploration, development and production business. The reader is urged to refer to the Company’s reports, publicly available through the Canadian Securities Administrators’ System for Electronic Document Analysis and Retrieval (SEDAR) at www.sedar.com for a more complete discussion of such risk factors and their potential effect.

Neither the TSX Venture Exchange nor its Regulation Services Provider accepts responsibility for the adequacy or accuracy of this release.

Release – Lineage Cell Therapeutics And Cancer Research UK Announce Encouraging Preliminary Phase 1 Study Results

Lineage Cell Therapeutics And Cancer Research UK Announce Encouraging Preliminary Phase 1 Study Results With Vac2 For The Treatment Of Non-Small Cell Lung Cancer


  • Potent Induction of Immune Responses Observed with VAC2 Vaccine
  • Peripheral Antigen-specific Immunogenicity Above 3% Observed at Multiple Timepoints
  • VAC2 Appears Well Tolerated with No Unexpected Adverse Events

CARLSBAD, Calif. & LONDON–(BUSINESS WIRE)–Oct. 13, 2020– Lineage Cell Therapeutics, Inc. (NYSE American and TASE: LCTX), a clinical-stage biotechnology company developing novel cell therapies for unmet medical needs, and Cancer Research UK, the world’s leading cancer charity dedicated to saving lives through research, today announced encouraging preliminary results from an ongoing Phase 1 clinical study of VAC2 in non-small cell lung cancer (NSCLC). VAC2 demonstrated remarkably potent induction of immune responses in all patients dosed to date, with high levels of peripheral antigen-specific immunogenicity observed at multiple time points and confirmed by multimer staining. On the basis of these findings, and following completion of the ongoing VAC2 clinical study in NSCLC, Lineage will seek to evaluate VAC2 in combination with therapies considered biologically complementary to VAC2, such as chemotherapy and the immune cell protectant properties offered by anti-PD1 immunotherapy.

Lineage recently conducted an early exercise of its option to acquire data from Cancer Research UK and assumed responsibility for further development of the VAC2 product candidate as well as future development opportunities derived from the VAC platform, while Cancer Research UK’s Centre for Drug Development concludes the ongoing clinical study.

“Based on review of all available data, the therapy was safe and well tolerated in all patients. While the safety profile was expected, the immunogenicity data are remarkable and highly provocative,” stated Christian Ottensmeier, MD, PhD, FRCP, Professor of Experimental Medicine at the University of Southampton and Chief Investigator on the VAC2 clinical study. “Antigen-reactive pentamer staining data induced by VAC2 suggest that the vaccine is highly potent, inducing significantly higher levels of antigen-specific T cells, compared with that invoked by alternative vaccine approaches, such as DNA- and RNA-based vaccines. From my perspective as an immuno-oncologist these data support rapid phase II testing, focused on clinical benefit.”

Brian Culley, Chief Executive Officer of Lineage, said: “Interestingly, one patient experienced a radiological response following chemotherapy subsequent to VAC2 treatment. Although anecdotal and occurring after the patient had completed the VAC2 trial, responses in this setting are rare and support further investigation. Dendritic cells are the most potent antigen-presenting cells in the body and harnessing their power to accurately deliver information about foreign material is re-emerging as an attractive therapeutic modality based on their consistent safety profile and increasing knowledge of how to deploy them in the clinical setting. As a leader in the field of cell therapy, Lineage aims to advance the current VAC2 product candidate and identify ways to expand the VAC platform through internally-owned and externally-partnered antigens.”

Dr. Nigel Blackburn, Cancer Research UK’s Director of Drug Development, said: “We are pleased to see, after several years of development, the clinical progress that VAC2 has made and the impact it could have for people with lung cancer, which is the third most common cancer in the UK. We are excited to continue our support of the next phase of development of VAC2 and assist with the expansion of those efforts into additional cancers, and other potential areas with significant unmet medical need.”

About VAC2

VAC2 is an allogeneic, or non-patient specific, off-the-shelf cancer vaccine product candidate designed to stimulate patient immune responses to an antigen commonly expressed in cancerous cells but not in normal adult cells. VAC2, which is produced from a pluripotent cell technology using a directed differentiation method, is comprised of a population of nonproliferating mature dendritic cells. As the most potent type of antigen presenting cell in the body, dendritic cells instruct the body’s immune system to attack and eliminate harmful pathogens and unwanted cells. Because the tumor antigen is loaded exogenously into the dendritic cells prior to administration, VAC2 is a platform technology that can be modified to carry any antigen, including patient-specific tumor neo-antigens or viral antigens. VAC2 is currently being tested in a Phase 1 clinical study in adult patients with non-small cell lung cancer (NSCLC) in the advanced and adjuvant settings (NCT03371485), conducted by Cancer Research UK.

About T Cell Induction

Lopes A, Vandermeulen G, Préat V. Cancer DNA vaccines: current preclinical and clinical developments and future perspectives. J Exp Clin Cancer Res. 2019;38(1):146.; Sebastian M, Schröder A, Scheel B, et al. A phase I/IIa study of the mRNA-based cancer immunotherapy CV9201 in patients with stage IIIB/IV non-small cell lung cancer. Cancer Immunology, Immunotherapy 2019;68(5):799-812.

About Cancer Research UK’s Centre for Drug Development

Cancer Research UK has an impressive record of developing novel treatments for cancer. The Cancer Research UK Centre for Drug Development has been pioneering the development of new cancer treatments for 25 years, taking over 140 potential new anti-cancer agents into clinical trials in patients. It currently has a portfolio of 21 new anti-cancer agents in preclinical development, Phase I or early Phase II clinical trials. Six of these new agents have made it to market including temozolomide for brain cancer, abiraterone for prostate cancer and rucaparib for ovarian cancer. Two other drugs are in late development Phase III trials.

About Cancer Research UK’s Commercial Partnerships Team

Cancer Research UK is the world’s leading cancer charity dedicated to saving lives through research. Cancer Research UK’s specialist Commercial Partnerships Team works closely with leading international cancer scientists and their institutes to protect intellectual property arising from their research and to establish links with commercial partners. Cancer Research UK’s commercial activity operates through Cancer Research Technology Ltd., a wholly owned subsidiary of Cancer Research UK. It is the legal entity which pursues drug discovery research in themed alliance partnerships and delivers varied commercial partnering arrangements.

About Cancer Research UK

  • Cancer Research UK is the world’s leading cancer charity dedicated to saving lives through research.
  • Cancer Research UK’s pioneering work into the prevention, diagnosis and treatment of cancer has helped save millions of lives.
  • Cancer Research UK has been at the heart of the progress that has already seen survival in the UK double in the last 40 years.
  • Today, 2 in 4 people survive their cancer for at least 10 years. Cancer Research UK’s ambition is to accelerate progress so that by 2034, 3 in 4 people will survive their cancer for at least 10 years.
  • Cancer Research UK supports research into all aspects of cancer through the work of over 4,000 scientists, doctors and nurses.
  • Together with its partners and supporters, Cancer Research UK’s vision is to bring forward the day when all cancers are cured.

For further information about Cancer Research UK’s work or to find out how to support the charity, please call 0300 123 1022 or visit www.cancerresearchuk.org. Follow us on Twitter and Facebook.

About Lineage Cell Therapeutics, Inc.

Lineage Cell Therapeutics is a clinical-stage biotechnology company developing novel cell therapies for unmet medical needs. Lineage’s programs are based on its robust proprietary cell-based therapy platform and associated in-house development and manufacturing capabilities. With this platform Lineage develops and manufactures specialized, terminally differentiated human cells from its pluripotent and progenitor cell starting materials. These differentiated cells are developed to either replace or support cells that are dysfunctional or absent due to degenerative disease or traumatic injury or administered as a means of helping the body mount an effective immune response to cancer. Lineage’s clinical programs are in markets with billion dollar opportunities and include three allogeneic (“off-the-shelf”) product candidates: (i) OpRegen®, a retinal pigment epithelium transplant therapy in Phase 1/2a development for the treatment of dry age-related macular degeneration, a leading cause of blindness in the developed world; (ii) OPC1, an oligodendrocyte progenitor cell therapy in Phase 1/2a development for the treatment of acute spinal cord injuries; and (iii) VAC, an allogeneic dendritic cell therapy platform for immuno-oncology and infectious disease, currently in clinical development for the treatment of non-small cell lung cancer and in preclinical development for additional cancers and as a vaccine against infectious diseases, including SARS-CoV-2, the virus which causes COVID-19. For more information, please visit www.lineagecell.com or follow the Company on Twitter @LineageCell.

Forward-Looking Statements

Lineage cautions you that all statements, other than statements of historical facts, contained in this press release, are forward-looking statements. Forward-looking statements, in some cases, can be identified by terms such as “believe,” “may,” “will,” “estimate,” “continue,” “anticipate,” “design,” “intend,” “expect,” “could,” “plan,” “potential,” “predict,” “seek,” “should,” “would,” “contemplate,” project,” “target,” “tend to,” or the negative version of these words and similar expressions. Such statements include, but are not limited to, statements relating to Lineage’s plans to advance the VAC2 platform. Forward-looking statements involve known and unknown risks, uncertainties and other factors that may cause Lineage’s actual results, performance or achievements to be materially different from future results, performance or achievements expressed or implied by the forward-looking statements in this press release, including risks and uncertainties inherent in Lineage’s business and other risks in Lineage’s filings with the Securities and Exchange Commission (the SEC). Lineage’s forward-looking statements are based upon its current expectations and involve assumptions that may never materialize or may prove to be incorrect. All forward-looking statements are expressly qualified in their entirety by these cautionary statements. Further information regarding these and other risks is included under the heading “Risk Factors” in Lineage’s periodic reports with the SEC, including Lineage’s Annual Report on Form 10-K filed with the SEC on March 12, 2020 and its other reports, which are available from the SEC’s website. You are cautioned not to place undue reliance on forward-looking statements, which speak only as of the date on which they were made. Lineage undertakes no obligation to update such statements to reflect events that occur or circumstances that exist after the date on which they were made, except as required by law.

Lineage Cell Therapeutics, Inc. IR
Ioana C. Hone
(ir@lineagecell.com)
(442) 287-8963

Solebury Trout IR
Gitanjali Jain Ogawa
(Gogawa@troutgroup.com)
(646) 378-2949

Russo Partners – Media Relations
Nic Johnson or David Schull
Nic.johnson@russopartnersllc.com
David.schull@russopartnersllc.com
(212) 845-4242

Source: Lineage Cell Therapeutics, Inc.

Release – U.S. Gold Corp. (USAU) Issues October 2020 Shareholder Letter

U.S. Gold Corp. Issues October 2020 Shareholder Letter


ELKO, Nev., Oct. 13, 2020 /PRNewswire/ — U.S. Gold Corp. (NASDAQ: USAU) (the “Company”), a gold exploration and development company, today announced that it has issued a letter to its shareholders outlining the Company’s recent and expected milestones, as it continues to advance its assets and projects.

Recent Company highlights include:

  • Acquisition of Northern Panther Resource Corporation, which provided USAU with the Challis Gold Project in Idaho, additional capital and some key industry shareholders
  • Strengthening of the management team with the appointments of George Bee as President and Eric Alexander as CFO
  • Commencement of the CK Gold Project Pre-Feasibility Study

“This year has been anything but normal with the ongoing upheavals caused by the COVID-19 pandemic, but I’m proud that U.S. Gold Corp. has continued to push forward and advance our portfolio like the CK Gold Project and grow our business with the acquisition of Northern Panther,” stated Edward Karr, CEO of U.S. Gold Corp. “With the consistent strength of the gold market through turbulent times, I’m excited for what the coming months and years hold for our Company, and look forward to speaking with shareholders further at our annual general meeting in November.”

A copy of the letter is available on our website at: www.usgoldcorp.gold/Oct2020-SH-Letter

About U.S. Gold Corp.

U.S. Gold Corp. is a publicly traded, U.S. focused gold exploration and development company. U.S. Gold Corp. has a portfolio of exploration properties. Copper King, now the CK Gold Project, is located in Southeast Wyoming and has a Preliminary Economic Assessment (PEA) technical report, which was completed by Mine Development Associates. Keystone and Maggie Creek are exploration properties on the Cortez and Carlin Trends in Nevada. The Challis Gold Project is located in Idaho. For more information about U.S. Gold Corp., please visit www.usgoldcorp.gold

Safe Harbor

Certain statements in this press release are forward-looking within the meaning of the Private Securities Litigation Reform Act of 1995. These statements may be identified by the use of forward-looking words such as “anticipate,” “believe,” “forecast,” “estimated,” and “intend,” among others. These forward-looking statements are based on U.S. Gold Corp.’s current expectations, and actual results could differ materially from such statements. There are a number of factors that could cause actual events to differ materially from those indicated by such forward-looking statements. These factors include, but are not limited to, risks arising from: the prevailing market conditions for metal prices and mining industry cost inputs, environmental and regulatory risks, risks faced by junior companies generally engaged in exploration activities, whether U.S. Gold Corp. will be able to raise sufficient capital to implement future exploration programs, COVID-19 uncertainties, and other factors described in the Company’s most recent Annual Report on Form 10-K, Quarterly Reports on Form 10-Q, and Current Reports on Form 8-K filed with the Securities and Exchange Commission, which can be reviewed at www.sec.gov. The Company has based these forward-looking statements on its current expectations and assumptions about future events. While management considers these expectations and assumptions to be reasonable, they are inherently subject to significant business, economic, competitive, regulatory, and other risks, contingencies, and uncertainties, most of which are difficult to predict and many of which are beyond the Company’s control. The Company makes no representation or warranty that the information contained herein is complete and accurate and we have no duty to correct or update any information contained herein.

For additional information, please contact:

U.S. Gold Corp. Investor Relations: +1 800 557 4550
ir@usgoldcorp.gold
www.usgoldcorp.gold

SOURCE U.S. Gold Corp.

Release – DYAI – Dyadic Updates Market on COVID-19 Initiatives

Dyadic Updates Market on COVID-19 Initiatives


  • C1 Expression of SARS-CoV-2 Monoclonal Antibody Achieved
  • Ten On-going Animal Trials of C1 Expressed SARS-CoV-2 Receptor Binding Domain (RBD) Antigen by Seven Different Collaborators
  • Record Expression Level of C1 SARS-CoV-2 RBD Antigen (3 g/l in 5 days)
  • Non-Exclusive Technology Usage Agreement with Epygen Biotech of India

JUPITER, FL / ACCESSWIRE / October 12, 2020 / Dyadic International, Inc. (“Dyadic” or the “Company”) (NASDAQ:DYAI), a global biotechnology company focused on further applying its proprietary C1 gene expression platform to accelerate development, lower production costs and improve the performance of biologic vaccines and drugs at flexible commercial scales, today is updating the market on the progress made in certain of its coronavirus (COVID-19) programs globally.

Dyadic’s C1 Rapid Recombinant Protein Manufacturing Platform has demonstrated that it can manufacture monoclonal antibodies (mAbs) more efficiently and faster than currently existing CHO mAb technology, potentially broadening access to this therapeutic treatment. Dyadic has expressed a SARS-CoV-2 monoclonal antibody in collaboration with a biotech company that is developing antibody cocktails to treat COVID-19 patients.

“The recent successful use of monoclonal antibody cocktails for the treatment of COVID-19 has also highlighted important production and supply constraints. Our C1 platform has the potential to generate 3x to 4x greater quantities of monoclonal antibodies in the same timeframe when compared to the current production methods using CHO cells. While that is still not yet enough to meet anticipated global demand, it certainly is a significant step in potentially helping to ensure greater access to patients, and at a lower cost,” said Dyadic CEO, Mark Emalfarb.

Dyadic has developed a COVID-19 vaccine antigen from its proprietary and patented C1 cell line that can be produced at three grams per liter (3 g/l) in only five days. The proprietary C1 expressed receptor binding domain (RBD) of the SARS-CoV-2 spike protein is being used in animal trials by seven different research groups, governmental agencies and biopharma companies (including the Israel Institute for Biological Research (IIBR) and a collaboration of European Union scientists that participated with Dyadic in the ZAPI program). These parties are testing the C1 expressed RBD vaccine candidate(s) in animal trials on a stand-alone basis as well as testing the C1 RBD with nanoparticles and adjuvants. The Company currently expects up to ten animal trials to be completed by the end of 2020. These programs are in addition to the previously announced activities with the Frederick National Laboratory, Jiangsu Hengrui Medicine and other third-party collaborations which are working with Dyadic’s C1 expression platform to express their own COVID-19 and other vaccine and antibody candidates for a number of animal and human health applications.

Data generated by a number of these third parties confirmed that the C1 expressed RBD has the correct structure resulting in high binding and neutralizing capacity. Additionally, the recently concluded IIBR mice study shows that the C1 RBD has the potential to generate excellent immunogenicity responses with very high titers and neutralizing antibodies against the SARS-CoV-2 coronavirus.

“The initial mice trial, as reported to us by the IIBR, was very successful, and we expect to have additional data to disclose after a number of these animal trials are completed and their data is analyzed further. Going forward, we expect there will be follow-on animal studies which will include challenge studies with hamsters and human Ace2 transgenic mice, as well as additional studies including a toxicology study,” continued Mr. Emalfarb. “Further, our C1 technology can express high levels of proteins more rapidly at flexible commercial scales more affordably using single use or stainless-steel bioreactors. We believe that our C1 platform, developed initially for high-volume low-cost industrial use, easily enables affordable, regional production of vaccines, antibodies and other therapeutic proteins, which has driven a heightened interest in our C1 technology.”

Dyadic has recently entered into a non-exclusive technology usage agreement with Epygen Biotech of India, who after obtaining required funding, expects to produce cGMP clinical trial material at their facility and conduct clinical trials in India using Dyadic’s C1 expressed RBD antigen of the SARS-CoV-2 Spike Protein.

“The Epygen agreement demonstrates how potential collaborators globally can develop and eventually manufacture vaccines and drugs on a regional basis that are affordable, safe and effective. Debayan Ghosh, President and Founder of Epygen, is intimately familiar with our technology from his work at Biocon as a biotechnologist, his time spent working for Dyadic in the late 90’s and, most recently, as a result of Epygen’s interest in the manufacturing of cGMP clinical grade C1 expressed RBD antigens. It is especially gratifying for us to be working with someone who understands, firsthand, C1’s success in industrial biotech and appreciates how the technology can be broadly applied to biopharmaceuticals,” concluded Mr. Emalfarb.

About Dyadic International, Inc.

Dyadic International, Inc. is a global biotechnology company which is developing what it believes will be a potentially significant biopharmaceutical gene expression platform based on the fungus Thermothelomyces heterothallica (formerly Myceliophthora thermophila), named C1. The C1 microorganism, which enables the development and large scale manufacture of low cost proteins, has the potential to be further developed into a safe and efficient expression system that may help speed up the development, lower production costs and improve the performance of biologic vaccines and drugs at flexible commercial scales. Dyadic is using the C1 technology and other technologies to conduct research, development and commercial activities for the development and manufacturing of human and animal vaccines and drugs, such as virus like particles (VLPs) and antigens, monoclonal antibodies, Fab antibody fragments, Fc-Fusion proteins, biosimilars and/or biobetters, and other therapeutic proteins. Certain other research activities are ongoing which include the exploration of using C1 to develop and produce certain metabolites and other biologic products. Dyadic pursues research and development collaborations, licensing arrangements and other commercial opportunities with its partners and collaborators to leverage the value and benefits of these technologies in development and manufacture of biopharmaceuticals. In particular, as the aging population grows in developed and undeveloped countries, Dyadic believes the C1 technology may help bring biologic vaccines, drugs and other biologic products to market faster, in greater volumes, at lower cost, and with new properties to drug developers and manufacturers, and improve access and cost to patients and the healthcare system, but most importantly save lives.

Please visit Dyadic’s website at http://www.dyadic.com for additional information, including details regarding Dyadic’s plans for its biopharmaceutical business.

Safe Harbor Regarding Forward-Looking Statements

This press release contains forward-looking statements within the meaning of Section 27A of the Securities Act of 1933 and Section 21E of the Securities Exchange Act of 1934, including those regarding Dyadic International’s expectations, intentions, strategies and beliefs pertaining to future events or future financial performance. Actual events or results may differ materially from those in the forward-looking statements as a result of various important factors, including those described in the Company’s most recent filings with the SEC. Dyadic assumes no obligation to update publicly any such forward-looking statements, whether as a result of new information, future events or otherwise. For a more complete description of the risks that could cause our actual results to differ from our current expectations, please see the section entitled “Risk Factors” in Dyadic’s annual reports on Form 10-K and quarterly reports on Form 10-Q filed with the SEC, as such factors may be updated from time to time in Dyadic’s periodic filings with the SEC, which are accessible on the SEC’s website and at http://www.dyadic.com.

Contact:

Ping W. Rawson
Chief Financial Officer
Phone: (561) 743-8333
Email: mailto:prawson@dyadic.com

SOURCE: Dyadic International, Inc.

FAT Brands Inc. (FAT) – Upgrading to Outperform with $8 Price Target

Monday, October 12, 2020

FAT Brands Inc. (FAT)

Upgrading to Outperform with $8 Price Target

FAT Brands Inc is a multi-brand restaurant franchising company. It develops, markets, and acquires predominantly fast casual restaurant concepts. The company provides turkey burgers, chicken Sandwiches, chicken tenders, burgers, ribs, wrap sandwiches, and others. Its brand portfolio comprises Fatburger, Buffalo’s Cafe and Express, and Ponderosa and Bonanza. The company’s overall footprint covers nearly 32 countries. Fatburger generates maximum revenue for the company.

Joe Gomes, Senior Research Analyst, Noble Capital Markets, Inc.

Refer to the full report for the price target, fundamental analysis, and rating.

    Upgrading to Outperform. We are upgrading FAT Brands to Outperform from Market Perform and initiating an $8.00 12-month price target. With the dust and euphoria settling from the Johnny Rockets acquisition announcement, when the shares ran up to $10.25, we believe the risk/reward situation has turned favorable for FAT Brands and its asset light, high growth restaurant franchising model.

    Johnny Rockets Acquisition.  Completed on September 22nd for $25 million, Johnny Rockets added some 322 locations, $316 million of system-wide sales, and 129 franchisees. FAT Brands now has over 700 restaurant locations, over $700 million of system-wide sales, and 305 franchisees, including 101 multi-unit franchisees. FAT now operates in 36 U.S. States and 37 countries …


This Company Sponsored Research is provided by Noble Capital Markets, Inc., a FINRA and S.E.C. registered broker-dealer (B/D).

*Analyst certification and important disclosures included in the full report. NOTE: investment decisions should not be based upon the content of this research summary.  Proper due diligence is required before making any investment decision. 

Industry Report – Media – Quarterly Review: Has The Market Already Factored In The Elections?

Monday, October 12, 2020

Digital, Media & Entertainment Industry Report

Quarterly Review: Has The Market Already Factored In The Elections?

Michael Kupinski, DOR, Senior Research Analyst, Noble Capital Markets, Inc.

Refer to end of report for Analyst Certification & Disclosures

Overview: The fog of the elections.  Some companies have provided positive updated revenues/guidance, but the stocks have had little reaction. We ponder if investors are focused on the outcome of the upcoming elections and not on the positive, current fundamental developments.

Television: Ion provides a positive boost.  The Television stocks slightly underperformed the general market in the latest quarter, although E.W. Scripps had a great quarter, up 30.7%. Scripps surprised the investment community by making a $2.65 billion acquisition of Ion Media, in the midst of a pandemic. The shake-up in the wake of that acquisition leaves us to take a closer look at Gray Television.

Radio: Positive updates provided little investor interest.  The Noble Radio Index was the worse performing in the media sector, down 6.2% in the latest quarter. Notably, investors brushed off some positive, updated revenue numbers by Urban One and Townsquare Media. The Townsquare update, in particular, implies that it will solidly beat Q3 expectations. We highlight this sector as among our favored play for the upcoming quarter.

Publishing: Can the momentum continue?  The Tribune shares outperformed the general market and most of its peers in the third quarter, up 16.7% versus 8.5% for the general market. We believe that the outperformance of the industry in the quarter, in general, and that of Tribune, in particular, has investors possibly rethinking their view of the industry.

Digital/Entertainment: Gaming is hot.  Gaming and esports have garnered attention of Wall Street with an active number of deals. In this broad sector, we highlight the recent initiation of Travelzoo, a unique way to play the advertising recovery in the travel industry. In addition, we highlight the strong performance of 1800Flowers.com. The stock was up 144% in the quarter, benefiting from the surge in online retail. We recently raised our price target on the FLWS shares.

Overview

The Fog Of The Elections

Most media stock indices were in line to slightly outperforming the general market in the third quarter, save the Radio stocks, as the following figure illustrates. The overall media performance is disappointing given that media stocks tend to outperform the general market in the early stage of an economic recovery. The media indices are market cap weighted. What is notable regarding the media performance is that there was a disparity between larger cap and smaller cap companies. For instance, the average media stock was down in the quarter. 

Off of a difficult (to say the least) second quarter, revenue trends are expected to sequentially improve in the third quarter, fueled by Political advertising and digital revenues. Investors have now realized, however, that the shape of the advertising recovery is not likely to be “V” shaped. Third quarter revenues, excluding Political, are expected to be down double-digits for many advertising driven mediums, in the range of 10% to 15% versus 30% to 40% experienced on average in the second quarter. For mediums that benefit from Political advertising, we believe that there likely will be some positive upside Q3 revenue and cash flow surprise potential. Political is coming in better than expected and some companies, discussed later in this report, gave updated third quarter and/or Political guidance. The question will be whether investors will brush off the potential revenue and cash flow upside surprise?

We believe that investors are heavily engaged in the outcome of the general elections and implications for the broader economy. Investors worry that a Biden win could imply that tax rates will go up, given his tax platform plans to rollback the Trump tax cuts. We are often asked, when should we lock in gains? Now? Or, after the election? That question is not of significant importance for most media investors. The only media sectors that investors may have gains over the course of the last year are Publishing and Digital Media stocks, up 13% and 19%, respectively. Television and Radio stocks are down 27% and 46% respectively. 

In addition, with many state economies not fully opened, investors are likely concerned about the sustainability of the economic recovery, especially without visibility of a Covid vaccine. Given these concerns, investors may have already discounted the potential revenue and cash flow upside in the third and fourth quarters from Political advertising. We highlight the fact that Townsquare Media’s (view report) stock did not significantly react to the company’s updated third quarter revenue guidance on September 21, which provided positive upside in revenue and implied positive cash flow expectations. The TSQ shares increased a modest 5% since that announcement. As such, while we believe that fundamentals are improving, it appears likely that the media stocks may be range bound until the elections are over, or that there is a developed timetable for a Covid vaccine, which may allow some normalcy to reopening the US economy. 

Tradition Media

Television

Ion Got Investors Positively Excited

The Television stocks slightly under-performed the general market in the last quarter, up 6.9% versus 8.5% for the market as measured by the S&P 500 Index. The best performing stocks in the index were ViacomCBS and E.W. Scripps, up 20.1% and 30.7% respectively. In the case of E.W. Scripps, the company announced a significant $2.65 billion acquisition of Ion Media, with the backing of Warren Buffet’s Berkshire Hathaway. Notably, the acquisition will bring Scripps to the current ownership cap of 39% of US TV households. This takes another potential buyer of local TV stations out of the market, leaving Gray Television as among the few large broadcasters with the ability to add stations. Gray Television currently covers 24% of the nation’s TV households, with a significant runway to get to 39%. The question will be whether another inning of consolidation is in the offing with the mid tier broadcast groups, like Meredith and Graham Holdings. But, there is no mistaking, the industry is in the final innings of consolidation, unless there is relaxation of ownership rules. 

Such a prospect may come from the courts. Recently, the U.S. Supreme Court agreed to examine the media ownership rules that the FCC directed to relax, but was blocked by the 3rd Circuit Court of Appeals. The FCC would have ended or loosened ownership limits such as 1) the elimination of the newspaper/television cross ownership rule (which would allow a company to own a newspaper and television station in a single market), 2) the elimination of radio/television cross ownership, 3) the elimination of owning two of the top four stations in a market, and 4) allow a company to own two TV stations in a single market. The prospective appointment of another conservative on the bench, like Amy Coney Barrett, could significantly improve the chances that the FCC would win the appeal. 

For most investors, these rules don’t matter much. The Television industry is not likely to buy a newspaper or radio in an existing market. In many cases, public market values for television groups are double that of a publishing or radio company. Investors would frown on potentially lowering the stock valuation on such an acquisition. In addition, the history of broadcasters successfully integrating and operating a newspaper in market or even radio stations under grandfathered rules have not been that good. TV broadcasters would more likely seek to own two of the Big Four Network affiliates in market. This is where a broadcaster would get the biggest bang for the buck and investors would cheer. Those opportunities will be few and far between given the recent consolidation. Consequently, we view the prospective rule ownership changes as ho hum from a TV perspective. It would be far more beneficial to the TV stocks to see the ownership cap lifted from the current 39%. There does not seem to be any political will or leadership to push for that change. 

Consequently, we believe that management’s will turn their attention to seek opportunities for internal growth. Recently, a number of broadcasters have launched expanded news programming. We believe that it is likely that broadcasters will invest in original programming to take advantage of their increased scale. News programming tends to be the lowest hanging fruit for a broadcaster. But, development of original programming is only modest incremental steps toward enhanced cash flow growth. In our view, broadcasters will need to seek ways to take advantage of their spectrum and find innovative revenue opportunities, possibly through the implementation of the new broadcast standard, ATSC 3.0.

As we look toward the third quarter reports and fourth quarter guidance, investors will look toward the revenue recovery for some direction. There were some early indications that it will be a strong Q3 revenue quarter, fueled by Political advertising. E.W. Scripps (view report) raised its Political advertising guidance from $200 million to over $230 million. That guide was impressive given that it was based solely on the strength of Political advertising in the third quarter. The company may once again increase its guidance, if, as we expect, the Political advertising momentum continues into the fourth quarter. Political advertising carries very high margins. As such, it is likely that there will be positive upside surprises in the quarterly results. 

Given that the vast majority of the Television stocks have not performed well in the latest quarter, we believe that there should be better performance in the fourth quarter. In our view, the market has not baked in the improving revenue trends and the upside surprise potential from Political. In addition, the stocks should perform better as the fate of the upcoming elections is known. We remain constructive on the television sector, with our favorites currently Gray Television (view report) and Entravision (view report). 

Radio

Did Investors Overlook The Favorable News?

Radio stocks under performed the general market in the third quarter, down 6.2% versus an 8.4% gain for the market as measured by the S&P 500 Index. The Noble Radio index is market weighted, and, as such, the performance was skewed by the larger cap stocks in the index. The average stock was down greater than 6% and closer to 10%, with the worse performing stocks in the latest quarter Beasley Broadcast Group (BBGI), Salem Media (SALM) (view report) and Saga Communications (SGA), down 49%, 19% and 22%, respectively. The shares of Cumulus Media (CMLS) outperformed the group, up 35.9% in the quarter, with Entercom (ETM) coming in second, up 16.7% and Townsquare Media (TSQ) up 4.3%. The outperformance of the Cumulus Media shares in the second quarter was off of a very low base established at the end of the first quarter, when the shares dropped from a high of over $16 to near $4.  

The under performance of the Radio stocks is in spite of the expected sequential improvement in third quarter revenues from the second quarter, when some radio broadcasters reported revenues down as much as 60%. Recently, Urban One announced in an 8K filing that its radio revenues declined 40% in July and 38% in August, with September down a more modest 11%. Combined with the company’s other businesses outside of radio, Urban One’s third quarter total company revenue is expected to be down in the high teens percent. Townsquare Media appears to be doing better than most in the industry. It updated its investor presentation on September 21st and indicated that its July and August total company revenues declined 21% in July and 16% in August. We expect that. much like Urban One, there will be a significant improvement in revenues for September. In addition to a higher than expected amount of Political advertising, Townsquare appeared to be benefit from strength in its Digital businesses. The company indicated that its Townsquare Interactive business increased revenues in July and August by 13% and 15%, respectively. We believe that investors have not fully baked in the significance of this revenue improvement. In addition, given the high margin revenue, we believe that there are positive upside cash flow surprise potential. 

Radio is among the most out of favored stocks in the traditional media landscape. The recent under performance of the sector is likely a combination of the industry’s relatively high debt leverage and an extraordinary impact from Covid mitigation efforts. Given that the stocks are down an average of 52.4% year to date, the Radio stocks have been the poster industry for among the worse performing of many industries adversely affected by Pandemic. Are investors paying attention to the improving revenue trends? Surprisingly, the shares of Townsquare Media increased a modest 5% following the company’s announcement that implied it will exceed third quarter revenue and cash flow expectations. In our view, there likely will be further positive developments into the fourth quarter as well. So, in our view, the answer is no. 

Given the relative under performance thus far, Radio stocks lead as among our favorites for the upcoming quarter. We believe that the stocks do not reflect the prospect for positive revenue and cash flow upside surprise potential, nor the prospect that expectations may be raised for the fourth quarter. Our current favorites include Townsquare Media, Cumulus Media and Salem Media, in that order.

Publishing

The Dinosaurs Just Beat The Market!

The Publishing stocks had a relatively good quarter, up 9.1%, slightly outperforming the general market as measured by the S&P 500 Index. The three largest cap stocks in the index News Corp., New York Times and Tribune Publishing accounted for the gains, with News Corp. and Tribune accounting for the majority of the third quarter out performance, up 18.2% and 16.7%, respectively. Notably, all three companies have significant digital businesses, which have weathered well in the Pandemic given increased digital subscriptions, visitors and engagement. 

Focusing on Tribune, we believe that in spite of the recent rise, the shares are significantly undervalued. Trading at roughly 4.5 times Enterprise Value to our estimated cash flow, we believe that the shares do not reflect the underlying value of its assets, particularly its e-commerce business, BestReviews, nor reflect the positive upside cash flow potential. In spite of recent upward revisions to our estimates, we believe that earlier cost cutting actions at the company are not fully realized. Our third quarter estimate was revised upward, but was at the lower end of the company’s guidance. In addition, we believe that we were conservative in our fourth quarter estimates. 

Given the improved fundamentals, the company is building its cash hoard, estimated to be over $90 million. Given the prospect that the company may sell BestReviews and given its pristine balance sheet, with virtually no debt, the company’s board may reinstate its $0.25 per share quarterly dividend. The dividend was suspended in the second quarter due to concerns over Covid. 

The shares of Tribune (view report) are among our favorite economic recovery plays. Nearly one third of the company’s market cap is reflected in its cash position. Another third of the company’s market cap is reflected in the value of its 60% owned BestReviews business. This leaves only one third of the value of the company reflected in the cash flow generating publishing and digital businesses. Notably, should the company reinstate its dividend, near current levels, the shares would offer an annualized dividend yield of over 7%. We continue to view the TPCO shares as among our favorites. 

Digital/Entertainment

Gaming Sector Receives A Pandemic Tailwind

Video games has been one of the few sectors of the economy to benefit from Covid-19.  Covid-19 lockdowns have boosted user engagement with video games and esports as consumers shelter in place.  The pandemic is accelerating existing trends in the gaming industry.  In April, the first full month of sheltering in place resulted in a 50% sequential increase in gaming hours watched on Twitch, the most popular video game streaming platform.  Viewer engagement numbers for 2Q 2020 (which are not out yet) are expected to reach all-time highs.  According to market research firm NPD Group, 244 million people in the U.S., or three out of every four, play video games, an increase of 32 million people in the last two years alone. 

As millions have been quarantined at home, many have looked to esports for entertainment.  Deloitte’s 2020 digital media trends survey found that, during the crisis, a third of consumers have, for the first time, subscribed to a video gaming service, used a cloud gaming service, or watched esports or a virtual sporting event.  According to Nielsen, while most consumers prefer to play games rather than watch others play,  one-third of esports fans say they watched esports as an alternative to traditional TV content. 

Like many ecommerce or online businesses, the pandemic has pulled forward and accelerated many trends that were already underway.  It will be interesting to see whether these gains can be maintained as people slowly return to work. 

Gaming Sector M&A Heats Up    

The significant increase in time spent streaming games has helped to drive M&A activity in the gaming space to new levels. Noble tracked 14 gaming transactions in the third quarter with a transaction value of $11.7 billion.  Two transactions alone account for $11.2 billion of this total:  Microsoft’s $7.5 billion acquisition of gaming studio/game developer ZeniMax Media, and the $3.5 billion reverse merger between esports platform Skillz and the SPAC Flying Eagle Acquisition Corp. Historically Noble tracks M&A transactions in the internet and digital media sectors and focuses on transactions in North America and Europe. The chart below shows the largest gaming/esports transactions in 3Q 2020 in those respective regions. We should note that the largest number of M&A deals in the sector in 3Q took place in Asia, which is home to the largest gaming audiences. 

Internet & Digital Media M&A Sees Sequential Improvement in 3Q 2020

During the third quarter, Noble tracked 105 M&A transactions in the internet and digital media sector. This represents a 5% sequential improvement over the 100 M&A transactions we tracked in 2Q 2020. Third quarter deal values totaled $28.1 billion, a 118% increase over 2Q 2020 levels, as four deals alone accounted for nearly $25 billion worth of deal value.  The largest deal was Adevinta’s acquisition of eBay Classified Group for $9.2 billion, followed by the gaming deals mentioned earlier (Microsoft’s $7.5 billion acquisition of gaming studio/game developer ZeniMax Media, and Skillz’ $3.5 billion reverse merger with Flying Eagle Acquisition Corp). Blackstone’s $4.7 billion acquisition of information/genealogy company Ancestry.com was the fourth deal of more than $1 billion that we tracked. 

Of the 105 deals we tracked in 3Q 2020, 37 of them were in the digital content category, while the marketing technology sector trailed with 26 deals, followed by the always active advertising agency deals with 23. These three sectors were also the most active sectors in the first and second quarters of 2020. 

The digital content sector had not just the largest number of transactions, but also the largest value of deals in the third quarter, with $22.2 billion of deals, or 79% of the entire deal value of the internet and digital media deals we track. Within the digital content segment, the gaming sector accounted for 14 of the 37 transactions and totaled $11.7 billion in deal value or nearly 53% of total digital content deal value.

Other segments of digital content where M&A was strong includes video focused transactions (6 transactions), publishing (4 transactions) and audio (5 transactions, 4 of which were in the podcast space). Notable video focused deals include CuriosityStream’s $512 million reverse merger with the SPAC Software Acquisition Group, and Enthusiast Gaming’s $34 million acquisition of Omnia Media, a YouTube Video Gaming Network.  Notable digital publishing deals include Red Venture’s $500 million acquisition of CNET Media Group from ViacomCBS.  Notable audio deals include SiriusXM’s $325 million acquisition of podcast network Stitcher from E.W. Scripps; The New York Times’ $25 million acquisition of podcast programmer Serial; and the $70 million acquisition of Rhapsody International from MelodyVR Group. 

Internet and Digital Media Stocks Continued To Rebound

In our 2Q media newsletter we noted that every single stock in the four sectors we monitor was up in the quarter.  While 3Q 2020’s performance was not nearly as strong, all sectors performed well, and three of the four sectors outperformed the S&P 500. In the third quarter the S&P 500 index increased by 8.5%, while Noble’s Adtech Index increased by 26%, Noble’s MarTech Index increased by 19%, Noble’s Social Media Index increased by 16%, and Noble’s Digital Media Index increased by 4%.    

While last quarter saw 5 stocks more than double off their March lows, only one company, Autoweb (AUTO, +143%), posted a more than doubling of their stock price. The stock surged when the company provided a 3Q mid-quarter update that showed that gross margins in July 2020 had nearly doubled from July 2019 levels resulting in positive adjusted EBITDA (versus a loss a year-ago), and provided further evidence of the company’s turnaround. 

Autoweb wasn’t the only adtech stock to perform well during the quarter. E-commerce retailing was hot, driven by stay at home mandates and social distancing. 1800Flowers.com’s (view report) stock increased 144% from March lows in the latest quarter. The company reported that its fiscal fourth quarter end June 30 revenues increased a strong 61%. We believe that e-commerce trends will remain strong even as the pandemic subsides.  Other notable performers included the stocks of Quinstreet (QNST,+51%) and Fluent (FLNT, +39%). It’s interesting to note that all three of the best performing advertising technology companies are lead generation businesses.  As companies re-open their businesses post-pandemic, it’s expected that performance marketing companies will do well as companies focus less on branding and more on generating new business, an imperative for many businesses that have struggled during the pandemic. Several other adtech stocks performed well during the quarter including the stocks of Synacor (SYNC, +34%), Perion Networks (PERI, +34%), The Trade Desk (TTD, +28%) and Interclick Interactive (ICLK, +25%). 

Marketing tech stocks that performed well during the quarter include Salesforce (CRM, +34%), Hubspot (HUBS, +30%), Brightcove (BCOV, +30%), SharpSpring (SHSP, +27%), and LivePerson (LPSN, +26%). As noted in our M&A study, MarTech was one of the most active sectors in M&A during 3Q 2020, but M&A was not a driver of stock price performance.  Strong organic revenue appears to be the sector driver, with revenue growth exceeding 20% on average.

Social media stocks also performed well during the quarter, with our index up 16%. Our index is market cap weighted so it generally performs in-line with how Facebook has performed. Nevertheless, several social media stocks significantly outperformed, including Twitter (TWTR, +49%) and Spark Networks (LOV, +48%). While the stock of Snap Interactive (SNAP, +11%) underperformed its peers during the quarter, it consolidated its gains for the year (+60%) and is the strongest performing social media stock in 2020.

Digital media stocks were the only stock sector to underperform the S&P 500, as shares of Google (GOOG.L) were up only 3%, and Google represents 73% of the market cap of this market-cap weighted sector. Google posted its first year-over-year quarterly revenue decline in the company’s history and like Apple, Amazon and Facebook, is under intense regulatory scrutiny as the Justice Department reviews potential anti-competitive behavior among big tech companies. Despite Google weighing on the sector, several digital media stocks performed well including The Leaf Group (LEAF, +37%), The Maven (MVEN, +37%), Travelzoo (TZOO, +14%) and Netflix (NFLX, +10%). We encourage investors to focus on the advertising recovery in the travel industry and the unique way to play the space with Travelzoo (view report), among our favorites. 

GENERAL DISCLAIMERS

All statements or opinions contained herein that include the words “we”, “us”, or “our” are solely the responsibility of Noble Capital Markets, Inc.(“Noble”) and do not necessarily reflect statements or opinions expressed by any person or party affiliated with the company mentioned in this report. Any opinions expressed herein are subject to change without notice. All information provided herein is based on public and non-public information believed to be accurate and reliable, but is not necessarily complete and cannot be guaranteed. No judgment is hereby expressed or should be implied as to the suitability of any security described herein for any specific investor or any specific investment portfolio. The decision to undertake any investment regarding the security mentioned herein should be made by each reader of this publication based on its own appraisal of the implications and risks of such decision.

This publication is intended for information purposes only and shall not constitute an offer to buy/sell or the solicitation of an offer to buy/sell any security mentioned in this report, nor shall there be any sale of the security herein in any state or domicile in which said offer, solicitation or sale would be unlawful prior to registration or qualification under the securities laws of any such state or domicile. This publication and all information, comments, statements or opinions contained or expressed herein are applicable only as of the date of this publication and subject to change without prior notice. Past performance is not indicative of future results. Noble accepts no liability for loss arising from the use of the material in this report, except that this exclusion of liability does not apply to the extent that such liability arises under specific statutes or regulations applicable to Noble. This report is not to be relied upon as a substitute for the exercising of independent judgement. Noble may have published, and may in the future publish, other research reports that are inconsistent with, and reach different conclusions from, the information provided in this report. Noble is under no obligation to bring to the attention of any recipient of this report, any past or future reports. Investors should only consider this report as single factor in making an investment decision.

IMPORTANT DISCLOSURES

This publication is confidential for the information of the addressee only and may not be reproduced in whole or in part, copies circulated, or discussed to another party, without the written consent of Noble Capital Markets, Inc. (“Noble”). Noble seeks to update its research as appropriate, but may be unable to do so based upon various regulatory constraints. Research reports are not published at regular intervals; publication times and dates are based upon the analyst’s judgement. Noble professionals including traders, salespeople and investment bankers may provide written or oral market commentary, or discuss trading strategies to Noble clients and the Noble proprietary trading desk that reflect opinions that are contrary to the opinions expressed in this research report.
The majority of companies that Noble follows are emerging growth companies. Securities in these companies involve a higher degree of risk and more volatility than the securities of more established companies. The securities discussed in Noble research reports may not be suitable for some investors and as such, investors must take extra care and make their own determination of the appropriateness of an investment based upon risk tolerance, investment objectives and financial status.

Company Specific Disclosures

The following disclosures relate to relationships between Noble and the company (the “Company”) covered by the Noble Research Division and referred to in this research report.
Noble is not a market maker in any of the companies mentioned in this report. Noble intends to seek compensation for investment banking services and non-investment banking services (securities and non-securities related) with any or all of the companies mentioned in this report within the next 3 months

ANALYST CREDENTIALS, PROFESSIONAL DESIGNATIONS, AND EXPERIENCE

Senior Equity Analyst focusing on Basic Materials & Mining. 20 years of experience in equity research. BA in Business Administration from Westminster College. MBA with a Finance concentration from the University of Missouri. MA in International Affairs from Washington University in St. Louis.
Named WSJ ‘Best on the Street’ Analyst and Forbes/StarMine’s “Best Brokerage Analyst.”
FINRA licenses 7, 24, 63, 87

WARNING

This report is intended to provide general securities advice, and does not purport to make any recommendation that any securities transaction is appropriate for any recipient particular investment objectives, financial situation or particular needs. Prior to making any investment decision, recipients should assess, or seek advice from their advisors, on whether any relevant part of this report is appropriate to their individual circumstances. If a recipient was referred to Noble Capital Markets, Inc. by an investment advisor, that advisor may receive a benefit in respect of
transactions effected on the recipients behalf, details of which will be available on request in regard to a transaction that involves a personalized securities recommendation. Additional risks associated with the security mentioned in this report that might impede achievement of the target can be found in its initial report issued by Noble Capital Markets, Inc.. This report may not be reproduced, distributed or published for any purpose unless authorized by Noble Capital Markets, Inc..

RESEARCH ANALYST CERTIFICATION

Independence Of View
All views expressed in this report accurately reflect my personal views about the subject securities or issuers.

Receipt of Compensation
No part of my compensation was, is, or will be directly or indirectly related to any specific recommendations or views expressed in the public
appearance and/or research report.

Ownership and Material Conflicts of Interest
Neither I nor anybody in my household has a financial interest in the securities of the subject company or any other company mentioned in this report.

NOBLE RATINGS DEFINITIONS % OF SECURITIES COVERED % IB CLIENTS
Outperform: potential return is >15% above the current price 88% 41%
Market Perform: potential return is -15% to 15% of the current price 12% 5%
Underperform: potential return is >15% below the current price 0% 0%

NOTE: On August 20, 2018, Noble Capital Markets, Inc. changed the terminology of its ratings (as shown above) from “Buy” to “Outperform”, from “Hold” to “Market Perform” and from “Sell” to “Underperform.” The percentage relationships, as compared to current price (definitions), have remained the same. Additional information is available upon request. Any recipient of this report that wishes further information regarding the subject company or the disclosure information mentioned herein, should contact Noble Capital Markets, Inc. by mail or phone.

Noble Capital Markets, Inc.
225 NE Mizner Blvd. Suite 150
Boca Raton, FL 33432
561-994-1191

Noble Capital Markets, Inc. is a FINRA (Financial Industry Regulatory Authority) registered broker/dealer.
Noble Capital Markets, Inc. is an MSRB (Municipal Securities Rulemaking Board) registered broker/dealer.
Member – SIPC (Securities Investor Protection Corporation)
Report ID: 11744

Is there a Perfect Stock Price?


Splits, Ticks, and Stock Value


During August, when Tesla and Apple had both scheduled stock splits, there was a great deal of online discussion around how the value of these two companies would be impacted. It also opened an opportunity for smaller self-directed investors who want more diversification than they could accomplish with share prices between $500 and $2,000 to wave in a few shares. These investors could be more prudent with their exposure to the companies that have been relentless highflyers – favorites that had been out of reach.

Stock splits, at a minimum, serve to place ownership in more hands of more investors. Broad diversity of ownership is desirable for management and boards who prefer to have their ownership less concentrated; it allows them more autonomy to manage. But, what does it do for the stock price for buyers? On the surface, a stock split doesn’t change the fundamentals of the equity in the hands of the public; does it impact shareholder value? Are trading desks enriched or hurt?

Splits Help Stocks Trade Higher

A company stock split changes how their stocks trade. A lower per-share price expands the pool of interested investors; more demand puts upward pressure on price and improves returns. Increased valuations may then feed increased interest driving the performance even higher. As explained by Poe Fratt, Senior Equity Analyst at Noble Capital Markets, “Investors often regard stock splits as positive even though the market capitalization and valuation of the company don’t change. The perception that stock splits are positive probably emanates from the fact that a stock split generally follows a period of strong stock price performance.” Mr. Fratt continued, “While the valuation doesn’t change, there is a belief that a stock price in the $25-$100/share range enhances trading liquidity and makes the stock more attractive to retail investors.” With retail investors now making up more than 25% of stockholders, the inclusion of the “little guy” puts upward pressure on performance.

On average, it shows up in the stock price over the next 12 months. Large-cap stocks outperform the market after a split by 5% during that year. Companies of all sizes outperform after announcing a split by 2.5%. Academic research confirms that liquidity improvements following stock splits reduced average companies’ cost of equity capital by 17.3% or 2.4 percentage-points per-annum. The benefit, on average, is a material boost to both issuers and investors.


On average, split stocks do outperform the market as soon as the split is announced and even more over the next 12 months.


Trading for Investors Becomes Less Expensive

The cost of transacting in a name is increased by:

  • Spread The percentage difference between bids and offers.
  • Liquidity The average daily value traded, which limits how much value can be easily transacted in a day.
  • Volatility The risks of losses for market makers providing liquidity, low volatility helps to keep spreads tighter.


The Costs of Trading in a name mostly improve.


Looking at these metrics for stock-splits from 2012-Q1 2020, they show that on average:

  • Spreads- improved by 22%, with 89% of stocks seeing better spreads.
  • Liquidity- Value traded increased by 18%, with 70% of stocks seeing better liquidity.
  • Intraday Volatility- reduced by 3%, with 66% of stocks seeing lower volatility.


These changes all contribute to lower trading costs. A decline in costs increases returns, which then improve valuations.

Tradability and Stock Price

All publicly-traded stocks in the U.S. transact under a very similar set of rules. The rules impact different per-share prices differently.  Two rules that impact ease of trading that have recently been softened by technology still have an effect on the overall cost of getting in and out of a position. They are tick sizes and round lots. Low dollar-priced stocks have ticks that make spreads wider on a percent of share price levels. That increases lengths of time waiting to trade and cost to trade. Simply put, their spreads are necessarily wider. Higher dollar-priced stocks have too many ticks and a larger cost round lot. The higher the number of ticks the easier to jump queues. Their spreads are wide because trading is difficult. The high priced round lot makes it expensive to post bids and offers cheaply. There is a sweet spot. Someplace in between is a price level where the tick more closely represents an ideal tradeoff for immediacy of transacting. The “in-between” stocks trade with the lowest spread costs.


Wide spreads deter professional portfolio managers that are measured against benchmarks where slippage is not factored in. A wide spread could deter these investors from larger positions. That reduces interest, and the lower demand weighs on price.

The One-Cent Tick Issue

The smallest increment of U.S. currency is $0.01 or one cent. For example, you can bid $5.01 or $5.02, but not in between. This is part of the problem with tick size versus stock price. The one-cent-tick represents a very different cost for a $5 stock (20bps) than a $500 stock (0.2bps).

For low priced stocks, these spreads can be “expensive” for investors to cross. There needs to be confidence that the potential for an increase is high. This slows down the trading queue and liquidity of the shares.

The one-cent tick also distorts trading in higher-priced stocks. High priced stocks have more tick gradations and more odd-lots, even if the market depth is the same.


The example above compares a $1,000 and a $100 stock with identical liquidity profiles. The top chart shows that ticks on a $1,000 stock are worth just 0.001%. Even the most liquid companies in the U.S. markets have a spread closer to 0.01%. More increments reduce the cost of new buyers jumping in front of (pennying) buyers already in line. This impacts the initial bidder who may miss being filled. At the same time, it doesn’t really improve the price for those selling.

Round Lot Issues

Using the top chart above, once again, we can see an issue with the convention of trading stocks in increments of 100 (round lot). Historically trading in round lots was designed to reduce paperwork on settlement and to ensure that benchmark spread prices reflected a meaningful trade value. Because of this almost outdated convention, odd lots aren’t treated the same way as round lots. The prices quoted to the public are round lot prices. They set the official spread that institutional investors use to calculate trading costs, and they are “protected,” which means traders cannot skip over them to trade elsewhere (including off-exchange).

Round lots can widen spreads. The chart above shows the value of a round lot increases as prices increase. According to Nasdaq research (the V-shape above) is the same regardless of tick size. However, when the stock in the upper chart is split 10:1, the 50-share ($50,000) odd lots become round lots, this instantly adds size to the official quote and cuts the spread for the $100 stock in the lower chart in half. So, with larger increments and smaller round lots, an investor looking to outbid those in the queue now has a more difficult time with the tighter spread.

Regulators are Aware of the High Price Issues

Investors have weighed in about issues trading high priced stocks and are looking to alleviate some of the issues. The SIP committee, responsible the consolidated tape, has proposed adding odd lots to the tape. That fixes the round lot issue but may create a best execution issue if very few shares are indicating the benchmark price. The SEC has proposed changing round lot sizes. This partially helps issues in the round lot quagmire, but while trying to avoid the best execution measurement issues, it removes some investor protections by allowing trade throughs. In Europe, regulators have eliminated round lots and also changed tick sizes.

Stocks are Pricier Than Before

From 1930 until as recently as 2007 nominal prices of common stocks have remained constant at around $30-$40 per share as a result of firms splitting their stocks. Stock splits were so normal that prices held in a consistent range. Before 2007 it was rare for the S&P500 to have more than a few stocks over $100. Now there are more than 100 (approx. a quarter of the index).


Number of Stock Splits by S&P 500 Companies


It would be easier for traders if stocks traded more uniformly with roughly the same prices. Instead, fewer stock splits have allowed higher stock prices since the financial collapse of 2008. This is a relatively new characteristic of the market.

Some of the blame is placed on Reg NMS which were trading rules instituted in 2007 to help make markets more readily electronic and interconnected. The rule included decimalization (not fractions), which cleared the way for low one-cent ticks. Now, a significant number of stocks have reached well past the level where they are constrained by a one-cent tick. The result is a larger proportion of trading is happening away from listed prices. Price discovery may also be dampened by the lack of visibility widening spreads.

Take-Away

Stock splits fundamentally improve tradability and that boosts share price. Tradability and its connection to trading costs help clear the way for these better valuations. The market’s positive reaction to a stock split announcement confirms that traders know costs matter to longer-term price. It also, according to Mark Reichmann, Senior Equity Analyst at Noble Capital Markets “… signals to the market that management is confident in its operations.”

Statistics demonstrate that many IPOs get priced around $20 to $40 per share. This shows that bankers taking companies public intentionally choose an effective stock price level. But the sweet-spot, where ticks are neither too wide or too narrow, is different for every company. Regulators are beginning to address investor concerns as stock splits have become far less common over the past dozen years. Some of the issues of higher prices are helped by the new trend of brokers offering fractional shares. This ability compounds many other issues–but that’s a topic for another article.

Paul Hoffman

Managing Editor, Channelchek


Suggested Reading:

Why do Small-Cap Stocks Outperform After a Major Election

Investment Barriers Once
Seen as Insurmountable are Falling Fast

Trading Technology Continues to Level the Playing Field for Investors


Each event in our popular Virtual Road Shows Series has maximum capacity of 100 investors online. To take part, listen to and perhaps get your questions answered, see which virtual investor meeting intrigues you here.


Sources:

Stock Split Calendar

Three Charts That Show a Dramatic Drop in Stock Splits

Three Compelling Reasons for Companies to Split Stocks

PSU.EDU Academic Research

Why Intelligent Ticks Make Sense

Looking for the perfect Stock Price

Volume and Implications for Access

The Nominal Price Puzzle

Ely Gold Royalties (ELYGF)(ELY:CA) – Executes Option Agreement to Sell Aurora West Property to Goldcliff Resources

Friday, October 09, 2020

Ely Gold Royalties (ELYGF)(ELY:CA)

Executes Option Agreement to Sell Aurora West Property to Goldcliff Resources

As of April 24, 2020, Noble Capital Markets research on Ely Gold Royalties is published under ticker symbols (ELYGF and ELY:CA). The price target is in USD and based on ticker symbol ELYGF. Research reports dated prior to April 24, 2020 may not follow these guidelines and could account for a variance in the price target. Ely Gold Royalties Inc is an emerging royalty company with producing and development assets focused in Nevada and the Western US. It offers shareholders a low-risk leverage to the current price of gold and low-cost access to long-term gold royalties.

Mark Reichman, Senior Research Analyst of Natural Resources, Noble Capital Markets, Inc.

Refer to the full report for the price target, fundamental analysis, and rating.

    Option agreement to sell Aurora West. Ely Gold Royalties, through its Nevada Select subsidiary, executed an option agreement for Goldcliff Resource Corporation (OTCBB, GCFFF, Not Rated) to acquire the Aurora West Property located in Mineral County, Nevada. Ely will retain a 2% net smelter return (NSR) royalty. Nevada Select is currently optioning the property from a third-party private company. Aurora West includes 51 claims and is contiguous with claims held by Hecla Mining Company (NYSE, HL, Not Rated).

    Terms of the transaction.  Goldcliff will acquire the property for US$425 thousand, including the following payments: 1) US$25 thousand to Nevada Select at closing; 2) US$50 thousand to the private company on September 23, 2021; 3) US$135 thousand to the private company on September 23, 2022 at which point Nevada Select will take possession of the Aurora West Property; 4) US$200 thousand to Nevada …


This Company Sponsored Research is provided by Noble Capital Markets, Inc., a FINRA and S.E.C. registered broker-dealer (B/D).

*Analyst certification and important disclosures included in the full report. NOTE: investment decisions should not be based upon the content of this research summary.  Proper due diligence is required before making any investment decision.