Thursday, July 9, 2020
Energy Industry Report
Exploration and Production Second Quarter Review and Outlook
Michael Heim, CFA, Senior Research Analyst, Noble Capital Markets, Inc.
Listen To The Analyst
Refer to end of report for Analyst Certification & Disclosures
- Oil and Gas Prices rebounds after hitting record lows. Oil spot prices even went negative after COVID- 19 killed demand and Saudi Arabia and Russia began a price war. Current prices rebounded to finish the quarter near $40. Natural gas prices fell to $1.58, a level not seen since December 1998, before rising to finish the quarter at $1.67.
- Energy stocks reported a strong quarter rising 33%. The strength largely reflects a rebound in the overall market. The XLE Energy Index remains down 40% year to date.
- The outlook has improved but remains dark given COVID-19 reemergence concerns and a shaky OPEC truce. Low-cost producers will generate positive cash flow if oil remains above $40, but high-cost producers are not out of the woods yet.
- We recommend investors remain cautious and focus on low-cost producers with limited debt.
Energy Prices
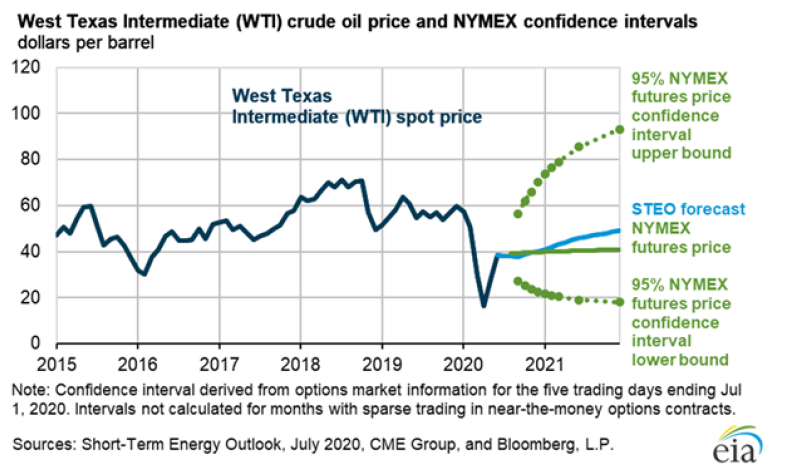
When you hit bottom, there is nowhere to go but up. Oil prices crashed in April following the spread of COVID-19 and a price war between Saudi Arabia and Russia. Spot prices even traded as low as negative $37 per barrel. The concept of investors paying another investor to take oil off their hands is perhaps bizarre, explainable when viewed only as a short-term issue of speculators being caught with contracts in their hands and nowhere to dump the contracts with storage fields full. Nevertheless, longer-term contracts followed spot prices downward, if not into the negative range. Oil future contracts going out a month or two fell from prices in the thirties per barrel into prices around $20 per barrel. As expected, the sharp drop in pricing lead to an immediate response. Domestic producers all but eliminated new drilling and Saudi Arabia, Russia and other allies made up (kind of) and agreed to cut supply by 10% through the end of July. Whether the cuts last remains to be seen as there are already reports that several OPEC members are not adhering to reductions. However, current WTI and Brent oil prices, both near $40 per barrel, provide energy companies a lifeline they didn’t have three months ago.
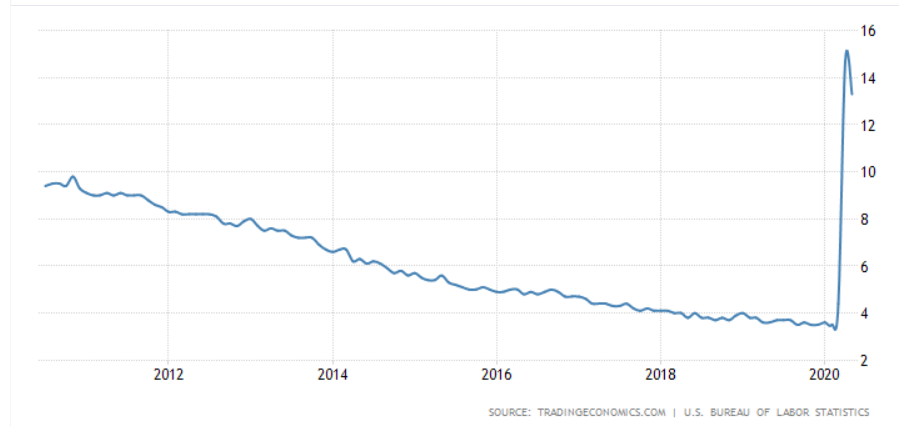
Natural Gas prices fell, albeit not as much as oil prices. Spot prices began the quarter around $1.75 per thousand cubic feet (mcf) and fell as low as $1.38 per mcf, the lowest level in nominal dollars since December 1998. Inventories remain high following a mild winter and demand remains low due to the shut down of the economy. Liquified Natural Gas (LNG) terminals are reporting a decrease in gas exports and the pace of development of new projects is slipping. Production levels are holding steady even as natural gas rig count has decreased.
Energy Stocks
Energy stocks, as measured by the XLE Energy Index, rose 33% in the second quarter. The strong performance generally tracked the rise in oil prices with most of the gain coming at the end of the quarter. Truth be told, however, the gain is primarily due to an improvement in the overall market and not a rise in energy prices. The S&P 500 Composite index rose 26% during the quarter. Both indices were down sharply in the first quarter and the strong performance in the second quarter merely reflects a rebound from the first quarter. Year to date, the XLE is still down some 40%.
Outlook
The return to oil prices in the forties was welcome news to leveraged energy companies facing negative cash flow and an inability to meet financial obligations. At prices in the forties, companies with a low-cost basis should generate positive cash flow. That said, marginal wells will most likely not be drilled. Of particular interest is whether or not these companies will lock in modest gains by hedging out production. Or, will they view these returns as inadequate to compensate owners for the risks they are taking and continue to roll the dice on the hopes of higher prices? In the end, the outlook for energy prices and energy company stocks has not changed. The outlook will depend on the pace of recovery of global economic conditions and the will of OPEC plus to hold the line on pricing.
Recommendations
We believe investors should continue to be wary regarding energy stocks. Investors would be wise to focus energy investment towards companies with little to no debt. A large hedge position may provide a lifeline. Low lifting costs per barrel remain important. A supportive ownership group with a long investment timeframe is also important. That said, there are compelling values within the group now that individual stock prices have fallen. We continue to believe energy prices will eventually return to higher levels with a return to more normal economic conditions and a supply response by domestic producers. We have adjusted our long-term oil and gas price assumption to $50/bbl and $2.50/mcf respectively, although we believe it may be several years before we reach those levels. Our individual stock net asset values and price targets are based off of our long-term energy price assumptions.
GENERAL DISCLAIMERS
All statements or opinions contained herein that include the words “we”, “us”, or “our” are solely the responsibility of Noble Capital Markets, Inc.(“Noble”) and do not necessarily reflect statements or opinions expressed by any person or party affiliated with the company mentioned in this report. Any opinions expressed herein are subject to change without notice. All information provided herein is based on public and non-public information believed to be accurate and reliable, but is not necessarily complete and cannot be guaranteed. No judgment is hereby expressed or should be implied as to the suitability of any security described herein for any specific investor or any specific investment portfolio. The decision to undertake any investment regarding the security mentioned herein should be made by each reader of this publication based on its own appraisal of the implications and risks of such decision.
This publication is intended for information purposes only and shall not constitute an offer to buy/sell or the solicitation of an offer to buy/sell any security mentioned in this report, nor shall there be any sale of the security herein in any state or domicile in which said offer, solicitation or sale would be unlawful prior to registration or qualification under the securities laws of any such state or domicile. This publication and all information, comments, statements or opinions contained or expressed herein are applicable only as of the date of this publication and subject to change without prior notice. Past performance is not indicative of future results. Noble accepts no liability for loss arising from the use of the material in this report, except that this exclusion of liability does not apply to the extent that such liability arises under specific statutes or regulations applicable to Noble. This report is not to be relied upon as a substitute for the exercising of independent judgement. Noble may have published, and may in the future publish, other research reports that are inconsistent with, and reach different conclusions from, the information provided in this report. Noble is under no obligation to bring to the attention of any recipient of this report, any past or future reports. Investors should only consider this report as single factor in making an investment decision.
IMPORTANT DISCLOSURES
This publication is confidential for the information of the addressee only and may not be reproduced in whole or in part, copies circulated, or discussed to another party, without the written consent of Noble Capital Markets, Inc. (“Noble”). Noble seeks to update its research as appropriate, but may be unable to do so based upon various regulatory constraints. Research reports are not published at regular intervals; publication times and dates are based upon the analyst’s judgement. Noble professionals including traders, salespeople and investment bankers may provide written or oral market commentary, or discuss trading strategies to Noble clients and the Noble proprietary trading desk that reflect opinions that are contrary to the opinions expressed in this research report.
The majority of companies that Noble follows are emerging growth companies. Securities in these companies involve a higher degree of risk and more volatility than the securities of more established companies. The securities discussed in Noble research reports may not be suitable for some investors and as such, investors must take extra care and make their own determination of the appropriateness of an investment based upon risk tolerance, investment objectives and financial status.
Company Specific Disclosures
The following disclosures relate to relationships between Noble and the company (the “Company”) covered by the Noble Research Division and referred to in this research report.
Noble is not a market maker in any of the companies mentioned in this report. Noble intends to seek compensation for investment banking services and non-investment banking services (securities and non-securities related) with any or all of the companies mentioned in this report within the next 3 months
ANALYST CREDENTIALS, PROFESSIONAL DESIGNATIONS, AND EXPERIENCE
Senior Equity Analyst focusing on Basic Materials & Mining. 20 years of experience in equity research. BA in Business Administration from Westminster College. MBA with a Finance concentration from the University of Missouri. MA in International Affairs from Washington University in St. Louis.
Named WSJ ‘Best on the Street’ Analyst and Forbes/StarMine’s “Best Brokerage Analyst.”
FINRA licenses 7, 24, 63, 87
WARNING
This report is intended to provide general securities advice, and does not purport to make any recommendation that any securities transaction is appropriate for any recipient particular investment objectives, financial situation or particular needs. Prior to making any investment decision, recipients should assess, or seek advice from their advisors, on whether any relevant part of this report is appropriate to their individual circumstances. If a recipient was referred to Noble Capital Markets, Inc. by an investment advisor, that advisor may receive a benefit in respect of
transactions effected on the recipients behalf, details of which will be available on request in regard to a transaction that involves a personalized securities recommendation. Additional risks associated with the security mentioned in this report that might impede achievement of the target can be found in its initial report issued by Noble Capital Markets, Inc.. This report may not be reproduced, distributed or published for any purpose unless authorized by Noble Capital Markets, Inc..
RESEARCH ANALYST CERTIFICATION
Independence Of View
All views expressed in this report accurately reflect my personal views about the subject securities or issuers.
Receipt of Compensation
No part of my compensation was, is, or will be directly or indirectly related to any specific recommendations or views expressed in the public
appearance and/or research report.
Ownership and Material Conflicts of Interest
Neither I nor anybody in my household has a financial interest in the securities of the subject company or any other company mentioned in this report.
| NOBLE RATINGS DEFINITIONS |
% OF SECURITIES COVERED |
% IB CLIENTS |
| Outperform: potential return is >15% above the current price |
88% |
43% |
| Market Perform: potential return is -15% to 15% of the current price |
12% |
3% |
| Underperform: potential return is >15% below the current price |
0% |
0% |
NOTE: On August 20, 2018, Noble Capital Markets, Inc. changed the terminology of its ratings (as shown above) from “Buy” to “Outperform”, from “Hold” to “Market Perform” and from “Sell” to “Underperform.” The percentage relationships, as compared to current price (definitions), have remained the same. Additional information is available upon request. Any recipient of this report that wishes further information regarding the subject company or the disclosure information mentioned herein, should contact Noble Capital Markets, Inc. by mail or phone.
Noble Capital Markets, Inc.
225 NE Mizner Blvd. Suite 150
Boca Raton, FL 33432
561-994-1191
Noble Capital Markets, Inc. is a FINRA (Financial Industry Regulatory Authority) registered broker/dealer.
Noble Capital Markets, Inc. is an MSRB (Municipal Securities Rulemaking Board) registered broker/dealer.
Member – SIPC (Securities Investor Protection Corporation)
Report ID: 11365